republic of panama fiscal performance third quarter 2016 · pdf filerepublic of panama fiscal...
TRANSCRIPT

Republic of Panama
Fiscal Performance
Third Quarter 2016
Dulcidio De La GuardiaMinister of Economy and Finance
Iván ZarakVice Minister of Economy
Eyda Varela de ChinchillaVice Minister of Finance
January 2017

Contents:
Macroeconomic Overview
2
Fiscal Performance
Debt Profile
Future Prospects
Final Remarks
1
2
3
4
5

Contents:
Macroeconomic Overview
3
Fiscal Performance
Debt Profile
Future Prospects
Final Remarks
1
2
3
4
5

Panama continues to be one of the top performers of the region with a forecasted GDP growth for 2016 of 5.2% according to the IMF.
4
Economic Indicators
Foreign Direct Investment
Macroeconomic Overview1
-1.1%
1.3%
8.5%
12.1%
8.6%
1.6%
5.8%
11.8%
9.2%
6.6% 6.1% 5.8% 5.2%5.9%
3.1% 3.4%
Latam Panama World
Projected GDP growth for 2016 and 2017 remains positive despite global economic conditions.
Inflation levels are slowly rising, but still remain low due to oil prices and the strength of the dollar.
Source: IMF(F): forecasted
20%
18%
12%12%
8%
8%
5%
5%
4%
3% 3% 3%
Trade Construction
Real Estate and Business Services Communications and Transport
Other Other Non Market Production
Manufacturing Financial Intermediation
Hotels and Restaurants Electricity and Water
Investment Ratings
Agency Rating Outlook
Moody´s Baa2 Stable
Fitch BBB Stable
S&P BBB Stable
Source: INEC
Diversified economy: no sector accounts for more than 20% of GDP.
Investment Grade and Dollarized Economy
Logistics Hub and Tourism Industry
Competitive Advantages: Panama
Canal
Steadily Growing Financial Sector
Other Strengths:
Source: INEC
3.22.1
4.2
8.8
2.4
3.5
5.9 5.7
4.02.6
0.1 0.5
GDP by sector, as of September 2016 GDP Growth (%)
Inflation (%)

The path to fiscal consolidation is supported by improvements in tax collection, focused government expenditures, a Social Fiscal Responsibility Law with well-established limits, and a declining current account deficit.
5
Economic Indicators
Foreign Direct Investment
Macroeconomic Overview1
NFPS Cash Deficit is within the limits of the Social Fiscal Responsibility Law.The completion of large infrastructure projects contributed to a small increase in the openunemployment ratio, but will generate more growth in other sectors of the economy.
The increase in government revenues is due in part to improvements in taxcollection.
2.4
3.2
2.3
1.7
2013 2014 2015 3Q-2016
NFPS Cash Deficit (% of GDP) Open Unemployment (% of economically active population)
The debt-to-GDP ratio shows the path of the Central Government deficit.
Source: MEF, INEC, Office of Economic & Social Analysis.
Debt in US$ million and as a percentage of GDPGovernment Revenues (US$ million)
10,225 10,656
7,586 8,236
4,999 5,037 3,712 4,048
2014 2015 3Q-2015 3Q-2016
NFPS Total Tax Revenues
6.7
4.74.2
5.24.7
2.9 3.0 3.13.5 3.8
4.4
9,317 9,344 8,999 9,611 10,404 11,602
13,022 14,45016,945
18,99720,308
54%47%
37% 36% 36%
34% 33% 32% 34% 36% 37%
0%
10%
20%
30%
40%
50%
60%
0
5,000
10,000
15,000
20,000
25,000
Net Debt Net Debt/GDP
6
Economic Indicators
Foreign Direct Investment
Macroeconomic Overview1
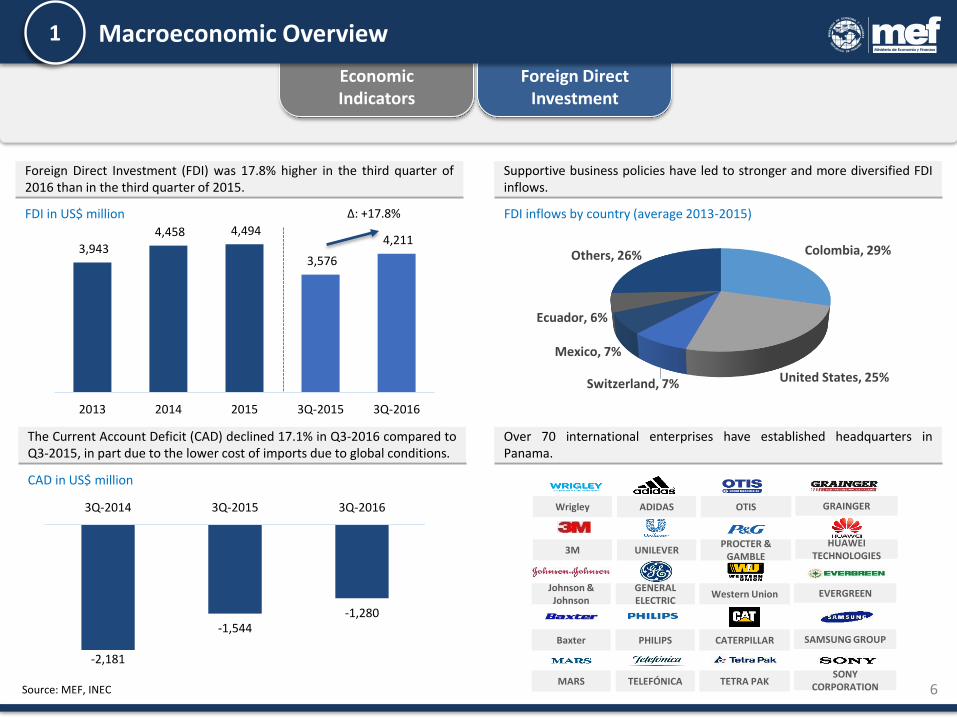
3,943
4,458 4,494
3,576
4,211
2013 2014 2015 3Q-2015 3Q-2016
∆: +17.8%
-2,181
-1,544-1,280
3Q-2014 3Q-2015 3Q-2016
Foreign Direct Investment (FDI) was 17.8% higher in the third quarter of2016 than in the third quarter of 2015.
The Current Account Deficit (CAD) declined 17.1% in Q3-2016 compared toQ3-2015, in part due to the lower cost of imports due to global conditions.
Colombia, 29%
United States, 25%Switzerland, 7%
Mexico, 7%
Ecuador, 6%
Others, 26%
OTIS
PROCTER & GAMBLE
Western Union
CATERPILLAR
TETRA PAK
GRAINGER
HUAWEI TECHNOLOGIES
Wrigley
PHILIPS
ADIDAS
UNILEVER
EVERGREENGENERAL ELECTRIC
SAMSUNG GROUP
SONY CORPORATION
3M
TELEFÓNICA
Baxter
MARS
Johnson & Johnson
Supportive business policies have led to stronger and more diversified FDIinflows.
FDI inflows by country (average 2013-2015)
CAD in US$ million
FDI in US$ million
Source: MEF, INEC
Over 70 international enterprises have established headquarters inPanama.

Contents:
Macroeconomic Overview
7
Fiscal Performance
Debt Profile
Future Prospects
Final Remarks
1
2
3
4
5
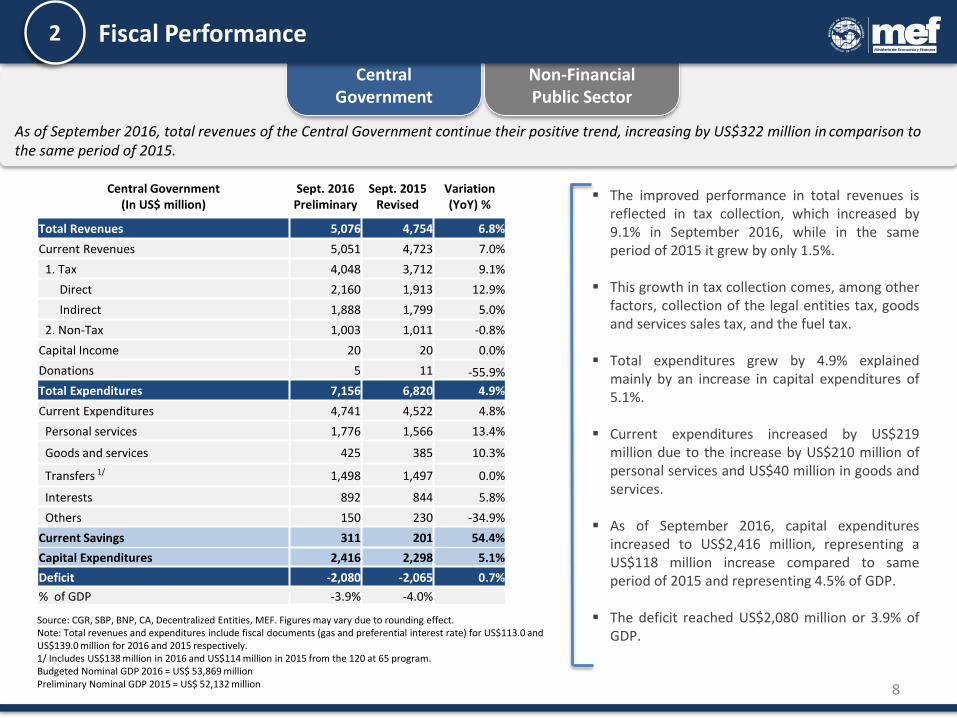
As of September 2016, total revenues of the Central Government continue their positive trend, increasing by US$322 million in comparison to the same period of 2015.
8
Source: CGR, SBP, BNP, CA, Decentralized Entities, MEF. Figures may vary due to rounding effect.Note: Total revenues and expenditures include fiscal documents (gas and preferential interest rate) for US$113.0 and US$139.0 million for 2016 and 2015 respectively.1/ Includes US$138 million in 2016 and US$114 million in 2015 from the 120 at 65 program.Budgeted Nominal GDP 2016 = US$ 53,869 millionPreliminary Nominal GDP 2015 = US$ 52,132 million
The improved performance in total revenues isreflected in tax collection, which increased by9.1% in September 2016, while in the sameperiod of 2015 it grew by only 1.5%.
This growth in tax collection comes, among otherfactors, collection of the legal entities tax, goodsand services sales tax, and the fuel tax.
Total expenditures grew by 4.9% explainedmainly by an increase in capital expenditures of5.1%.
Current expenditures increased by US$219million due to the increase by US$210 million ofpersonal services and US$40 million in goods andservices.
As of September 2016, capital expendituresincreased to US$2,416 million, representing aUS$118 million increase compared to sameperiod of 2015 and representing 4.5% of GDP.
The deficit reached US$2,080 million or 3.9% ofGDP.
Central Government (In US$ million)
Sept. 2016Preliminary
Sept. 2015Revised
Variation (YoY) %
Total Revenues 5,076 4,754 6.8%
Current Revenues 5,051 4,723 7.0%
1. Tax 4,048 3,712 9.1%
Direct 2,160 1,913 12.9%
Indirect 1,888 1,799 5.0%
2. Non-Tax 1,003 1,011 -0.8%
Capital Income 20 20 0.0%
Donations 5 11 -55.9%
Total Expenditures 7,156 6,820 4.9%
Current Expenditures 4,741 4,522 4.8%
Personal services 1,776 1,566 13.4%
Goods and services 425 385 10.3%
Transfers 1/ 1,498 1,497 0.0%
Interests 892 844 5.8%
Others 150 230 -34.9%
Current Savings 311 201 54.4%
Capital Expenditures 2,416 2,298 5.1%
Deficit -2,080 -2,065 0.7%
% of GDP -3.9% -4.0%
Central Government
Non-Financial Public Sector
Fiscal Performance2
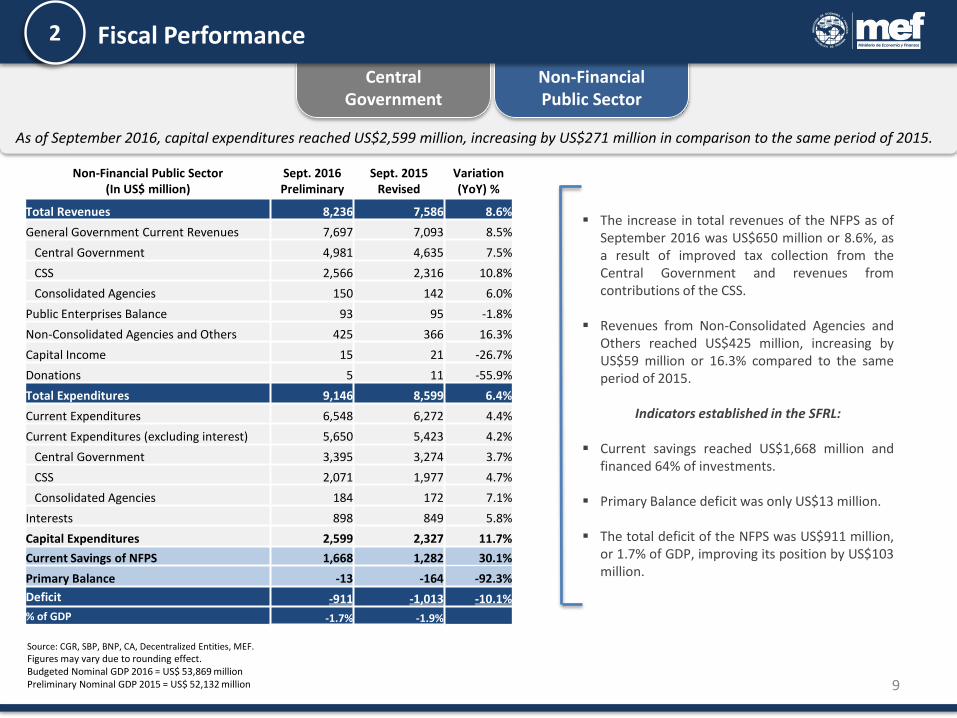
As of September 2016, capital expenditures reached US$2,599 million, increasing by US$271 million in comparison to the same period of 2015.
9
The increase in total revenues of the NFPS as ofSeptember 2016 was US$650 million or 8.6%, asa result of improved tax collection from theCentral Government and revenues fromcontributions of the CSS.
Revenues from Non-Consolidated Agencies andOthers reached US$425 million, increasing byUS$59 million or 16.3% compared to the sameperiod of 2015.
Indicators established in the SFRL:
Current savings reached US$1,668 million andfinanced 64% of investments.
Primary Balance deficit was only US$13 million.
The total deficit of the NFPS was US$911 million,or 1.7% of GDP, improving its position by US$103million.
Source: CGR, SBP, BNP, CA, Decentralized Entities, MEF.Figures may vary due to rounding effect.Budgeted Nominal GDP 2016 = US$ 53,869 millionPreliminary Nominal GDP 2015 = US$ 52,132 million
Non-Financial Public Sector(In US$ million)
Sept. 2016Preliminary
Sept. 2015Revised
Variation (YoY) %
Total Revenues 8,236 7,586 8.6%
General Government Current Revenues 7,697 7,093 8.5%
Central Government 4,981 4,635 7.5%
CSS 2,566 2,316 10.8%
Consolidated Agencies 150 142 6.0%
Public Enterprises Balance 93 95 -1.8%
Non-Consolidated Agencies and Others 425 366 16.3%
Capital Income 15 21 -26.7%
Donations 5 11 -55.9%
Total Expenditures 9,146 8,599 6.4%
Current Expenditures 6,548 6,272 4.4%
Current Expenditures (excluding interest) 5,650 5,423 4.2%
Central Government 3,395 3,274 3.7%
CSS 2,071 1,977 4.7%
Consolidated Agencies 184 172 7.1%
Interests 898 849 5.8%
Capital Expenditures 2,599 2,327 11.7%
Current Savings of NFPS 1,668 1,282 30.1%
Primary Balance -13 -164 -92.3%
Deficit -911 -1,013 -10.1%
% of GDP -1.7% -1.9%
Central Government
Non-Financial Public Sector
Fiscal Performance2

Contents:
Macroeconomic Overview
10
Fiscal Performance
Debt Profile
Future Prospects
Final Remarks
1
2
3
4
5

11
Portfolio Composition
Risk Profile
CapitalMarkets
Debt Profile3
77%
22%1%
External Debt
DomesticCapital Market
Other InternalFinancing
69%
31%
Loans
Bonds
97% 2.8%
US$
Othercurrencies
85% 15%
Fixed
Floating
Debt Profile as of September 2016Since 2010, the Weighted Average Cost of Debt (WACD) has gradually decreased due to market conditions and the debt strategy of this administration…
…which is led by medium-term issuances in the capital markets and similar interestrate movement as a 10-year UST.
WACD (2010-2016)
JPY 2.68%
KRW 0.05%
EUR 0.03%
Source: MEF - DFP
6.6% 6.1% 5.9% 5.5% 5.2% 5.0% 4.9%
3.7% 3.9%4.7% 4.6% 4.8% 4.3%
4.4%
6.3%
5.8% 5.6%5.3% 5.1% 4.8% 4.8%
0.0%
1.0%
2.0%
3.0%
4.0%
5.0%
6.0%
7.0%
4%
14%
24%
34%
44%
54%
64%
74%
84%
94%
104%
2010 2011 2012 2013 2014 2015 3Q-16
External Internal WACD
0.00
1.00
2.00
3.00
4.00
5.00
2010 2011 2012 2013 2014 2015 2016
Yie
ld (
%)
UST 10 years UST 30 years
UST 10 year and 30 year comparison (2010-2016)
Portfolio Composition
Risk Profile
Capital Markets
Debt Profile3
-50
50
150
250
350
450
550
Jan-16 Feb-16 Mar-16 Apr-16 May-16 Jun-16 Jul-16 Aug-16 Sep-16
Bas
is p
oin
ts (
BP
S)
EMBIG EMBIG COLOMBIA EMBIG PERU EMBIG MEXICO EMBIG PANAMA
Panama Papers 1 - 3 April Waked Case 3 May
Panama Papers 2 - 5 May
BREXIT - 23 June
FED Meeting 21 Sept
0
50
100
150
200
250
Jan-16 Feb-16 Mar-16 Apr-16 May-16 Jun-16 Jul-16 Aug-16 Sep-16
Bas
is p
oin
ts (
BP
S)
PANAMA USD CDS 10Y PANAMA USD CDS 5Y PANAMA USD CDS 2Y
Panama Papers 1 - 3 April Waked Case 3 May
Panama Papers 2 - 5 May
BREXIT - 23 June
FED Meeting 21 Sept
12
URU 2022
URU 2024 URU 2027
URU 2036URU 2050
PAN 2020PAN 2025 PAN 2028
PAN 2036 PAN 2053
MEX 2020
MEX 2023 MEX 2026
MEX 2040 MEX 2046
PER 2019
PER 2027 PERU 2027
PER 2037PER 2050
0
50
100
150
200
250
300
350
Panama 2020 Panama 2025 Panama 2028 Panama 2036 Panama 2053
Inte
rpo
late
d G
Sp
read
(b
ps)
Comparable Sovereign Bonds
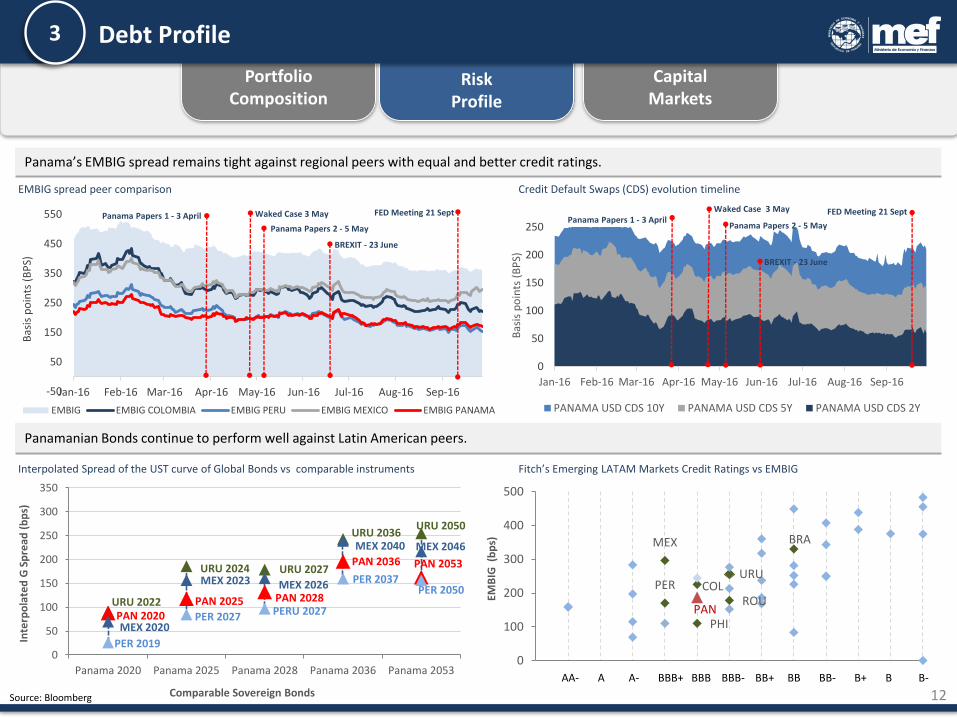
Panama’s EMBIG spread remains tight against regional peers with equal and better credit ratings.
Panamanian Bonds continue to perform well against Latin American peers.
Source: Bloomberg
Fitch’s Emerging LATAM Markets Credit Ratings vs EMBIG
Credit Default Swaps (CDS) evolution timelineEMBIG spread peer comparison
Interpolated Spread of the UST curve of Global Bonds vs comparable instruments
MEX
PERURU
PANPHI
COLROU
BRA
0
100
200
300
400
500
0 1 2 3 4 5 6 7 8 9 10 11 12
EMB
IG (
bp
s)
AA- A A- BBB+ BBB BBB- BB+ BB BB- B+ B B-

13
Portfolio Composition
RiskProfile
Capital Markets
Debt Profile3
The trading volume in the secondary market continues increasing due to efforts to deepen the domestic capital market.
Trading Volumes (in US$ million)
Outstanding Price Yield
669.6 106.0 1.4
607.7 102.1 2.2
665.2 108.9 2.7
1,364.0 114.2 2.9
700.0 108.9 3.6
2018 Note
2019 Note
2021 Note
2022 Bond
2024 Bond
Local Financial Instruments as of Sept 30th 2016
Spread vs UST
72
135
165
169
215
(US$ million)
2018
2019
20212022
2024
0.25
1.25
2.25
3.25
4.25
0 2 4 6 8
Yie
ld (
%)
Duration (years)
Internal Curve June 2016
Internal Curve September 2016 77 bps
Source: MEF - DFP
312
621
763 768
533 455
1,161
2011 2012 2013 2014 2015 3Q-15 3Q-16
Market Makers
Market Makers Candidates
(As of Sept. 2016)
Macroeconomic Overview
14
Fiscal Performance
Debt Profile
Future Prospects
Final Remarks
1
2
3
4
5

15
Approved 2017Budget
Investment Opportunities
Future Prospects4
Source: MEF
Sector Law N°69 (Budget 2016) Law N°63 (Budget 2017)
Tax Revenues 5,459 million 5,875 million
Panama Canal Authority Contributions 1,060 million 1,600 million
Adjusted NFPS Fiscal Deficit 1.5% (808 million) 1.0% (585 million)
NFPS CAPEX 4,538 million 5,063 million
Indicator 2016 2017
GDP Growth 6.3% 6.0%
Inflation 1.9% 1.1%
Nominal GDP 53,869 million 58,633 million
Economic Projections used for the budget elaboration
Budget

Panama continues investing more than 17% of GDP in education, health, and justice.
16
Approved 2017Budget
Investment Opportunities
Future Prospects4
Source: MEF
Budget Allocation by Area and Activity Sector (In US$ Million)
Sector 2016 2017
Social Services 9,406 9,026
Education and Culture 2,318 2,407
Health 3,622 3,864
Work 83 88
Protection and Social Security 2,049 2,155
Housing and Development 1,335 512
Environment and Technology 187 210
Environmental Development 64 67
Biodiversity Conservation 68 79
Technological Development 55 64
Infrastructure 2,318 2,667
Transport and Communications 2,092 2,399
Energy 225 269
Production 492 496
Agricultural 293 301
Industry, Commerce & Tourism 199 195
Financial Services 2,640 3,721
Banking and Financing 2,637 3,717
Insurance 3 3
Government and Justice 3,260 3,443
General Public Administration 2,139 2,220
Public Order and Security 751 823
Justice 371 400
Others 1,823 2,112
Total Budget 20,126 21,676
Protection & Social Security
US$2,155 million
56%4%
Health
US$3,864 million56%7%
4
Education & Culture
US$2,407 million56%4%
Financial Services
US$3,721 million
6%
Government & Justice
US$3,443 million
56%6%
Infrastructure
US$2,667 million
56%5%
Allocation by Sector (% of GDP)

17
Approved 2017Budget
InvestmentOpportunities
Future Prospects4
Source: MEF - DFP
Tourism Mining Energy Logistics
MINING• Copper mine under
construction by First Quantum:
• 50 billion pounds of copper; 12 million ounces of gold; and 250 tons of molybdenum expected
• Complete by 2017
• $2.0 billion in exports by 2018.
TOURISM
• Daily flights to 81 cities in America and Europe.
• Tocumen will double traffic to 15 million passengers by 2019.
• Panama is becoming the shopping capital of South America.
• New beach resorts under construction.
ENERGY HUB• Chevron and Vopak are
improving and enhancing a liquid energy terminal on the Atlantic end of Panama Canal
• Two LNG Terminals
• AES (Gas Natural Atlantic); $800 million investment, begins operations in 2018.
• Gas to Power Panama (GTPP); $900 million investment, begins operations in 2019.
LOGISTICS
• New port in the Pacific is under construction by the Panama Canal.
• PSA (formerly known as Port of Singapore Authority) is investing $450 million to enhance the Pacific terminal.
• The expanded Canal will open new opportunities for value-added logistics.

Macroeconomic Overview
18
Fiscal Performance
Debt Profile
Future Prospects
Final Remarks
1
2
3
4
5

19
2.
3.The NFPS deficit decreased by 10.1% to US$911 million in September 2016 compared tothe same period of 2015, reflecting the government’s commitment to the Social FiscalResponsibility Law.
1.Panama’s stable economic growth rate, supported by an environment of low inflation,unemployment and new opportunities for investments, exceeds the growth of the regionwith a GDP growth forecast for 2016 and 2017 of 5.2% and 5.9% respectively.
As of September 2016, central government revenues increased by 6.8% compared to thesame period in 2015, mainly due to a 9.1% increase in tax collection.
4.
Panama´s risk indicators continue to perform well against Latin American peers,reinforcing international investors’ trust in the country.
Current market conditions coupled with an efficient debt management strategy has led toa lower average cost of debt.
5.
Final Remarks5


This presentation does not constitute or form part of, and should not be construed as, an offer or invitation to sell securities of the Republic of
Panama (“Republic”), or the solicitation of an offer to subscribe for or purchase securities of the Republic, and nothing contained herein shall form
the basis of or be relied on in connection with any contract or commitment whatsoever. Any decision to purchase any securities of the Republic
should be made solely on the basis of conditions of the securities and the information to be contained in the prospectus, prospectus supplement or
equivalent disclosure document produced in connection with the offering of such securities. Prospective investors are required to make their own
independent investigations and appraisals of the business and financial condition of the Republic and the nature of any securities of the Republic
before taking any investment decision with respect to securities of the Republic. The contents of this presentation should not be the basis for
making investment decisions, nor should the presentation be construed as a recommendation to engage in investment transactions. This
presentation is not related to the provision of advisory services regarding investment, tax, legal, financial, accounting, consulting or any other
related services, nor is a recommendation being provided to buy, sell or purchase any good or product.
This presentation contains forward-looking statements, which include all statements other than statements of historical facts, including, without
limitation, any statements preceded by, followed by or including the words “targets,” “believes,” “projects,” “estimates,” “expects,” “aims,” “intends,”
“may,” “anticipates,” “would,” “could” or similar expressions or the negative thereof. Such forward-looking statements involve known and unknown
risks, uncertainties and other important factors beyond the Republic's control that could cause the Republic’s actual results, performance or
achievements to be materially different from future results, performance or achievements expressed or implied by such forward-looking statements.
These forward-looking statements speak only as at the date of this presentation. The financial information in this presentation should be used for
reference purposes only with the understanding that market conditions may change and past performance is not an indicator of future performance.
The Republic expressly disclaims any obligation or undertaking to disseminate any updates or revisions to any forward-looking statements
contained herein to reflect any change in its expectations with regard thereto or any change in events, conditions or circumstances on which any of
such statements are based. However, the Republic reserves the right to update, amend or delete information contained in this presentation without
prior notice.
The Republic, the Ministry of Economy and Finance (MEF) and the Public Financing Directorate of MEF do not assume legal responsibility nor will
they be liable for the way that this information may be interpreted, including any inaccuracies, assumptions, or projections related to this
information. The Republic, MEF and the Public Credit Directorate of MEF will not be liable for any loss or damage that directly or indirectly arises
with respect to the use of this information.
LEGAL DISCLAIMER
21