republic of rwanda - minecofin as a transfer or delegation, devolution, of financial legal and...
TRANSCRIPT
1
REPUBLIC OF RWANDA
MINISTRY OF FINANCE AND ECONOMIC PLANNING
2017-2018 EARMARKED TRANSFERS GUIDELINES TO
DECENTRALIZED ENTITIES
July, 2017

2
Forward
Decentralization as a transfer or delegation, devolution, of financial legal and political authority to plan, make
decisions and manage public functions from the central government to local government was approved in
2001 through The National Decentralization Policy as a mechanism to achieve good governance principles
enhance local economic development and bringing quality and accessible services closer to the citizens.
Fiscal and financial decentralization consists in the devolution of the financial resources and decision-making
powers to sub-national governments that will allow them to implement the functions and responsibilities that
have been delegated to them. In principle, every new responsibility must be followed with the appropriate
level of resources and a precise definition of the sources of revenue for the execution of that new
responsibility. In other words, finance must follow function.
In line with this background and reference made to the Organic Law on State finances and property N°
12/2013/OL of 12/09/2013, especially Article 32 on preparation and presentation of the budget framework
paper, guidelines on earmarked transfers to decentralized entities should be one of annexes to the Budget
Framework Paper submitted to Cabinet for approval.
Also, considering the implementation framework of the Fiscal Decentralization policy and Strategy approved
by Cabinet on 11th May 2011, the Ministry of Finance and Economic Planning (MINECOFIN) has been
delegated a leading role of establishing an efficient system of intergovernmental transfers to the level of
service delivery.
In that respect, all earmarked transfers guidelines to the decentralized entities for the 2017/2018 Fiscal Year
have therefore been consolidated by MINECOFIN and now issued to facilitate its implementation by the end
users. Faithfulness to these guidelines by all parties concerned is expected to accelerate the success of the
fiscal decentralization agenda set out by the Government thus leading to the attainment of the objectives of
the Economic Development and Poverty Reduction Strategy (EDPRS 2).
Furthermore, from 2014 the Government of Rwanda embarked on restructuring process for the purpose of
building a more effective and efficient Public Service, strengthening accountable governance and improving
service delivery to citizens. To this end, the organizational structure of decentralized entities were revised and
incorporated outputs that were earmarked by some Central Budget Agencies.
The specific purpose of these earmarked transfers guidelines is therefore to provide terms under which the
earmarked outputs are financed and how those funds are allocated, transferred, spent and accounted for
between the parties involved.
These consolidated earmarked transfer guidelines are designed to guide the decentralized entities in the
implementation of the earmarked transfers. Each earmarking institution developed guidelines that contain the
following sections and provide information in a tabular arrangement in the following order:
Objectives of the sectoral decentralization policy within programs and subprograms implemented by
decentralized entities;
Transferred outputs that the decentralized entities are tasked to implement with their budget;
The allocation formula by subprogram/output from each earmarking budget agency. This section
provides information regarding the basis of allocation of resources by sub-program and/or output;
The resources envelope for each decentralized entity basing on the allocation formula by outputs;
The annual targets set by the earmarking budget agencies that decentralized entities should report on
have been provided as well as their indicators;
The reporting obligations and frequencies by decentralized entities have been clearly provided in these
guidelines in accordance with the Organic Budget Law;
Monitoring and evaluation mechanisms have been adequately covered in these guidelines. This section
specifies the approach to be employed by earmarking agencies as they monitor and evaluate
performance;
Different disbursement modalities depending on the outputs to be implemented are also described.


4
1. MINISTRY OF JUSTICE (MINIJUST) ....................................................................1
2. MINISTRY OF EDUCATION (MINEDUC) ..........................................................10
3. MINISTRY OF HEALTH (MINISANTE) ..............................................................72
4. MINISTRY OF SPORTS AND CULTURE (MINISPOC) ....................................84
5. MINISTRY OF LOCAL GOVERNMENT (MINALOC) ......................................89
6. NATIONAL COMMISSION FOR CHILDREN (NCC) ......................................106
7. NATIONAL WOMEN COUNCIL (NWC) ............................................................134
8. NATIONAL ITORERO COMMISSION ..............................................................144
9. NATIONAL UNITY AND RECONCILIATION COMMISSION (NURC).......149
10. NATIONAL COUNCIL OF PERSONS WITH DISABILITIES (NCPD) .......154
11. GOVERNMENT ASSISTANCE FUND FOR SURVIVORS (FARG) .............160
12. MINISTRY OF YOUTH AND ICT (MYICT) ....................................................174
13. MINISTRY OF PUBLIC SERVICE AND LABOUR (MIFOTRA) .................195
14 LOCAL DEVELOPMENT AGENCY (LODA) ...................................................214
5
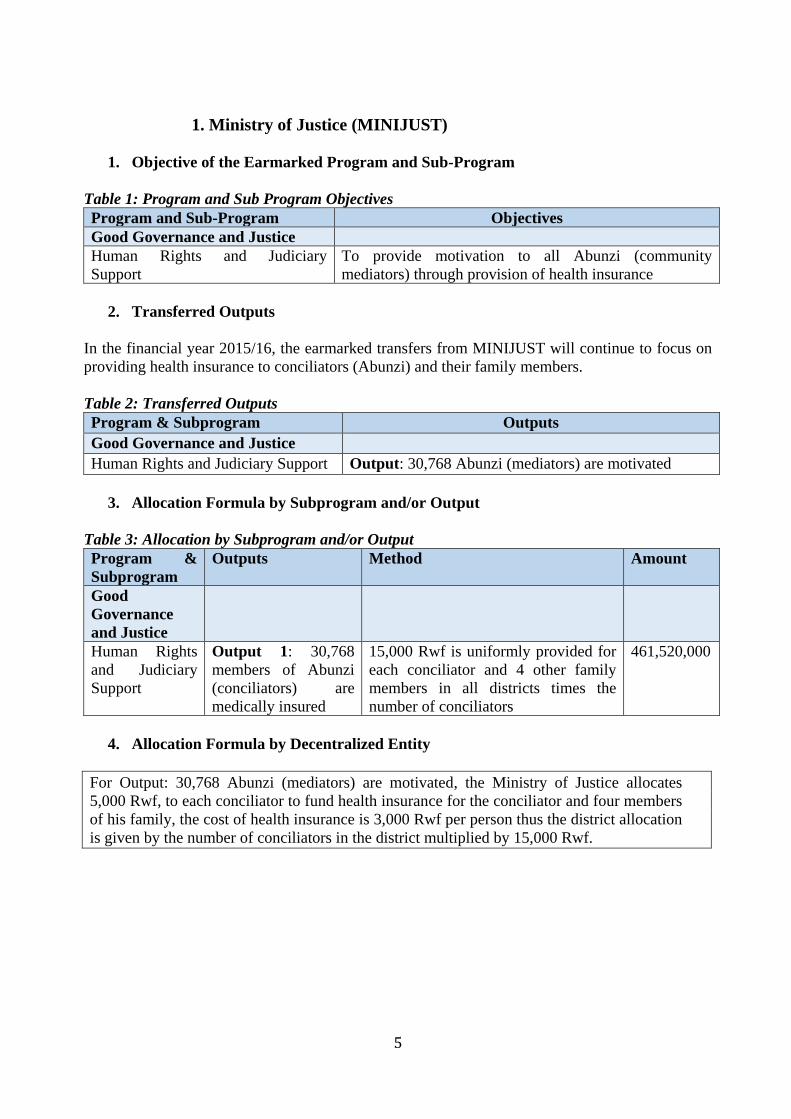
1. Ministry of Justice (MINIJUST)
1. Objective of the Earmarked Program and Sub-Program
Table 1: Program and Sub Program Objectives
Program and Sub-Program Objectives
Good Governance and Justice
Human Rights and Judiciary
Support
To provide motivation to all Abunzi (community
mediators) through provision of health insurance
2. Transferred Outputs
In the financial year 2015/16, the earmarked transfers from MINIJUST will continue to focus on
providing health insurance to conciliators (Abunzi) and their family members.
Table 2: Transferred Outputs
Program & Subprogram Outputs
Good Governance and Justice
Human Rights and Judiciary Support Output: 30,768 Abunzi (mediators) are motivated
3. Allocation Formula by Subprogram and/or Output
Table 3: Allocation by Subprogram and/or Output
Program &
Subprogram
Outputs Method Amount
Good
Governance
and Justice
Human Rights
and Judiciary
Support
Output 1: 30,768
members of Abunzi
(conciliators) are
medically insured
15,000 Rwf is uniformly provided for
each conciliator and 4 other family
members in all districts times the
number of conciliators
461,520,000
4. Allocation Formula by Decentralized Entity
For Output: 30,768 Abunzi (mediators) are motivated, the Ministry of Justice allocates
5,000 Rwf, to each conciliator to fund health insurance for the conciliator and four members
of his family, the cost of health insurance is 3,000 Rwf per person thus the district allocation
is given by the number of conciliators in the district multiplied by 15,000 Rwf.

6
Table 4: Allocation by Output, Sub-Programs and Program to Decentralized Entity
District Output 1 Sub-programme: Human Rights and
Judiciary Support
Ngoma 8,190,000 8,190,000
Bugesera 9,135,000 9,135,000
Gatsibo 8,715,000 8,715,000
Kayonza 6,510,000 6,510,000
Kirehe 7,560,000 7,560,000
Nyagatare 12,600,000 12,600,000
Rwamagana 10,080,000 10,080,000
Huye 9,555,000 9,555,000
Nyamagabe 11,445,000 11,445,000
Gisagara 7,560,000 7,560,000
Muhanga 7,875,000 7,875,000
Kamonyi 7,455,000 7,455,000
Nyanza 6,405,000 6,405,000
Nyaruguru 9,030,000 9,030,000
Rusizi 11,655,000 11,655,000
Nyabihu 8,925,000 8,925,000
Rubavu 9,660,000 9,660,000
Karongi 10,605,000 10,605,000
Ngororero 9,030,000 9,030,000
Nyamasheke 8,715,000 8,715,000
Rutsiro 7,875,000 7,875,000
Burera 9,030,000 9,030,000
Gicumbi 13,650,000 13,650,000
Musanze 8,715,000 8,715,000
Rulindo 9,240,000 9,240,000
Gakenke 12,180,000 12,180,000
Ruhango 7,140,000 7,140,000
Nyarugenge 5,985,000 5,985,000
Kicukiro 5,355,000 5,355,000
Gasabo 9,240,000 9,240,000
Total 269,115,000 269,115,000

7
5. Performance Targets and Indicators
Table 5: Performance Indicators by Decentralized Budget Agency for Output
District and Output Output indicators Annual Target
Gasabo
Abunzi (mediators) motivation
ensured
Number of mediators paid for
health insurance (mutuelle) in time
1056
Kicukiro
Abunzi (mediators) motivation
ensured
Number of mediators paid for
health insurance (mutuelle) in time
612
Nyarugenge
Abunzi (mediators) motivation
ensured
Number of mediators paid for
health insurance (mutuelle) in time
684
Gisagara
Abunzi (mediators) motivation
ensured
Number of mediators paid for
health insurance (mutuelle) in time
864
Huye
Abunzi (mediators) motivation
ensured
Number of mediators paid for
health insurance (mutuelle) in time
1,092
Kamonyi
Abunzi (mediators) motivation
ensured
Number of mediators paid for
health insurance (mutuelle) in time
852
Muhanga
Abunzi (mediators) motivation
ensured
Number of mediators paid for
health insurance (mutuelle) in time
900
Nyamagabe
Abunzi (mediators) motivation
ensured
Number of mediators paid for
health insurance (mutuelle) in time
1,308
Nyanza
Abunzi (mediators) motivation
ensured
Number of mediators paid for
health insurance (mutuelle) in time
732
Nyaruguru
Abunzi (mediators) motivation
ensured
Number of mediators paid for
health insurance (mutuelle) in time
1,032
Ruhango
Abunzi (mediators) motivation
ensured
Number of mediators paid for
health insurance (mutuelle) in time
816
Burera
Abunzi (mediators) motivation
ensured
Number of mediators paid for
health insurance (mutuelle) in time
1,032
Gakenke
Abunzi (mediators) motivation
ensured
Number of mediators paid for
health insurance (mutuelle) in time
1,392
Gicumbi

8
Abunzi (mediators) motivation
ensured
Number of mediators paid for
health insurance (mutuelle) in time
1,560
Musanze
Abunzi (mediators) motivation
ensured
Number of mediators paid for
health insurance (mutuelle) in time
996
Rulindo
Abunzi (mediators) motivation
ensured
Number of mediators paid for
health insurance (mutuelle) in time
1,056
Bugesera
Abunzi (mediators) motivation
ensured
Number of mediators paid for
health insurance (mutuelle) in time
1,044
Gatsibo
Abunzi (mediators) motivation
ensured
Number of mediators paid for
health insurance (mutuelle) in time
996
Kayonza
Abunzi (mediators) motivation
ensured
Number of mediators paid for
health insurance (mutuelle) in time
744
Kirehe
Abunzi (mediators) motivation
ensured
Number of mediators paid for
health insurance (mutuelle) in time
864
Ngoma
Abunzi (mediators) motivation
ensured
Number of mediators paid for
health insurance (mutuelle) in time
936
Nyagatare
Abunzi (mediators) motivation
ensured
Number of mediators paid for
health insurance (mutuelle) in time
1,440
Rwamagana
Abunzi (mediators) motivation
ensured
Number of mediators paid for
health insurance (mutuelle) in time
1,152
Karongi
Abunzi (mediators) motivation
ensured
Number of mediators paid for
health insurance (mutuelle) in time
1,212
Ngororero
Abunzi (mediators) motivation
ensured
Number of mediators paid for
health insurance (mutuelle) in time
1,032
Nyabihu
Abunzi (mediators) motivation
ensured
Number of mediators paid for
health insurance (mutuelle) in time
1,020
Nyamasheke
Abunzi (mediators) motivation
ensured
Number of mediators paid for
health insurance (mutuelle) in time
996
Rubavu
Abunzi (mediators) motivation
ensured
Number of mediators paid for
health insurance (mutuelle) in time
1,104
Rusizi
9
Abunzi (mediators) motivation
ensured
Number of mediators paid for
health insurance (mutuelle) in time
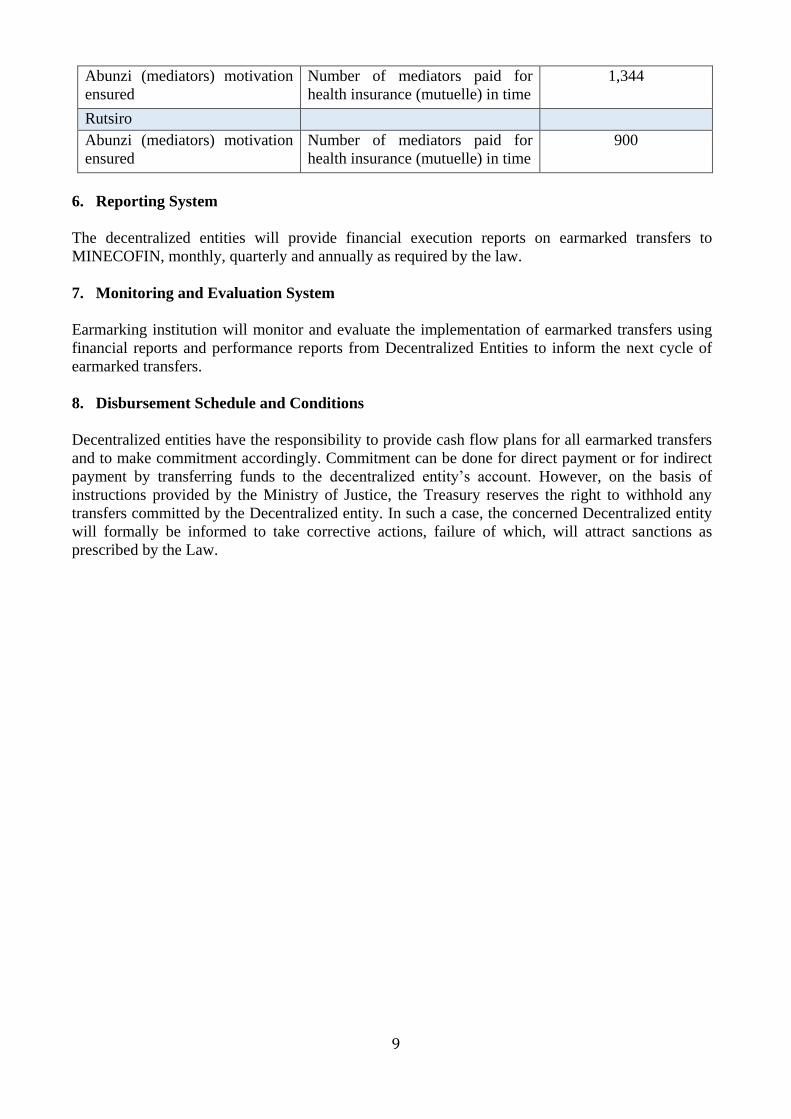
1,344
Rutsiro
Abunzi (mediators) motivation
ensured
Number of mediators paid for
health insurance (mutuelle) in time
900
6. Reporting System
The decentralized entities will provide financial execution reports on earmarked transfers to
MINECOFIN, monthly, quarterly and annually as required by the law.
7. Monitoring and Evaluation System
Earmarking institution will monitor and evaluate the implementation of earmarked transfers using
financial reports and performance reports from Decentralized Entities to inform the next cycle of
earmarked transfers.
8. Disbursement Schedule and Conditions
Decentralized entities have the responsibility to provide cash flow plans for all earmarked transfers
and to make commitment accordingly. Commitment can be done for direct payment or for indirect
payment by transferring funds to the decentralized entity’s account. However, on the basis of
instructions provided by the Ministry of Justice, the Treasury reserves the right to withhold any
transfers committed by the Decentralized entity. In such a case, the concerned Decentralized entity
will formally be informed to take corrective actions, failure of which, will attract sanctions as
prescribed by the Law.

10
2. Ministry of Education (MINEDUC)
1. Objective of the Earmarked Program and Sub-Program
Table 1: Program and Sub Program Objectives
Program and Sub-
Program
Objectives
Education The objective of Education is to transform the Rwandan citizen into skilled
human capital for the socio-economic development of the country by
ensuring equitable access to quality education focusing on combating
illiteracy, promotion of science and technology, critical thinking, and
positive values.
Pre-Primary and
Primary
Improved access to school readiness programs while expanding access to
three-years of early learning for four-to-six-year olds.
Increased equitable access and improved quality and learning outcomes.
Secondary
Education
Increased equitable access and improved quality and learning outcomes.
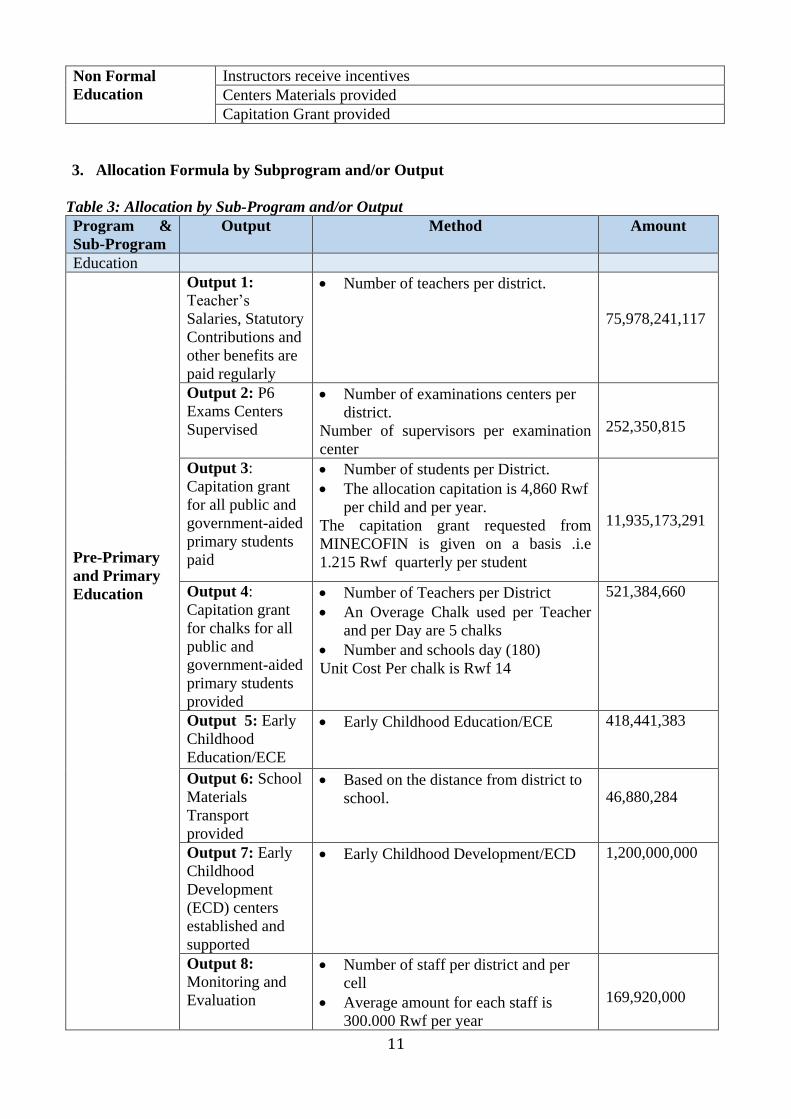
Non Formal
Education
Increased access, improve quality these sub-sectors.
2. Transferred Outputs
Table 2: Transferred Outputs
Program &
Subprogram
Output
Education
Pre-Primary and
Primary Education
Teacher’s Salaries, Statutory Contributions and other benefits are paid
regularly
P6 Exams Centers Supervised
Primary capitation grant paid
Capitation grant for chalks for all public and government-aided primary
students provided
Early Childhood Education/ECE
School Materials Transport provided
Early Childhood Development (ECD) centers established and supported
Monitoring and Evaluation
Data collection and Entry at District Level
Secondary
Education
Teacher’s Salaries, Statutory Contributions and other benefits are paid
regularly
S3-S6 Exams Centers supervised
Capitation Grant in public schools paid
Capitation grant for chalks for secondary students provided
School feeding paid to schools
Girls Education supported (Sanitary pads in 12 YBE schools provided
School Hygiene and conducive learning environment strengthened
11
Non Formal
Education
Instructors receive incentives
Centers Materials provided
Capitation Grant provided
3. Allocation Formula by Subprogram and/or Output
Table 3: Allocation by Sub-Program and/or Output
Program &
Sub-Program
Output Method Amount
Education
Pre-Primary
and Primary
Education
Output 1: Teacher’s
Salaries, Statutory
Contributions and
other benefits are
paid regularly
Number of teachers per district.
75,978,241,117
Output 2: P6
Exams Centers
Supervised
Number of examinations centers per
district.
Number of supervisors per examination
center
252,350,815
Output 3:
Capitation grant
for all public and
government-aided
primary students
paid
Number of students per District.
The allocation capitation is 4,860 Rwf
per child and per year.
The capitation grant requested from
MINECOFIN is given on a basis .i.e
1.215 Rwf quarterly per student
11,935,173,291
Output 4:
Capitation grant
for chalks for all
public and
government-aided
primary students
provided
Number of Teachers per District
An Overage Chalk used per Teacher
and per Day are 5 chalks
Number and schools day (180)
Unit Cost Per chalk is Rwf 14
521,384,660
Output 5: Early
Childhood
Education/ECE
Early Childhood Education/ECE 418,441,383
Output 6: School
Materials
Transport
provided
Based on the distance from district to
school.
46,880,284
Output 7: Early
Childhood
Development
(ECD) centers
established and
supported
Early Childhood Development/ECD 1,200,000,000
Output 8:
Monitoring and
Evaluation
Number of staff per district and per
cell
Average amount for each staff is
300.000 Rwf per year
169,920,000

12
Output 9: Data
collection and
Entry
Number of staff involved in data entry
activity
62,420,000
Secondary
Education
Output :1
Teacher’s
Salaries, Statutory
Contributions and
other benefits are
paid regularly
Number of teachers in public and
government-aided schools per district.
24,298,893,922
Output 2: S3-S6
Exams Centers
supervised
Number of examinations centers per
district.
Number of supervisors per
examination center
527,427,235
Output 3:
Secondary
capitation grant
1. Groupes Scolaires/G.S
Number of students per District.
The allocation capitation is 4,860 Rwf per
child and per year.
The capitation grant requested from
MINECOFIN is given on a basis .i.e
1.215 Rwf quarterly per student.
2.Boarding Schools and ESIs
Number of lower secondary students in
boarding schools
The capitation grant allocated to day and
boarding student 11.000 Rwf and 21.000
Rwf respectively per year.
The capitation grant requested from
MINECOFIN is given on a basis .i.e Rwf
1.215 in GS, 2.750 and 5.250 for a
quarterly day and boarding student
respectively in boarding schools.
2,572,931,631
Output 4:
Capitation grant
for chalks for
secondary
students provided
Number of students in public and
Number of Teachers per District
An Overage Chalk used per Teacher
and per Day are 8 chalks
Number and schools day (180)
Unit Cost Per chalk is Rwf 14
494,013,139
Output 5: School
feeding paid to
schools
School Feeding for Students,Ubudehe
category 1 in G.S
Number of students in each District
The rate for each day student is Rwf
56 per day
The amount requested from
MINECOFIN is given on a quarterly
Boarding Schools
The rate for each day and boarding
student is Rwf 75 and 156 per day
respectively.
6,030,751,458

13
The amount requested from
MINECOFIN is given on a quarterly
Output 6: Girls
Education
supported
(Sanitary pads in
12 YBE schools
provided
Number of 12YBE schools per
District
Average amount to support 12YBE
schools for each school is 306,351
The amount requested from
MINECOFIN is transferred to school
372,786,262
Output 7: School
Hygiene and
conducive
learning
environment
strengthened
Hand washing equipments
Number of schools in each district
Number of hand washing
The average unit cost for each hand
washing is 40.000Rwf
Water Tanks
Number of schools in each district
Number of water tanks
The average unit cost for each water
tank is 400.000Rwf
School Garden Equipment
Number of schools in each district
Number of school garden package The
average unit cost for each school
garden package is 100.000Rwf
333,000,000
Non Formal
Education
Output 1: Instructors receive
incentive
• Number of instructors in each
district
The amount for each instructor is 30.000
Rwf per year
191,593,000
Output 2: Centers Materials
provided
• Number of Literacy Centers in
each District
• Unit cost per literacy center is
10.000 Rwf including chalks…)
117,321,500
Output 3: Capitation Grant
provided
Number of students per District.
The allocation capitation is 4,860frw
per student and per year.
The capitation grant requested from
MINECOFIN is given on a quarterly basis
of 1,215frw per student.
247,867,909
14
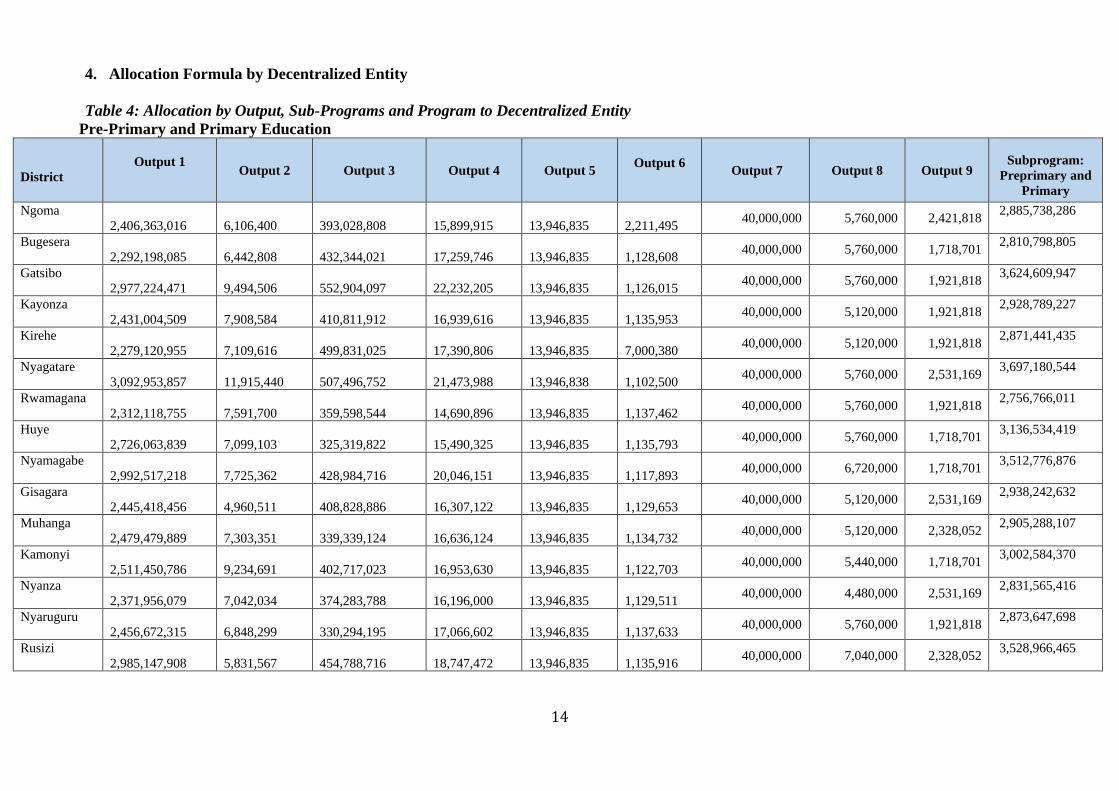
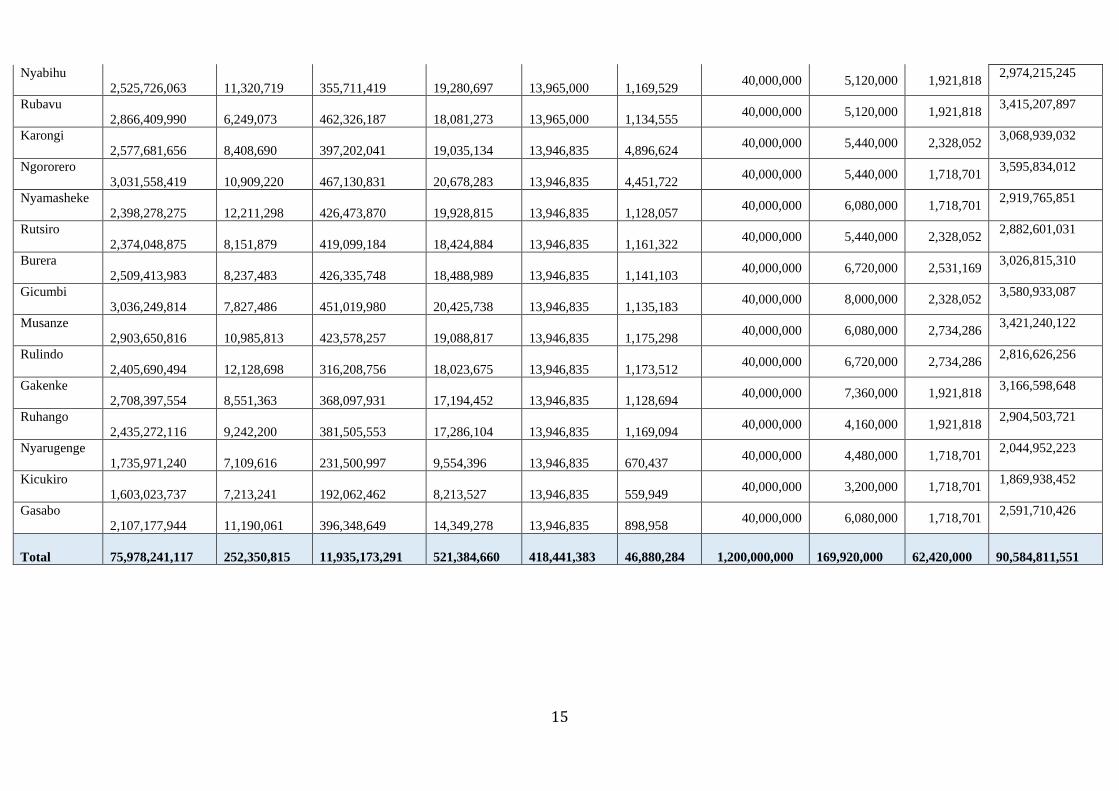
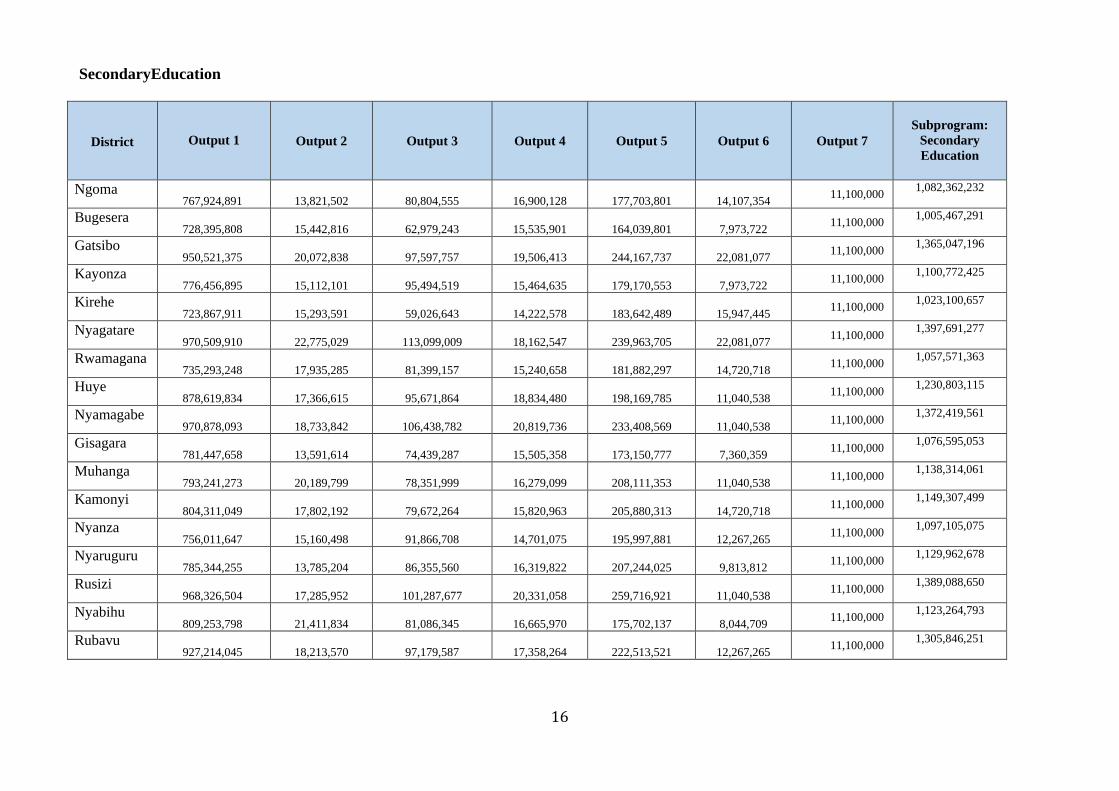
4. Allocation Formula by Decentralized Entity
Table 4: Allocation by Output, Sub-Programs and Program to Decentralized Entity
Pre-Primary and Primary Education
District
Output 1 Output 2 Output 3 Output 4 Output 5
Output 6
Output 7 Output 8 Output 9
Subprogram:
Preprimary and
Primary
Ngoma
2,406,363,016
6,106,400
393,028,808
15,899,915
13,946,835
2,211,495 40,000,000 5,760,000 2,421,818
2,885,738,286
Bugesera
2,292,198,085
6,442,808
432,344,021
17,259,746
13,946,835
1,128,608 40,000,000 5,760,000 1,718,701
2,810,798,805
Gatsibo
2,977,224,471
9,494,506
552,904,097
22,232,205
13,946,835
1,126,015 40,000,000 5,760,000 1,921,818
3,624,609,947
Kayonza
2,431,004,509
7,908,584
410,811,912
16,939,616
13,946,835
1,135,953 40,000,000 5,120,000 1,921,818
2,928,789,227
Kirehe
2,279,120,955
7,109,616
499,831,025
17,390,806
13,946,835
7,000,380 40,000,000 5,120,000 1,921,818
2,871,441,435
Nyagatare
3,092,953,857
11,915,440
507,496,752
21,473,988
13,946,838
1,102,500 40,000,000 5,760,000 2,531,169
3,697,180,544
Rwamagana
2,312,118,755
7,591,700
359,598,544
14,690,896
13,946,835
1,137,462 40,000,000 5,760,000 1,921,818
2,756,766,011
Huye
2,726,063,839
7,099,103
325,319,822
15,490,325
13,946,835
1,135,793 40,000,000 5,760,000 1,718,701
3,136,534,419
Nyamagabe
2,992,517,218
7,725,362
428,984,716
20,046,151
13,946,835
1,117,893 40,000,000 6,720,000 1,718,701
3,512,776,876
Gisagara
2,445,418,456
4,960,511
408,828,886
16,307,122
13,946,835
1,129,653 40,000,000 5,120,000 2,531,169
2,938,242,632
Muhanga
2,479,479,889
7,303,351
339,339,124
16,636,124
13,946,835
1,134,732 40,000,000 5,120,000 2,328,052
2,905,288,107
Kamonyi
2,511,450,786
9,234,691
402,717,023
16,953,630
13,946,835
1,122,703 40,000,000 5,440,000 1,718,701
3,002,584,370
Nyanza
2,371,956,079
7,042,034
374,283,788
16,196,000
13,946,835
1,129,511 40,000,000 4,480,000 2,531,169
2,831,565,416
Nyaruguru
2,456,672,315
6,848,299
330,294,195
17,066,602
13,946,835
1,137,633 40,000,000 5,760,000 1,921,818
2,873,647,698
Rusizi
2,985,147,908
5,831,567
454,788,716
18,747,472
13,946,835
1,135,916 40,000,000 7,040,000 2,328,052
3,528,966,465
15
Nyabihu
2,525,726,063
11,320,719
355,711,419
19,280,697
13,965,000
1,169,529 40,000,000 5,120,000 1,921,818
2,974,215,245
Rubavu
2,866,409,990
6,249,073
462,326,187
18,081,273
13,965,000
1,134,555 40,000,000 5,120,000 1,921,818
3,415,207,897
Karongi
2,577,681,656
8,408,690
397,202,041
19,035,134
13,946,835
4,896,624 40,000,000 5,440,000 2,328,052
3,068,939,032
Ngororero
3,031,558,419
10,909,220
467,130,831
20,678,283
13,946,835
4,451,722 40,000,000 5,440,000 1,718,701
3,595,834,012
Nyamasheke
2,398,278,275
12,211,298
426,473,870
19,928,815
13,946,835
1,128,057 40,000,000 6,080,000 1,718,701
2,919,765,851
Rutsiro
2,374,048,875
8,151,879
419,099,184
18,424,884
13,946,835
1,161,322 40,000,000 5,440,000 2,328,052
2,882,601,031
Burera
2,509,413,983
8,237,483
426,335,748
18,488,989
13,946,835
1,141,103 40,000,000 6,720,000 2,531,169
3,026,815,310
Gicumbi
3,036,249,814
7,827,486
451,019,980
20,425,738
13,946,835
1,135,183 40,000,000 8,000,000 2,328,052
3,580,933,087
Musanze
2,903,650,816
10,985,813
423,578,257
19,088,817
13,946,835
1,175,298 40,000,000 6,080,000 2,734,286
3,421,240,122
Rulindo
2,405,690,494
12,128,698
316,208,756
18,023,675
13,946,835
1,173,512 40,000,000 6,720,000 2,734,286
2,816,626,256
Gakenke
2,708,397,554
8,551,363
368,097,931
17,194,452
13,946,835
1,128,694 40,000,000 7,360,000 1,921,818
3,166,598,648
Ruhango
2,435,272,116
9,242,200
381,505,553
17,286,104
13,946,835
1,169,094 40,000,000 4,160,000 1,921,818
2,904,503,721
Nyarugenge
1,735,971,240
7,109,616
231,500,997
9,554,396
13,946,835
670,437 40,000,000 4,480,000 1,718,701
2,044,952,223
Kicukiro
1,603,023,737
7,213,241
192,062,462
8,213,527
13,946,835
559,949 40,000,000 3,200,000 1,718,701
1,869,938,452
Gasabo
2,107,177,944
11,190,061
396,348,649
14,349,278
13,946,835
898,958 40,000,000 6,080,000 1,718,701
2,591,710,426
Total
75,978,241,117
252,350,815
11,935,173,291
521,384,660
418,441,383
46,880,284
1,200,000,000
169,920,000
62,420,000
90,584,811,551
16
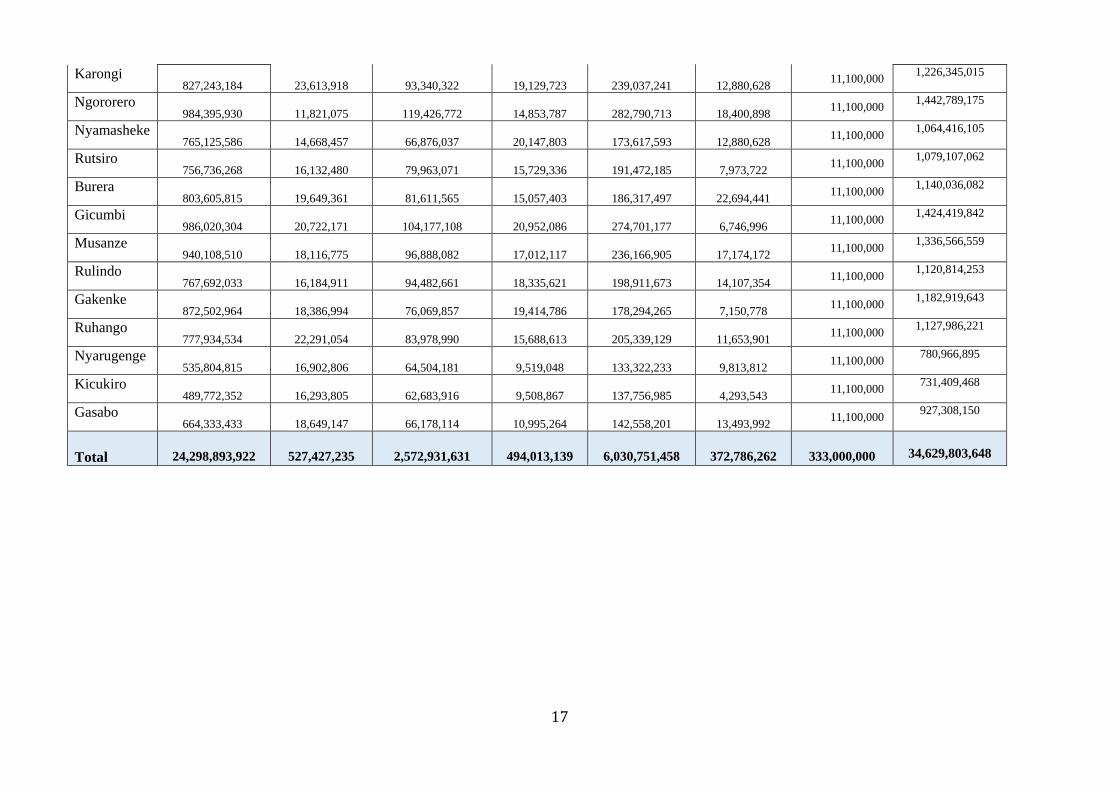
SecondaryEducation
District
Output 1 Output 2 Output 3 Output 4 Output 5 Output 6 Output 7
Subprogram:
Secondary
Education
Ngoma 767,924,891
13,821,502
80,804,555
16,900,128
177,703,801
14,107,354 11,100,000
1,082,362,232
Bugesera 728,395,808
15,442,816
62,979,243
15,535,901
164,039,801
7,973,722 11,100,000
1,005,467,291
Gatsibo 950,521,375
20,072,838
97,597,757
19,506,413
244,167,737
22,081,077 11,100,000
1,365,047,196
Kayonza 776,456,895
15,112,101
95,494,519
15,464,635
179,170,553
7,973,722 11,100,000
1,100,772,425
Kirehe 723,867,911
15,293,591
59,026,643
14,222,578
183,642,489
15,947,445 11,100,000
1,023,100,657
Nyagatare 970,509,910
22,775,029
113,099,009
18,162,547
239,963,705
22,081,077 11,100,000
1,397,691,277
Rwamagana 735,293,248
17,935,285
81,399,157
15,240,658
181,882,297
14,720,718 11,100,000
1,057,571,363
Huye 878,619,834
17,366,615
95,671,864
18,834,480
198,169,785
11,040,538 11,100,000
1,230,803,115
Nyamagabe 970,878,093
18,733,842
106,438,782
20,819,736
233,408,569
11,040,538 11,100,000
1,372,419,561
Gisagara 781,447,658
13,591,614
74,439,287
15,505,358
173,150,777
7,360,359 11,100,000
1,076,595,053
Muhanga 793,241,273
20,189,799
78,351,999
16,279,099
208,111,353
11,040,538 11,100,000
1,138,314,061
Kamonyi 804,311,049
17,802,192
79,672,264
15,820,963
205,880,313
14,720,718 11,100,000
1,149,307,499
Nyanza 756,011,647
15,160,498
91,866,708
14,701,075
195,997,881
12,267,265 11,100,000
1,097,105,075
Nyaruguru 785,344,255
13,785,204
86,355,560
16,319,822
207,244,025
9,813,812 11,100,000
1,129,962,678
Rusizi 968,326,504
17,285,952
101,287,677
20,331,058
259,716,921
11,040,538 11,100,000
1,389,088,650
Nyabihu 809,253,798
21,411,834
81,086,345
16,665,970
175,702,137
8,044,709 11,100,000
1,123,264,793
Rubavu 927,214,045
18,213,570
97,179,587
17,358,264
222,513,521
12,267,265 11,100,000
1,305,846,251
17
Karongi 827,243,184
23,613,918
93,340,322
19,129,723
239,037,241
12,880,628 11,100,000
1,226,345,015
Ngororero 984,395,930
11,821,075
119,426,772
14,853,787
282,790,713
18,400,898 11,100,000
1,442,789,175
Nyamasheke 765,125,586
14,668,457
66,876,037
20,147,803
173,617,593
12,880,628 11,100,000
1,064,416,105
Rutsiro 756,736,268
16,132,480
79,963,071
15,729,336
191,472,185
7,973,722 11,100,000
1,079,107,062
Burera 803,605,815
19,649,361
81,611,565
15,057,403
186,317,497
22,694,441 11,100,000
1,140,036,082
Gicumbi 986,020,304
20,722,171
104,177,108
20,952,086
274,701,177
6,746,996 11,100,000
1,424,419,842
Musanze 940,108,510
18,116,775
96,888,082
17,012,117
236,166,905
17,174,172 11,100,000
1,336,566,559
Rulindo 767,692,033
16,184,911
94,482,661
18,335,621
198,911,673
14,107,354 11,100,000
1,120,814,253
Gakenke 872,502,964
18,386,994
76,069,857
19,414,786
178,294,265
7,150,778 11,100,000
1,182,919,643
Ruhango 777,934,534
22,291,054
83,978,990
15,688,613
205,339,129
11,653,901 11,100,000
1,127,986,221
Nyarugenge 535,804,815
16,902,806
64,504,181
9,519,048
133,322,233
9,813,812 11,100,000
780,966,895
Kicukiro 489,772,352
16,293,805
62,683,916
9,508,867
137,756,985
4,293,543 11,100,000
731,409,468
Gasabo 664,333,433
18,649,147
66,178,114
10,995,264
142,558,201
13,493,992 11,100,000
927,308,150
Total
24,298,893,922
527,427,235
2,572,931,631
494,013,139
6,030,751,458
372,786,262
333,000,000
34,629,803,648

18
Tertiary and Non Formal Education
District Output 1 Output 2 Output 3
Subprogram
Non Formal
Education Total
Ngoma 4,510,000
2,255,000
8,369,996
15,134,996
Bugesera 7,913,000
4,059,000
5,895,698
17,867,698
Gatsibo 12,587,000
6,437,000
11,696,685
30,720,685
Kayonza 1,804,000
922,500
5,812,826
8,539,326
Kirehe 2,952,000
1,496,500
2,237,524
6,686,024
Nyagatare 8,651,000
4,448,500
1,183,875
14,283,375
Rwamagana 7,462,000
3,772,000
6,037,763
17,271,763
Huye 3,936,000
2,501,000
18,077,771
24,514,771
Nyamagabe 10,947,000
7,708,000
9,897,195
28,552,195
Gisagara 2,952,000
1,845,000
5,268,244
10,065,244
Muhanga 5,412,000
3,095,500
11,329,684
19,837,184
Kamonyi 5,576,000
3,546,500
3,741,045
12,863,545
Nyanza 4,551,000
3,013,500
7,257,154
14,821,654
Nyaruguru 4,059,000
2,808,500
1,574,554
8,442,054
Rusizi 7,626,000
5,207,000
7,541,284
20,374,284
Nyabihu 5,084,000
2,542,000
4,131,724
11,757,724
Rubavu 7,913,000
4,571,500
8,452,868
20,937,368
Karongi 7,544,000
6,416,500
9,601,226
23,561,726
Ngororero 6,929,000
5,022,500
6,523,151
18,474,651
Nyamasheke 11,972,000
9,184,000
7,920,124
29,076,124
Rutsiro 8,036,000
4,100,000
14,218,339
26,354,339
Burera 8,692,000
4,797,000
3,030,720
16,519,720
Gicumbi 10,004,000
5,945,000
7,801,736
23,750,736
Musanze 5,207,000
3,218,500
9,411,806
17,837,306
Rulindo 6,314,000
3,157,000
3,480,593
12,951,593
Gakenke 10,783,000
6,437,000
6,487,635
23,707,635
Ruhango 4,961,000
3,280,000
17,793,641
26,034,641
Nyarugenge 2,747,000
1,619,500
5,303,760
9,670,260
Kicukiro 1,353,000
963,500
18,859,129
21,175,629
Gasabo 3,116,000
2,952,000
18,930,161
24,998,161
Total
191,593,000
117,321,500
247,867,909
556,782,409

19
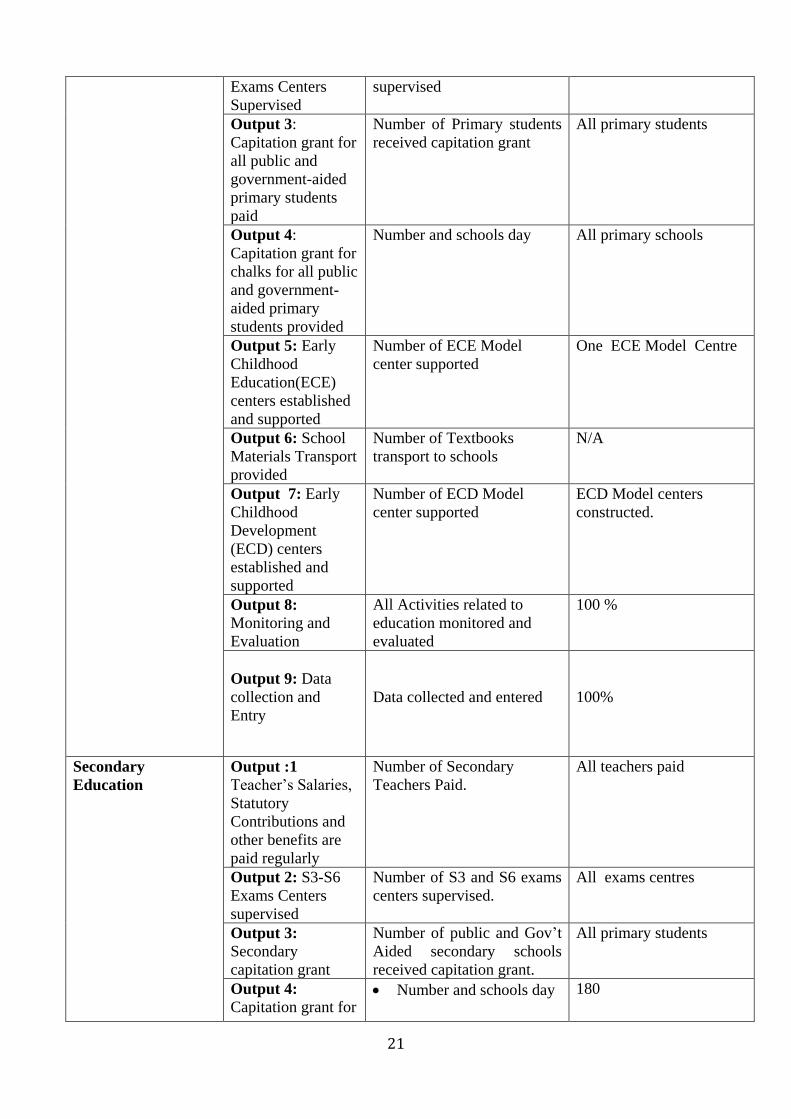
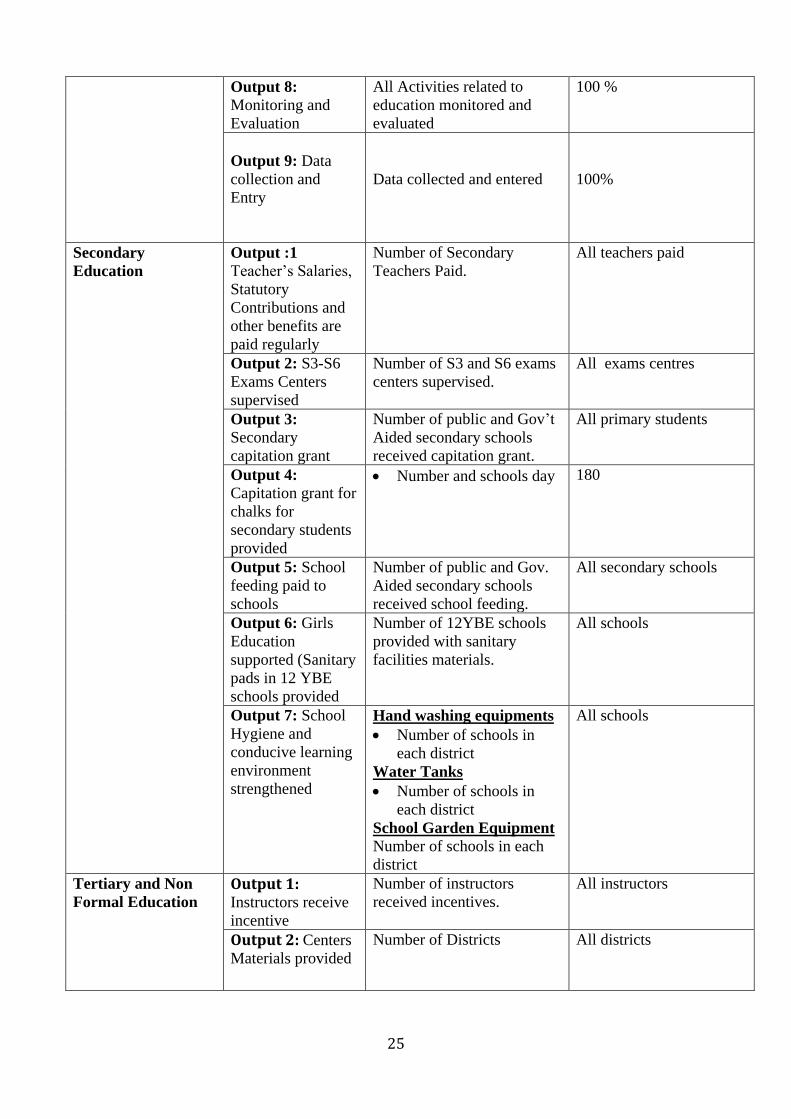
5. Performance Targets and Indicators
Table 5: Performance Indicators by Decentralized Budget Agency for Program/ Subprogram
District &
Subprogram
Output Performance Indicator Annual Target
Ngoma
Pre-Primary and
Primary Education
Output 1:
Teacher’s Salaries,
Statutory
Contributions and
other benefits are
paid regularly
Number of Primary Teachers
Paid
All teachers paid
Output 2: P6
Exams Centers
Supervised
Number of P6 exams centers
supervised
All exam centers
Output 3:
Capitation grant for
all public and
government-aided
primary students
paid
Number of Primary students
received capitation grant
All primary students
Output 4:
Capitation grant for
chalks for all public
and government-
aided primary
students provided
Number and schools day All primary schools
Output 5: Early
Childhood
Education(ECE)
centers established
and supported
Number of ECE Model
center supported
One ECE Model Centre
Output 6: School
Materials Transport
provided
Number of Textbooks
transport to schools
N/A
Output 7: Early
Childhood
Development
(ECD) centers
established and
supported
Number of ECD Model
center supported
ECD Model centers
constructed.
Output 8:
Monitoring and
Evaluation
All Activities related to
education monitored and
evaluated
100 %
Output 9: Data
collection and
Entry
Data collected and entered
100%

20
Secondary
Education
Output :1
Teacher’s Salaries,
Statutory
Contributions and
other benefits are
paid regularly
Number of Secondary
Teachers Paid.
All teachers paid
Output 2: S3-S6
Exams Centers
supervised
Number of S3 and S6 exams
centers supervised.
All exams centres
Output 3:
Secondary
capitation grant
Number of public and Gov’t
Aided secondary schools
received capitation grant.
All primary students
Output 4:
Capitation grant for
chalks for
secondary students
provided
Number and schools day 180
Output 5: School
feeding paid to
schools
Number of public and Gov.
Aided secondary schools
received school feeding.
All secondary schools
Output 6: Girls
Education
supported (Sanitary
pads in 12 YBE
schools provided
Number of 12YBE schools
provided with sanitary
facilities materials.
All schools
Output 7: School
Hygiene and
conducive learning
environment
strengthened
Hand washing equipments
Number of schools in
each district
Water Tanks
Number of schools in
each district
School Garden Equipment
Number of schools in
each district
All schools
Tertiary and Non
Formal Education
Output 1: Instructors receive
incentive
Number of instructors
received incentives.
All instructors
Output 2: Centers
Materials provided Number of Districts All districts
Output 3: Capitation Grant
provided
Number of Tertiary and Non
Formal schools received
capitation grant.
All students
Bugesera
Pre-Primary and
Primary Education
Output 1:
Teacher’s Salaries,
Statutory
Contributions and
other benefits are
paid regularly
Number of Primary Teachers
Paid
All teachers paid
Output 2: P6 Number of P6 exams centers All exam centers
21
Exams Centers
Supervised
supervised
Output 3:
Capitation grant for
all public and
government-aided
primary students
paid
Number of Primary students
received capitation grant
All primary students
Output 4:
Capitation grant for
chalks for all public
and government-
aided primary
students provided
Number and schools day All primary schools
Output 5: Early
Childhood
Education(ECE)
centers established
and supported
Number of ECE Model
center supported
One ECE Model Centre
Output 6: School
Materials Transport
provided
Number of Textbooks
transport to schools
N/A
Output 7: Early
Childhood
Development
(ECD) centers
established and
supported
Number of ECD Model
center supported
ECD Model centers
constructed.
Output 8:
Monitoring and
Evaluation
All Activities related to
education monitored and
evaluated
100 %
Output 9: Data
collection and
Entry
Data collected and entered
100%
Secondary
Education
Output :1
Teacher’s Salaries,
Statutory
Contributions and
other benefits are
paid regularly
Number of Secondary
Teachers Paid.
All teachers paid
Output 2: S3-S6
Exams Centers
supervised
Number of S3 and S6 exams
centers supervised.
All exams centres
Output 3:
Secondary
capitation grant
Number of public and Gov’t
Aided secondary schools
received capitation grant.
All primary students
Output 4:
Capitation grant for Number and schools day 180
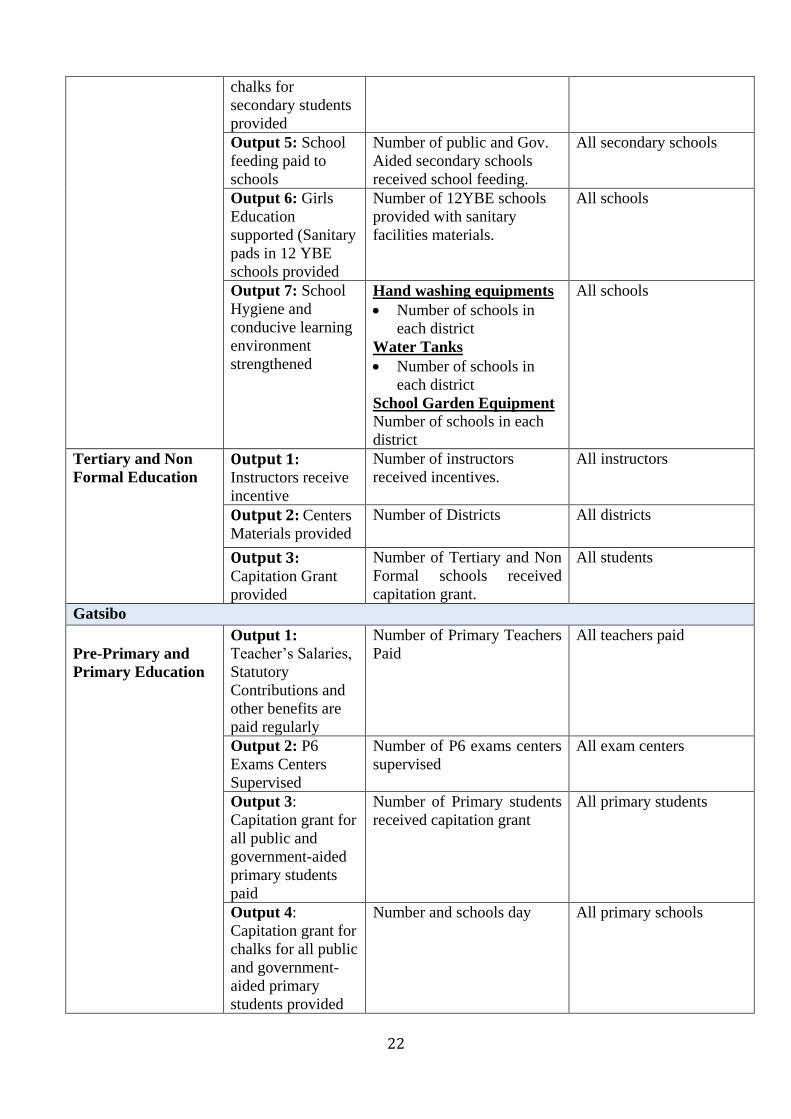
22
chalks for
secondary students
provided
Output 5: School
feeding paid to
schools
Number of public and Gov.
Aided secondary schools
received school feeding.
All secondary schools
Output 6: Girls
Education
supported (Sanitary
pads in 12 YBE
schools provided
Number of 12YBE schools
provided with sanitary
facilities materials.
All schools
Output 7: School
Hygiene and
conducive learning
environment
strengthened
Hand washing equipments
Number of schools in
each district
Water Tanks
Number of schools in
each district
School Garden Equipment
Number of schools in each
district
All schools
Tertiary and Non
Formal Education
Output 1: Instructors receive
incentive
Number of instructors
received incentives.
All instructors
Output 2: Centers
Materials provided Number of Districts All districts
Output 3: Capitation Grant
provided
Number of Tertiary and Non
Formal schools received
capitation grant.
All students
Gatsibo
Pre-Primary and
Primary Education
Output 1:
Teacher’s Salaries,
Statutory
Contributions and
other benefits are
paid regularly
Number of Primary Teachers
Paid
All teachers paid
Output 2: P6
Exams Centers
Supervised
Number of P6 exams centers
supervised
All exam centers
Output 3:
Capitation grant for
all public and
government-aided
primary students
paid
Number of Primary students
received capitation grant
All primary students
Output 4:
Capitation grant for
chalks for all public
and government-
aided primary
students provided
Number and schools day All primary schools
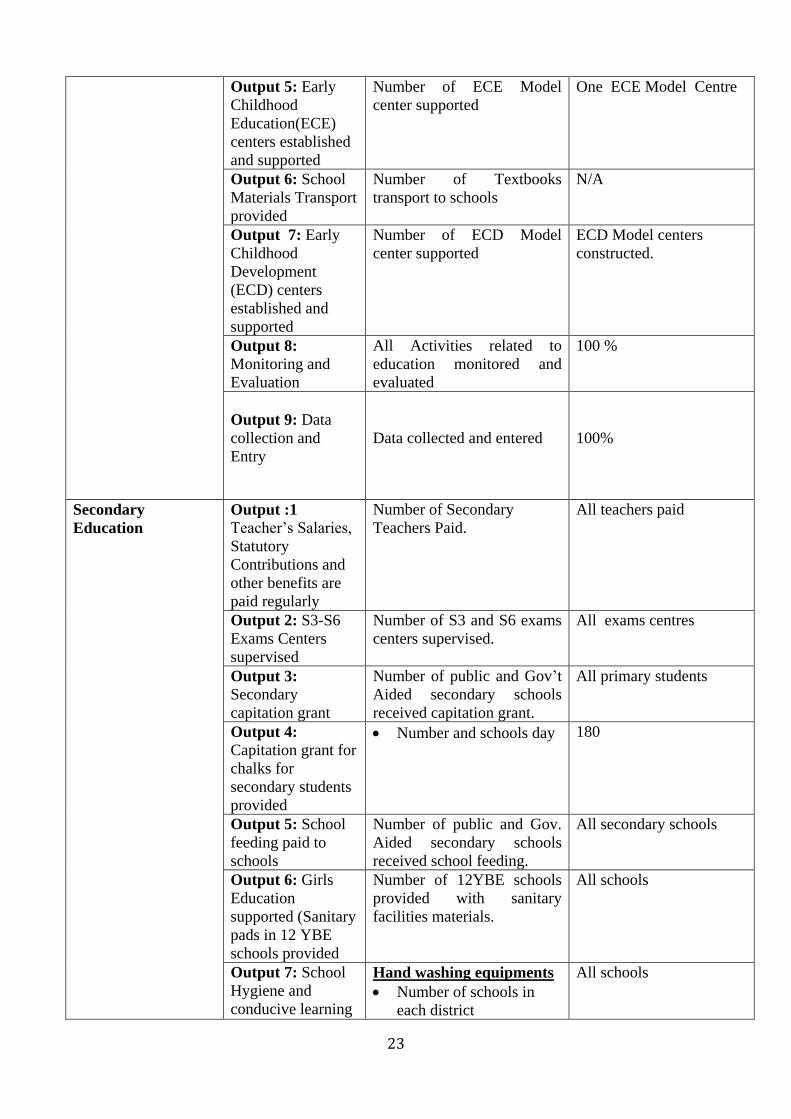
23
Output 5: Early
Childhood
Education(ECE)
centers established
and supported
Number of ECE Model
center supported
One ECE Model Centre
Output 6: School
Materials Transport
provided
Number of Textbooks
transport to schools
N/A
Output 7: Early
Childhood
Development
(ECD) centers
established and
supported
Number of ECD Model
center supported
ECD Model centers
constructed.
Output 8:
Monitoring and
Evaluation
All Activities related to
education monitored and
evaluated
100 %
Output 9: Data
collection and
Entry
Data collected and entered
100%
Secondary
Education
Output :1
Teacher’s Salaries,
Statutory
Contributions and
other benefits are
paid regularly
Number of Secondary
Teachers Paid.
All teachers paid
Output 2: S3-S6
Exams Centers
supervised
Number of S3 and S6 exams
centers supervised.
All exams centres
Output 3:
Secondary
capitation grant
Number of public and Gov’t
Aided secondary schools
received capitation grant.
All primary students
Output 4:
Capitation grant for
chalks for
secondary students
provided
Number and schools day 180
Output 5: School
feeding paid to
schools
Number of public and Gov.
Aided secondary schools
received school feeding.
All secondary schools
Output 6: Girls
Education
supported (Sanitary
pads in 12 YBE
schools provided
Number of 12YBE schools
provided with sanitary
facilities materials.
All schools
Output 7: School
Hygiene and
conducive learning
Hand washing equipments
Number of schools in
each district
All schools
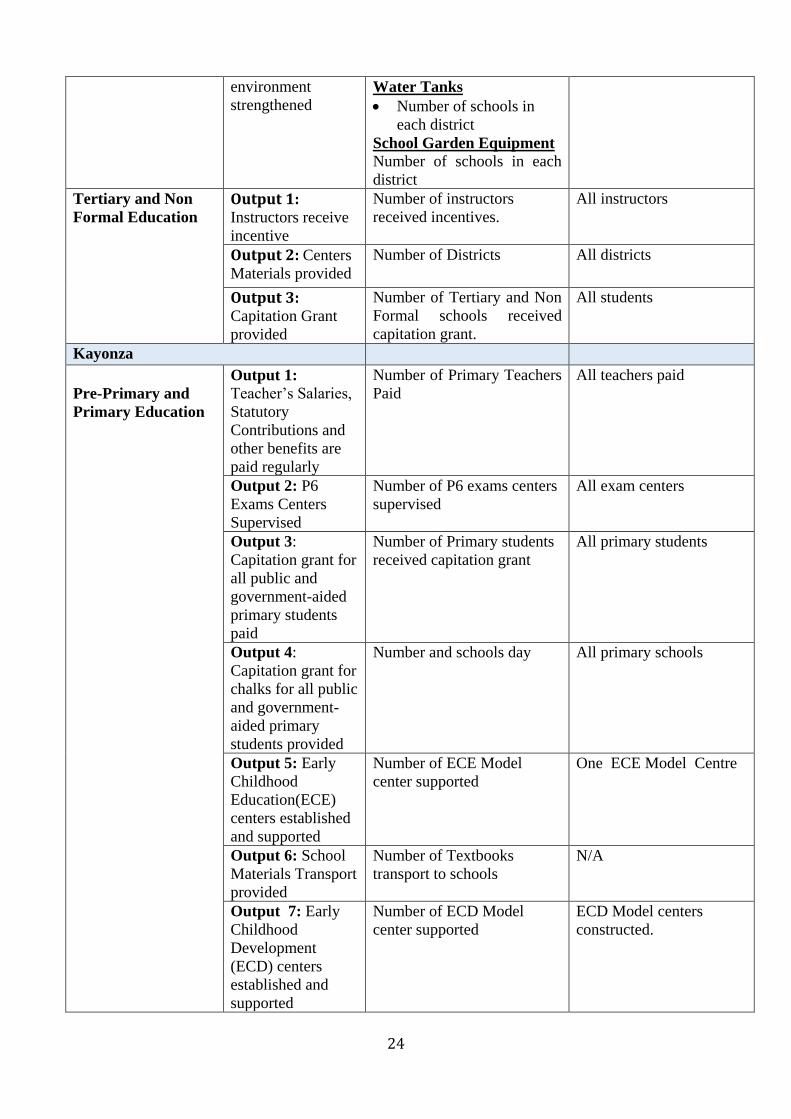
24
environment
strengthened
Water Tanks
Number of schools in
each district
School Garden Equipment
Number of schools in each
district
Tertiary and Non
Formal Education
Output 1: Instructors receive
incentive
Number of instructors
received incentives.
All instructors
Output 2: Centers
Materials provided Number of Districts All districts
Output 3: Capitation Grant
provided
Number of Tertiary and Non
Formal schools received
capitation grant.
All students
Kayonza
Pre-Primary and
Primary Education
Output 1:
Teacher’s Salaries,
Statutory
Contributions and
other benefits are
paid regularly
Number of Primary Teachers
Paid
All teachers paid
Output 2: P6
Exams Centers
Supervised
Number of P6 exams centers
supervised
All exam centers
Output 3:
Capitation grant for
all public and
government-aided
primary students
paid
Number of Primary students
received capitation grant
All primary students
Output 4:
Capitation grant for
chalks for all public
and government-
aided primary
students provided
Number and schools day All primary schools
Output 5: Early
Childhood
Education(ECE)
centers established
and supported
Number of ECE Model
center supported
One ECE Model Centre
Output 6: School
Materials Transport
provided
Number of Textbooks
transport to schools
N/A
Output 7: Early
Childhood
Development
(ECD) centers
established and
supported
Number of ECD Model
center supported
ECD Model centers
constructed.
25
Output 8:
Monitoring and
Evaluation
All Activities related to
education monitored and
evaluated
100 %
Output 9: Data
collection and
Entry
Data collected and entered
100%
Secondary
Education
Output :1
Teacher’s Salaries,
Statutory
Contributions and
other benefits are
paid regularly
Number of Secondary
Teachers Paid.
All teachers paid
Output 2: S3-S6
Exams Centers
supervised
Number of S3 and S6 exams
centers supervised.
All exams centres
Output 3:
Secondary
capitation grant
Number of public and Gov’t
Aided secondary schools
received capitation grant.
All primary students
Output 4:
Capitation grant for
chalks for
secondary students
provided
Number and schools day 180
Output 5: School
feeding paid to
schools
Number of public and Gov.
Aided secondary schools
received school feeding.
All secondary schools
Output 6: Girls
Education
supported (Sanitary
pads in 12 YBE
schools provided
Number of 12YBE schools
provided with sanitary
facilities materials.
All schools
Output 7: School
Hygiene and
conducive learning
environment
strengthened
Hand washing equipments
Number of schools in
each district
Water Tanks
Number of schools in
each district
School Garden Equipment
Number of schools in each
district
All schools
Tertiary and Non
Formal Education
Output 1: Instructors receive
incentive
Number of instructors
received incentives.
All instructors
Output 2: Centers
Materials provided Number of Districts All districts

26
Output 3: Capitation Grant
provided
Number of Tertiary and Non
Formal schools received
capitation grant.
All students
Kirehe
Pre-Primary and
Primary Education
Output 1:
Teacher’s Salaries,
Statutory
Contributions and
other benefits are
paid regularly
Number of Primary Teachers
Paid
All teachers paid
Output 2: P6
Exams Centers
Supervised
Number of P6 exams centers
supervised
All exam centers
Output 3:
Capitation grant for
all public and
government-aided
primary students
paid
Number of Primary students
received capitation grant
All primary students
Output 4:
Capitation grant for
chalks for all public
and government-
aided primary
students provided
Number and schools day All primary schools
Output 5: Early
Childhood
Education(ECE)
centers established
and supported
Number of ECE Model
center supported
One ECE Model Centre
Output 6: School
Materials Transport
provided
Number of Textbooks
transport to schools
N/A
Output 7: Early
Childhood
Development
(ECD) centers
established and
supported
Number of ECD Model
center supported
ECD Model centers
constructed.
Output 8:
Monitoring and
Evaluation
All Activities related to
education monitored and
evaluated
100 %
Output 9: Data
collection and
Entry
Data collected and entered
100%
Secondary Output :1 Number of Secondary All teachers paid
27
Education
Teacher’s Salaries,
Statutory
Contributions and
other benefits are
paid regularly
Teachers Paid.
Output 2: S3-S6
Exams Centers
supervised
Number of S3 and S6 exams
centers supervised.
All exams centres
Output 3:
Secondary
capitation grant
Number of public and Gov’t
Aided secondary schools
received capitation grant.
All primary students
Output 4:
Capitation grant for
chalks for
secondary students
provided
Number and schools day 180
Output 5: School
feeding paid to
schools
Number of public and Gov.
Aided secondary schools
received school feeding.
All secondary schools
Output 6: Girls
Education
supported (Sanitary
pads in 12 YBE
schools provided
Number of 12YBE schools
provided with sanitary
facilities materials.
All schools
Output 7: School
Hygiene and
conducive learning
environment
strengthened
Hand washing equipments
Number of schools in
each district
Water Tanks
Number of schools in
each district
School Garden Equipment
Number of schools in each
district
All schools
Tertiary and Non
Formal Education
Output 1: Instructors receive
incentive
Number of instructors
received incentives.
All instructors
Output 2: Centers
Materials provided Number of Districts All districts
Output 3: Capitation Grant
provided
Number of Tertiary and Non
Formal schools received
capitation grant.
All students
Nyagatare
Pre-Primary and
Primary Education
Output 1:
Teacher’s Salaries,
Statutory
Contributions and
other benefits are
paid regularly
Number of Primary Teachers
Paid
All teachers paid
Output 2: P6
Exams Centers
Supervised
Number of P6 exams centers
supervised
All exam centers

28
Output 3:
Capitation grant for
all public and
government-aided
primary students
paid
Number of Primary students
received capitation grant
All primary students
Output 4:
Capitation grant for
chalks for all public
and government-
aided primary
students provided
Number and schools day All primary schools
Output 5: Early
Childhood
Education(ECE)
centers established
and supported
Number of ECE Model
center supported
One ECE Model Centre
Output 6: School
Materials Transport
provided
Number of Textbooks
transport to schools
N/A
Output 7: Early
Childhood
Development
(ECD) centers
established and
supported
Number of ECD Model
center supported
ECD Model centers
constructed.
Output 8:
Monitoring and
Evaluation
All Activities related to
education monitored and
evaluated
100 %
Output 9: Data
collection and
Entry
Data collected and entered
100%
Secondary
Education
Output :1
Teacher’s Salaries,
Statutory
Contributions and
other benefits are
paid regularly
Number of Secondary
Teachers Paid.
All teachers paid
Output 2: S3-S6
Exams Centers
supervised
Number of S3 and S6 exams
centers supervised.
All exams centres
Output 3:
Secondary
capitation grant
Number of public and Gov’t
Aided secondary schools
received capitation grant.
All primary students
Output 4:
Capitation grant for
chalks for
secondary students
Number and schools day 180

29
provided
Output 5: School
feeding paid to
schools
Number of public and Gov.
Aided secondary schools
received school feeding.
All secondary schools
Output 6: Girls
Education
supported (Sanitary
pads in 12 YBE
schools provided
Number of 12YBE schools
provided with sanitary
facilities materials.
All schools
Output 7: School
Hygiene and
conducive learning
environment
strengthened
Hand washing equipments
Number of schools in
each district
Water Tanks
Number of schools in
each district
School Garden Equipment
Number of schools in each
district
All schools
Tertiary and Non
Formal Education
Output 1: Instructors receive
incentive
Number of instructors
received incentives.
All instructors
Output 2: Centers
Materials provided Number of Districts All districts
Output 3: Capitation Grant
provided
Number of Tertiary and Non
Formal schools received
capitation grant.
All students
Rwamagana
Pre-Primary and
Primary Education
Output 1:
Teacher’s Salaries,
Statutory
Contributions and
other benefits are
paid regularly
Number of Primary Teachers
Paid
All teachers paid
Output 2: P6
Exams Centers
Supervised
Number of P6 exams centers
supervised
All exam centers
Output 3:
Capitation grant for
all public and
government-aided
primary students
paid
Number of Primary students
received capitation grant
All primary students
Output 4:
Capitation grant for
chalks for all public
and government-
aided primary
students provided
Number and schools day All primary schools

30
Output 5: Early
Childhood
Education(ECE)
centers established
and supported
Number of ECE Model
center supported
One ECE Model Centre
Output 6: School
Materials Transport
provided
Number of Textbooks
transport to schools
N/A
Output 7: Early
Childhood
Development
(ECD) centers
established and
supported
Number of ECD Model
center supported
ECD Model centers
constructed.
Output 8:
Monitoring and
Evaluation
All Activities related to
education monitored and
evaluated
100 %
Output 9: Data
collection and
Entry
Data collected and entered
100%
Secondary
Education
Output :1
Teacher’s Salaries,
Statutory
Contributions and
other benefits are
paid regularly
Number of Secondary
Teachers Paid.
All teachers paid
Output 2: S3-S6
Exams Centers
supervised
Number of S3 and S6 exams
centers supervised.
All exams centres
Output 3:
Secondary
capitation grant
Number of public and Gov’t
Aided secondary schools
received capitation grant.
All primary students
Output 4:
Capitation grant for
chalks for
secondary students
provided
Number and schools day 180
Output 5: School
feeding paid to
schools
Number of public and Gov.
Aided secondary schools
received school feeding.
All secondary schools
Output 6: Girls
Education
supported (Sanitary
pads in 12 YBE
schools provided
Number of 12YBE schools
provided with sanitary
facilities materials.
All schools
Output 7: School
Hygiene and
conducive learning
Hand washing equipments
Number of schools in
each district
All schools

31
environment
strengthened
Water Tanks
Number of schools in
each district
School Garden Equipment
Number of schools in each
district
Tertiary and Non
Formal Education
Output 1: Instructors receive
incentive
Number of instructors
received incentives.
All instructors
Output 2: Centers
Materials provided Number of Districts All districts
Output 3: Capitation Grant
provided
Number of Tertiary and Non
Formal schools received
capitation grant.
All students
Huye
Pre-Primary and
Primary Education
Output 1:
Teacher’s Salaries,
Statutory
Contributions and
other benefits are
paid regularly
Number of Primary Teachers
Paid
All teachers paid
Output 2: P6
Exams Centers
Supervised
Number of P6 exams centers
supervised
All exam centers
Output 3:
Capitation grant for
all public and
government-aided
primary students
paid
Number of Primary students
received capitation grant
All primary students
Output 4:
Capitation grant for
chalks for all public
and government-
aided primary
students provided
Number and schools day All primary schools
Output 5: Early
Childhood
Education(ECE)
centers established
and supported
Number of ECE Model
center supported
One ECE Model Centre
Output 6: School
Materials Transport
provided
Number of Textbooks
transport to schools
N/A
Output 7: Early
Childhood
Development
(ECD) centers
established and
supported
Number of ECD Model
center supported
ECD Model centers
constructed.

32
Output 8:
Monitoring and
Evaluation
All Activities related to
education monitored and
evaluated
100 %
Output 9: Data
collection and
Entry
Data collected and entered
100%
Secondary
Education
Output :1
Teacher’s Salaries,
Statutory
Contributions and
other benefits are
paid regularly
Number of Secondary
Teachers Paid.
All teachers paid
Output 2: S3-S6
Exams Centers
supervised
Number of S3 and S6 exams
centers supervised.
All exams centres
Output 3:
Secondary
capitation grant
Number of public and Gov’t
Aided secondary schools
received capitation grant.
All primary students
Output 4:
Capitation grant for
chalks for
secondary students
provided
Number and schools day 180
Output 5: School
feeding paid to
schools
Number of public and Gov.
Aided secondary schools
received school feeding.
All secondary schools
Output 6: Girls
Education
supported (Sanitary
pads in 12 YBE
schools provided
Number of 12YBE schools
provided with sanitary
facilities materials.
All schools
Output 7: School
Hygiene and
conducive learning
environment
strengthened
Hand washing equipments
Number of schools in
each district
Water Tanks
Number of schools in
each district
School Garden Equipment
Number of schools in each
district
All schools
Tertiary and Non
Formal Education
Output 1: Instructors receive
incentive
Number of instructors
received incentives.
All instructors
Output 2: Centers
Materials provided Number of Districts All districts
Output 3: Capitation Grant
provided
Number of Tertiary and Non
Formal schools received
capitation grant.
All students
Nyamagabe

33
Pre-Primary and
Primary Education
Output 1:
Teacher’s Salaries,
Statutory
Contributions and
other benefits are
paid regularly
Number of Primary Teachers
Paid
All teachers paid
Output 2: P6
Exams Centers
Supervised
Number of P6 exams centers
supervised
All exam centers
Output 3:
Capitation grant for
all public and
government-aided
primary students
paid
Number of Primary students
received capitation grant
All primary students
Output 4:
Capitation grant for
chalks for all public
and government-
aided primary
students provided
Number and schools day All primary schools
Output 5: Early
Childhood
Education(ECE)
centers established
and supported
Number of ECE Model
center supported
One ECE Model Centre
Output 6: School
Materials Transport
provided
Number of Textbooks
transport to schools
N/A
Output 7: Early
Childhood
Development
(ECD) centers
established and
supported
Number of ECD Model
center supported
ECD Model centers
constructed.
Output 8:
Monitoring and
Evaluation
All Activities related to
education monitored and
evaluated
100 %
Output 9: Data
collection and
Entry
Data collected and entered
100%
Secondary
Education
Output :1
Teacher’s Salaries,
Statutory
Contributions and
other benefits are
paid regularly
Number of Secondary
Teachers Paid.
All teachers paid
34
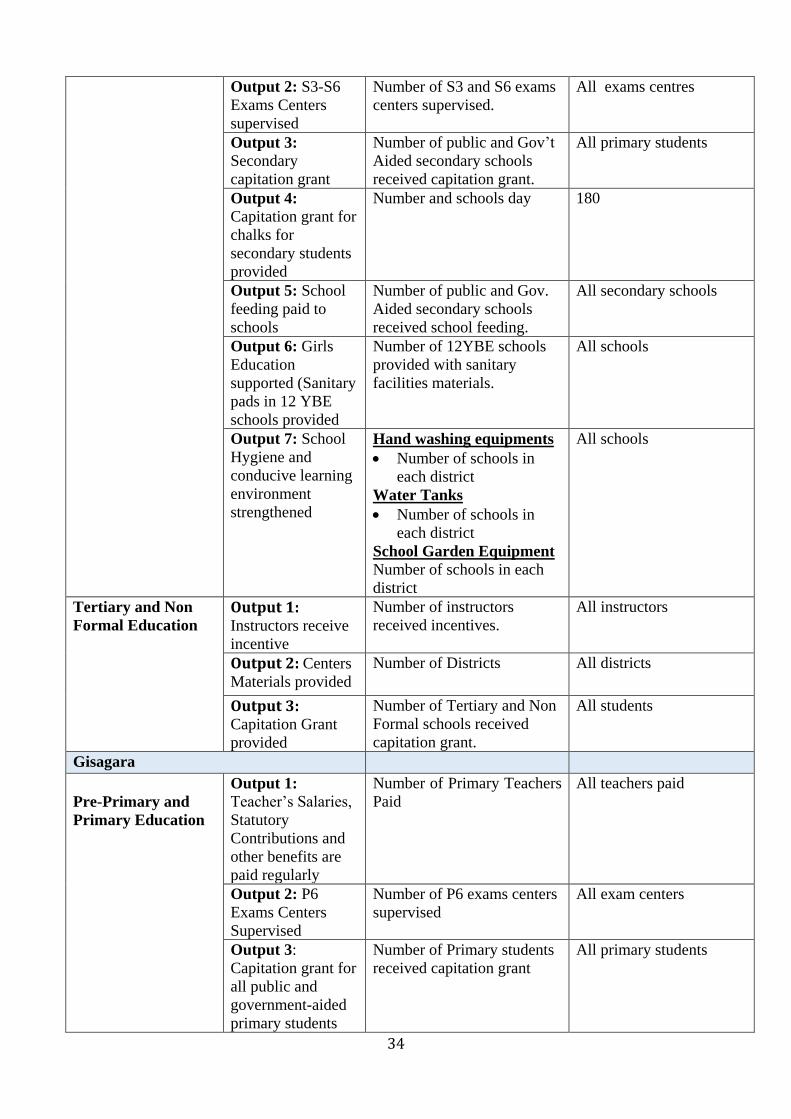
Output 2: S3-S6
Exams Centers
supervised
Number of S3 and S6 exams
centers supervised.
All exams centres
Output 3:
Secondary
capitation grant
Number of public and Gov’t
Aided secondary schools
received capitation grant.
All primary students
Output 4:
Capitation grant for
chalks for
secondary students
provided
Number and schools day 180
Output 5: School
feeding paid to
schools
Number of public and Gov.
Aided secondary schools
received school feeding.
All secondary schools
Output 6: Girls
Education
supported (Sanitary
pads in 12 YBE
schools provided
Number of 12YBE schools
provided with sanitary
facilities materials.
All schools
Output 7: School
Hygiene and
conducive learning
environment
strengthened
Hand washing equipments
Number of schools in
each district
Water Tanks
Number of schools in
each district
School Garden Equipment
Number of schools in each
district
All schools
Tertiary and Non
Formal Education
Output 1: Instructors receive
incentive
Number of instructors
received incentives.
All instructors
Output 2: Centers
Materials provided Number of Districts All districts
Output 3: Capitation Grant
provided
Number of Tertiary and Non
Formal schools received
capitation grant.
All students
Gisagara
Pre-Primary and
Primary Education
Output 1:
Teacher’s Salaries,
Statutory
Contributions and
other benefits are
paid regularly
Number of Primary Teachers
Paid
All teachers paid
Output 2: P6
Exams Centers
Supervised
Number of P6 exams centers
supervised
All exam centers
Output 3:
Capitation grant for
all public and
government-aided
primary students
Number of Primary students
received capitation grant
All primary students

35
paid
Output 4:
Capitation grant for
chalks for all public
and government-
aided primary
students provided
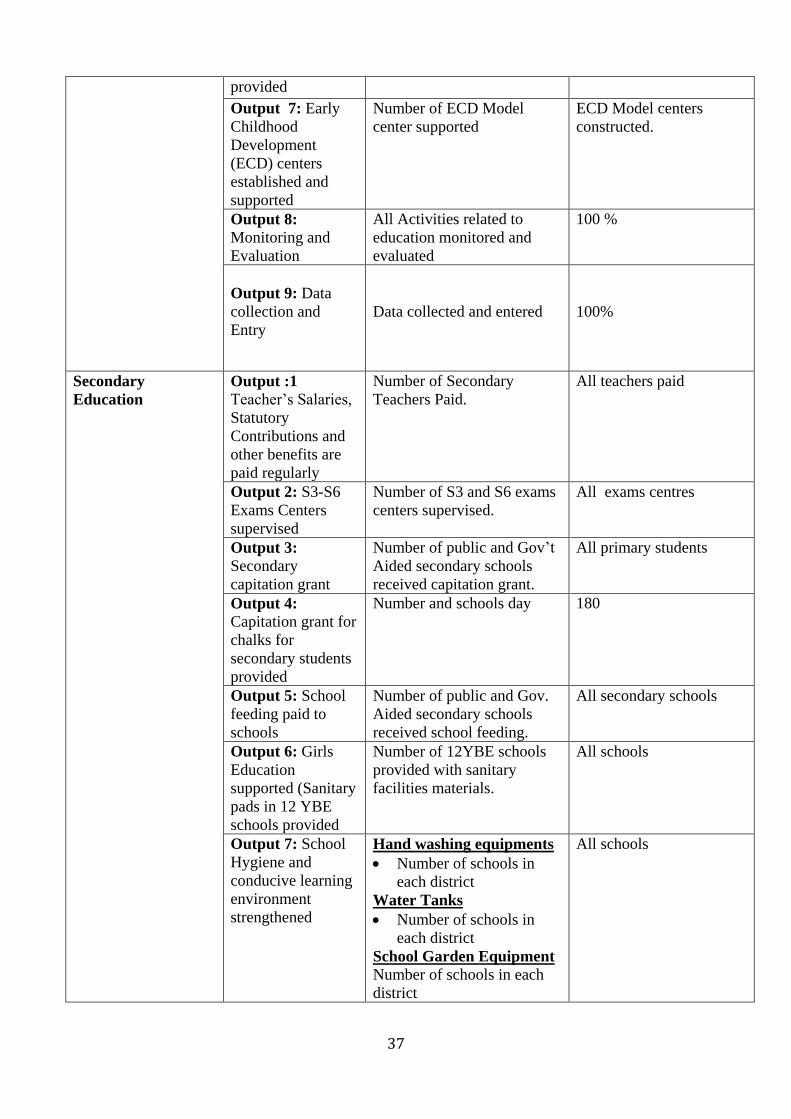
Number and schools day All primary schools
Output 5: Early
Childhood
Education(ECE)
centers established
and supported
Number of ECE Model
center supported
One ECE Model Centre
Output 6: School
Materials Transport
provided
Number of Textbooks
transport to schools
N/A
Output 7: Early
Childhood
Development
(ECD) centers
established and
supported
Number of ECD Model
center supported
ECD Model centers
constructed.
Output 8:
Monitoring and
Evaluation
All Activities related to
education monitored and
evaluated
100 %
Output 9: Data
collection and
Entry
Data collected and entered
100%
Secondary
Education
Output :1
Teacher’s Salaries,
Statutory
Contributions and
other benefits are
paid regularly
Number of Secondary
Teachers Paid.
All teachers paid
Output 2: S3-S6
Exams Centers
supervised
Number of S3 and S6 exams
centers supervised.
All exams centres
Output 3:
Secondary
capitation grant
Number of public and Gov’t
Aided secondary schools
received capitation grant.
All primary students
Output 4:
Capitation grant for
chalks for
secondary students
provided
Number and schools day 180
Output 5: School
feeding paid to
schools
Number of public and Gov.
Aided secondary schools
received school feeding.
All secondary schools

36
Output 6: Girls
Education
supported (Sanitary
pads in 12 YBE
schools provided
Number of 12YBE schools
provided with sanitary
facilities materials.
All schools
Output 7: School
Hygiene and
conducive learning
environment
strengthened
Hand washing equipments
Number of schools in
each district
Water Tanks
Number of schools in
each district
School Garden Equipment
Number of schools in each
district
All schools
Tertiary and Non
Formal Education
Output 1: Instructors receive
incentive
Number of instructors
received incentives.
All instructors
Output 2: Centers
Materials provided Number of Districts All districts
Output 3: Capitation Grant
provided
Number of Tertiary and Non
Formal schools received
capitation grant.
All students
Muhanga
Pre-Primary and
Primary Education
Output 1:
Teacher’s Salaries,
Statutory
Contributions and
other benefits are
paid regularly
Number of Primary Teachers
Paid
All teachers paid
Output 2: P6
Exams Centers
Supervised
Number of P6 exams centers
supervised
All exam centers
Output 3:
Capitation grant for
all public and
government-aided
primary students
paid
Number of Primary students
received capitation grant
All primary students
Output 4:
Capitation grant for
chalks for all public
and government-
aided primary
students provided
Number and schools day All primary schools
Output 5: Early
Childhood
Education(ECE)
centers established
and supported
Number of ECE Model
center supported
One ECE Model Centre
Output 6: School
Materials Transport
Number of Textbooks
transport to schools
N/A
37
provided
Output 7: Early
Childhood
Development
(ECD) centers
established and
supported
Number of ECD Model
center supported
ECD Model centers
constructed.
Output 8:
Monitoring and
Evaluation
All Activities related to
education monitored and
evaluated
100 %
Output 9: Data
collection and
Entry
Data collected and entered
100%
Secondary
Education
Output :1
Teacher’s Salaries,
Statutory
Contributions and
other benefits are
paid regularly
Number of Secondary
Teachers Paid.
All teachers paid
Output 2: S3-S6
Exams Centers
supervised
Number of S3 and S6 exams
centers supervised.
All exams centres
Output 3:
Secondary
capitation grant
Number of public and Gov’t
Aided secondary schools
received capitation grant.
All primary students
Output 4:
Capitation grant for
chalks for
secondary students
provided
Number and schools day 180
Output 5: School
feeding paid to
schools
Number of public and Gov.
Aided secondary schools
received school feeding.
All secondary schools
Output 6: Girls
Education
supported (Sanitary
pads in 12 YBE
schools provided
Number of 12YBE schools
provided with sanitary
facilities materials.
All schools
Output 7: School
Hygiene and
conducive learning
environment
strengthened
Hand washing equipments
Number of schools in
each district
Water Tanks
Number of schools in
each district
School Garden Equipment
Number of schools in each
district
All schools

38
Tertiary and Non
Formal Education
Output 1: Instructors receive
incentive
Number of instructors
received incentives.
All instructors
Output 2: Centers
Materials provided Number of Districts All districts
Output 3: Capitation Grant
provided
Number of Tertiary and Non
Formal schools received
capitation grant.
All students
Kamonyi
Pre-Primary and
Primary Education
Output 1:
Teacher’s Salaries,
Statutory
Contributions and
other benefits are
paid regularly
Number of Primary Teachers
Paid
All teachers paid
Output 2: P6
Exams Centers
Supervised
Number of P6 exams centers
supervised
All exam centers
Output 3:
Capitation grant for
all public and
government-aided
primary students
paid
Number of Primary students
received capitation grant
All primary students
Output 4:
Capitation grant for
chalks for all public
and government-
aided primary
students provided
Number and schools day All primary schools
Output 5: Early
Childhood
Education(ECE)
centers established
and supported
Number of ECE Model
center supported
One ECE Model Centre
Output 6: School
Materials Transport
provided
Number of Textbooks
transport to schools
N/A
Output 7: Early
Childhood
Development
(ECD) centers
established and
supported
Number of ECD Model
center supported
ECD Model centers
constructed.
Output 8:
Monitoring and
Evaluation
All Activities related to
education monitored and
evaluated
100 %
Output 9: Data
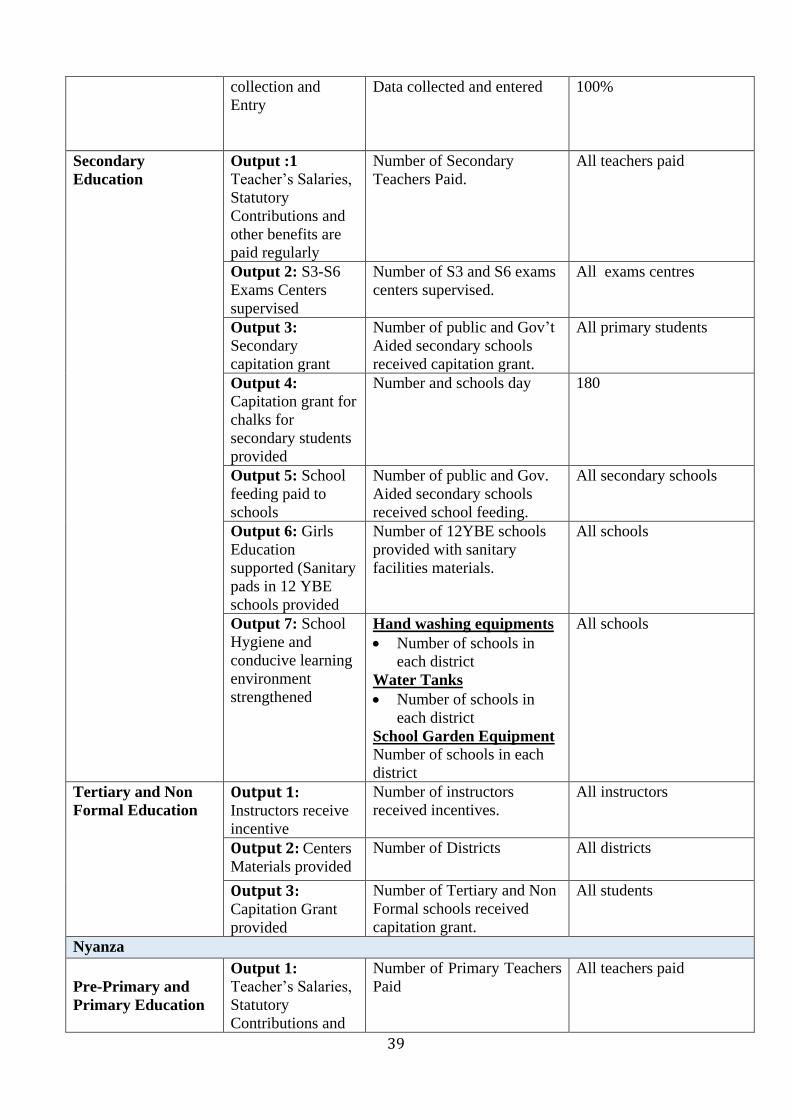
39
collection and
Entry
Data collected and entered 100%
Secondary
Education
Output :1
Teacher’s Salaries,
Statutory
Contributions and
other benefits are
paid regularly
Number of Secondary
Teachers Paid.
All teachers paid
Output 2: S3-S6
Exams Centers
supervised
Number of S3 and S6 exams
centers supervised.
All exams centres
Output 3:
Secondary
capitation grant
Number of public and Gov’t
Aided secondary schools
received capitation grant.
All primary students
Output 4:
Capitation grant for
chalks for
secondary students
provided
Number and schools day 180
Output 5: School
feeding paid to
schools
Number of public and Gov.
Aided secondary schools
received school feeding.
All secondary schools
Output 6: Girls
Education
supported (Sanitary
pads in 12 YBE
schools provided
Number of 12YBE schools
provided with sanitary
facilities materials.
All schools
Output 7: School
Hygiene and
conducive learning
environment
strengthened
Hand washing equipments
Number of schools in
each district
Water Tanks
Number of schools in
each district
School Garden Equipment
Number of schools in each
district
All schools
Tertiary and Non
Formal Education
Output 1: Instructors receive
incentive
Number of instructors
received incentives.
All instructors
Output 2: Centers
Materials provided Number of Districts All districts
Output 3: Capitation Grant
provided
Number of Tertiary and Non
Formal schools received
capitation grant.
All students
Nyanza
Pre-Primary and
Primary Education
Output 1:
Teacher’s Salaries,
Statutory
Contributions and
Number of Primary Teachers
Paid
All teachers paid
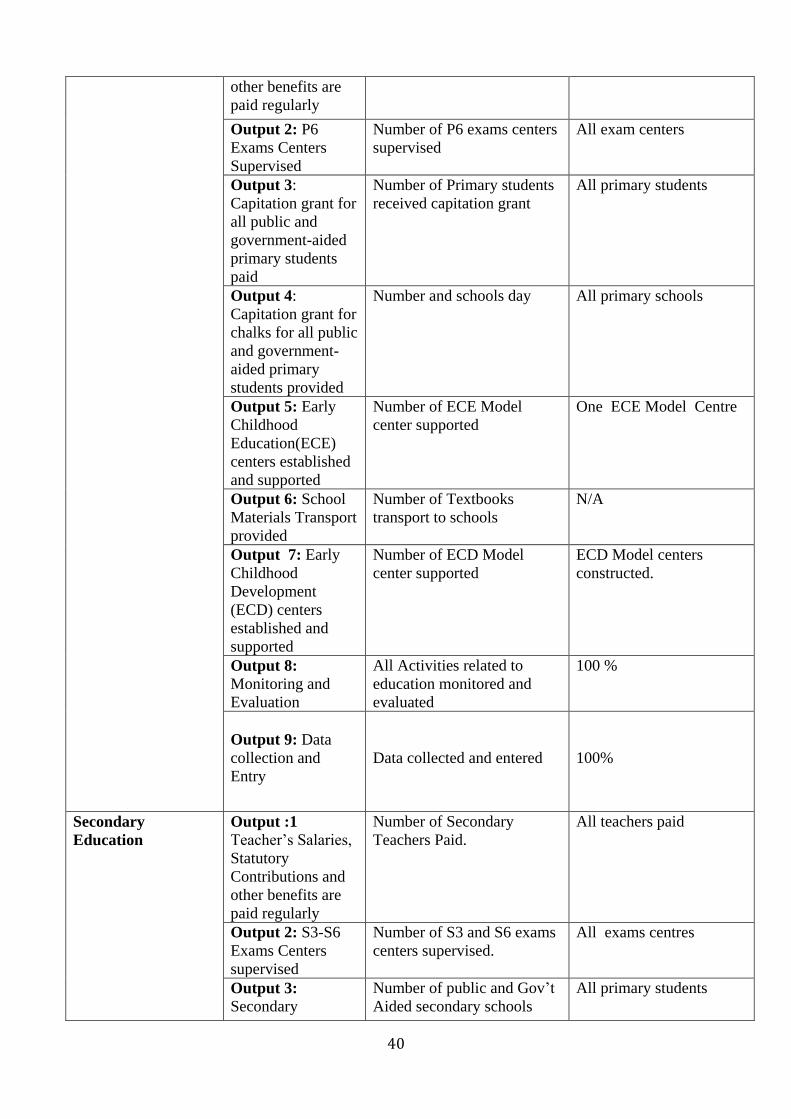
40
other benefits are
paid regularly
Output 2: P6
Exams Centers
Supervised
Number of P6 exams centers
supervised
All exam centers
Output 3:
Capitation grant for
all public and
government-aided
primary students
paid
Number of Primary students
received capitation grant
All primary students
Output 4:
Capitation grant for
chalks for all public
and government-
aided primary
students provided
Number and schools day All primary schools
Output 5: Early
Childhood
Education(ECE)
centers established
and supported
Number of ECE Model
center supported
One ECE Model Centre
Output 6: School
Materials Transport
provided
Number of Textbooks
transport to schools
N/A
Output 7: Early
Childhood
Development
(ECD) centers
established and
supported
Number of ECD Model
center supported
ECD Model centers
constructed.
Output 8:
Monitoring and
Evaluation
All Activities related to
education monitored and
evaluated
100 %
Output 9: Data
collection and
Entry
Data collected and entered
100%
Secondary
Education
Output :1
Teacher’s Salaries,
Statutory
Contributions and
other benefits are
paid regularly
Number of Secondary
Teachers Paid.
All teachers paid
Output 2: S3-S6
Exams Centers
supervised
Number of S3 and S6 exams
centers supervised.
All exams centres
Output 3:
Secondary
Number of public and Gov’t
Aided secondary schools
All primary students
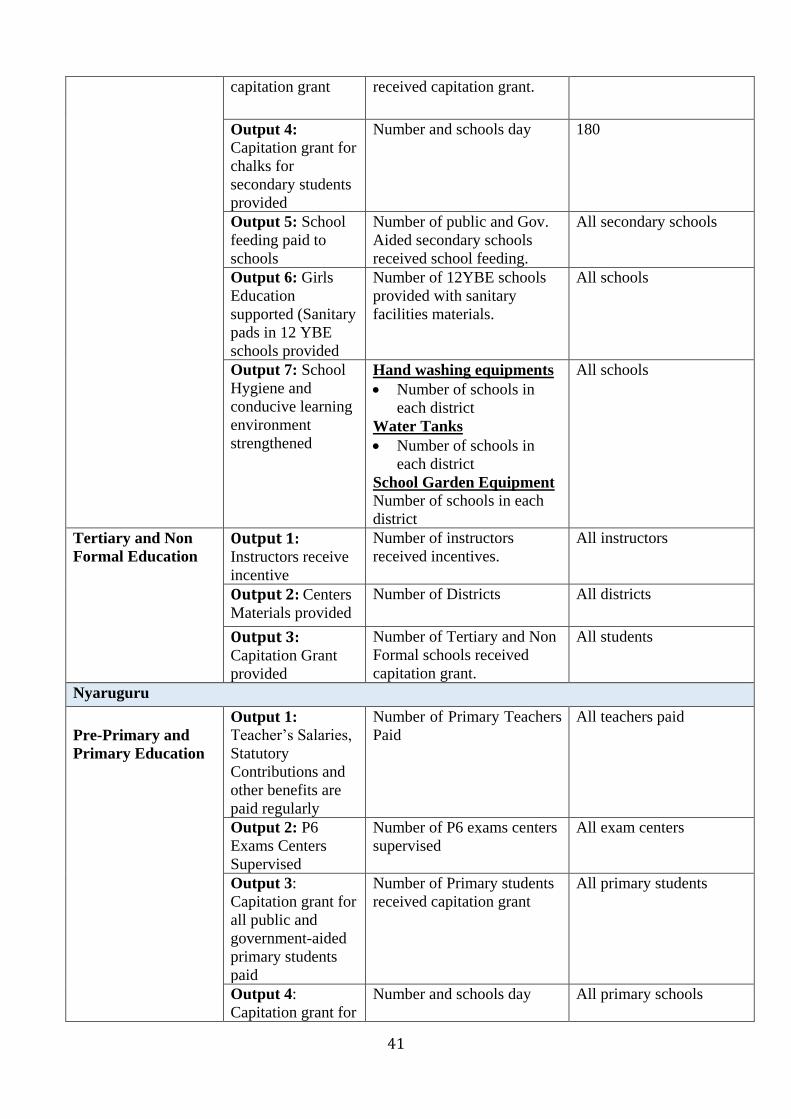
41
capitation grant received capitation grant.
Output 4:
Capitation grant for
chalks for
secondary students
provided
Number and schools day 180
Output 5: School
feeding paid to
schools
Number of public and Gov.
Aided secondary schools
received school feeding.
All secondary schools
Output 6: Girls
Education
supported (Sanitary
pads in 12 YBE
schools provided
Number of 12YBE schools
provided with sanitary
facilities materials.
All schools
Output 7: School
Hygiene and
conducive learning
environment
strengthened
Hand washing equipments
Number of schools in
each district
Water Tanks
Number of schools in
each district
School Garden Equipment
Number of schools in each
district
All schools
Tertiary and Non
Formal Education
Output 1: Instructors receive
incentive
Number of instructors
received incentives.
All instructors
Output 2: Centers
Materials provided Number of Districts All districts
Output 3: Capitation Grant
provided
Number of Tertiary and Non
Formal schools received
capitation grant.
All students
Nyaruguru
Pre-Primary and
Primary Education
Output 1:
Teacher’s Salaries,
Statutory
Contributions and
other benefits are
paid regularly
Number of Primary Teachers
Paid
All teachers paid
Output 2: P6
Exams Centers
Supervised
Number of P6 exams centers
supervised
All exam centers
Output 3:
Capitation grant for
all public and
government-aided
primary students
paid
Number of Primary students
received capitation grant
All primary students
Output 4:
Capitation grant for
Number and schools day All primary schools
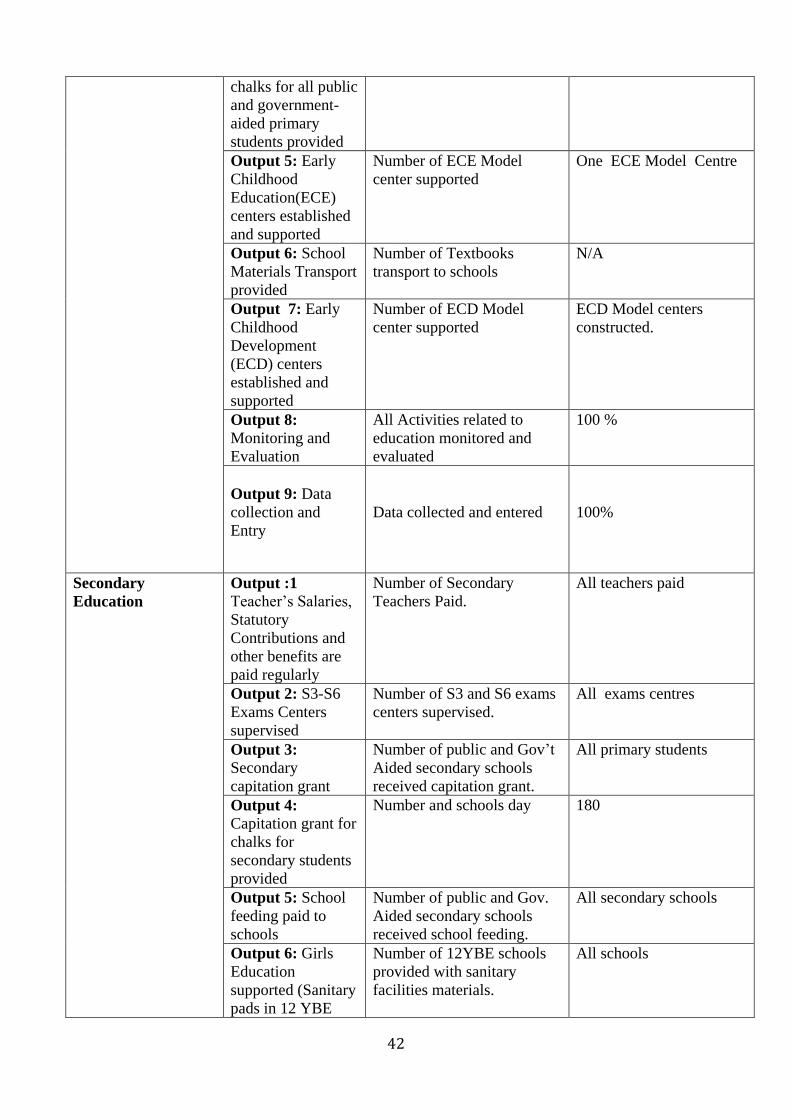
42
chalks for all public
and government-
aided primary
students provided
Output 5: Early
Childhood
Education(ECE)
centers established
and supported
Number of ECE Model
center supported
One ECE Model Centre
Output 6: School
Materials Transport
provided
Number of Textbooks
transport to schools
N/A
Output 7: Early
Childhood
Development
(ECD) centers
established and
supported
Number of ECD Model
center supported
ECD Model centers
constructed.
Output 8:
Monitoring and
Evaluation
All Activities related to
education monitored and
evaluated
100 %
Output 9: Data
collection and
Entry
Data collected and entered
100%
Secondary
Education
Output :1
Teacher’s Salaries,
Statutory
Contributions and
other benefits are
paid regularly
Number of Secondary
Teachers Paid.
All teachers paid
Output 2: S3-S6
Exams Centers
supervised
Number of S3 and S6 exams
centers supervised.
All exams centres
Output 3:
Secondary
capitation grant
Number of public and Gov’t
Aided secondary schools
received capitation grant.
All primary students
Output 4:
Capitation grant for
chalks for
secondary students
provided
Number and schools day 180
Output 5: School
feeding paid to
schools
Number of public and Gov.
Aided secondary schools
received school feeding.
All secondary schools
Output 6: Girls
Education
supported (Sanitary
pads in 12 YBE
Number of 12YBE schools
provided with sanitary
facilities materials.
All schools
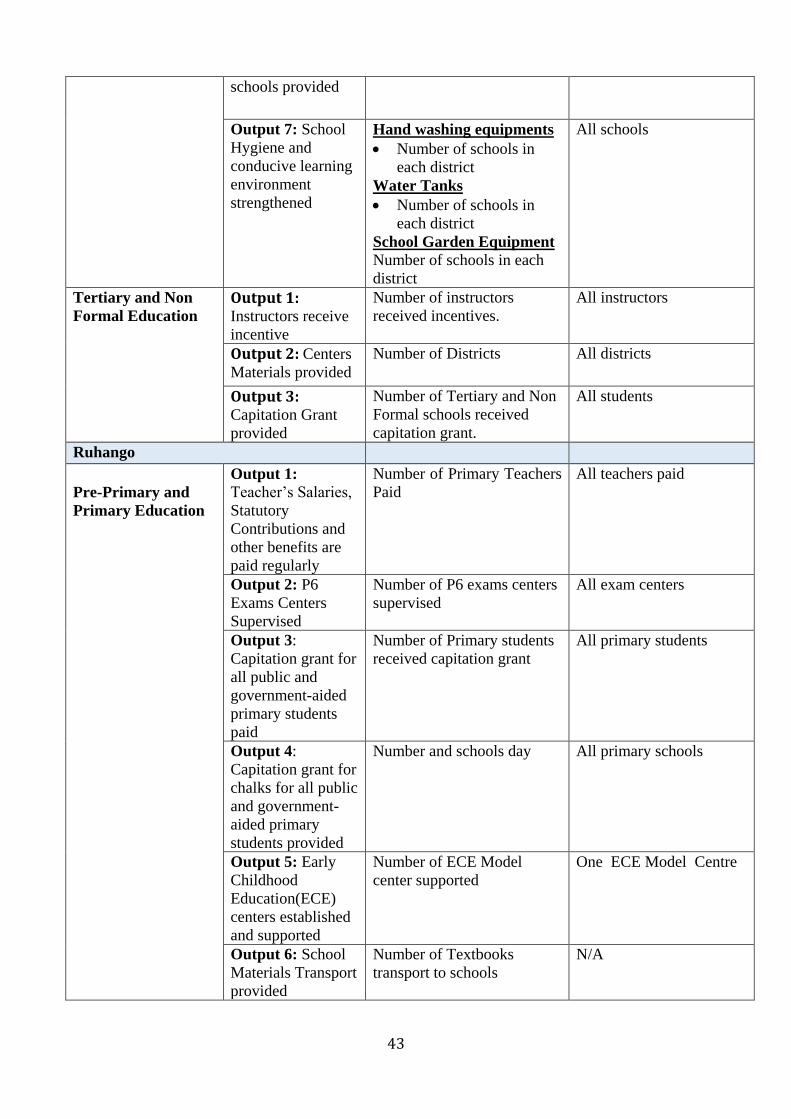
43
schools provided
Output 7: School
Hygiene and
conducive learning
environment
strengthened
Hand washing equipments
Number of schools in
each district
Water Tanks
Number of schools in
each district
School Garden Equipment
Number of schools in each
district
All schools
Tertiary and Non
Formal Education
Output 1: Instructors receive
incentive
Number of instructors
received incentives.
All instructors
Output 2: Centers
Materials provided Number of Districts All districts
Output 3: Capitation Grant
provided
Number of Tertiary and Non
Formal schools received
capitation grant.
All students
Ruhango
Pre-Primary and
Primary Education
Output 1:
Teacher’s Salaries,
Statutory
Contributions and
other benefits are
paid regularly
Number of Primary Teachers
Paid
All teachers paid
Output 2: P6
Exams Centers
Supervised
Number of P6 exams centers
supervised
All exam centers
Output 3:
Capitation grant for
all public and
government-aided
primary students
paid
Number of Primary students
received capitation grant
All primary students
Output 4:
Capitation grant for
chalks for all public
and government-
aided primary
students provided
Number and schools day All primary schools
Output 5: Early
Childhood
Education(ECE)
centers established
and supported
Number of ECE Model
center supported
One ECE Model Centre
Output 6: School
Materials Transport
provided
Number of Textbooks
transport to schools
N/A
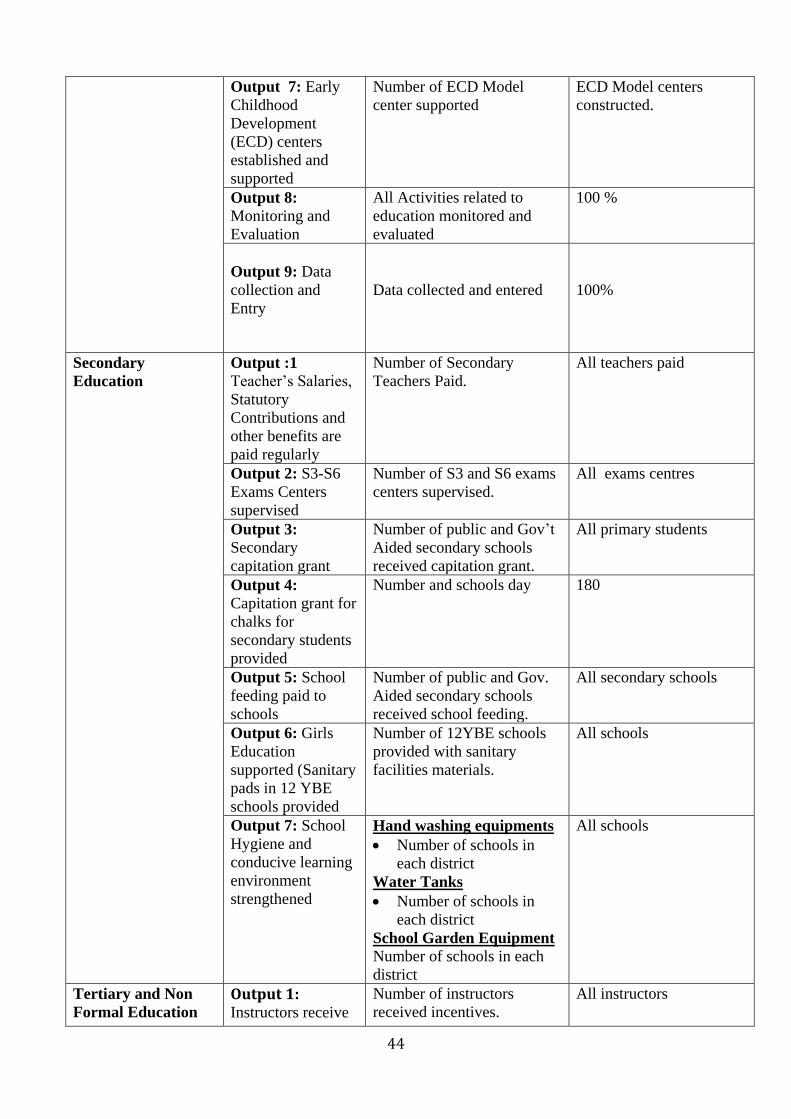
44
Output 7: Early
Childhood
Development
(ECD) centers
established and
supported
Number of ECD Model
center supported
ECD Model centers
constructed.
Output 8:
Monitoring and
Evaluation
All Activities related to
education monitored and
evaluated
100 %
Output 9: Data
collection and
Entry
Data collected and entered
100%
Secondary
Education
Output :1
Teacher’s Salaries,
Statutory
Contributions and
other benefits are
paid regularly
Number of Secondary
Teachers Paid.
All teachers paid
Output 2: S3-S6
Exams Centers
supervised
Number of S3 and S6 exams
centers supervised.
All exams centres
Output 3:
Secondary
capitation grant
Number of public and Gov’t
Aided secondary schools
received capitation grant.
All primary students
Output 4:
Capitation grant for
chalks for
secondary students
provided
Number and schools day 180
Output 5: School
feeding paid to
schools
Number of public and Gov.
Aided secondary schools
received school feeding.
All secondary schools
Output 6: Girls
Education
supported (Sanitary
pads in 12 YBE
schools provided
Number of 12YBE schools
provided with sanitary
facilities materials.
All schools
Output 7: School
Hygiene and
conducive learning
environment
strengthened
Hand washing equipments
Number of schools in
each district
Water Tanks
Number of schools in
each district
School Garden Equipment
Number of schools in each
district
All schools
Tertiary and Non
Formal Education
Output 1: Instructors receive
Number of instructors
received incentives.
All instructors

45
incentive
Output 2: Centers
Materials provided Number of Districts All districts
Output 3: Capitation Grant
provided
Number of Tertiary and Non
Formal schools received
capitation grant.
All students
Rusizi
Pre-Primary and
Primary Education
Output 1:
Teacher’s Salaries,
Statutory
Contributions and
other benefits are
paid regularly
Number of Primary Teachers
Paid
All teachers paid
Output 2: P6
Exams Centers
Supervised
Number of P6 exams centers
supervised
All exam centers
Output 3:
Capitation grant for
all public and
government-aided
primary students
paid
Number of Primary students
received capitation grant
All primary students
Output 4:
Capitation grant for
chalks for all public
and government-
aided primary
students provided
Number and schools day All primary schools
Output 5: Early
Childhood
Education(ECE)
centers established
and supported
Number of ECE Model
center supported
One ECE Model Centre
Output 6: School
Materials Transport
provided
Number of Textbooks
transport to schools
N/A
Output 7: Early
Childhood
Development
(ECD) centers
established and
supported
Number of ECD Model
center supported
ECD Model centers
constructed.
Output 8:
Monitoring and
Evaluation
All Activities related to
education monitored and
evaluated
100 %
Output 9: Data
collection and
Entry
Data collected and entered
100%

46
Secondary
Education
Output :1
Teacher’s Salaries,
Statutory
Contributions and
other benefits are
paid regularly
Number of Secondary
Teachers Paid.
All teachers paid
Output 2: S3-S6
Exams Centers
supervised
Number of S3 and S6 exams
centers supervised.
All exams centres
Output 3:
Secondary
capitation grant
Number of public and Gov’t
Aided secondary schools
received capitation grant.
All primary students
Output 4:
Capitation grant for
chalks for
secondary students
provided
Number and schools day 180
Output 5: School
feeding paid to
schools
Number of public and Gov.
Aided secondary schools
received school feeding.
All secondary schools
Output 6: Girls
Education
supported (Sanitary
pads in 12 YBE
schools provided
Number of 12YBE schools
provided with sanitary
facilities materials.
All schools
Output 7: School
Hygiene and
conducive learning
environment
strengthened
Hand washing equipments
Number of schools in
each district
Water Tanks
Number of schools in
each district
School Garden Equipment
Number of schools in each
district
All schools
Tertiary and Non
Formal Education
Output 1: Instructors receive
incentive
Number of instructors
received incentives.
All instructors
Output 2: Centers
Materials provided Number of Districts All districts
Output 3: Capitation Grant
provided
Number of Tertiary and Non
Formal schools received
capitation grant.
All students
Nyabihu
Pre-Primary and
Primary Education
Output 1:
Teacher’s Salaries,
Statutory
Contributions and
other benefits are
Number of Primary Teachers
Paid
All teachers paid
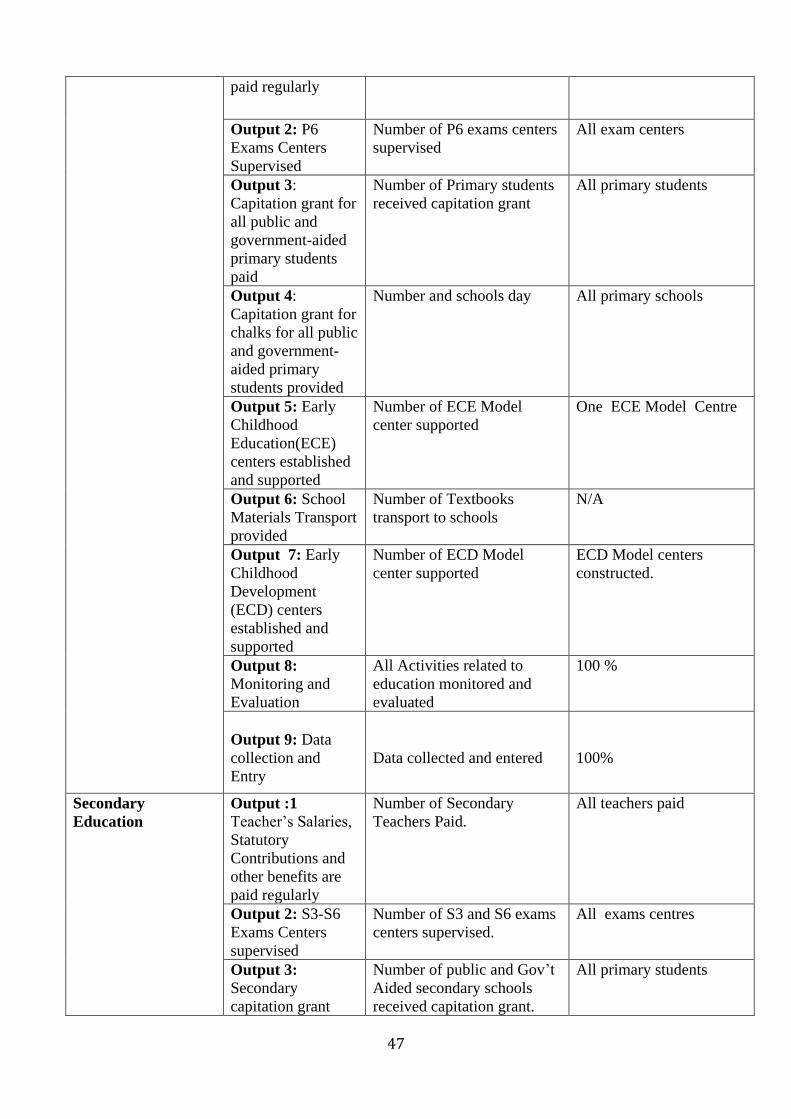
47
paid regularly
Output 2: P6
Exams Centers
Supervised
Number of P6 exams centers
supervised
All exam centers
Output 3:
Capitation grant for
all public and
government-aided
primary students
paid
Number of Primary students
received capitation grant
All primary students
Output 4:
Capitation grant for
chalks for all public
and government-
aided primary
students provided
Number and schools day All primary schools
Output 5: Early
Childhood
Education(ECE)
centers established
and supported
Number of ECE Model
center supported
One ECE Model Centre
Output 6: School
Materials Transport
provided
Number of Textbooks
transport to schools
N/A
Output 7: Early
Childhood
Development
(ECD) centers
established and
supported
Number of ECD Model
center supported
ECD Model centers
constructed.
Output 8:
Monitoring and
Evaluation
All Activities related to
education monitored and
evaluated
100 %
Output 9: Data
collection and
Entry
Data collected and entered
100%
Secondary
Education
Output :1
Teacher’s Salaries,
Statutory
Contributions and
other benefits are
paid regularly
Number of Secondary
Teachers Paid.
All teachers paid
Output 2: S3-S6
Exams Centers
supervised
Number of S3 and S6 exams
centers supervised.
All exams centres
Output 3:
Secondary
capitation grant
Number of public and Gov’t
Aided secondary schools
received capitation grant.
All primary students

48
Output 4:
Capitation grant for
chalks for
secondary students
provided
Number and schools day 180
Output 5: School
feeding paid to
schools
Number of public and Gov.
Aided secondary schools
received school feeding.
All secondary schools
Output 6: Girls
Education
supported (Sanitary
pads in 12 YBE
schools provided
Number of 12YBE schools
provided with sanitary
facilities materials.
All schools
Output 7: School
Hygiene and
conducive learning
environment
strengthened
Hand washing equipments
Number of schools in
each district
Water Tanks
Number of schools in
each district
School Garden Equipment
Number of schools in each
district
All schools
Tertiary and Non
Formal Education
Output 1: Instructors receive
incentive
Number of instructors
received incentives.
All instructors
Output 2: Centers
Materials provided Number of Districts All districts
Output 3: Capitation Grant
provided
Number of Tertiary and Non
Formal schools received
capitation grant.
All students
Rubavu
Pre-Primary and
Primary Education
Output 1:
Teacher’s Salaries,
Statutory
Contributions and
other benefits are
paid regularly
Number of Primary Teachers
Paid
All teachers paid
Output 2: P6
Exams Centers
Supervised
Number of P6 exams centers
supervised
All exam centers
Output 3:
Capitation grant for
all public and
government-aided
primary students
paid
Number of Primary students
received capitation grant
All primary students
Output 4:
Capitation grant for
chalks for all public
and government-
aided primary
Number and schools day All primary schools
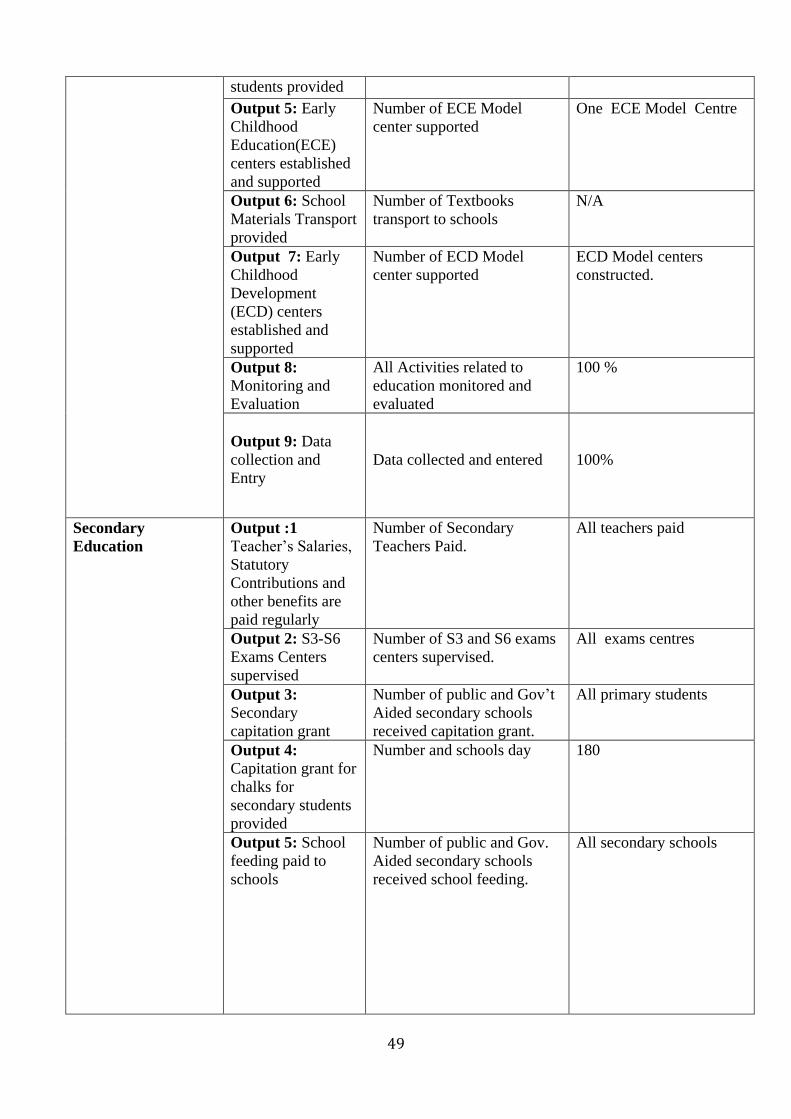
49
students provided
Output 5: Early
Childhood
Education(ECE)
centers established
and supported
Number of ECE Model
center supported
One ECE Model Centre
Output 6: School
Materials Transport
provided
Number of Textbooks
transport to schools
N/A
Output 7: Early
Childhood
Development
(ECD) centers
established and
supported
Number of ECD Model
center supported
ECD Model centers
constructed.
Output 8:
Monitoring and
Evaluation
All Activities related to
education monitored and
evaluated
100 %
Output 9: Data
collection and
Entry
Data collected and entered
100%
Secondary
Education
Output :1
Teacher’s Salaries,
Statutory
Contributions and
other benefits are
paid regularly
Number of Secondary
Teachers Paid.
All teachers paid
Output 2: S3-S6
Exams Centers
supervised
Number of S3 and S6 exams
centers supervised.
All exams centres
Output 3:
Secondary
capitation grant
Number of public and Gov’t
Aided secondary schools
received capitation grant.
All primary students
Output 4:
Capitation grant for
chalks for
secondary students
provided
Number and schools day 180
Output 5: School
feeding paid to
schools
Number of public and Gov.
Aided secondary schools
received school feeding.
All secondary schools

50
Output 6: Girls
Education
supported (Sanitary
pads in 12 YBE
schools provided
Number of 12YBE schools
provided with sanitary
facilities materials.
All schools
Output 7: School
Hygiene and
conducive learning
environment
strengthened
Hand washing equipments
Number of schools in
each district
Water Tanks
Number of schools in
each district
School Garden Equipment
Number of schools in each
district
All schools
Tertiary and Non
Formal Education
Output 1: Instructors receive
incentive
Number of instructors
received incentives.
All instructors
Output 2: Centers
Materials provided Number of Districts All districts
Output 3: Capitation Grant
provided
Number of Tertiary and Non
Formal schools received
capitation grant.
All students
Karongi
Pre-Primary and
Primary Education
Output 1:
Teacher’s Salaries,
Statutory
Contributions and
other benefits are
paid regularly
Number of Primary Teachers
Paid
All teachers paid
Output 2: P6
Exams Centers
Supervised
Number of P6 exams centers
supervised
All exam centers
Output 3:
Capitation grant for
all public and
government-aided
primary students
paid
Number of Primary students
received capitation grant
All primary students
Output 4:
Capitation grant for
chalks for all public
and government-
aided primary
students provided
Number and schools day All primary schools
Output 5: Early
Childhood
Education(ECE)
centers established
and supported
Number of ECE Model
center supported
One ECE Model Centre
Output 6: School
Materials Transport
Number of Textbooks
transport to schools
N/A

51
provided
Output 7: Early
Childhood
Development
(ECD) centers
established and
supported
Number of ECD Model
center supported
ECD Model centers
constructed.
Output 8:
Monitoring and
Evaluation
All Activities related to
education monitored and
evaluated
100 %
Output 9: Data
collection and
Entry
Data collected and entered
100%
Secondary
Education
Output :1
Teacher’s Salaries,
Statutory
Contributions and
other benefits are
paid regularly
Number of Secondary
Teachers Paid.
All teachers paid
Output 2: S3-S6
Exams Centers
supervised
Number of S3 and S6 exams
centers supervised.
All exams centres
Output 3:
Secondary
capitation grant
Number of public and Gov’t
Aided secondary schools
received capitation grant.
All primary students
Output 4:
Capitation grant for
chalks for
secondary students
provided
Number and schools day 180
Output 5: School
feeding paid to
schools
Number of public and Gov.
Aided secondary schools
received school feeding.
All secondary schools
Output 6: Girls
Education
supported (Sanitary
pads in 12 YBE
schools provided
Number of 12YBE schools
provided with sanitary
facilities materials.
All schools
Output 7: School
Hygiene and
conducive learning
environment
strengthened
Hand washing equipments
Number of schools in
each district
Water Tanks
Number of schools in
each district
School Garden Equipment
Number of schools in each
district
All schools
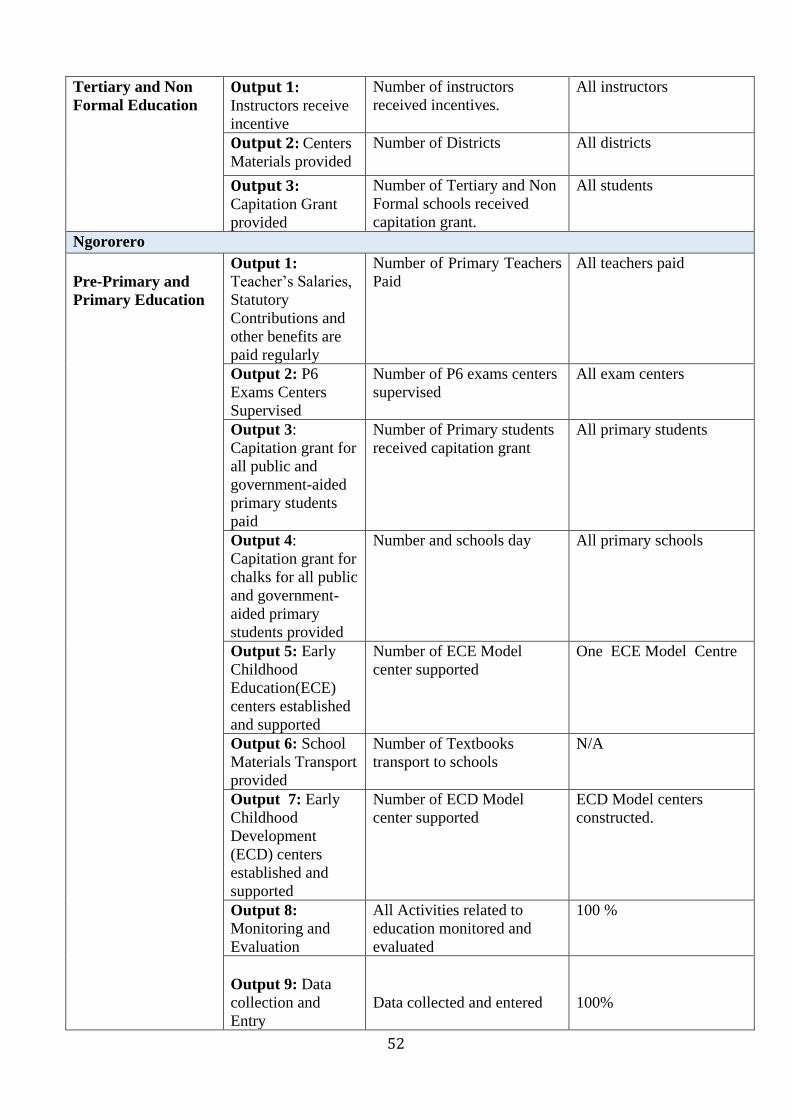
52
Tertiary and Non
Formal Education
Output 1: Instructors receive
incentive
Number of instructors
received incentives.
All instructors
Output 2: Centers
Materials provided Number of Districts All districts
Output 3: Capitation Grant
provided
Number of Tertiary and Non
Formal schools received
capitation grant.
All students
Ngororero
Pre-Primary and
Primary Education
Output 1:
Teacher’s Salaries,
Statutory
Contributions and
other benefits are
paid regularly
Number of Primary Teachers
Paid
All teachers paid
Output 2: P6
Exams Centers
Supervised
Number of P6 exams centers
supervised
All exam centers
Output 3:
Capitation grant for
all public and
government-aided
primary students
paid
Number of Primary students
received capitation grant
All primary students
Output 4:
Capitation grant for
chalks for all public
and government-
aided primary
students provided
Number and schools day All primary schools
Output 5: Early
Childhood
Education(ECE)
centers established
and supported
Number of ECE Model
center supported
One ECE Model Centre
Output 6: School
Materials Transport
provided
Number of Textbooks
transport to schools
N/A
Output 7: Early
Childhood
Development
(ECD) centers
established and
supported
Number of ECD Model
center supported
ECD Model centers
constructed.
Output 8:
Monitoring and
Evaluation
All Activities related to
education monitored and
evaluated
100 %
Output 9: Data
collection and
Entry
Data collected and entered
100%

53
Secondary
Education
Output :1
Teacher’s Salaries,
Statutory
Contributions and
other benefits are
paid regularly
Number of Secondary
Teachers Paid.
All teachers paid
Output 2: S3-S6
Exams Centers
supervised
Number of S3 and S6 exams
centers supervised.
All exams centres
Output 3:
Secondary
capitation grant
Number of public and Gov’t
Aided secondary schools
received capitation grant.
All primary students
Output 4:
Capitation grant for
chalks for
secondary students
provided
Number and schools day 180
Output 5: School
feeding paid to
schools
Number of public and Gov.
Aided secondary schools
received school feeding.
All secondary schools
Output 6: Girls
Education
supported (Sanitary
pads in 12 YBE
schools provided
Number of 12YBE schools
provided with sanitary
facilities materials.
All schools
Output 7: School
Hygiene and
conducive learning
environment
strengthened
Hand washing equipments
Number of schools in
each district
Water Tanks
Number of schools in
each district
School Garden Equipment
Number of schools in each
district
All schools
Tertiary and Non
Formal Education
Output 1: Instructors receive
incentive
Number of instructors
received incentives.
All instructors
Output 2: Centers
Materials provided Number of Districts All districts
Output 3: Capitation Grant
provided
Number of Tertiary and Non
Formal schools received
capitation grant.
All students
Nyamasheke
Pre-Primary and
Primary Education
Output 1:
Teacher’s Salaries,
Statutory
Contributions and
other benefits are
Number of Primary Teachers
Paid
All teachers paid

54
paid regularly
Output 2: P6
Exams Centers
Supervised
Number of P6 exams centers
supervised
All exam centers
Output 3:
Capitation grant for
all public and
government-aided
primary students
paid
Number of Primary students
received capitation grant
All primary students
Output 4:
Capitation grant for
chalks for all public
and government-
aided primary
students provided
Number and schools day All primary schools
Output 5: Early
Childhood
Education(ECE)
centers established
and supported
Number of ECE Model
center supported
One ECE Model Centre
Output 6: School
Materials Transport
provided
Number of Textbooks
transport to schools
N/A
Output 7: Early
Childhood
Development
(ECD) centers
established and
supported
Number of ECD Model
center supported
ECD Model centers
constructed.
Output 8:
Monitoring and
Evaluation
All Activities related to
education monitored and
evaluated
100 %
Output 9: Data
collection and
Entry
Data collected and entered
100%
Secondary
Education
Output :1
Teacher’s Salaries,
Statutory
Contributions and
other benefits are
paid regularly
Number of Secondary
Teachers Paid.
All teachers paid
Output 2: S3-S6
Exams Centers
supervised
Number of S3 and S6 exams
centers supervised.
All exams centres
Output 3:
Secondary
capitation grant
Number of public and Gov’t
Aided secondary schools
received capitation grant.
All primary students

55
Output 4:
Capitation grant for
chalks for
secondary students
provided
Number and schools day 180
Output 5: School
feeding paid to
schools
Number of public and Gov.
Aided secondary schools
received school feeding.
All secondary schools
Output 6: Girls
Education
supported (Sanitary
pads in 12 YBE
schools provided
Number of 12YBE schools
provided with sanitary
facilities materials.
All schools
Output 7: School
Hygiene and
conducive learning
environment
strengthened
Hand washing equipments
Number of schools in
each district
Water Tanks
Number of schools in
each district
School Garden Equipment
Number of schools in each
district
All schools
Tertiary and Non
Formal Education
Output 1: Instructors receive
incentive
Number of instructors
received incentives.
All instructors
Output 2: Centers
Materials provided Number of Districts All districts
Output 3: Capitation Grant
provided
Number of Tertiary and Non
Formal schools received
capitation grant.
All students
Rutsiro
Pre-Primary and
Primary Education
Output 1:
Teacher’s Salaries,
Statutory
Contributions and
other benefits are
paid regularly
Number of Primary Teachers
Paid
All teachers paid
Output 2: P6
Exams Centers
Supervised
Number of P6 exams centers
supervised
All exam centers
Output 3:
Capitation grant for
all public and
government-aided
primary students
paid
Number of Primary students
received capitation grant
All primary students
Output 4:
Capitation grant for
chalks for all public
and government-
aided primary
Number and schools day All primary schools

56
students provided
Output 5: Early
Childhood
Education(ECE)
centers established
and supported
Number of ECE Model
center supported
One ECE Model Centre
Output 6: School
Materials Transport
provided
Number of Textbooks
transport to schools
N/A
Output 7: Early
Childhood
Development
(ECD) centers
established and
supported
Number of ECD Model
center supported
ECD Model centers
constructed.
Output 8:
Monitoring and
Evaluation
All Activities related to
education monitored and
evaluated
100 %
Output 9: Data
collection and
Entry
Data collected and entered
100%
Secondary
Education
Output :1
Teacher’s Salaries,
Statutory
Contributions and
other benefits are
paid regularly
Number of Secondary
Teachers Paid.
All teachers paid
Output 2: S3-S6
Exams Centers
supervised
Number of S3 and S6 exams
centers supervised.
All exams centres
Output 3:
Secondary
capitation grant
Number of public and Gov’t
Aided secondary schools
received capitation grant.
All primary students
Output 4:
Capitation grant for
chalks for
secondary students
provided
Number and schools day 180
Output 5: School
feeding paid to
schools
Number of public and Gov.
Aided secondary schools
received school feeding.
All secondary schools
Output 6: Girls
Education
supported (Sanitary
pads in 12 YBE
schools provided
Number of 12YBE schools
provided with sanitary
facilities materials.
All schools
Output 7: School
Hygiene and
Hand washing equipments
Number of schools in
All schools

57
conducive learning
environment
strengthened
each district
Water Tanks
Number of schools in
each district
School Garden Equipment
Number of schools in each
district
Tertiary and Non
Formal Education
Output 1: Instructors receive
incentive
Number of instructors
received incentives.
All instructors
Output 2: Centers
Materials provided Number of Districts All districts
Output 3: Capitation Grant
provided
Number of Tertiary and Non
Formal schools received
capitation grant.
All students
Burera
Pre-Primary and
Primary Education
Output 1:
Teacher’s Salaries,
Statutory
Contributions and
other benefits are
paid regularly
Number of Primary Teachers
Paid
All teachers paid
Output 2: P6
Exams Centers
Supervised
Number of P6 exams centers
supervised
All exam centers
Output 3:
Capitation grant for
all public and
government-aided
primary students
paid
Number of Primary students
received capitation grant
All primary students
Output 4:
Capitation grant for
chalks for all public
and government-
aided primary
students provided
Number and schools day All primary schools
Output 5: Early
Childhood
Education(ECE)
centers established
and supported
Number of ECE Model
center supported
One ECE Model Centre
Output 6: School
Materials Transport
provided
Number of Textbooks
transport to schools
N/A
Output 7: Early
Childhood
Development
(ECD) centers
Number of ECD Model
center supported
ECD Model centers
constructed.
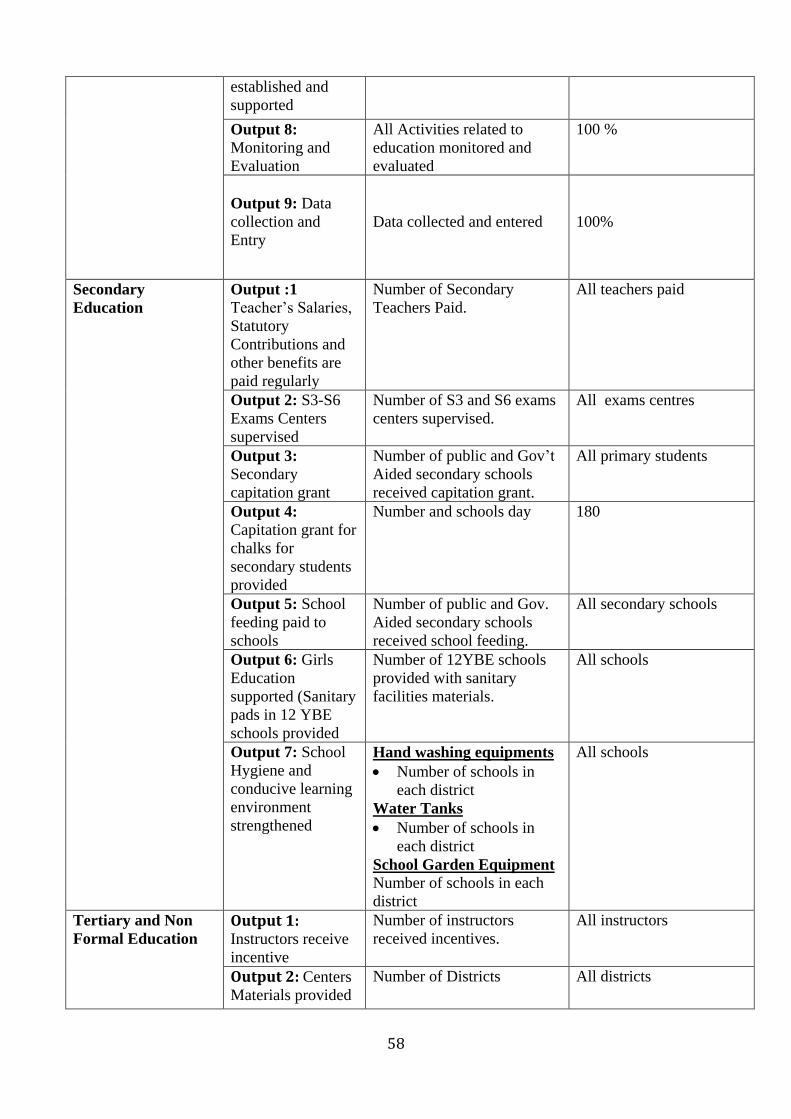
58
established and
supported
Output 8:
Monitoring and
Evaluation
All Activities related to
education monitored and
evaluated
100 %
Output 9: Data
collection and
Entry
Data collected and entered
100%
Secondary
Education
Output :1
Teacher’s Salaries,
Statutory
Contributions and
other benefits are
paid regularly
Number of Secondary
Teachers Paid.
All teachers paid
Output 2: S3-S6
Exams Centers
supervised
Number of S3 and S6 exams
centers supervised.
All exams centres
Output 3:
Secondary
capitation grant
Number of public and Gov’t
Aided secondary schools
received capitation grant.
All primary students
Output 4:
Capitation grant for
chalks for
secondary students
provided
Number and schools day 180
Output 5: School
feeding paid to
schools
Number of public and Gov.
Aided secondary schools
received school feeding.
All secondary schools
Output 6: Girls
Education
supported (Sanitary
pads in 12 YBE
schools provided
Number of 12YBE schools
provided with sanitary
facilities materials.
All schools
Output 7: School
Hygiene and
conducive learning
environment
strengthened
Hand washing equipments
Number of schools in
each district
Water Tanks
Number of schools in
each district
School Garden Equipment
Number of schools in each
district
All schools
Tertiary and Non
Formal Education
Output 1: Instructors receive
incentive
Number of instructors
received incentives.
All instructors
Output 2: Centers
Materials provided Number of Districts All districts
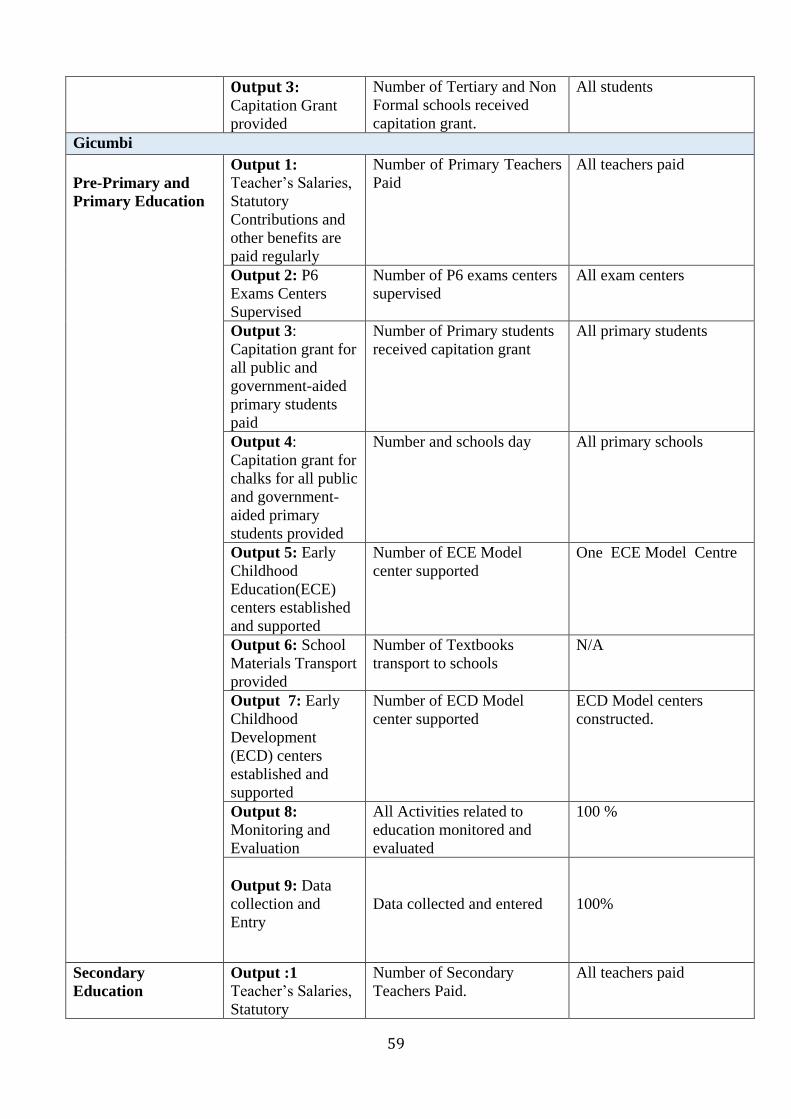
59
Output 3: Capitation Grant
provided
Number of Tertiary and Non
Formal schools received
capitation grant.
All students
Gicumbi
Pre-Primary and
Primary Education
Output 1:
Teacher’s Salaries,
Statutory
Contributions and
other benefits are
paid regularly
Number of Primary Teachers
Paid
All teachers paid
Output 2: P6
Exams Centers
Supervised
Number of P6 exams centers
supervised
All exam centers
Output 3:
Capitation grant for
all public and
government-aided
primary students
paid
Number of Primary students
received capitation grant
All primary students
Output 4:
Capitation grant for
chalks for all public
and government-
aided primary
students provided
Number and schools day All primary schools
Output 5: Early
Childhood
Education(ECE)
centers established
and supported
Number of ECE Model
center supported
One ECE Model Centre
Output 6: School
Materials Transport
provided
Number of Textbooks
transport to schools
N/A
Output 7: Early
Childhood
Development
(ECD) centers
established and
supported
Number of ECD Model
center supported
ECD Model centers
constructed.
Output 8:
Monitoring and
Evaluation
All Activities related to
education monitored and
evaluated
100 %
Output 9: Data
collection and
Entry
Data collected and entered
100%
Secondary
Education
Output :1
Teacher’s Salaries,
Statutory
Number of Secondary
Teachers Paid.
All teachers paid

60
Contributions and
other benefits are
paid regularly
Output 2: S3-S6
Exams Centers
supervised
Number of S3 and S6 exams
centers supervised.
All exams centres
Output 3:
Secondary
capitation grant
Number of public and Gov’t
Aided secondary schools
received capitation grant.
All primary students
Output 4:
Capitation grant for
chalks for
secondary students
provided
Number and schools day 180
Output 5: School
feeding paid to
schools
Number of public and Gov.
Aided secondary schools
received school feeding.
All secondary schools
Output 6: Girls
Education
supported (Sanitary
pads in 12 YBE
schools provided
Number of 12YBE schools
provided with sanitary
facilities materials.
All schools
Output 7: School
Hygiene and
conducive learning
environment
strengthened
Hand washing equipments
Number of schools in
each district
Water Tanks
Number of schools in
each district
School Garden Equipment
Number of schools in each
district
All schools
Tertiary and Non
Formal Education
Output 1: Instructors receive
incentive
Number of instructors
received incentives.
All instructors
Output 2: Centers
Materials provided Number of Districts All districts
Output 3: Capitation Grant
provided
Number of Tertiary and Non
Formal schools received
capitation grant.
All students
Musanze
Pre-Primary and
Primary Education
Output 1:
Teacher’s Salaries,
Statutory
Contributions and
other benefits are
paid regularly
Number of Primary Teachers
Paid
All teachers paid
Output 2: P6
Exams Centers
Supervised
Number of P6 exams centers
supervised
All exam centers

61
Output 3:
Capitation grant for
all public and
government-aided
primary students
paid
Number of Primary students
received capitation grant
All primary students
Output 4:
Capitation grant for
chalks for all public
and government-
aided primary
students provided
Number and schools day All primary schools
Output 5: Early
Childhood
Education(ECE)
centers established
and supported
Number of ECE Model
center supported
One ECE Model Centre
Output 6: School
Materials Transport
provided
Number of Textbooks
transport to schools
N/A
Output 7: Early
Childhood
Development
(ECD) centers
established and
supported
Number of ECD Model
center supported
ECD Model centers
constructed.
Output 8:
Monitoring and
Evaluation
All Activities related to
education monitored and
evaluated
100 %
Output 9: Data
collection and
Entry
Data collected and entered
100%
Secondary
Education
Output :1
Teacher’s Salaries,
Statutory
Contributions and
other benefits are
paid regularly
Number of Secondary
Teachers Paid.
All teachers paid
Output 2: S3-S6
Exams Centers
supervised
Number of S3 and S6 exams
centers supervised.
All exams centres
Output 3:
Secondary
capitation grant
Number of public and Gov’t
Aided secondary schools
received capitation grant.
All primary students
Output 4:
Capitation grant for
chalks for
secondary students
Number and schools day 180
62
provided
Output 5: School
feeding paid to
schools
Number of public and Gov.
Aided secondary schools
received school feeding.
All secondary schools
Output 6: Girls
Education
supported (Sanitary
pads in 12 YBE
schools provided
Number of 12YBE schools
provided with sanitary
facilities materials.
All schools
Output 7: School
Hygiene and
conducive learning
environment
strengthened
Hand washing equipments
Number of schools in
each district
Water Tanks
Number of schools in
each district
School Garden Equipment
Number of schools in each
district
All schools
Tertiary and Non
Formal Education
Output 1: Instructors receive
incentive
Number of instructors
received incentives.
All instructors
Output 2: Centers
Materials provided Number of Districts All districts
Output 3: Capitation Grant
provided
Number of Tertiary and Non
Formal schools received
capitation grant.
All students
Rulindo
Pre-Primary and
Primary Education
Output 1:
Teacher’s Salaries,
Statutory
Contributions and
other benefits are
paid regularly
Number of Primary Teachers
Paid
All teachers paid
Output 2: P6
Exams Centers
Supervised
Number of P6 exams centers
supervised
All exam centers
Output 3:
Capitation grant for
all public and
government-aided
primary students
paid
Number of Primary students
received capitation grant
All primary students
Output 4:
Capitation grant for
chalks for all public
and government-
aided primary
students provided
Number and schools day All primary schools

63
Output 5: Early
Childhood
Education(ECE)
centers established
and supported
Number of ECE Model
center supported
One ECE Model Centre
Output 6: School
Materials Transport
provided
Number of Textbooks
transport to schools
N/A
Output 7: Early
Childhood
Development
(ECD) centers
established and
supported
Number of ECD Model
center supported
ECD Model centers
constructed.
Output 8:
Monitoring and
Evaluation
All Activities related to
education monitored and
evaluated
100 %
Output 9: Data
collection and
Entry
Data collected and entered
100%
Secondary
Education
Output :1
Teacher’s Salaries,
Statutory
Contributions and
other benefits are
paid regularly
Number of Secondary
Teachers Paid.
All teachers paid
Output 2: S3-S6
Exams Centers
supervised
Number of S3 and S6 exams
centers supervised.
All exams centres
Output 3:
Secondary
capitation grant
Number of public and Gov’t
Aided secondary schools
received capitation grant.
All primary students
Output 4:
Capitation grant for
chalks for
secondary students
provided
Number and schools day 180
Output 5: School
feeding paid to
schools
Number of public and Gov.
Aided secondary schools
received school feeding.
All secondary schools
Output 6: Girls
Education
supported (Sanitary
pads in 12 YBE
schools provided
Number of 12YBE schools
provided with sanitary
facilities materials.
All schools
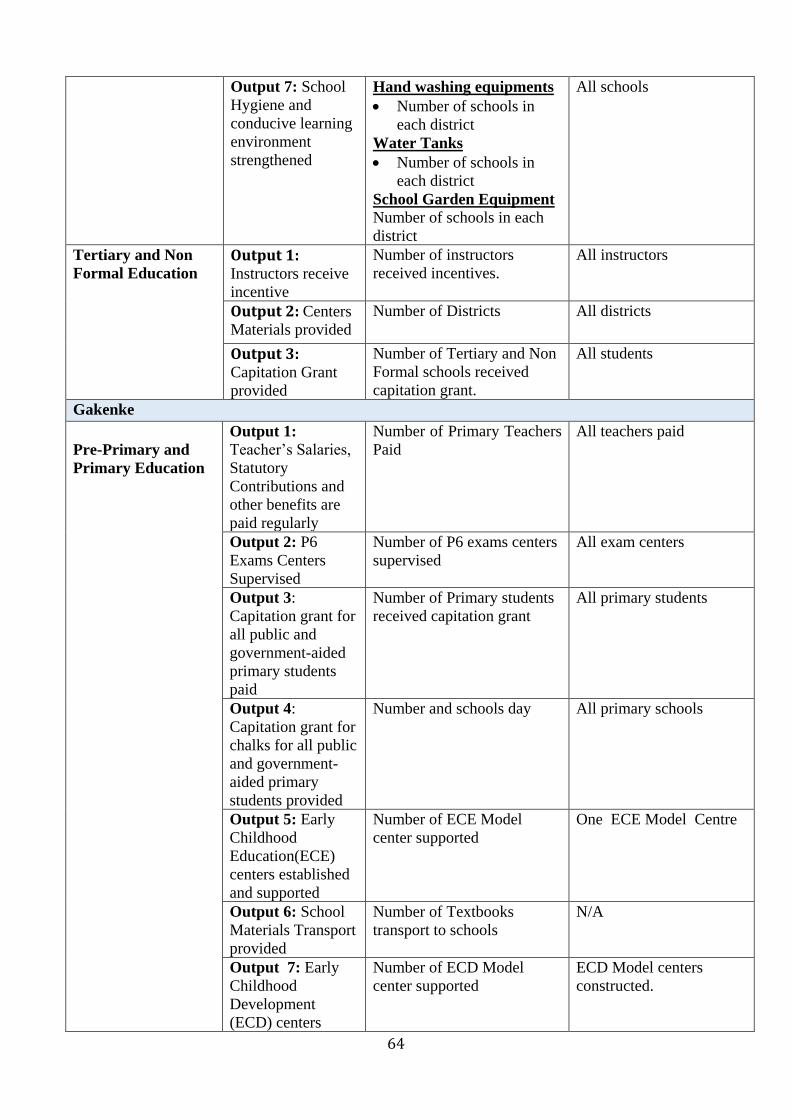
64
Output 7: School
Hygiene and
conducive learning
environment
strengthened
Hand washing equipments
Number of schools in
each district
Water Tanks
Number of schools in
each district
School Garden Equipment
Number of schools in each
district
All schools
Tertiary and Non
Formal Education
Output 1: Instructors receive
incentive
Number of instructors
received incentives.
All instructors
Output 2: Centers
Materials provided Number of Districts All districts
Output 3: Capitation Grant
provided
Number of Tertiary and Non
Formal schools received
capitation grant.
All students
Gakenke
Pre-Primary and
Primary Education
Output 1:
Teacher’s Salaries,
Statutory
Contributions and
other benefits are
paid regularly
Number of Primary Teachers
Paid
All teachers paid
Output 2: P6
Exams Centers
Supervised
Number of P6 exams centers
supervised
All exam centers
Output 3:
Capitation grant for
all public and
government-aided
primary students
paid
Number of Primary students
received capitation grant
All primary students
Output 4:
Capitation grant for
chalks for all public
and government-
aided primary
students provided
Number and schools day All primary schools
Output 5: Early
Childhood
Education(ECE)
centers established
and supported
Number of ECE Model
center supported
One ECE Model Centre
Output 6: School
Materials Transport
provided
Number of Textbooks
transport to schools
N/A
Output 7: Early
Childhood
Development
(ECD) centers
Number of ECD Model
center supported
ECD Model centers
constructed.

65
established and
supported
Output 8:
Monitoring and
Evaluation
All Activities related to
education monitored and
evaluated
100 %
Output 9: Data
collection and
Entry
Data collected and entered
100%
Secondary
Education
Output :1
Teacher’s Salaries,
Statutory
Contributions and
other benefits are
paid regularly
Number of Secondary
Teachers Paid.
All teachers paid
Output 2: S3-S6
Exams Centers
supervised
Number of S3 and S6 exams
centers supervised.
All exams centres
Output 3:
Secondary
capitation grant
Number of public and Gov’t
Aided secondary schools
received capitation grant.
All primary students
Output 4:
Capitation grant for
chalks for
secondary students
provided
Number and schools day 180
Output 5: School
feeding paid to
schools
Number of public and Gov.
Aided secondary schools
received school feeding.
All secondary schools
Output 6: Girls
Education
supported (Sanitary
pads in 12 YBE
schools provided
Number of 12YBE schools
provided with sanitary
facilities materials.
All schools
Output 7: School
Hygiene and
conducive learning
environment
strengthened
Hand washing equipments
Number of schools in
each district
Water Tanks
Number of schools in
each district
School Garden Equipment
Number of schools in each
district
All schools
Tertiary and Non
Formal Education
Output 1: Instructors receive
incentive
Number of instructors
received incentives.
All instructors
Output 2: Centers
Materials provided Number of Districts All districts

66
Output 3: Capitation Grant
provided
Number of Tertiary and Non
Formal schools received
capitation grant.
All students
Ruhango
Pre-Primary and
Primary Education
Output 1:
Teacher’s Salaries,
Statutory
Contributions and
other benefits are
paid regularly
Number of Primary Teachers
Paid
All teachers paid
Output 2: P6
Exams Centers
Supervised
Number of P6 exams centers
supervised
All exam centers
Output 3:
Capitation grant for
all public and
government-aided
primary students
paid
Number of Primary students
received capitation grant
All primary students
Output 4:
Capitation grant for
chalks for all public
and government-
aided primary
students provided
Number and schools day All primary schools
Output 5: Early
Childhood
Education(ECE)
centers established
and supported
Number of ECE Model
center supported
One ECE Model Centre
Output 6: School
Materials Transport
provided
Number of Textbooks
transport to schools
N/A
Output 7: Early
Childhood
Development
(ECD) centers
established and
supported
Number of ECD Model
center supported
ECD Model centers
constructed.
Output 8:
Monitoring and
Evaluation
All Activities related to
education monitored and
evaluated
100 %
Output 9: Data
collection and
Entry
Data collected and entered
100%
Secondary
Education
Output :1
Teacher’s Salaries,
Statutory
Number of Secondary
Teachers Paid.
All teachers paid

67
Contributions and
other benefits are
paid regularly
Output 2: S3-S6
Exams Centers
supervised
Number of S3 and S6 exams
centers supervised.
All exams centres
Output 3:
Secondary
capitation grant
Number of public and Gov’t
Aided secondary schools
received capitation grant.
All primary students
Output 4:
Capitation grant for
chalks for
secondary students
provided
Number and schools day 180
Output 5: School
feeding paid to
schools
Number of public and Gov.
Aided secondary schools
received school feeding.
All secondary schools
Output 6: Girls
Education
supported (Sanitary
pads in 12 YBE
schools provided
Number of 12YBE schools
provided with sanitary
facilities materials.
All schools
Output 7: School
Hygiene and
conducive learning
environment
strengthened
Hand washing equipments
Number of schools in
each district
Water Tanks
Number of schools in
each district
School Garden Equipment
Number of schools in each
district
All schools
Tertiary and Non
Formal Education
Output 1: Instructors receive
incentive
Number of instructors
received incentives.
All instructors
Output 2: Centers
Materials provided Number of Districts All districts
Output 3: Capitation Grant
provided
Number of Tertiary and Non
Formal schools received
capitation grant.
All students
Nyarugenge
Pre-Primary and
Primary Education
Output 1:
Teacher’s Salaries,
Statutory
Contributions and
other benefits are
paid regularly
Number of Primary Teachers
Paid
All teachers paid
Output 2: P6
Exams Centers
Supervised
Number of P6 exams centers
supervised
All exam centers

68
Output 3:
Capitation grant for
all public and
government-aided
primary students
paid
Number of Primary students
received capitation grant
All primary students
Output 4:
Capitation grant for
chalks for all public
and government-
aided primary
students provided
Number and schools day All primary schools
Output 5: Early
Childhood
Education(ECE)
centers established
and supported
Number of ECE Model
center supported
One ECE Model Centre
Output 6: School
Materials Transport
provided
Number of Textbooks
transport to schools
N/A
Output 7: Early
Childhood
Development
(ECD) centers
established and
supported
Number of ECD Model
center supported
ECD Model centers
constructed.
Output 8:
Monitoring and
Evaluation
All Activities related to
education monitored and
evaluated
100 %
Output 9: Data
collection and
Entry
Data collected and entered
100%
Secondary
Education
Output :1
Teacher’s Salaries,
Statutory
Contributions and
other benefits are
paid regularly
Number of Secondary
Teachers Paid.
All teachers paid
Output 2: S3-S6
Exams Centers
supervised
Number of S3 and S6 exams
centers supervised.
All exams centres
Output 3:
Secondary
capitation grant
Number of public and Gov’t
Aided secondary schools
received capitation grant.
All primary students
Output 4:
Capitation grant for
chalks for
secondary students
Number and schools day 180

69
provided
Output 5: School
feeding paid to
schools
Number of public and Gov.
Aided secondary schools
received school feeding.
All secondary schools
Output 6: Girls
Education
supported (Sanitary
pads in 12 YBE
schools provided
Number of 12YBE schools
provided with sanitary
facilities materials.
All schools
Output 7: School
Hygiene and
conducive learning
environment
strengthened
Hand washing equipments
Number of schools in
each district
Water Tanks
Number of schools in
each district
School Garden Equipment
Number of schools in each
district
All schools
Tertiary and Non
Formal Education
Output 1: Instructors receive
incentive
Number of instructors
received incentives.
All instructors
Output 2: Centers
Materials provided Number of Districts All districts
Output 3: Capitation Grant
provided
Number of Tertiary and Non
Formal schools received
capitation grant.
All students
Gasabo
Pre-Primary and
Primary Education
Output 1:
Teacher’s Salaries,
Statutory
Contributions and
other benefits are
paid regularly
Number of Primary Teachers
Paid
All teachers paid
Output 2: P6
Exams Centers
Supervised
Number of P6 exams centers
supervised
All exam centers
Output 3:
Capitation grant for
all public and
government-aided
primary students
paid
Number of Primary students
received capitation grant
All primary students
Output 4:
Capitation grant for
chalks for all public
and government-
aided primary
students provided
Number and schools day All primary schools

70
Output 5: Early
Childhood
Education(ECE)
centers established
and supported
Number of ECE Model
center supported
One ECE Model Centre
Output 6: School
Materials Transport
provided
Number of Textbooks
transport to schools
N/A
Output 7: Early
Childhood
Development
(ECD) centers
established and
supported
Number of ECD Model
center supported
ECD Model centers
constructed.
Output 8:
Monitoring and
Evaluation
All Activities related to
education monitored and
evaluated
100 %
Output 9: Data
collection and
Entry
Data collected and entered
100%
Secondary
Education
Output :1
Teacher’s Salaries,
Statutory
Contributions and
other benefits are
paid regularly
Number of Secondary
Teachers Paid.
All teachers paid
Output 2: S3-S6
Exams Centers
supervised
Number of S3 and S6 exams
centers supervised.
All exams centres
Output 3:
Secondary
capitation grant
Number of public and Gov’t
Aided secondary schools
received capitation grant.
All primary students
Output 4:
Capitation grant for
chalks for
secondary students
provided
Number and schools day 180
Output 5: School
feeding paid to
schools
Number of public and Gov.
Aided secondary schools
received school feeding.
All secondary schools
Output 6: Girls
Education
supported (Sanitary
pads in 12 YBE
schools provided
Number of 12YBE schools
provided with sanitary
facilities materials.
All schools
Output 7: School
Hygiene and
conducive learning
environment
Hand washing equipments
Number of schools in
each district
Water Tanks
All schools
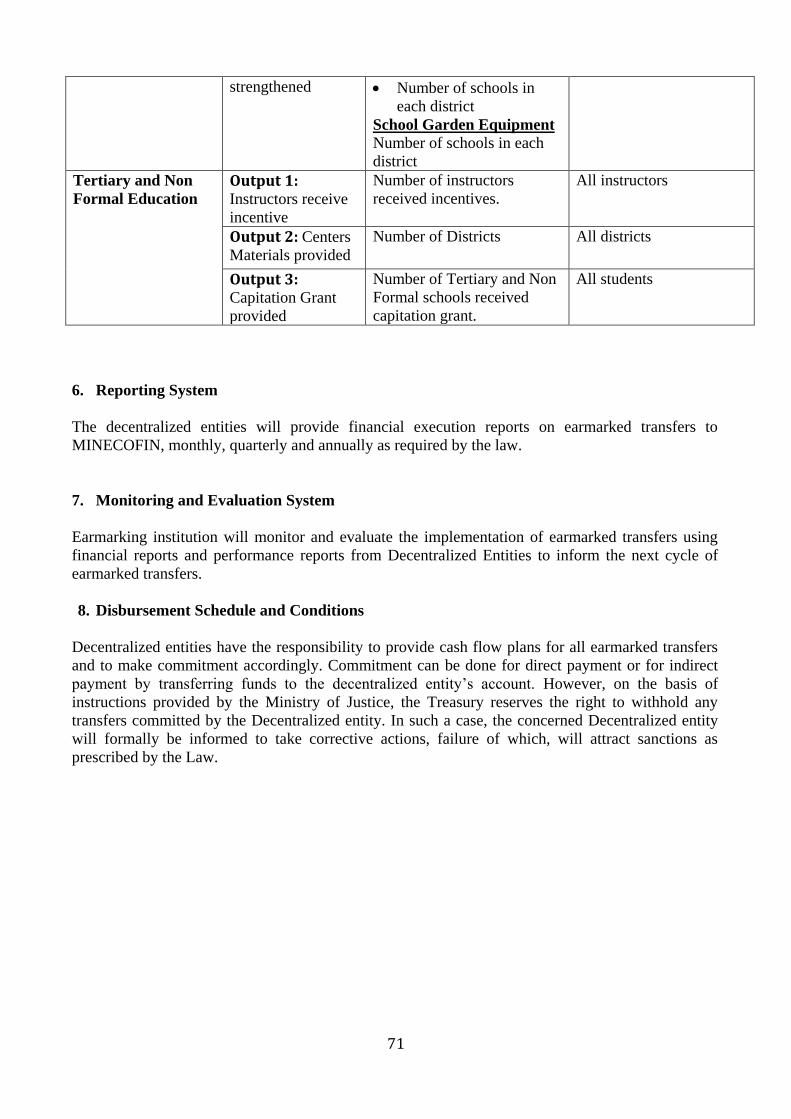
71
strengthened Number of schools in
each district
School Garden Equipment
Number of schools in each
district
Tertiary and Non
Formal Education
Output 1: Instructors receive
incentive
Number of instructors
received incentives.
All instructors
Output 2: Centers
Materials provided Number of Districts All districts
Output 3: Capitation Grant
provided
Number of Tertiary and Non
Formal schools received
capitation grant.
All students
6. Reporting System
The decentralized entities will provide financial execution reports on earmarked transfers to
MINECOFIN, monthly, quarterly and annually as required by the law.
7. Monitoring and Evaluation System
Earmarking institution will monitor and evaluate the implementation of earmarked transfers using
financial reports and performance reports from Decentralized Entities to inform the next cycle of
earmarked transfers.
8. Disbursement Schedule and Conditions
Decentralized entities have the responsibility to provide cash flow plans for all earmarked transfers
and to make commitment accordingly. Commitment can be done for direct payment or for indirect
payment by transferring funds to the decentralized entity’s account. However, on the basis of
instructions provided by the Ministry of Justice, the Treasury reserves the right to withhold any
transfers committed by the Decentralized entity. In such a case, the concerned Decentralized entity
will formally be informed to take corrective actions, failure of which, will attract sanctions as
prescribed by the Law.

72
3. Ministry of Health (MINISANTE)
1. Objective of the Earmarked Program and Sub-Program
Table 1: Program and Sub Program Objectives
Program and Sub-
Program
Objectives
Health
Health Staff
Management
Increasing the quantity and quality of Human Resources for Health through
increased numbers of trained and equitably distributed staff to reduce the Gap of
Doctor and nurse to patient ratios for responding to quality of and demand for health
services in the control of diseases.
Health Infrastructure,
Equipment and Goods
Ensuring that there is equitable geographical access to health services. In this
context we intend to continue to build, renovate and upgrade health facilities and
equip them to serve the population.
Disease Control Strengthen DISEASE CONTROL workers cooperatives to be financially viable and
able to generate revenues.
2. Transferred Outputs
Program &
Subprogram
Outputs
Health
Health Staff
Management
Output1:Health Worker’s Salaries Statutory Contributions and other benefits are paid regularly
Health
Infrastructure,
Output 2: Maintainance of infrastructure &equipments
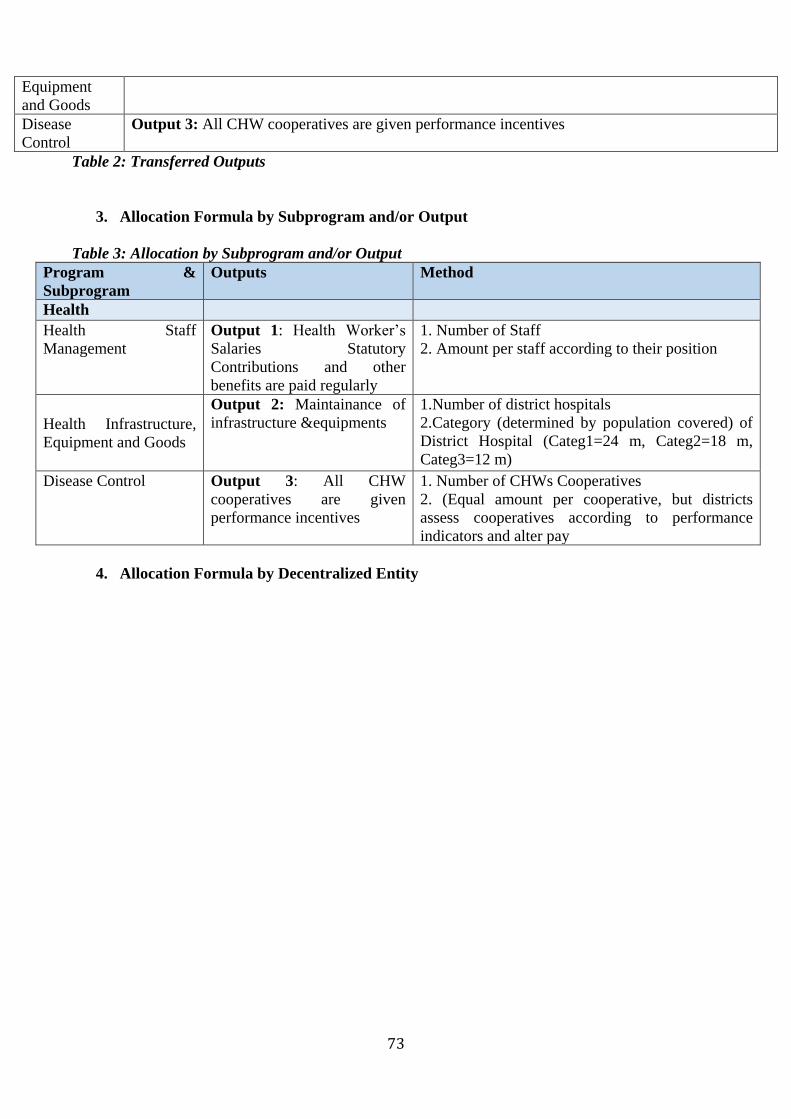
73
Table 2: Transferred Outputs
3. Allocation Formula by Subprogram and/or Output
Table 3: Allocation by Subprogram and/or Output
Program &
Subprogram
Outputs Method
Health
Health Staff
Management
Output 1: Health Worker’s
Salaries Statutory
Contributions and other
benefits are paid regularly
1. Number of Staff
2. Amount per staff according to their position
Health Infrastructure,
Equipment and Goods
Output 2: Maintainance of
infrastructure &equipments
1.Number of district hospitals
2.Category (determined by population covered) of
District Hospital (Categ1=24 m, Categ2=18 m,
Categ3=12 m)
Disease Control Output 3: All CHW
cooperatives are given
performance incentives
1. Number of CHWs Cooperatives
2. (Equal amount per cooperative, but districts
assess cooperatives according to performance
indicators and alter pay
4. Allocation Formula by Decentralized Entity
Equipment
and Goods
Disease
Control
Output 3: All CHW cooperatives are given performance incentives
74
Table 4: Allocation by Output to Decentralized Entity
Basis of Allocation Formula by Decentralized Budget Agency
a) Health Staff Management:
For Output 1: Health Worker’s Salaries Statutory Contributions and other benefits are paid regularly,
the allocation to each district is equal to the total annual wage bill of health facility staff in the district.
The individual monthly wage for each type of health staff is given as follows:
Position
Directeur de l'hôpital
Médecins Hospitaliers
Medical Chief of Staff
Hospital Administrator
Human Resource Officer
Public Relation and Communication
Technician A0
Technicians A1
Technicians A2
Driver
b) HEALTH INFRASTRUCTURE, EQUIPMENT AND GOODS:
For Output 2: Maintainance of infrastructure &equipments, each district hospital is allocated a fixed
amount based on the category of hospital. There are 3 categories according to the size and expenditure
needs of the hospital, and the fixed amount has been set to cover estimated running costs of hospitals in
each category.
C) DISEASE CONTROL:
For Output 3: All CHW cooperatives are given performance incentives, each district is allocated a
lump-sum amount designed to enable the district to provide performance incentives to all CHW
cooperatives. The lump sum has been determined based on the number of cooperatives in each district.
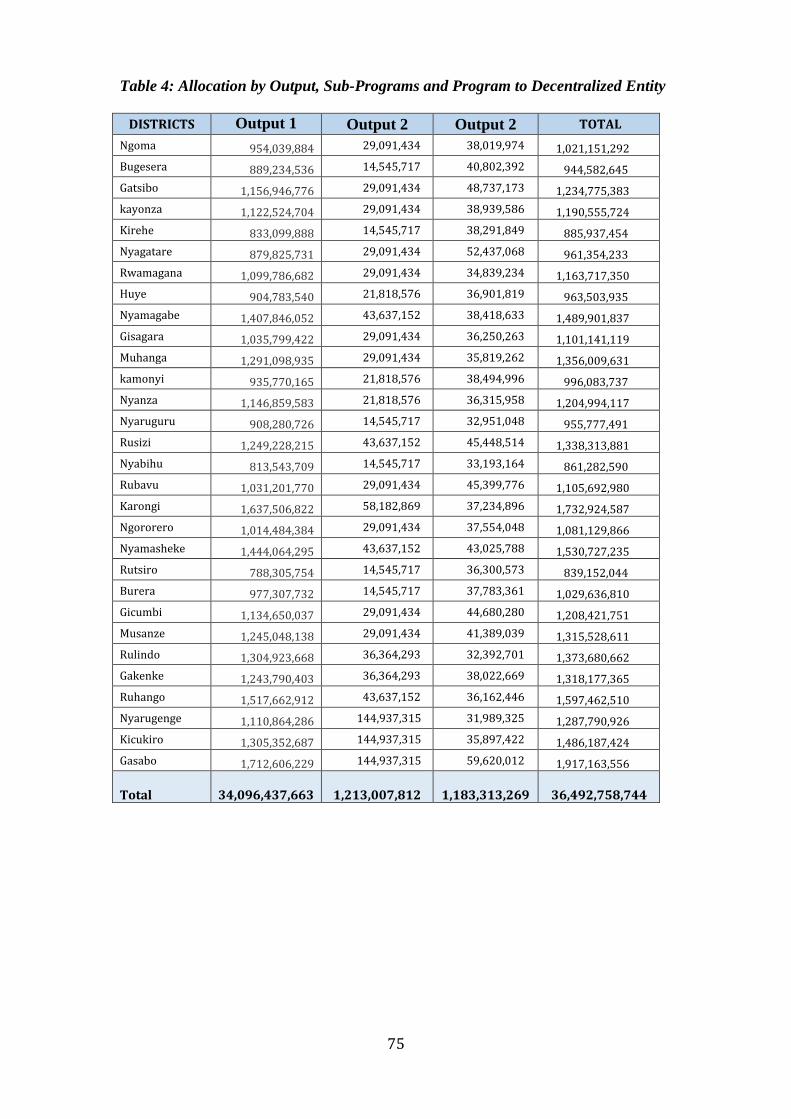
75
Table 4: Allocation by Output, Sub-Programs and Program to Decentralized Entity
DISTRICTS Output 1 Output 2 Output 2 TOTAL
Ngoma 954,039,884 29,091,434 38,019,974 1,021,151,292
Bugesera 889,234,536 14,545,717 40,802,392 944,582,645
Gatsibo 1,156,946,776 29,091,434 48,737,173 1,234,775,383
kayonza 1,122,524,704 29,091,434 38,939,586 1,190,555,724
Kirehe 833,099,888 14,545,717 38,291,849 885,937,454
Nyagatare 879,825,731 29,091,434 52,437,068 961,354,233
Rwamagana 1,099,786,682 29,091,434 34,839,234 1,163,717,350
Huye 904,783,540 21,818,576 36,901,819 963,503,935
Nyamagabe 1,407,846,052 43,637,152 38,418,633 1,489,901,837
Gisagara 1,035,799,422 29,091,434 36,250,263 1,101,141,119
Muhanga 1,291,098,935 29,091,434 35,819,262 1,356,009,631
kamonyi 935,770,165 21,818,576 38,494,996 996,083,737
Nyanza 1,146,859,583 21,818,576 36,315,958 1,204,994,117
Nyaruguru 908,280,726 14,545,717 32,951,048 955,777,491
Rusizi 1,249,228,215 43,637,152 45,448,514 1,338,313,881
Nyabihu 813,543,709 14,545,717 33,193,164 861,282,590
Rubavu 1,031,201,770 29,091,434 45,399,776 1,105,692,980
Karongi 1,637,506,822 58,182,869 37,234,896 1,732,924,587
Ngororero 1,014,484,384 29,091,434 37,554,048 1,081,129,866
Nyamasheke 1,444,064,295 43,637,152 43,025,788 1,530,727,235
Rutsiro 788,305,754 14,545,717 36,300,573 839,152,044
Burera 977,307,732 14,545,717 37,783,361 1,029,636,810
Gicumbi 1,134,650,037 29,091,434 44,680,280 1,208,421,751
Musanze 1,245,048,138 29,091,434 41,389,039 1,315,528,611
Rulindo 1,304,923,668 36,364,293 32,392,701 1,373,680,662
Gakenke 1,243,790,403 36,364,293 38,022,669 1,318,177,365
Ruhango 1,517,662,912 43,637,152 36,162,446 1,597,462,510
Nyarugenge 1,110,864,286 144,937,315 31,989,325 1,287,790,926
Kicukiro 1,305,352,687 144,937,315 35,897,422 1,486,187,424
Gasabo 1,712,606,229 144,937,315 59,620,012 1,917,163,556
Total
34,096,437,663
1,213,007,812
1,183,313,269 36,492,758,744

76
5. Performance Targets and Indicators
Table 5: Performance Indicators by Decentralized Budget Agency for Output
Program &
Subprogram
Output Performance Indicator Annual
Target
Ngoma
Health Staff
Management
Output 1: Health Worker’s
Salaries Statutory Contributions
and other benefits are paid
regularly
Percentage of health facility staff
whose wages are paid regulary 100%
Health Infrastructure
and Equipment
Output 2: Maintainance of
infrastructure &equipments
Percentage of hospitals provided
with maintainance cost of
infrastructure &equipments. 100%
Disease Control
Output 3: All CHW
cooperatives are given
performance incentives
Percentage of CHW
cooperatives provided with
performance incentives
100%
Bugesera
Health Staff
Management
Output 1: Health Worker’s
Salaries Statutory Contributions
and other benefits are paid
regularly
Percentage of health facility staff
whose wages are paid regulary 100%
Health Infrastructure
and Equipment
Output 2: Maintainance of
infrastructure &equipments
Percentage of hospitals provided
with maintainance cost of
infrastructure &equipments. 100%
Disease Control
Output 3: All CHW
cooperatives are given
performance incentives
Percentage of CHW
cooperatives provided with
performance incentives
100%
Gatsibo
Health Staff
Management
Output 1: Health Worker’s
Salaries Statutory Contributions
and other benefits are paid
regularly
Percentage of health facility staff
whose wages are paid regulary 100%
Health Infrastructure
and Equipment
Output 2: Maintainance of
infrastructure &equipments
Percentage of hospitals provided
with maintainance cost of
infrastructure &equipments. 100%
Disease Control
Output 3: All CHW
cooperatives are given
performance incentives
Percentage of CHW
cooperatives provided with
performance incentives
100%
Kayonza
Health Staff
Management
Output 1: Health Worker’s
Salaries Statutory Contributions
and other benefits are paid
regularly
Percentage of health facility staff
whose wages are paid regulary 100%
Health Infrastructure
and Equipment
Output 2: Maintainance of
infrastructure &equipments
Percentage of hospitals provided
with maintainance cost of
infrastructure &equipments. 100%

77
Disease Control
Output 3: All CHW
cooperatives are given
performance incentives
Percentage of CHW
cooperatives provided with
performance incentives
100%
Kirehe
Health Staff
Management
Output 1: Health Worker’s
Salaries Statutory Contributions
and other benefits are paid
regularly
Percentage of health facility staff
whose wages are paid regulary 100%
Health Infrastructure
and Equipment
Output 2: Maintainance of
infrastructure &equipments
Percentage of hospitals provided
with maintainance cost of
infrastructure &equipments. 100%
Disease Control
Output 3: All CHW
cooperatives are given
performance incentives
Percentage of CHW
cooperatives provided with
performance incentives
100%
Nyagatare
Health Staff
Management
Output 1: Health Worker’s
Salaries Statutory Contributions
and other benefits are paid
regularly
Percentage of health facility staff
whose wages are paid regulary 100%
Health Infrastructure
and Equipment
Output 2: Maintainance of
infrastructure &equipments
Percentage of hospitals provided
with maintainance cost of
infrastructure &equipments. 100%
Disease Control
Output 3: All CHW
cooperatives are given
performance incentives
Percentage of CHW
cooperatives provided with
performance incentives
100%
Rwamagana
Health Staff
Management
Output 1: Health Worker’s
Salaries Statutory Contributions
and other benefits are paid
regularly
Percentage of health facility staff
whose wages are paid regulary 100%
Health Infrastructure
and Equipment
Output 2: Maintainance of
infrastructure &equipments
Percentage of hospitals provided
with maintainance cost of
infrastructure &equipments. 100%
Disease Control
Output 3: All CHW
cooperatives are given
performance incentives
Percentage of CHW
cooperatives provided with
performance incentives
100%
Huye
Health Staff
Management
Output 1: Health Worker’s
Salaries Statutory Contributions
and other benefits are paid
regularly
Percentage of health facility staff
whose wages are paid regulary 100%
Health Infrastructure
and Equipment
Output 2: Maintainance of
infrastructure &equipments
Percentage of hospitals provided
with maintainance cost of
infrastructure &equipments. 100%
Disease Control
Output 3: All CHW
cooperatives are given
performance incentives
Percentage of CHW
cooperatives provided with
performance incentives
100%

78
Nyamagabe
Health Staff
Management
Output 1: Health Worker’s
Salaries Statutory Contributions
and other benefits are paid
regularly
Percentage of health facility staff
whose wages are paid regulary 100%
Health Infrastructure
and Equipment
Output 2: Maintainance of
infrastructure &equipments
Percentage of hospitals provided
with maintainance cost of
infrastructure &equipments. 100%
Disease Control
Output 3: All CHW
cooperatives are given
performance incentives
Percentage of CHW
cooperatives provided with
performance incentives
100%
Gisagara
Health Staff
Management
Output 1: Health Worker’s
Salaries Statutory Contributions
and other benefits are paid
regularly
Percentage of health facility staff
whose wages are paid regulary 100%
Health Infrastructure
and Equipment
Output 2: Maintainance of
infrastructure &equipments
Percentage of hospitals provided
with maintainance cost of
infrastructure &equipments. 100%
Disease Control
Output 3: All CHW
cooperatives are given
performance incentives
Percentage of CHW
cooperatives provided with
performance incentives
100%
Muhanga
Health Staff
Management
Output 1: Health Worker’s
Salaries Statutory Contributions
and other benefits are paid
regularly
Percentage of health facility staff
whose wages are paid regulary 100%
Health Infrastructure
and Equipment
Output 2: Maintainance of
infrastructure &equipments
Percentage of hospitals provided
with maintainance cost of
infrastructure &equipments. 100%
Disease Control
Output 3: All CHW
cooperatives are given
performance incentives
Percentage of CHW
cooperatives provided with
performance incentives 100%
Kamonyi
Health Staff
Management
Output 1: Health Worker’s
Salaries Statutory Contributions
and other benefits are paid
regularly
Percentage of health facility staff
whose wages are paid regulary 100%
Health Infrastructure
and Equipment
Output 2: Maintainance of
infrastructure &equipments
Percentage of hospitals provided
with maintainance cost of
infrastructure &equipments. 100%
Disease Control
Output 3: All CHW
cooperatives are given
performance incentives
Percentage of CHW
cooperatives provided with
performance incentives
100%
79
Nyanza
Health Staff
Management
Output 1: Health Worker’s
Salaries Statutory Contributions
and other benefits are paid
regularly
Percentage of health facility staff
whose wages are paid regulary 100%
Health Infrastructure
and Equipment
Output 2: Maintainance of
infrastructure &equipments
Percentage of hospitals provided
with maintainance cost of
infrastructure &equipments. 100%
Disease Control
Output 3: All CHW
cooperatives are given
performance incentives
Percentage of CHW
cooperatives provided with
performance incentives
100%
Nyaruguru
Health Staff
Management
Output 1: Health Worker’s
Salaries Statutory Contributions
and other benefits are paid
regularly
Percentage of health facility staff
whose wages are paid regulary 100%
Health Infrastructure
and Equipment
Output 2: Maintainance of
infrastructure &equipments
Percentage of hospitals provided
with maintainance cost of
infrastructure &equipments. 100%
Disease Control
Output 3: All CHW
cooperatives are given
performance incentives
Percentage of CHW
cooperatives provided with
performance incentives
100%
Ruhango
Health Staff
Management
Output 1: Health Worker’s
Salaries Statutory Contributions
and other benefits are paid
regularly
Percentage of health facility staff
whose wages are paid regulary 100%
Health Infrastructure
and Equipment
Output 2: Maintainance of
infrastructure &equipments
Percentage of hospitals provided
with maintainance cost of
infrastructure &equipments. 100%
Disease Control
Output 3: All CHW
cooperatives are given
performance incentives
Percentage of CHW
cooperatives provided with
performance incentives
100%
Rusizi
Health Staff
Management
Output 1: Health Worker’s
Salaries Statutory Contributions
and other benefits are paid
regularly
Percentage of health facility staff
whose wages are paid regulary 100%
Health Infrastructure
and Equipment
Output 2: Maintainance of
infrastructure &equipments
Percentage of hospitals provided
with maintainance cost of
infrastructure &equipments. 100%
Disease Control
Output 3: All CHW
cooperatives are given
performance incentives
Percentage of CHW
cooperatives provided with
performance incentives 100%

80
Nyabihu
Health Staff
Management
Output 1: Health Worker’s
Salaries Statutory Contributions
and other benefits are paid
regularly
Percentage of health facility staff
whose wages are paid regulary 100%
Health Infrastructure
and Equipment
Output 2: Maintainance of
infrastructure &equipments
Percentage of hospitals provided
with maintainance cost of
infrastructure &equipments. 100%
Disease Control
Output 3: All CHW
cooperatives are given
performance incentives
Percentage of CHW
cooperatives provided with
performance incentives
100%
Rubavu
Health Staff
Management
Output 1: Health Worker’s
Salaries Statutory Contributions
and other benefits are paid
regularly
Percentage of health facility staff
whose wages are paid regulary 100%
Health Infrastructure
and Equipment
Output 2: Maintainance of
infrastructure &equipments
Percentage of hospitals provided
with maintainance cost of
infrastructure &equipments. 100%
Disease Control
Output 3: All CHW
cooperatives are given
performance incentives
Percentage of CHW
cooperatives provided with
performance incentives
100%
Karongi
Health Staff
Management
Output 1: Health Worker’s
Salaries Statutory Contributions
and other benefits are paid
regularly
Percentage of health facility staff
whose wages are paid regulary 100%
Health Infrastructure
and Equipment
Output 2: Maintainance of
infrastructure &equipments
Percentage of hospitals provided
with maintainance cost of
infrastructure &equipments. 100%
Disease Control
Output 3: All CHW
cooperatives are given
performance incentives
Percentage of CHW
cooperatives provided with
performance incentives
100%
Ngororero
Health Staff
Management
Output 1: Health Worker’s
Salaries Statutory Contributions
and other benefits are paid
regularly
Percentage of health facility staff
whose wages are paid regulary 100%
Health Infrastructure
and Equipment
Output 2: Maintainance of
infrastructure &equipments
Percentage of hospitals provided
with maintainance cost of
infrastructure &equipments. 100%
Disease Control
Output 3: All CHW
cooperatives are given
performance incentives
Percentage of CHW
cooperatives provided with
performance incentives 100%

81
Nyamasheke
Health Staff
Management
Output 1: Health Worker’s
Salaries Statutory Contributions
and other benefits are paid
regularly
Percentage of health facility staff
whose wages are paid regulary 100%
Health Infrastructure
and Equipment
Output 2: Maintainance of
infrastructure &equipments
Percentage of hospitals provided
with maintainance cost of
infrastructure &equipments. 100%
Disease Control
Output 3: All CHW
cooperatives are given
performance incentives
Percentage of CHW
cooperatives provided with
performance incentives
100%
Rutsiro
Health Staff
Management
Output 1: Health Worker’s
Salaries Statutory Contributions
and other benefits are paid
regularly
Percentage of health facility staff
whose wages are paid regulary 100%
Health Infrastructure
and Equipment
Output 2: Maintainance of
infrastructure &equipments
Percentage of hospitals provided
with maintainance cost of
infrastructure &equipments. 100%
Disease Control
Output 3: All CHW
cooperatives are given
performance incentives
Percentage of CHW
cooperatives provided with
performance incentives
100%
Burera
Health Staff
Management
Output 1: Health Worker’s
Salaries Statutory Contributions
and other benefits are paid
regularly
Percentage of health facility staff
whose wages are paid regulary 100%
Health Infrastructure
and Equipment
Output 2: Maintainance of
infrastructure &equipments
Percentage of hospitals provided
with maintainance cost of
infrastructure &equipments. 100%
Disease Control
Output 3: All CHW
cooperatives are given
performance incentives
Percentage of CHW
cooperatives provided with
performance incentives
100%
Gicumbi
Health Staff
Management
Output 1: Health Worker’s
Salaries Statutory Contributions
and other benefits are paid
regularly
Percentage of health facility staff
whose wages are paid regulary 100%
Health Infrastructure
and Equipment
Output 2: Maintainance of
infrastructure &equipments
Percentage of hospitals provided
with maintainance cost of
infrastructure &equipments. 100%
Disease Control
Output 3: All CHW
cooperatives are given
performance incentives
Percentage of CHW
cooperatives provided with
performance incentives 100%

82
Musanze
Health Staff
Management
Output 1: Health Worker’s
Salaries Statutory Contributions
and other benefits are paid
regularly
Percentage of health facility staff
whose wages are paid regulary 100%
Health Infrastructure
and Equipment
Output 2: Maintainance of
infrastructure &equipments
Percentage of hospitals provided
with maintainance cost of
infrastructure &equipments. 100%
Disease Control
Output 3: All CHW
cooperatives are given
performance incentives
Percentage of CHW
cooperatives provided with
performance incentives
100%
Rulindo
Health Staff
Management
Output 1: Health Worker’s
Salaries Statutory Contributions
and other benefits are paid
regularly
Percentage of health facility staff
whose wages are paid regulary 100%
Health Infrastructure
and Equipment
Output 2: Maintainance of
infrastructure &equipments
Percentage of hospitals provided
with maintainance cost of
infrastructure &equipments. 100%
Disease Control
Output 3: All CHW
cooperatives are given
performance incentives
Percentage of CHW
cooperatives provided with
performance incentives
100%
Gakenke
Health Staff
Management
Output 1: Health Worker’s
Salaries Statutory Contributions
and other benefits are paid
regularly
Percentage of health facility staff
whose wages are paid regulary 100%
Health Infrastructure
and Equipment
Output 2: Maintainance of
infrastructure &equipments
Percentage of hospitals provided
with maintainance cost of
infrastructure &equipments. 100%
Disease Control
Output 3: All CHW
cooperatives are given
performance incentives
Percentage of CHW
cooperatives provided with
performance incentives
100%
Nyarugenge
Health Staff
Management
Output 1: Health Worker’s
Salaries Statutory Contributions
and other benefits are paid
regularly
Percentage of health facility staff
whose wages are paid regulary 100%
Health Infrastructure
and Equipment
Output 2: Maintainance of
infrastructure &equipments
Percentage of hospitals provided
with maintainance cost of
infrastructure &equipments. 100%
Disease Control
Output 3: All CHW
cooperatives are given
performance incentives
Percentage of CHW
cooperatives provided with
performance incentives 100%

83
Kicukiro
Health Staff
Management
Output 1: Health Worker’s
Salaries Statutory Contributions
and other benefits are paid
regularly
Percentage of health facility staff
whose wages are paid regulary 100%
Health Infrastructure
and Equipment
Output 2: Maintainance of
infrastructure &equipments
Percentage of hospitals provided
with maintainance cost of
infrastructure &equipments. 100%
Disease Control
Output 3: All CHW
cooperatives are given
performance incentives
Percentage of CHW
cooperatives provided with
performance incentives
100%
Gasabo
Health Staff
Management
Output 1: Health Worker’s
Salaries Statutory Contributions
and other benefits are paid
regularly
Percentage of health facility staff
whose wages are paid regulary 100%
Health Infrastructure
and Equipment
Output 2: Maintainance of
infrastructure &equipments
Percentage of hospitals provided
with maintainance cost of
infrastructure &equipments. 100%
Disease Control
Output 3: All CHW
cooperatives are given
performance incentives
Percentage of CHW
cooperatives provided with
performance incentives
100%
6. Reporting System
The decentralized entities will provide financial execution reports on earmarked transfers to
MINECOFIN, monthly, quarterly and annually as required by the law.
7. Monitoring and Evaluation System
Earmarking institution will monitor and evaluate the implementation of earmarked transfers
using financial reports and performance reports from Decentralized Entities to inform the
next cycle of earmarked transfers.
8. Disbursement Schedule and Conditions
Decentralized entities have the responsibility to provide cash flow plans for all earmarked
transfers and to make commitment accordingly. Commitment can be done for direct payment
or for indirect payment by transferring funds to the decentralized entity’s account. However,
on the basis of instructions provided by the Ministry of Justice, the Treasury reserves the
right to withhold any transfers committed by the Decentralized entity. In such a case, the
concerned Decentralized entity will formally be informed to take corrective actions, failure of
which, will attract sanctions as prescribed by the Law.
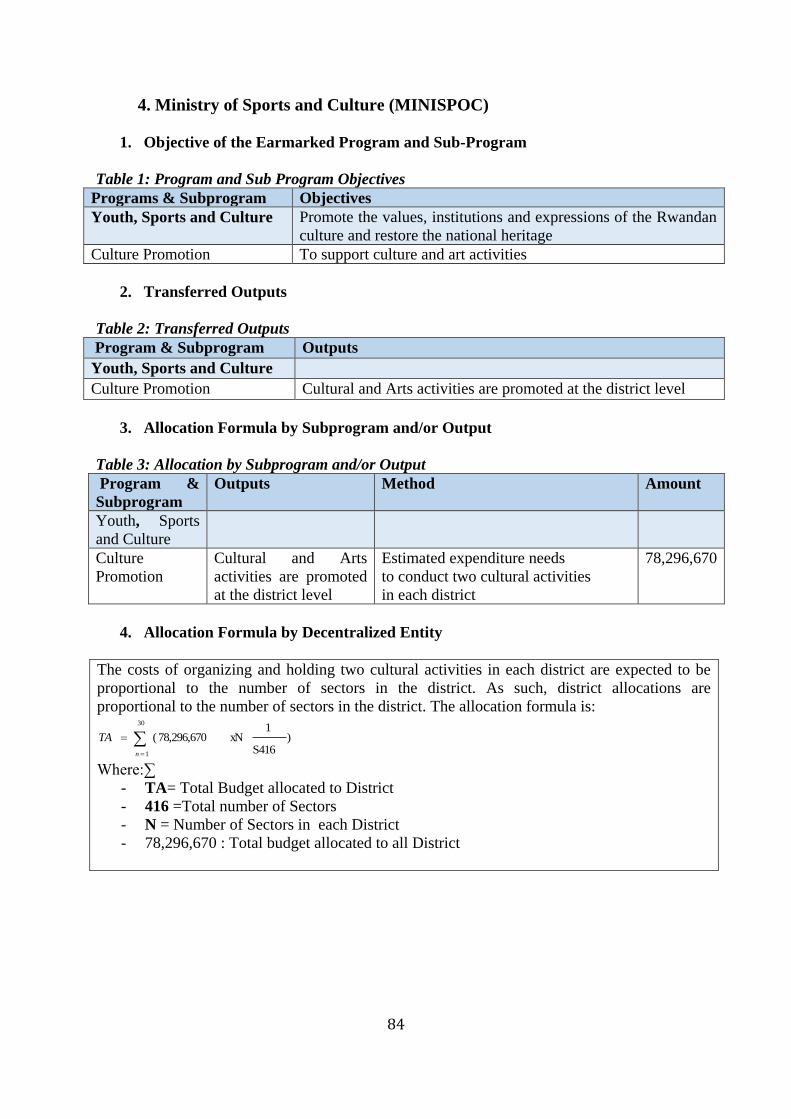
84
4. Ministry of Sports and Culture (MINISPOC)
1. Objective of the Earmarked Program and Sub-Program
Table 1: Program and Sub Program Objectives
Programs & Subprogram Objectives
Youth, Sports and Culture Promote the values, institutions and expressions of the Rwandan
culture and restore the national heritage
Culture Promotion To support culture and art activities
2. Transferred Outputs
Table 2: Transferred Outputs
Program & Subprogram Outputs
Youth, Sports and Culture
Culture Promotion Cultural and Arts activities are promoted at the district level
3. Allocation Formula by Subprogram and/or Output
Table 3: Allocation by Subprogram and/or Output
Program &
Subprogram
Outputs Method Amount
Youth, Sports
and Culture
Culture
Promotion
Cultural and Arts
activities are promoted
at the district level
Estimated expenditure needs
to conduct two cultural activities
in each district
78,296,670
4. Allocation Formula by Decentralized Entity
The costs of organizing and holding two cultural activities in each district are expected to be
proportional to the number of sectors in the district. As such, district allocations are
proportional to the number of sectors in the district. The allocation formula is:
30
1
)S416
1xN78,296,670(
n
TA
Where:∑
- TA= Total Budget allocated to District
- 416 =Total number of Sectors
- N = Number of Sectors in each District
- 78,296,670 : Total budget allocated to all District
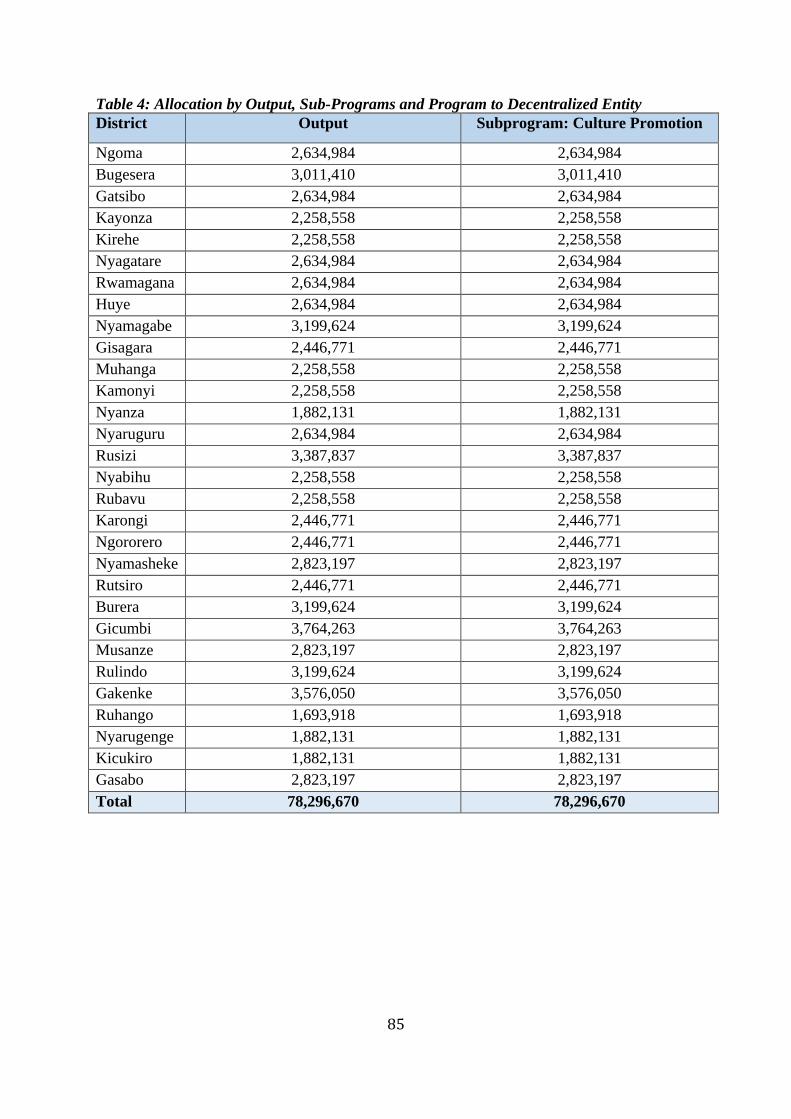
85
Table 4: Allocation by Output, Sub-Programs and Program to Decentralized Entity
District Output Subprogram: Culture Promotion
Ngoma 2,634,984 2,634,984
Bugesera 3,011,410 3,011,410
Gatsibo 2,634,984 2,634,984
Kayonza 2,258,558 2,258,558
Kirehe 2,258,558 2,258,558
Nyagatare 2,634,984 2,634,984
Rwamagana 2,634,984 2,634,984
Huye 2,634,984 2,634,984
Nyamagabe 3,199,624 3,199,624
Gisagara 2,446,771 2,446,771
Muhanga 2,258,558 2,258,558
Kamonyi 2,258,558 2,258,558
Nyanza 1,882,131 1,882,131
Nyaruguru 2,634,984 2,634,984
Rusizi 3,387,837 3,387,837
Nyabihu 2,258,558 2,258,558
Rubavu 2,258,558 2,258,558
Karongi 2,446,771 2,446,771
Ngororero 2,446,771 2,446,771
Nyamasheke 2,823,197 2,823,197
Rutsiro 2,446,771 2,446,771
Burera 3,199,624 3,199,624
Gicumbi 3,764,263 3,764,263
Musanze 2,823,197 2,823,197
Rulindo 3,199,624 3,199,624
Gakenke 3,576,050 3,576,050
Ruhango 1,693,918 1,693,918
Nyarugenge 1,882,131 1,882,131
Kicukiro 1,882,131 1,882,131
Gasabo 2,823,197 2,823,197
Total 78,296,670 78,296,670
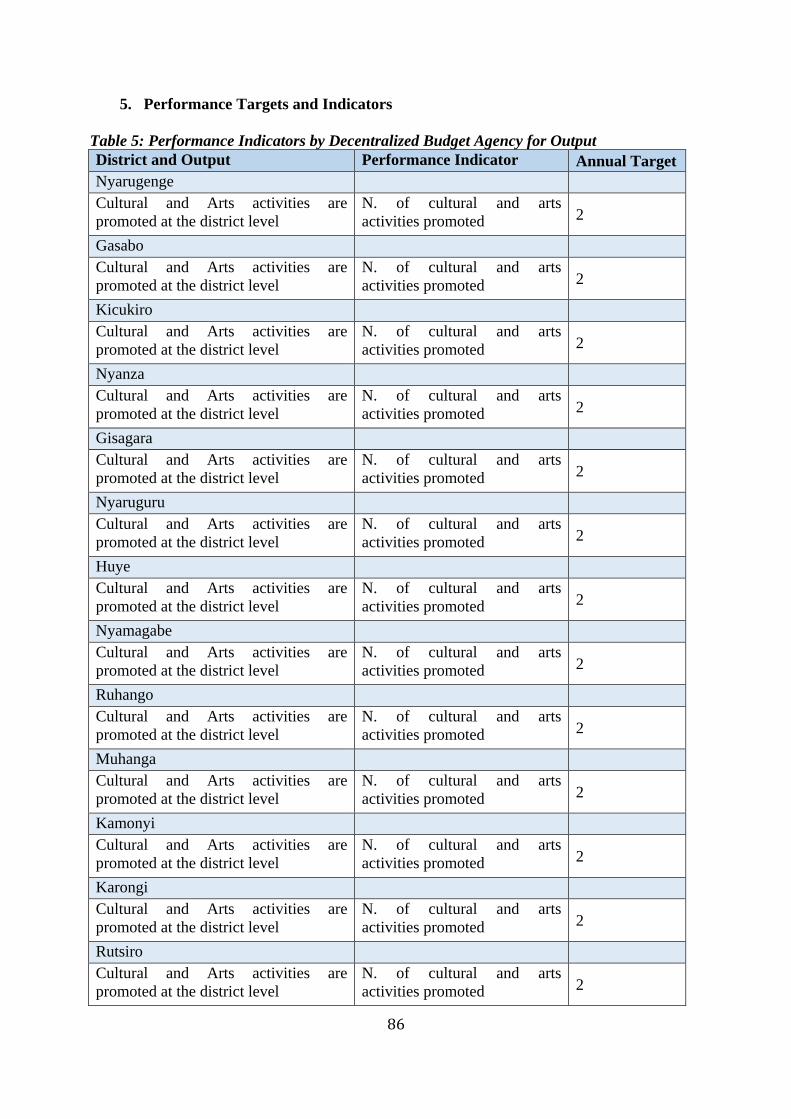
86
5. Performance Targets and Indicators
Table 5: Performance Indicators by Decentralized Budget Agency for Output
District and Output Performance Indicator Annual Target
Nyarugenge
Cultural and Arts activities are
promoted at the district level
N. of cultural and arts
activities promoted 2
Gasabo
Cultural and Arts activities are
promoted at the district level
N. of cultural and arts
activities promoted 2
Kicukiro
Cultural and Arts activities are
promoted at the district level
N. of cultural and arts
activities promoted 2
Nyanza
Cultural and Arts activities are
promoted at the district level
N. of cultural and arts
activities promoted 2
Gisagara
Cultural and Arts activities are
promoted at the district level
N. of cultural and arts
activities promoted 2
Nyaruguru
Cultural and Arts activities are
promoted at the district level
N. of cultural and arts
activities promoted 2
Huye
Cultural and Arts activities are
promoted at the district level
N. of cultural and arts
activities promoted 2
Nyamagabe
Cultural and Arts activities are
promoted at the district level
N. of cultural and arts
activities promoted 2
Ruhango
Cultural and Arts activities are
promoted at the district level
N. of cultural and arts
activities promoted 2
Muhanga
Cultural and Arts activities are
promoted at the district level
N. of cultural and arts
activities promoted 2
Kamonyi
Cultural and Arts activities are
promoted at the district level
N. of cultural and arts
activities promoted 2
Karongi
Cultural and Arts activities are
promoted at the district level
N. of cultural and arts
activities promoted 2
Rutsiro
Cultural and Arts activities are
promoted at the district level
N. of cultural and arts
activities promoted 2

87
Rubavu
Cultural and Arts activities are
promoted at the district level
N. of cultural and arts
activities promoted 2
Nyabihu
Cultural and Arts activities are
promoted at the district level
N. of cultural and arts
activities promoted 2
Ngororero
Cultural and Arts activities are
promoted at the district level
N. of cultural and arts
activities promoted 2
Rusizi
Cultural and Arts activities are
promoted at the district level
N. of cultural and arts
activities promoted 2
Nyamasheke
Cultural and Arts activities are
promoted at the district level
N. of cultural and arts
activities promoted 2
Rulindo
Cultural and Arts activities are
promoted at the district level
N. of cultural and arts
activities promoted 2
Gakenke
Cultural and Arts activities are
promoted at the district level
N. of cultural and arts
activities promoted 2
Musanze
Cultural and Arts activities are
promoted at the district level
N. of cultural and arts
activities promoted 2
Burera
Cultural and Arts activities are
promoted at the district level
N. of cultural and arts
activities promoted 2
Gicumbi
Cultural and Arts activities are
promoted at the district level
N. of cultural and arts
activities promoted 2
Rwamagana
Cultural and Arts activities are
promoted at the district level
N. of cultural and arts
activities promoted 2
Nyagatare
Cultural and Arts activities are
promoted at the district level
N. of cultural and arts
activities promoted 2
Gatsibo
Cultural and Arts activities are
promoted at the district level
N. of cultural and arts
activities promoted 2
Kayonza
Cultural and Arts activities are
promoted at the district level
N. of cultural and arts
activities promoted
2

88
Kirehe
Cultural and Arts activities are
promoted at the district level
N. of cultural and arts
activities promoted 2
Ngoma
Cultural and Arts activities are
promoted at the district level
N. of cultural and arts
activities promoted 2
Bugesera
Cultural and Arts activities are
promoted at the district level
N. of cultural and arts
activities promoted 2
6. Reporting System
The decentralized entities will provide financial execution reports on earmarked transfers to
MINECOFIN, monthly, quarterly and annually as required by the law.
7. Monitoring and Evaluation System
Earmarking institution will monitor and evaluate the implementation of earmarked transfers
using financial reports and performance reports from Decentralized Entities to inform the
next cycle of earmarked transfers.
8. Disbursement Schedule and Conditions
Decentralized entities have the responsibility to provide cash flow plans for all earmarked
transfers and to make commitment accordingly. Commitment can be done for direct payment
or for indirect payment by transferring funds to the decentralized entity’s account. However,
on the basis of instructions provided by the Ministry of Justice, the Treasury reserves the
right to withhold any transfers committed by the Decentralized entity. In such a case, the
concerned Decentralized entity will formally be informed to take corrective actions, failure of
which, will attract sanctions as prescribed by the Law.

89
5. Ministry of Local Government (MINALOC)
1. Objective of the Earmarked Program and Sub-Program
Table 1: Program and Sub Program Objectives
Program and Sub-
Program Objectives
Social Protection To guarantee a minimum income and access to core public services to all
poor and vulnerable people Vulnerable groups support To fight poverty and ensure the welfare of vulnerable people through the
provision of direct support in non VUP sectors, shelter and school
materials To fight poverty through encouraging income generating activities of
cooperatives formed by vulnerable groups and centers of elderly people To support HMP’s youth to access vocational training and universities
2. Transferred Outputs/Activities
For the 2016/17 financial year, MINALOC will use the existing social protection earmarked transfers
to support vulnerable people located in non VUP sectors and earmarked social protection Support to
historically marginalized people's children in TVET.
Table 2: Transferred Outputs
Program &
Subprogram Outputs
Social Protection
Vulnerable
groups support
Output 1: Support to Extremely poor and vulnerable groups Output 2: Support to historically marginalized people's children in TVET.
3. Allocation Formula by Subprogram and/or Output
Table 3: Allocation by Subprogram and/or Output
Program &
Subprogram Outputs Method Amount
Social protection Vulnerable
groups support.
Output 1: Support to
Extremely poor and vulnerable
groups
Expenditure requirements
to provide social support to
poor and vulnerable groups
1,341,957,648
Output 2: Support to
historically marginalized
people's children in TVET.
Expenditure requirements
to provide support Support
to historically marginalized
people's children in TVET.
95,899,994

90
4. Allocation Formula by Decentralized Entity
The allocation formula is designed to estimate the expenditure needs of each district to provide social
assistance to poor and vulnerable groups. The allocation formula uses three allocation parameters as
follows:
- District vulnerable population size, which represent 45% of the earmarked allocation;
- District population size, which represent 25 % of the earmarked allocation;
- Equalization component, so that poorer districts receive higher transfers, which is measured
on the basis of the inverse of their revenue per capita, as a share of total revenue per capita of
each districts. It represents 30% of the earmarked allocation.
The formula is shown below:
For output 2, districts have been allocated a lump-sum amount based on the number of HMP students
to be supported in each district.
Table 4: Allocation by Output, Sub-Programs and Program to Decentralize
District Output 1 Output 2 TOTAL
Ngoma
43,836,558
2,959,877 46,796,435
Bugesera
52,163,561
2,959,877 55,123,438
Gatsibo
34,017,857
2,959,877 36,977,734
Kayonza
25,512,001
2,959,877 28,471,878
Kirehe
34,008,744
4,143,827 38,152,571
Nyagatare
24,972,731
2,959,877 27,932,608
Rwamagana
39,023,252
2,959,877 41,983,129
Huye
73,149,550
6,215,741 79,365,291
Nyamagabe
63,309,941
2,959,876 66,269,817
Gisagara
80,694,743
2,959,876 83,654,619
Muhanga
47,049,909
3,255,864 50,305,773
Kamonyi 33,437,490
Where ,
,
,
,
,
.

91
30,477,614 2,959,876
Nyanza
39,393,560
2,959,876 42,353,436
Nyaruguru
82,980,334
2,959,876 85,940,210
Rusizi
38,869,306
2,959,876 41,829,182
Nyabihu
38,198,447
2,959,876 41,158,323
Rubavu
43,373,470
2,959,876 46,333,346
Karongi
47,353,000
3,255,864 50,608,864
Ngororero
40,241,115
4,143,827 44,384,942
Nyamasheke
41,617,650
4,143,827 45,761,477
Rutsiro
64,090,319
2,071,914 66,162,233
Burera
45,255,439
3,551,852 48,807,291
Gicumbi
52,498,963
2,959,876 55,458,839
Musanze
42,834,734
2,959,876 45,794,610
Rulindo
38,705,540
2,959,876 41,665,416
Gakenke
46,185,390
2,959,876 49,145,266
Ruhango
50,605,197
2,959,876 53,565,073
Nyarugenge
10,737,254
2,959,876 13,697,130
Kicukiro
27,906,045
2,959,876 30,865,921
Gasabo
42,895,424
2,959,876 45,855,300
Total 1,341,957,648 95,899,994 1,437,857,642
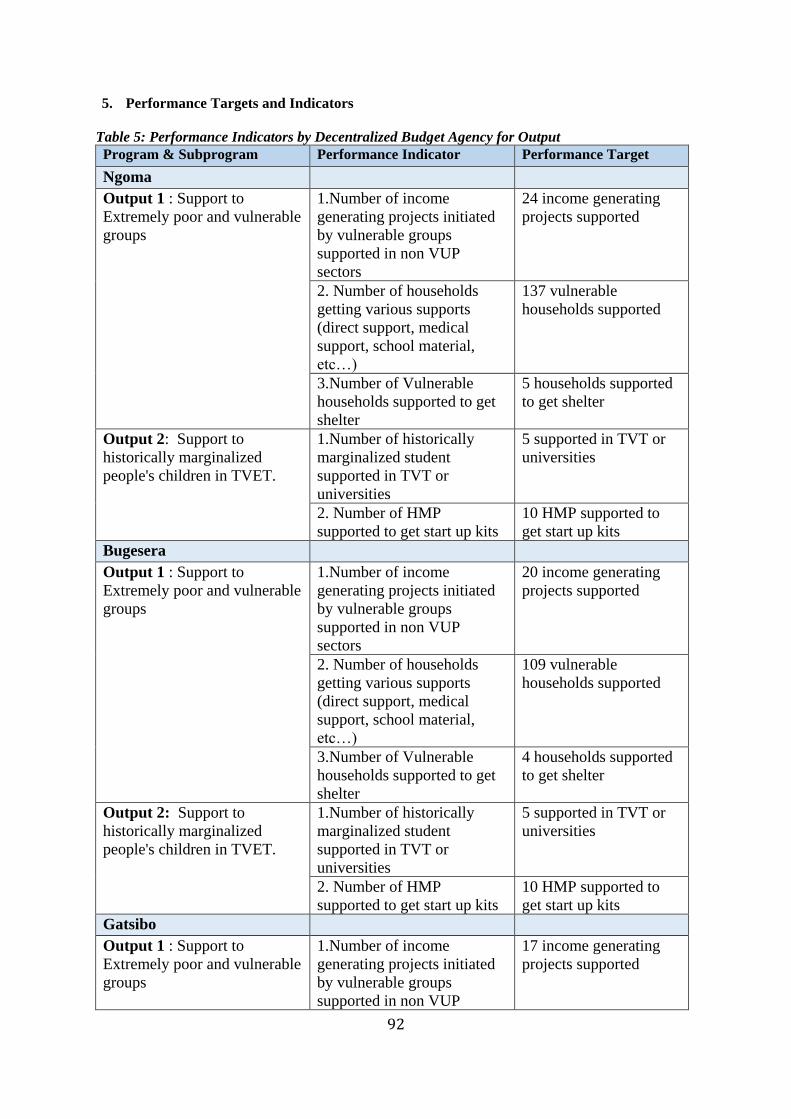
92
5. Performance Targets and Indicators
Table 5: Performance Indicators by Decentralized Budget Agency for Output
Program & Subprogram Performance Indicator Performance Target
Ngoma
Output 1 : Support to
Extremely poor and vulnerable
groups
1.Number of income
generating projects initiated
by vulnerable groups
supported in non VUP
sectors
24 income generating
projects supported
2. Number of households
getting various supports
(direct support, medical
support, school material,
etc…)
137 vulnerable
households supported
3.Number of Vulnerable
households supported to get
shelter
5 households supported
to get shelter
Output 2: Support to
historically marginalized
people's children in TVET.
1.Number of historically
marginalized student
supported in TVT or
universities
5 supported in TVT or
universities
2. Number of HMP
supported to get start up kits
10 HMP supported to
get start up kits
Bugesera
Output 1 : Support to
Extremely poor and vulnerable
groups
1.Number of income
generating projects initiated
by vulnerable groups
supported in non VUP
sectors
20 income generating
projects supported
2. Number of households
getting various supports
(direct support, medical
support, school material,
etc…)
109 vulnerable
households supported
3.Number of Vulnerable
households supported to get
shelter
4 households supported
to get shelter
Output 2: Support to
historically marginalized
people's children in TVET.
1.Number of historically
marginalized student
supported in TVT or
universities
5 supported in TVT or
universities
2. Number of HMP
supported to get start up kits
10 HMP supported to
get start up kits
Gatsibo
Output 1 : Support to
Extremely poor and vulnerable
groups
1.Number of income
generating projects initiated
by vulnerable groups
supported in non VUP
17 income generating
projects supported
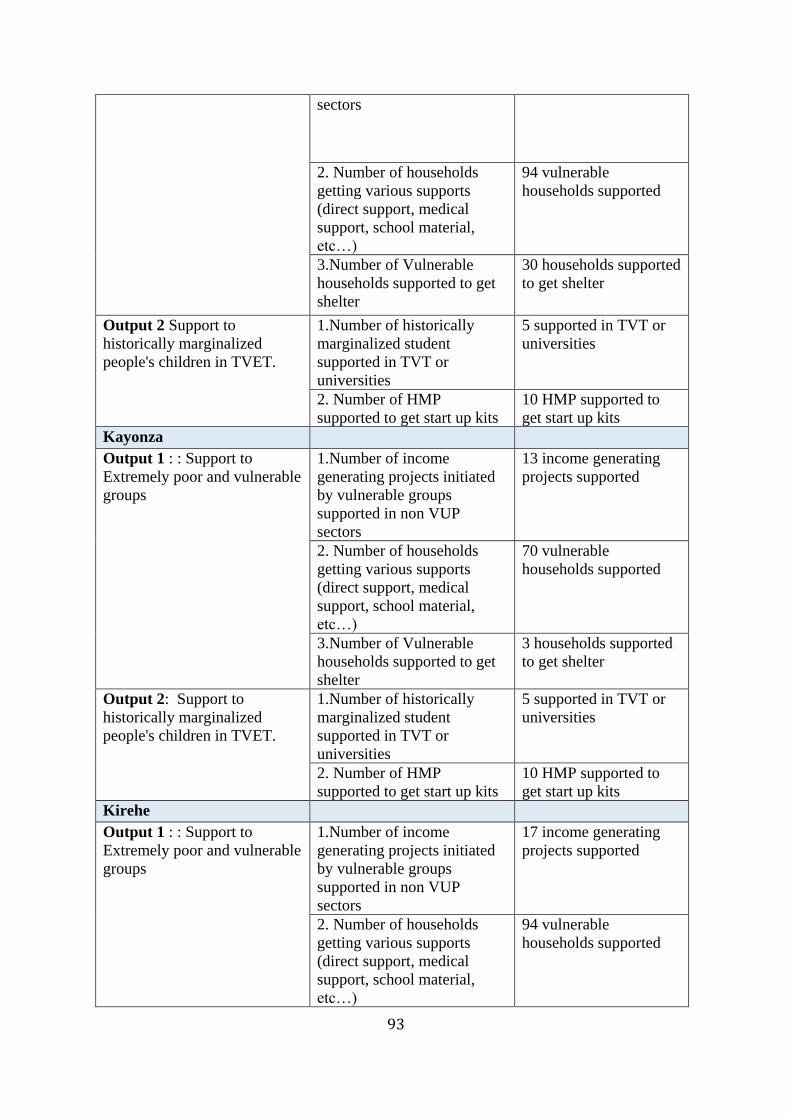
93
sectors
2. Number of households
getting various supports
(direct support, medical
support, school material,
etc…)
94 vulnerable
households supported
3.Number of Vulnerable
households supported to get
shelter
30 households supported
to get shelter
Output 2 Support to
historically marginalized
people's children in TVET.
1.Number of historically
marginalized student
supported in TVT or
universities
5 supported in TVT or
universities
2. Number of HMP
supported to get start up kits
10 HMP supported to
get start up kits
Kayonza
Output 1 : : Support to
Extremely poor and vulnerable
groups
1.Number of income
generating projects initiated
by vulnerable groups
supported in non VUP
sectors
13 income generating
projects supported
2. Number of households
getting various supports
(direct support, medical
support, school material,
etc…)
70 vulnerable
households supported
3.Number of Vulnerable
households supported to get
shelter
3 households supported
to get shelter
Output 2: Support to
historically marginalized
people's children in TVET.
1.Number of historically
marginalized student
supported in TVT or
universities
5 supported in TVT or
universities
2. Number of HMP
supported to get start up kits
10 HMP supported to
get start up kits
Kirehe
Output 1 : : Support to
Extremely poor and vulnerable
groups
1.Number of income
generating projects initiated
by vulnerable groups
supported in non VUP
sectors
17 income generating
projects supported
2. Number of households
getting various supports
(direct support, medical
support, school material,
etc…)
94 vulnerable
households supported
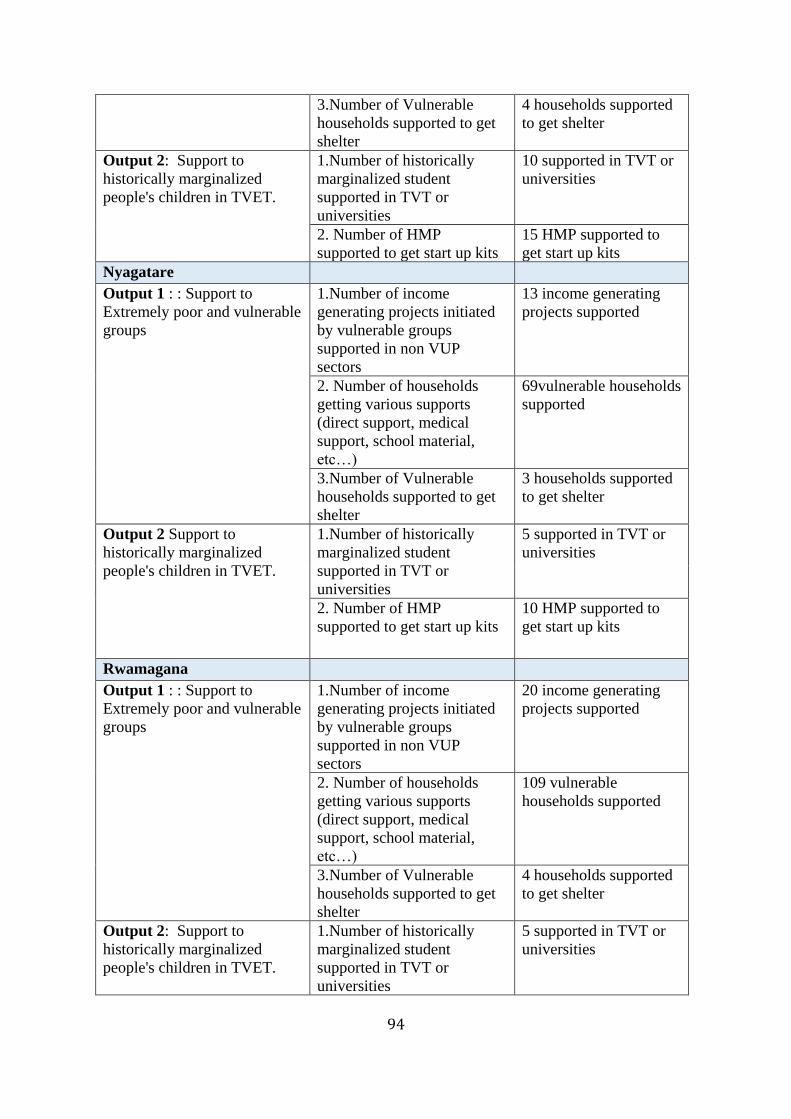
94
3.Number of Vulnerable
households supported to get
shelter
4 households supported
to get shelter
Output 2: Support to
historically marginalized
people's children in TVET.
1.Number of historically
marginalized student
supported in TVT or
universities
10 supported in TVT or
universities
2. Number of HMP
supported to get start up kits
15 HMP supported to
get start up kits
Nyagatare
Output 1 : : Support to
Extremely poor and vulnerable
groups
1.Number of income
generating projects initiated
by vulnerable groups
supported in non VUP
sectors
13 income generating
projects supported
2. Number of households
getting various supports
(direct support, medical
support, school material,
etc…)
69vulnerable households
supported
3.Number of Vulnerable
households supported to get
shelter
3 households supported
to get shelter
Output 2 Support to
historically marginalized
people's children in TVET.
1.Number of historically
marginalized student
supported in TVT or
universities
5 supported in TVT or
universities
2. Number of HMP
supported to get start up kits
10 HMP supported to
get start up kits
Rwamagana
Output 1 : : Support to
Extremely poor and vulnerable
groups
1.Number of income
generating projects initiated
by vulnerable groups
supported in non VUP
sectors
20 income generating
projects supported
2. Number of households
getting various supports
(direct support, medical
support, school material,
etc…)
109 vulnerable
households supported
3.Number of Vulnerable
households supported to get
shelter
4 households supported
to get shelter
Output 2: Support to
historically marginalized
people's children in TVET.
1.Number of historically
marginalized student
supported in TVT or
universities
5 supported in TVT or
universities

95
2. Number of HMP
supported to get start up kits
10 HMP supported to
get start up kits
Huye
Output 1 : : Support to
Extremely poor and vulnerable
groups
1.Number of income
generating projects initiated
by vulnerable groups
supported in non VUP
sectors
37 income generating
projects supported
2. Number of households
getting various supports
(direct support, medical
support, school material,
etc…)
203 vulnerable
households supported
3.Number of Vulnerable
households supported to get
shelter
7 households supported
to get shelter
Output 2: Support to
historically marginalized
people's children in TVET.
1.Number of historically
marginalized student
supported in TVT or
universities
12 supported in TVT or
universities
2. Number of HMP
supported to get start up kits
17 HMP supported to
get start up kits
Nyamagabe
Output 1 : Support to
Extremely poor and vulnerable
groups
1.Number of income
generating projects initiated
by vulnerable groups
supported in non VUP
sectors
32 income generating
projects supported
2. Number of households
getting various supports
(direct support, medical
support, school material,
etc…)
176 vulnerable
households supported
3.Number of Vulnerable
households supported to get
shelter
6 households supported
to get shelter
Output 2 Support to
historically marginalized
people's children in TVET.
1.Number of historically
marginalized student
supported in TVT or
universities
5 supported in TVT or
universities
2. Number of HMP
supported to get start up kits
10 HMP supported to
get start up kits
Gisagara
Output 1 : : Support to
Extremely poor and vulnerable
groups
1.Number of income
generating projects initiated
by vulnerable groups
supported in non VUP
40 income generating
projects supported
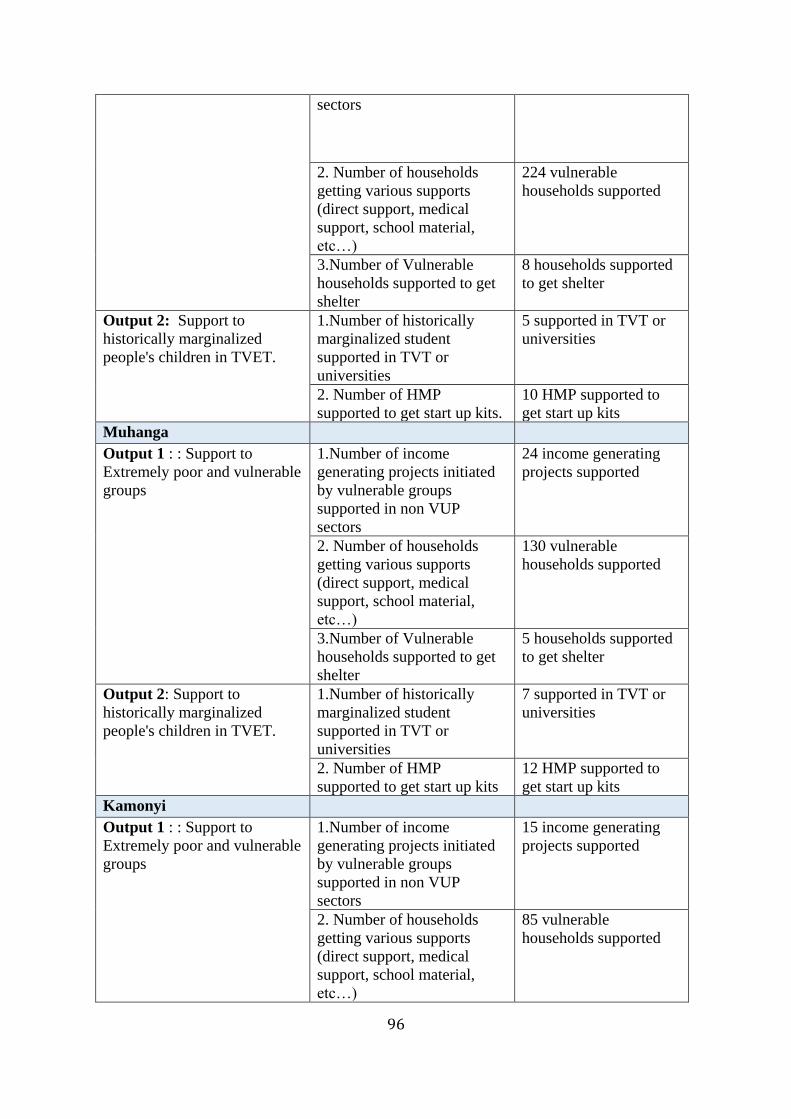
96
sectors
2. Number of households
getting various supports
(direct support, medical
support, school material,
etc…)
224 vulnerable
households supported
3.Number of Vulnerable
households supported to get
shelter
8 households supported
to get shelter
Output 2: Support to
historically marginalized
people's children in TVET.
1.Number of historically
marginalized student
supported in TVT or
universities
5 supported in TVT or
universities
2. Number of HMP
supported to get start up kits.
10 HMP supported to
get start up kits
Muhanga
Output 1 : : Support to
Extremely poor and vulnerable
groups
1.Number of income
generating projects initiated
by vulnerable groups
supported in non VUP
sectors
24 income generating
projects supported
2. Number of households
getting various supports
(direct support, medical
support, school material,
etc…)
130 vulnerable
households supported
3.Number of Vulnerable
households supported to get
shelter
5 households supported
to get shelter
Output 2: Support to
historically marginalized
people's children in TVET.
1.Number of historically
marginalized student
supported in TVT or
universities
7 supported in TVT or
universities
2. Number of HMP
supported to get start up kits
12 HMP supported to
get start up kits
Kamonyi
Output 1 : : Support to
Extremely poor and vulnerable
groups
1.Number of income
generating projects initiated
by vulnerable groups
supported in non VUP
sectors
15 income generating
projects supported
2. Number of households
getting various supports
(direct support, medical
support, school material,
etc…)
85 vulnerable
households supported
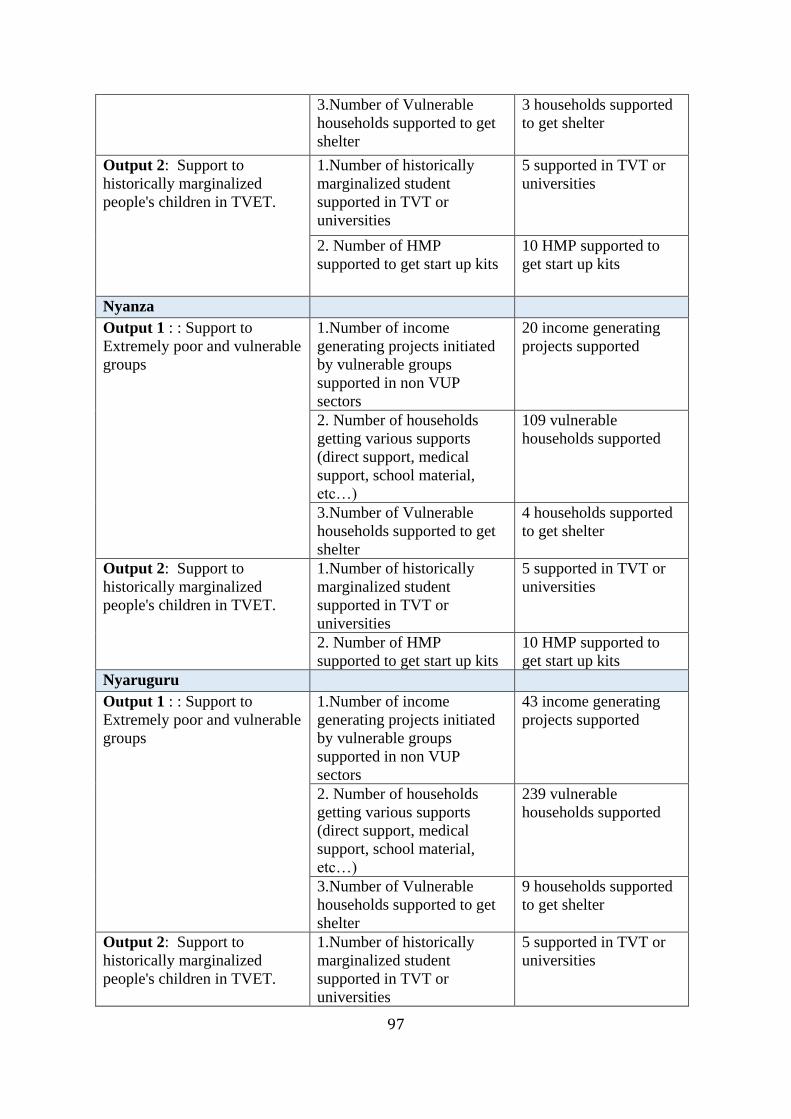
97
3.Number of Vulnerable
households supported to get
shelter
3 households supported
to get shelter
Output 2: Support to
historically marginalized
people's children in TVET.
1.Number of historically
marginalized student
supported in TVT or
universities
5 supported in TVT or
universities
2. Number of HMP
supported to get start up kits
10 HMP supported to
get start up kits
Nyanza
Output 1 : : Support to
Extremely poor and vulnerable
groups
1.Number of income
generating projects initiated
by vulnerable groups
supported in non VUP
sectors
20 income generating
projects supported
2. Number of households
getting various supports
(direct support, medical
support, school material,
etc…)
109 vulnerable
households supported
3.Number of Vulnerable
households supported to get
shelter
4 households supported
to get shelter
Output 2: Support to
historically marginalized
people's children in TVET.
1.Number of historically
marginalized student
supported in TVT or
universities
5 supported in TVT or
universities
2. Number of HMP
supported to get start up kits
10 HMP supported to
get start up kits
Nyaruguru
Output 1 : : Support to
Extremely poor and vulnerable
groups
1.Number of income
generating projects initiated
by vulnerable groups
supported in non VUP
sectors
43 income generating
projects supported
2. Number of households
getting various supports
(direct support, medical
support, school material,
etc…)
239 vulnerable
households supported
3.Number of Vulnerable
households supported to get
shelter
9 households supported
to get shelter
Output 2: Support to
historically marginalized
people's children in TVET.
1.Number of historically
marginalized student
supported in TVT or
universities
5 supported in TVT or
universities

98
2. Number of HMP
supported to get start up kits
10 HMP supported to
get start up kits
Ruhango
Output 1 : : Support to
Extremely poor and vulnerable
groups
1.Number of income
generating projects initiated
by vulnerable groups
supported in non VUP
sectors
19 income generating
projects supported
2. Number of households
getting various supports
(direct support, medical
support, school material,
etc…)
108 vulnerable
households supported
3.Number of Vulnerable
households supported to get
shelter
4 households supported
to get shelter
Output 2: Support to
historically marginalized
people's children in TVET.
1.Number of historically
marginalized student
supported in TVT or
universities
5 supported in TVT or
universities
2. Number of HMP
supported to get start up kits
10 HMP supported to
get start up kits
Rusizi
Output 1 : : Support to
Extremely poor and vulnerable
groups
1.Number of income
generating projects initiated
by vulnerable groups
supported in non VUP
sectors
18 income generating
projects supported
2. Number of households
getting various supports
(direct support, medical
support, school material,
etc…)
106 vulnerable
households supported
3.Number of Vulnerable
households supported to get
shelter
4 households supported
to get shelter
Output 2: Support to
historically marginalized
people's children in TVET.
1.Number of historically
marginalized student
supported in TVT or
universities
5 supported in TVT or
universities
2. Number of HMP
supported to get start up kits
10 HMP supported to
get start up kits
Nyabihu
Output 1 : : Support to
Extremely poor and vulnerable
groups
1.Number of income
generating projects initiated
by vulnerable groups
supported in non VUP
22 income generating
projects supported
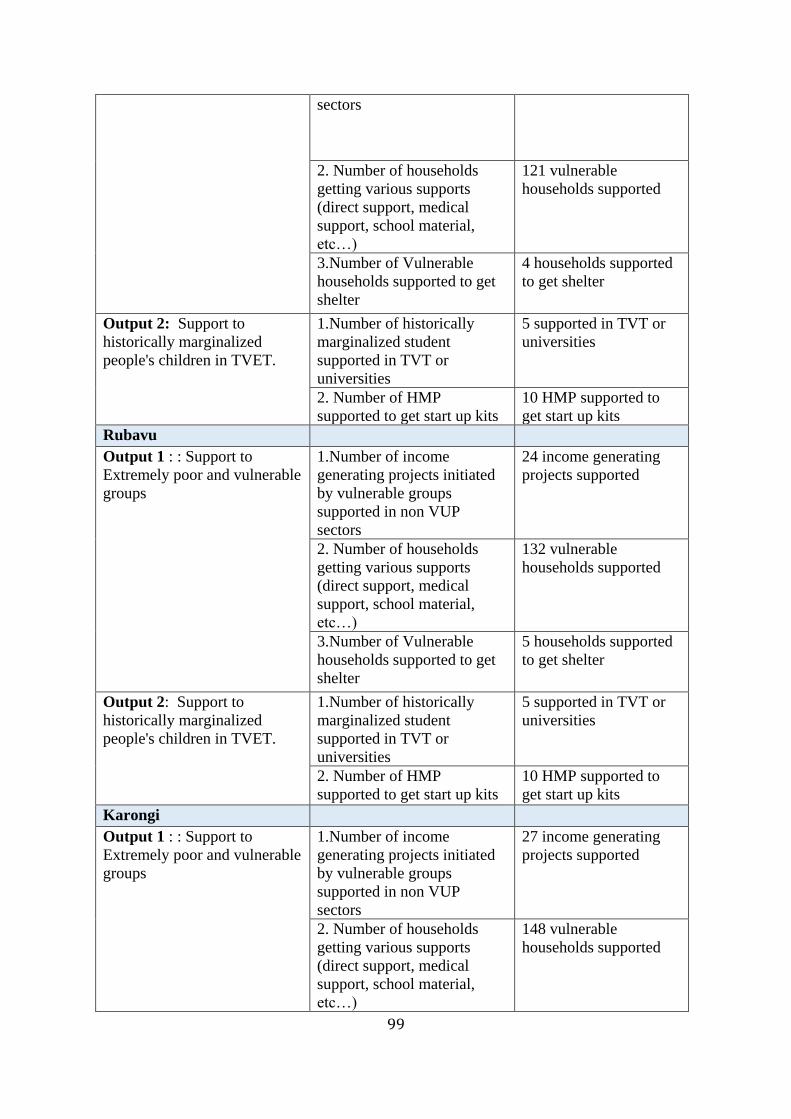
99
sectors
2. Number of households
getting various supports
(direct support, medical
support, school material,
etc…)
121 vulnerable
households supported
3.Number of Vulnerable
households supported to get
shelter
4 households supported
to get shelter
Output 2: Support to
historically marginalized
people's children in TVET.
1.Number of historically
marginalized student
supported in TVT or
universities
5 supported in TVT or
universities
2. Number of HMP
supported to get start up kits
10 HMP supported to
get start up kits
Rubavu
Output 1 : : Support to
Extremely poor and vulnerable
groups
1.Number of income
generating projects initiated
by vulnerable groups
supported in non VUP
sectors
24 income generating
projects supported
2. Number of households
getting various supports
(direct support, medical
support, school material,
etc…)
132 vulnerable
households supported
3.Number of Vulnerable
households supported to get
shelter
5 households supported
to get shelter
Output 2: Support to
historically marginalized
people's children in TVET.
1.Number of historically
marginalized student
supported in TVT or
universities
5 supported in TVT or
universities
2. Number of HMP
supported to get start up kits
10 HMP supported to
get start up kits
Karongi
Output 1 : : Support to
Extremely poor and vulnerable
groups
1.Number of income
generating projects initiated
by vulnerable groups
supported in non VUP
sectors
27 income generating
projects supported
2. Number of households
getting various supports
(direct support, medical
support, school material,
etc…)
148 vulnerable
households supported
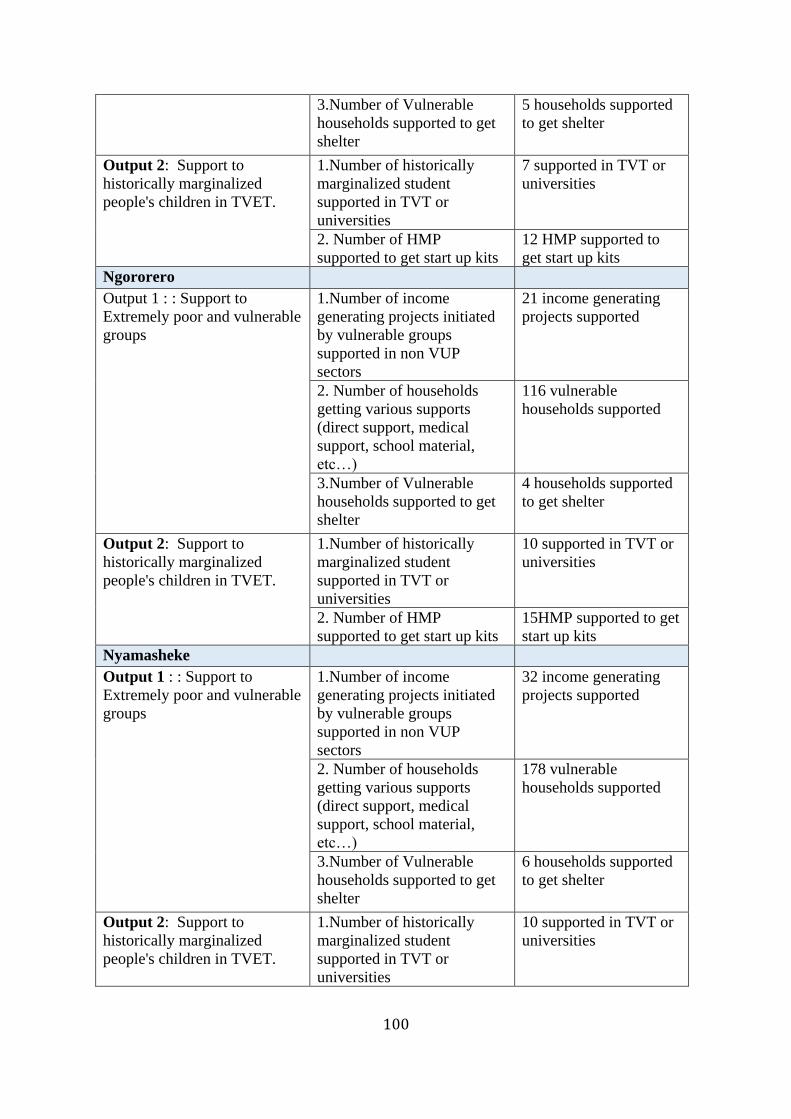
100
3.Number of Vulnerable
households supported to get
shelter
5 households supported
to get shelter
Output 2: Support to
historically marginalized
people's children in TVET.
1.Number of historically
marginalized student
supported in TVT or
universities
7 supported in TVT or
universities
2. Number of HMP
supported to get start up kits
12 HMP supported to
get start up kits
Ngororero
Output 1 : : Support to
Extremely poor and vulnerable
groups
1.Number of income
generating projects initiated
by vulnerable groups
supported in non VUP
sectors
21 income generating
projects supported
2. Number of households
getting various supports
(direct support, medical
support, school material,
etc…)
116 vulnerable
households supported
3.Number of Vulnerable
households supported to get
shelter
4 households supported
to get shelter
Output 2: Support to
historically marginalized
people's children in TVET.
1.Number of historically
marginalized student
supported in TVT or
universities
10 supported in TVT or
universities
2. Number of HMP
supported to get start up kits
15HMP supported to get
start up kits
Nyamasheke
Output 1 : : Support to
Extremely poor and vulnerable
groups
1.Number of income
generating projects initiated
by vulnerable groups
supported in non VUP
sectors
32 income generating
projects supported
2. Number of households
getting various supports
(direct support, medical
support, school material,
etc…)
178 vulnerable
households supported
3.Number of Vulnerable
households supported to get
shelter
6 households supported
to get shelter
Output 2: Support to
historically marginalized
people's children in TVET.
1.Number of historically
marginalized student
supported in TVT or
universities
10 supported in TVT or
universities

101
2. Number of HMP
supported to get start up kits
15 HMP supported to
get start up kits
Rutsiro
Output 1 : : Support to
Extremely poor and vulnerable
groups
1.Number of income
generating projects initiated
by vulnerable groups
supported in non VUP
sectors
23 income generating
projects supported
2. Number of households
getting various supports
(direct support, medical
support, school material,
etc…)
126 vulnerable
households supported
3.Number of Vulnerable
households supported to get
shelter
5 households supported
to get shelter
Output 2: Support to
historically marginalized
people's children in TVET.
1.Number of historically
marginalized student
supported in TVT or
universities
4 supported in TVT or
universities
2. Number of HMP
supported to get start up kits
9 HMP supported to get
start up kits
Burera
Output 1 : : Support to
Extremely poor and vulnerable
groups
1.Number of income
generating projects initiated
by vulnerable groups
supported in non VUP
sectors
26 income generating
projects supported
2. Number of households
getting various supports
(direct support, medical
support, school material,
etc…)
146 vulnerable
households supported
3.Number of Vulnerable
households supported to get
shelter
5 households supported
to get shelter
Output 2: Support to
historically marginalized
people's children in TVET.
1.Number of historically
marginalized student
supported in TVT or
universities
5 supported in TVT or
universities
2. Number of HMP
supported to get start up kits
10 HMP supported to
get start up kits
Gicumbi
Output 1 : : Support to
Extremely poor and vulnerable
groups
1.Number of income
generating projects initiated
by vulnerable groups
supported in non VUP
sectors
21 income generating
projects supported

102
2. Number of households
getting various supports
(direct support, medical
support, school material,
etc…)
119 vulnerable
households supported
3.Number of Vulnerable
households supported to get
shelter
4 households supported
to get shelter
Output 2: Support to
historically marginalized
people's children in TVET.
1.Number of historically
marginalized student
supported in TVT or
universities
5 supported in TVT or
universities
2. Number of HMP
supported to get start up kits
10 HMP supported to
get start up kits
Musanze
Output 1 : : Support to
Extremely poor and vulnerable
groups
1.Number of income
generating projects initiated
by vulnerable groups
supported in non VUP
sectors
19 income generating
projects supported
2. Number of households
getting various supports
(direct support, medical
support, school material,
etc…)
108 vulnerable
households supported
3.Number of Vulnerable
households supported to get
shelter
4 households supported
to get shelter
Output 2 Support to
historically marginalized
people's children in TVET.
1.Number of historically
marginalized student
supported in TVT or
universities
5 supported in TVT or
universities
2. Number of HMP
supported to get start up kits.
10 HMP supported to
get start up kits
Gakenke
Output 1 : : Support to
Extremely poor and vulnerable
groups
1.Number of income
generating projects initiated
by vulnerable groups
supported in non VUP
sectors
25 income generating
projects supported
2. Number of households
getting various supports
(direct support, medical
support, school material,
etc…)
140 vulnerable
households supported
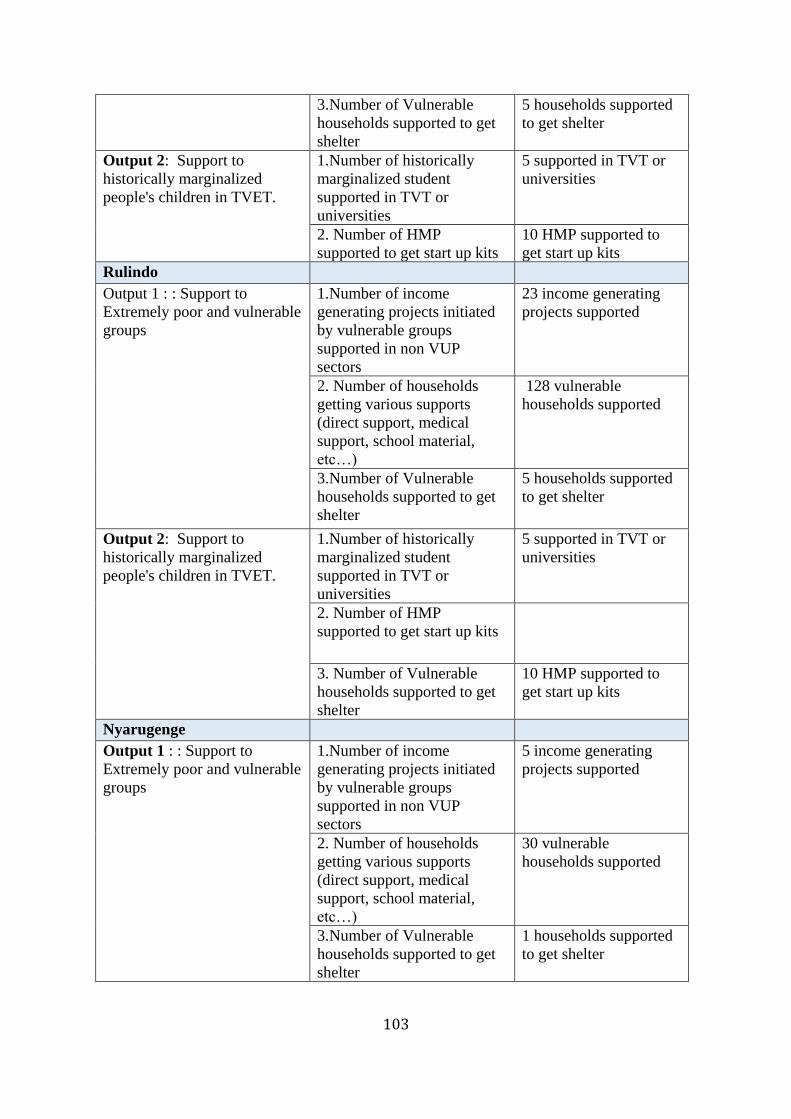
103
3.Number of Vulnerable
households supported to get
shelter
5 households supported
to get shelter
Output 2: Support to
historically marginalized
people's children in TVET.
1.Number of historically
marginalized student
supported in TVT or
universities
5 supported in TVT or
universities
2. Number of HMP
supported to get start up kits
10 HMP supported to
get start up kits
Rulindo
Output 1 : : Support to
Extremely poor and vulnerable
groups
1.Number of income
generating projects initiated
by vulnerable groups
supported in non VUP
sectors
23 income generating
projects supported
2. Number of households
getting various supports
(direct support, medical
support, school material,
etc…)
128 vulnerable
households supported
3.Number of Vulnerable
households supported to get
shelter
5 households supported
to get shelter
Output 2: Support to
historically marginalized
people's children in TVET.
1.Number of historically
marginalized student
supported in TVT or
universities
5 supported in TVT or
universities
2. Number of HMP
supported to get start up kits
3. Number of Vulnerable
households supported to get
shelter
10 HMP supported to
get start up kits
Nyarugenge
Output 1 : : Support to
Extremely poor and vulnerable
groups
1.Number of income
generating projects initiated
by vulnerable groups
supported in non VUP
sectors
5 income generating
projects supported
2. Number of households
getting various supports
(direct support, medical
support, school material,
etc…)
30 vulnerable
households supported
3.Number of Vulnerable
households supported to get
shelter
1 households supported
to get shelter
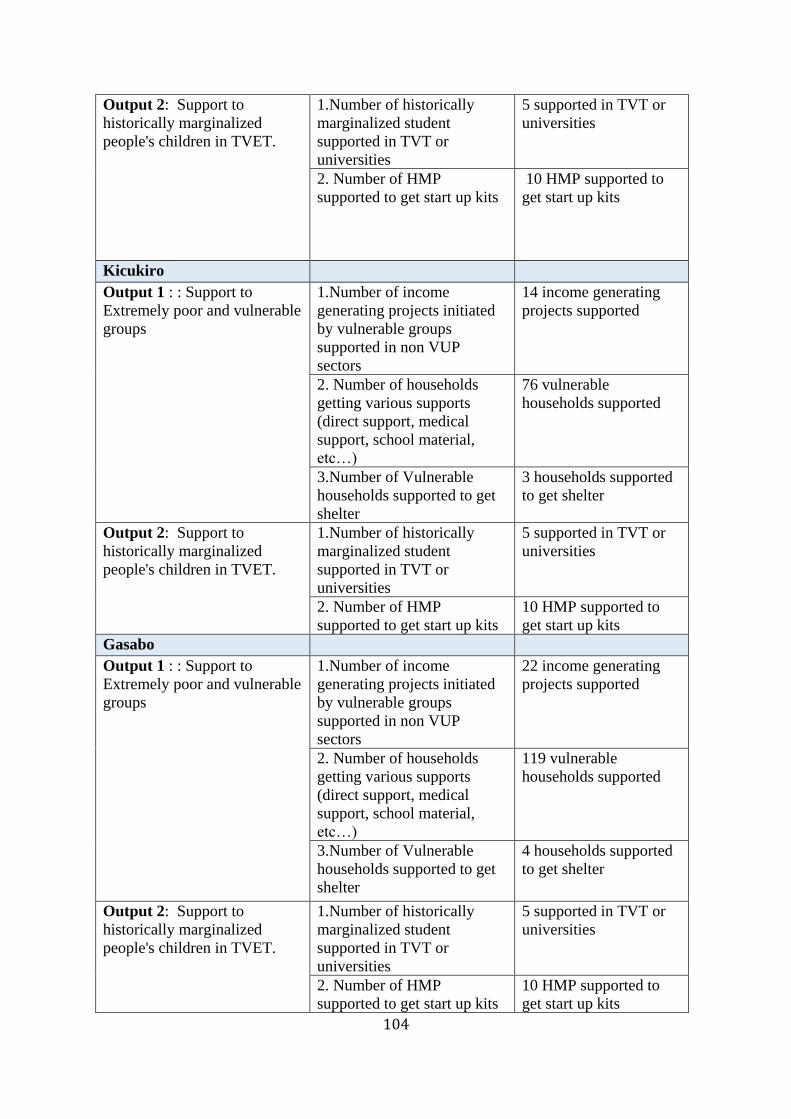
104
Output 2: Support to
historically marginalized
people's children in TVET.
1.Number of historically
marginalized student
supported in TVT or
universities
5 supported in TVT or
universities
2. Number of HMP
supported to get start up kits
10 HMP supported to
get start up kits
Kicukiro
Output 1 : : Support to
Extremely poor and vulnerable
groups
1.Number of income
generating projects initiated
by vulnerable groups
supported in non VUP
sectors
14 income generating
projects supported
2. Number of households
getting various supports
(direct support, medical
support, school material,
etc…)
76 vulnerable
households supported
3.Number of Vulnerable
households supported to get
shelter
3 households supported
to get shelter
Output 2: Support to
historically marginalized
people's children in TVET.
1.Number of historically
marginalized student
supported in TVT or
universities
5 supported in TVT or
universities
2. Number of HMP
supported to get start up kits
10 HMP supported to
get start up kits
Gasabo
Output 1 : : Support to
Extremely poor and vulnerable
groups
1.Number of income
generating projects initiated
by vulnerable groups
supported in non VUP
sectors
22 income generating
projects supported
2. Number of households
getting various supports
(direct support, medical
support, school material,
etc…)
119 vulnerable
households supported
3.Number of Vulnerable
households supported to get
shelter
4 households supported
to get shelter
Output 2: Support to
historically marginalized
people's children in TVET.
1.Number of historically
marginalized student
supported in TVT or
universities
5 supported in TVT or
universities
2. Number of HMP
supported to get start up kits
10 HMP supported to
get start up kits

105
6. Reporting System
The decentralized entities will provide financial execution reports on earmarked transfers to
MINECOFIN, monthly, quarterly and annually as required by the law.
7. Monitoring and Evaluation System
Earmarking institution will monitor and evaluate the implementation of earmarked transfers
using financial reports and performance reports from Decentralized Entities to inform the
next cycle of earmarked transfers.
8. Disbursement Schedule and Conditions
Decentralized entities have the responsibility to provide cash flow plans for all earmarked
transfers and to make commitment accordingly. Commitment can be done for direct payment
or for indirect payment by transferring funds to the decentralized entity’s account. However,
on the basis of instructions provided by the Ministry of Justice, the Treasury reserves the
right to withhold any transfers committed by the Decentralized entity. In such a case, the
concerned Decentralized entity will formally be informed to take corrective actions, failure of
which, will attract sanctions as prescribed by the Law.

106
6. National Commission for Children (NCC)
1. Objective of the Earmarked Program and Sub-Program
Table 1: Program and Sub Program Objectives
Program and Sub-Program Objectives
Social Protection To ensure promotion and
protection of children’s rights
Family Protection and Women Empowerment
1. To operationalize children's
forums from Village to District
level and hold the 12th National
Children's Summit to ensure child
participation in local and national
decision making
2. To ensure the wellbeing of needy
children (orphans, children in
streets, children living with
disabilities and infants living with
their mothers in detention centers)
3. To ensure the successful
reintegration of children from
orphanages into families
4. To facilitate districts in the
coordination of organizations active
in the promotion and protection of
children’s rights
2. Transferred Outputs
Table 2: Transferred Outputs
Program &
Subprogram
Outputs Activities
Social
Protection
Family
Protection and
Women
Empowerment
Output 1: Children’s forums from village to
district level are operational and the 12th National
Children Summit is held to ensure child
participation in local and national decision
making.
Activity 1: Train elected children forums’
committees on their
responsibilities, child rights, child
related laws and policies, national
core values and participation from
cell to district level (6
representative per cell, 6 per sector
and 6 per district) Activity 2: Hold consultation meeting at all
levels for the preparation of 12th
National Children Summit Activity 3: Ensure the transport of

107
representatives from sector and
District level to 12th National
Children's Summit
Output 2: Centers for vulnerable children are
supported to facilitate the reintegration of children
and ensure the wellbeing of children who are still
in residential care waiting for family reintegration,
in line with the National Strategy for Child Care
Reform
Activity 1: Provide financial support to
orphanages, centers for children in
streets, centers of children living
with disability and Prisons having
children under three years living
with their mothers. Output 3: Child protection professional and para-
professional social welfare workforce facilitated
to support the most vulnerable children in 30
districts
Activity 1:
Provide family reintegration
package for children from
orphanages into families
Activity 2: Hold coordination meetings of
friends of the families (Inshuti
z'Umuryango) at Sector and
District levels Activity 3: Hold group sessions with parents
and community members
preparing them for receiving
children from orphanages and for
following up the reintegrated
children
Activity 4:
Provide 60 social workers and
psychologists in 19 districts
with transport, communication,
office supplies and consumables
and ICT equipments fees Output 4: Coordination mechanisms of child
protection interveners at district level are
operational
Activity 1: Ensure coordination of child
protection interveners at the
district level

108
3. Allocation Formula by Sub-Program and Output
Table 3: Allocation by Sub-Program and Output
Program &
Subprogram
Outputs Method Amount
Social protection
Family
Protection and
Women
Empowerment
Output 1:
Children’s forums
from village to district
level are operational
and the 12th National
Children Summit is
held to ensure child
participation in local
and national decision
making.
Output 1 Allocation: considering the
number of children forums’
representatives to be trained, for
village representatives attending
training at cell level no funding
involved, (2 representatives per cell
and 6 per sector in training at sector
level and 2 per sector and 6 per
district in training at District level:
(2,148 x 2 children + 416 x 6
children) x 4000 (transport) + (416 x
2 children + 30 x 6 children ) x 8000
(transport) = 35,264,000 RWF, 1
consultation meeting per year at all
levels for the preparation of 12th
National Children Summit, for village
representatives attending the meeting
at cell level no funding involved; for
cell representatives attending the
meeting at Sector level: (2148 cell x 2
reps. + 416 x 1reps. ) x 4,000 RWF
(transport) = 18,848,000 RWF; for
sector representatives attending the
meeting at District level: 416 sector x
2 reps. x 8000 RWF (transport) =
6,656,000 RWF and transport for
Children’s forums representatives
from sector and district levels to 12th
National Children's Summit (one per
sector, 2 per district and one mentor
per district: (416 x 20000RWF+ 2 x
30 x 20000+30 x
20000=10,120,000RWF).
70,888,000
Output 2: Centers for
vulnerable children are
supported to facilitate
the reintegration of
children and ensure the
wellbeing of children
who are still in
residential care waiting
for family reintegration,
in line with the National
Strategy for Child Care
Reform.
Output 2 Allocation: considering
171 children living in 3 orphanages in
3 districts, 1333 children living in 16
centers for children in the streets in 9
districts, 2910 children living in 42
centers for children with disabilities
in 23 districts, 412 children living in 5
prisons having children under 3 years
living with their mothers in 5 districts
and the type of support needed:
[15,539,216 (orphanages)
+100,253,774 (centers for children in
the streets) +94,704,004 (centers for
236,606,068

109
children with disabilities +25,869,074
(prisons)].
Output 3: Child
protection professional
and para-professional
social welfare workforce
facilitated to support the
most vulnerable children
in 30 districts
Output 3 Allocation: considering
the number of children in need to be
reintegrated per each district:[2/4 of
594 children x 252,000], the number
of community sessions to be held and
number of attendees per district: [ 4
quarterly sessions x 30 participants x
10 districts x (5000 for transport +
3000 for lunch)] and transport,
communication, office supplies and
consumables and ICT equipments
fees for social workers and
psychologists in charge of identifying
and assisting families most in need:
[(80,000 RWF of an average per car
hired x 3 travels/month x 12 months x
60 social workers)+( 3 travels/month
x 12 months x 60 social workers x
6000 RWF of domestic per diem
when the social worker goes and
comes back)+( ¼*3 travels/month x
12 months x 60 social workers x
35,000 RWF of an average per night
passed out of the district when the
tracing happens out of the district)+
(10000 RWF of communication x 60
social workers x 12 months + 20000
of modem connection x 60 social
workers x 12 months + (45,000 RWF
of an average per cartridge per quarter
x 60 professionals in all Districts) +
(3500 RWF of an average per ream of
paper x 2 ream of papers per quarter x
60 professionals) + (300,000 for
printer *3 Districts]
487,682,200
Output 4: Coordination
mechanisms of child
protection interveners at
district level are
operational and produce
regular reports to NCC
Output 4 Allocation: considering
the number of meetings to be held and
number of child protection
interveners in districts: (2 quarterly
meetings x 314 organizations x
10,000 RWF / attendance
remuneration fee per organization).
6,280,000

110
4. Allocation Formula by Decentralized Entity
Basis of Allocation Formula by Decentralized Entity:
Output 1:
Activity 1 an equal amount of 4,000 Rwf times 2 representatives per cell and 6 per sector in training at
sector level, of 8,000 Rwf times 2 per sector and 6 per district in training at District level has been
allocated to each district.
Activity 2, each district has been allocated an amount according to the following costing: one meeting per
year, an equal amount of 4,000 Rwf times 2 representatives per cell and 1 per sector in meeting at sector
level, of 8,000 Rwf times 2 per sector in meeting at District.
Activity 3, each district has been allocated an amount according to the following costing: one children’s
forums representative per each administrative sector, one children’s forums representative per each
district, one child representing children with disabilities per each district plus one mentor (GFPO) per each
district times an average of 20,000 Rwf each.
Output 2:
Activity 1 an amount has been allocated to each district according to the type of structure and number of
children living in the structure; type of assistance provided to each child in the specific structure and
finally another consideration is the financial support that the structure already receives from other
institutions. Annex I shows the allocation by children structure by district.
Output 3:
Activity 1, an equal amount of 21,000 Rwf times the half number of children ready to be
reintegrated times 12 months.
Activity 2, each district has been allocated an amount according to the following costing: an average
amount of 1000 Rfw times the number of friends of the families (2 per village) times 2, plus an equal
amount of 10,000 Rfw times the number of coordinators of friends of the families at sector level times 2,
plus an equal amount of 2100 Rfw times the number of friends of the families and an average of 100 Rfw
times the number of villages times 4.
Activity 3, only the districts of Bugesera, Gatsibo, Kayonza, Musanze, Gicumbi, Rusizi, Muhanga,
Nyanza, Nyamagabe and Gasabo have been allocated an equal amount 5000 Rwf for transportation and
3000 Rwf for food times the number of participants times 4 quarters.
Activity 4, an amount has been allocated to each district according to the number of social
workforce working there. Annex II shows the allocation by district.
Output 4:
Activity 1, each district has been allocated an amount according to the following costing: an average
amount of 10000 Rfw times the number of organizations active in district times 2 quarters.

111
Table 4: Allocation by Output, Sub-Programs and Program to Decentralized Entity
District
Output 1 Output 2 Output 3 Output
4
Subprogra
m 1.1 Total
Activity 1 Activity 2 Activity 3 Activity 1 Activity 1 Activity 2 Activity 3 Activity 4 Activity 1
NGOMA 1,120,000 792,000 340,000 8,869,074 - 5,267,800 - 7,958,000 180,000 24,526,874
BUGESERA 1,224,000 876,000 360,000 3,000,000 6,300,000 6,196,600 960,000 15,916,000 360,000 35,192,600
GATSIBO 1,160,000 832,000 340,000 2,000,000 0 6,385,800 960,000 15,916,000 180,000 27,773,800
KAYONZA 928,000 640,000 300,000 11,026,214 10,080,000 4,820,600 960,000 16,216,000 140,000 45,110,814
KIREHE 1,008,000 720,000 300,000 0 0 6,463,200 0 0 120,000 8,611,200
NYAGATARE 1,456,000 1,128,000 340,000 8,800,000 0 6,600,800 0 0 120,000 18,444,800
RWAMAGANA 1,264,000 936,000 340,000 2,000,000 0 5,276,400 0 0 80,000 9,896,400
HUYE 1,224,000 896,000 340,000 36,162,999 0 5,568,800 0 8,258,000 360,000 52,809,799
NYAMAGABE 1,464,000 1,076,000 400,000 3,800,000 18,900,000 5,809,600 960,000 16,216,000 280,000 48,905,600
GISAGARA 1,040,000 732,000 320,000 2,000,000 0 5,706,400 0 120,000 9,918,400
MUHANGA 1,032,000 744,000 300,000 9,904,503 3,024,000 4,046,600 960,000 7,958,000 240,000 28,209,103
KAMONYI 1,000,000 712,000 300,000 2,500,000 0 3,926,200 0 7,958,000 200,000 16,596,200
NYANZA 856,000 608,000 260,000 3,700,162 6,300,000 4,812,000 960,000 15,916,000 140,000 33,552,162
NYARUGURU 1,184,000 856,000 340,000 2,500,000 0 4,055,200 0 0 200,000 9,135,200
RUSIZI 1,520,000 1,112,000 420,000 17,716,225 0 6,325,600 960,000 15,916,000 180,000 44,149,825
NYABIHU 1,112,000 824,000 300,000 500,000 0 5,267,800 0 140,000 8,143,800
RUBAVU 1,168,000 880,000 300,000 8,508,662 0 5,715,000 0 7,958,000 500,000 25,029,662
KARONGI 1,272,000 964,000 320,000 0 0 5,826,800 0 7,958,000 180,000 16,520,800
NGORORERO 1,152,000 844,000 320,000 8,000,000 0 4,803,400 0 0 200,000 15,319,400
NYAMASHEKE 1,192,000
844,000 360,000 2,500,000 0 6,256,800 0 0 260,000 11,412,800

112
RUTSIRO 1,064,000 756,000 320,000 3,000,000 0 5,371,000 0 0 100,000 10,611,000
BURERA 1,280,000 892,000 400,000 0 0 6,110,600 0 0 140,000 8,822,600
GICUMBI 1,760,000 1,292,000 480,000 2,700,000 12,600,000 6,618,000 960,000 23,874,000 400,000 50,684,000
MUSANZE 1,192,000 844,000 360,000 12,843,312 5,040,000 4,915,200 960,000 15,916,000 300,000 42,370,512
RULINDO 1,296,000 908,000 400,000 2,500,000 0 5,448,400 0 7,958,000 300,000 18,810,400
GAKENKE 1,584,000 1,156,000 440,000 3,000,000 0 6,506,200 0 0 120,000 12,806,200
RUHANGO 880,000 652,000 240,000 8,241,590 0 5,783,800 0 7,958,000 200,000 23,955,390
NYARUGENGE 824,000 576,000 260,000 15,139,316 0 4,253,000 0 7,958,000 140,000 29,150,316
KICUKIRO 776,000 528,000 260,000 16,777,799 0 4,012,200 0 7,958,000 160,000 30,471,999
GASABO 1,232,000 884,000 360,000 38,916,212 12,600,000 5,448,400 960,000 23,874,000 240,000 84,514,612
TOTAL 35,264,000 25,504,000 10,120,000 236,606,068 74,844,000 163,598,200 9,600,000 239,640,000 6,280,000 801,456,268

113
5. Performance Targets and Indicators
Table 5: Performance Indicators by Decentralized Budget Agency for Output
District and Output Performance Indicator Annual Target
Ngoma Output 1: Children’s
forums from village to
district level are operational
and the 12th National
Children Summit is held to
ensure child participation in
local and national decision
making
# of Children’s forums from
village to Districts operational
% of selected participants from
sectors and districts attending the
National Children's Summit
1 per village, 1 per cell, 1 per sector,
and 1 per district
100% of selected participants
participating in the Summit
Output 2: Centers for
vulnerable children are
supported to facilitate the
reintegration of children
and ensure the wellbeing of
children who are still in
residential care waiting for
family reintegration, in line
with the National Strategy
for Child Care Reform
# of centers (orphanages, centers
for children in streets, centers for
children with disabilities and
prisons having children under
three years living with their
mothers) whose children are
supported
# of children supported through
the centres (breakdown by type of
centre, by sex and by age (0-5; 6-
11; 12-18; 18 and above)
1 center for children with disabilities
and 1 prison having children under
three years living with their mothers
Output 3: Child protection
professional and para-
professional social welfare
workforce facilitated to
support the most vulnerable
children in 30 districts
# of children given reintegration
package
# of friends of families (IZU)
facilitated
% of selected parents and
community members attending
group session each quarter
# of social workers &
psychologists facilitated
0 children
100% of selected parents and
community members
946 IZU
2 social workers & psychologists
Output 4: Coordination
mechanisms of child
protection interveners at
district level are operational
and produce regular reports
to NCC
# of meetings held,
# of organizations intervening in
child protection
2 meetings
9 organizations
Bugesera Output 1: Children’s
forums from village to
district level are operational
and the 12th National
Children Summit is held to
ensure child participation in
local and national decision
making
# of Children’s forums from
village to Districts operational
% of selected participants from
sectors and districts attending the
National Children's Summit
1 per village, 1 per cell, 1 per sector,
and 1 per district
100% of selected participants
participating in the Summit
Output 2: Centers for
vulnerable children are
supported to facilitate the
reintegration of children
and ensure the wellbeing of
# of centers (orphanages, centers
for children in streets, centers for
children with disabilities and
prisons having children under
three years living with their
1 center for children with disabilities

114
children who are still in
residential care waiting for
family reintegration, in line
with the National Strategy
for Child Care Reform
mothers) whose children are
supported
# of children supported through
the centres (breakdown by type of
centre, by sex and by age (0-5; 6-
11; 12-18; 18 and above) Output 3: Child protection
professional and para-
professional social welfare
workforce facilitated to
support the most vulnerable
children in 30 districts
# of children given reintegration
package
# of friends of families (IZU)
facilitated
% of selected parents and
community members attending
group session each quarter
# of social workers &
psychologists facilitated
50 children
100% of selected parents and
community members
1,162 IZU
6 social workers & psychologists
Output 4: Coordination
mechanisms of child
protection interveners at
district level are operational
and produce regular reports
to NCC
# of meetings held,
# of organizations intervening in
child protection
2 meetings
18 organizations
Gatsibo Output 1: Children’s
forums from village to
district level are operational
and the 12th National
Children Summit is held to
ensure child participation in
local and national decision
making
# of Children’s forums from
village to Districts operational
% of selected participants from
sectors and districts attending the
National Children's Summit
1 per village, 1 per cell, 1 per sector,
and 1 per district
100% of selected participants
participating in the Summit
Output 2: Centers for
vulnerable children are
supported to facilitate the
reintegration of children
and ensure the wellbeing of
children who are still in
residential care waiting for
family reintegration, in line
with the National Strategy
for Child Care Reform
# of centers (orphanages, centers
for children in streets, centers for
children with disabilities and
prisons having children under
three years living with their
mothers) whose children are
supported
# of children supported through
the centres (breakdown by type of
centre, by sex and by age (0-5; 6-
11; 12-18; 18 and above)
2 centers for children with disabilities
Output 3: Child protection
professional and para-
professional social welfare
workforce facilitated to
support the most vulnerable
children in 30 districts
# of children given reintegration
package
# of friends of families (IZU)
facilitated
% of selected parents and
community members attending
group session each quarter
# of social workers &
psychologists facilitated
0 children
100% of selected parents and
community members
1,206 IZU
4 social workers & psychologists
Output 4: Coordination
mechanisms of child
protection interveners at
district level are operational
# of meetings held,
# of organizations intervening in
child protection
2 meetings
9 organizations
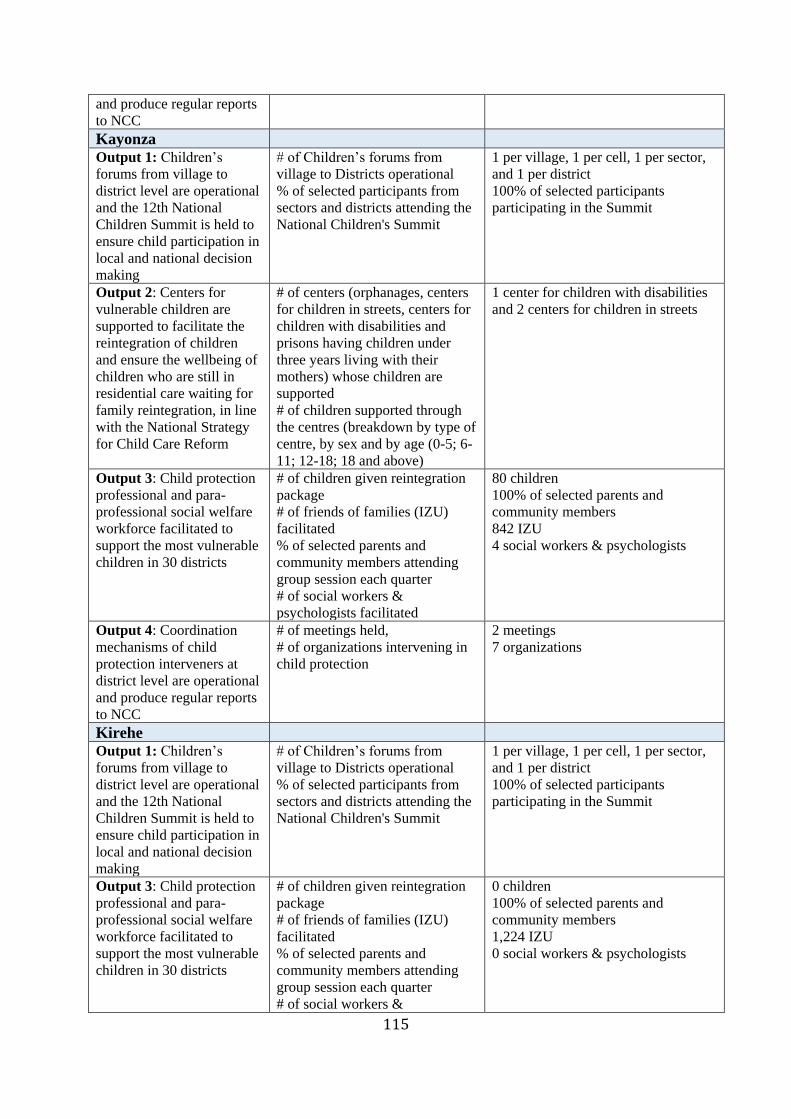
115
and produce regular reports
to NCC
Kayonza Output 1: Children’s
forums from village to
district level are operational
and the 12th National
Children Summit is held to
ensure child participation in
local and national decision
making
# of Children’s forums from
village to Districts operational
% of selected participants from
sectors and districts attending the
National Children's Summit
1 per village, 1 per cell, 1 per sector,
and 1 per district
100% of selected participants
participating in the Summit
Output 2: Centers for
vulnerable children are
supported to facilitate the
reintegration of children
and ensure the wellbeing of
children who are still in
residential care waiting for
family reintegration, in line
with the National Strategy
for Child Care Reform
# of centers (orphanages, centers
for children in streets, centers for
children with disabilities and
prisons having children under
three years living with their
mothers) whose children are
supported
# of children supported through
the centres (breakdown by type of
centre, by sex and by age (0-5; 6-
11; 12-18; 18 and above)
1 center for children with disabilities
and 2 centers for children in streets
Output 3: Child protection
professional and para-
professional social welfare
workforce facilitated to
support the most vulnerable
children in 30 districts
# of children given reintegration
package
# of friends of families (IZU)
facilitated
% of selected parents and
community members attending
group session each quarter
# of social workers &
psychologists facilitated
80 children
100% of selected parents and
community members
842 IZU
4 social workers & psychologists
Output 4: Coordination
mechanisms of child
protection interveners at
district level are operational
and produce regular reports
to NCC
# of meetings held,
# of organizations intervening in
child protection
2 meetings
7 organizations
Kirehe Output 1: Children’s
forums from village to
district level are operational
and the 12th National
Children Summit is held to
ensure child participation in
local and national decision
making
# of Children’s forums from
village to Districts operational
% of selected participants from
sectors and districts attending the
National Children's Summit
1 per village, 1 per cell, 1 per sector,
and 1 per district
100% of selected participants
participating in the Summit
Output 3: Child protection
professional and para-
professional social welfare
workforce facilitated to
support the most vulnerable
children in 30 districts
# of children given reintegration
package
# of friends of families (IZU)
facilitated
% of selected parents and
community members attending
group session each quarter
# of social workers &
0 children
100% of selected parents and
community members
1,224 IZU
0 social workers & psychologists

116
psychologists facilitated
Output 4: Coordination
mechanisms of child
protection interveners at
district level are operational
and produce regular reports
to NCC
# of meetings held,
# of organizations intervening in
child protection
2 meetings
6 organizations
Nyagatare Output 1: Children’s
forums from village to
district level are operational
and the 12th National
Children Summit is held to
ensure child participation in
local and national decision
making
# of Children’s forums from
village to Districts operational
% of selected participants from
sectors and districts attending the
National Children's Summit
1 per village, 1 per cell, 1 per sector,
and 1 per district
100% of selected participants
participating in the Summit
Output 2: Centers for
vulnerable children are
supported to facilitate the
reintegration of children
and ensure the wellbeing of
children who are still in
residential care waiting for
family reintegration, in line
with the National Strategy
for Child Care Reform
# of centers (orphanages, centers
for children in streets, centers for
children with disabilities and
prisons having children under
three years living with their
mothers) whose children are
supported
# of children supported through
the centres (breakdown by type of
centre, by sex and by age (0-5; 6-
11; 12-18; 18 and above)
2 centers for children with disabilities
and 1 prison having children under
three years living with their mothers
Output 3: Child protection
professional and para-
professional social welfare
workforce facilitated to
support the most vulnerable
children in 30 districts
# of children given reintegration
package
# of friends of families (IZU)
facilitated
% of selected parents and
community members attending
group session each quarter
# of social workers &
psychologists facilitated
0 children
100% of selected parents and
community members
1,256 IZU
0 social workers & psychologists
Output 4: Coordination
mechanisms of child
protection interveners at
district level are operational
and produce regular reports
to NCC
# of meetings held,
# of organizations intervening in
child protection
2 meetings
6 organizations
Rwamagana Output 1: Children’s
forums from village to
district level are operational
and the 12th National
Children Summit is held to
ensure child participation in
local and national decision
making
# of Children’s forums from
village to Districts operational
% of selected participants from
sectors and districts attending the
National Children's Summit
1 per village, 1 per cell, 1 per sector,
and 1 per district
100% of selected participants
participating in the Summit
Output 2: Centers for # of centers (orphanages, centers 1 center for children with disabilities

117
vulnerable children are
supported to facilitate the
reintegration of children
and ensure the wellbeing of
children who are still in
residential care waiting for
family reintegration, in line
with the National Strategy
for Child Care Reform
for children in streets, centers for
children with disabilities and
prisons having children under
three years living with their
mothers) whose children are
supported
# of children supported through
the centres (breakdown by type of
centre, by sex and by age (0-5; 6-
11; 12-18; 18 and above)
and 1 center for children in streets
Output 3: Child protection
professional and para-
professional social welfare
workforce facilitated to
support the most vulnerable
children in 30 districts
# of children given reintegration
package
# of friends of families (IZU)
facilitated
% of selected parents and
community members attending
group session each quarter
# of social workers &
psychologists facilitated
0 children
100% of selected parents and
community members
948 IZU
0 social workers & psychologists
Output 4: Coordination
mechanisms of child
protection interveners at
district level are operational
and produce regular reports
to NCC
# of meetings held,
# of organizations intervening in
child protection
2 meetings
4 organizations
Huye Output 1: Children’s
forums from village to
district level are operational
and the 12th National
Children Summit is held to
ensure child participation in
local and national decision
making
# of Children’s forums from
village to Districts operational
% of selected participants from
sectors and districts attending the
National Children's Summit
1 per village, 1 per cell, 1 per sector,
and 1 per district
100% of selected participants
participating in the Summit
Output 2: Centers for
vulnerable children are
supported to facilitate the
reintegration of children
and ensure the wellbeing of
children who are still in
residential care waiting for
family reintegration, in line
with the National Strategy
for Child Care Reform
# of centers (orphanages, centers
for children in streets, centers for
children with disabilities and
prisons having children under
three years living with their
mothers) whose children are
supported
# of children supported through
the centres (breakdown by type of
centre, by sex and by age (0-5; 6-
11; 12-18; 18 and above)
4 center for children with disabilities
and 3 centers for children in streets
Output 3: Child protection
professional and para-
professional social welfare
workforce facilitated to
support the most vulnerable
children in 30 districts
# of children given reintegration
package
# of friends of families (IZU)
facilitated
% of selected parents and
community members attending
group session each quarter
# of social workers &
psychologists facilitated
0 children
100% of selected parents and
community members
1,016 IZU
2 social workers & psychologists

118
Output 4: Coordination
mechanisms of child
protection interveners at
district level are operational
and produce regular reports
to NCC
# of meetings held,
# of organizations intervening in
child protection
2 meetings
18 organizations
Nyamagabe Output 1: Children’s
forums from village to
district level are operational
and the 12th National
Children Summit is held to
ensure child participation in
local and national decision
making
# of Children’s forums from
village to Districts operational
% of selected participants from
sectors and districts attending the
National Children's Summit
1 per village, 1 per cell, 1 per sector,
and 1 per district
100% of selected participants
participating in the Summit
Output 2: Centers for
vulnerable children are
supported to facilitate the
reintegration of children
and ensure the wellbeing of
children who are still in
residential care waiting for
family reintegration, in line
with the National Strategy
for Child Care Reform
# of centers (orphanages, centers
for children in streets, centers for
children with disabilities and
prisons having children under
three years living with their
mothers) whose children are
supported
# of children supported through
the centres (breakdown by type of
centre, by sex and by age (0-5; 6-
11; 12-18; 18 and above)
1 center for children with disabilities
and 1 prison having children under
three years living with their mothers
Output 3: Child protection
professional and para-
professional social welfare
workforce facilitated to
support the most vulnerable
children in 30 districts
# of children given reintegration
package
# of friends of families (IZU)
facilitated
% of selected parents and
community members attending
group session each quarter
# of social workers &
psychologists facilitated
150 children
100% of selected parents and
community members
1,072 IZU
4 social workers & psychologists
Output 4: Coordination
mechanisms of child
protection interveners at
district level are operational
and produce regular reports
to NCC
# of meetings held,
# of organizations intervening in
child protection
2 meetings
14 organizations
Gisagara Output 1: Children’s
forums from village to
district level are operational
and the 12th National
Children Summit is held to
ensure child participation in
local and national decision
making
# of Children’s forums from
village to Districts operational
% of selected participants from
sectors and districts attending the
National Children's Summit
1 per village, 1 per cell, 1 per sector,
and 1 per district
100% of selected participants
participating in the Summit
Output 2: Centers for
vulnerable children are
supported to facilitate the
reintegration of children
# of centers (orphanages, centers
for children in streets, centers for
children with disabilities and
prisons having children under
1 center for children with disabilities

119
and ensure the wellbeing of
children who are still in
residential care waiting for
family reintegration, in line
with the National Strategy
for Child Care Reform
three years living with their
mothers) whose children are
supported
# of children supported through
the centres (breakdown by type of
centre, by sex and by age (0-5; 6-
11; 12-18; 18 and above) Output 3: Child protection
professional and para-
professional social welfare
workforce facilitated to
support the most vulnerable
children in 30 districts
# of children given reintegration
package
# of friends of families (IZU)
facilitated
% of selected parents and
community members attending
group session each quarter
# of social workers &
psychologists facilitated
0 children
100% of selected parents and
community members
1,048 IZU
0 social workers & psychologists
Output 4: Coordination
mechanisms of child
protection interveners at
district level are operational
and produce regular reports
to NCC
# of meetings held,
# of organizations intervening in
child protection
2 meetings
6 organizations
Muhanga Output 1: Children’s
forums from village to
district level are operational
and the 12th National
Children Summit is held to
ensure child participation in
local and national decision
making
# of Children’s forums from
village to Districts operational
% of selected participants from
sectors and districts attending the
National Children's Summit
1 per village, 1 per cell, 1 per sector,
and 1 per district
100% of selected participants
participating in the Summit
Output 2: Centers for
vulnerable children are
supported to facilitate the
reintegration of children
and ensure the wellbeing of
children who are still in
residential care waiting for
family reintegration, in line
with the National Strategy
for Child Care Reform
# of centers (orphanages, centers
for children in streets, centers for
children with disabilities and
prisons having children under
three years living with their
mothers) whose children are
supported
# of children supported through
the centres (breakdown by type of
centre, by sex and by age (0-5; 6-
11; 12-18; 18 and above)
1 center for children with disabilities
and 1 prison having children under
three years living with their mothers
Output 3: Child protection
professional and para-
professional social welfare
workforce facilitated to
support the most vulnerable
children in 30 districts
# of children given reintegration
package
# of friends of families (IZU)
facilitated
% of selected parents and
community members attending
group session each quarter
# of social workers &
psychologists facilitated
524 children
100% of selected parents and
community members
662 IZU
2 social workers & psychologists
Output 4: Coordination
mechanisms of child
protection interveners at
# of meetings held,
# of organizations intervening in
child protection
2 meetings
12 organizations
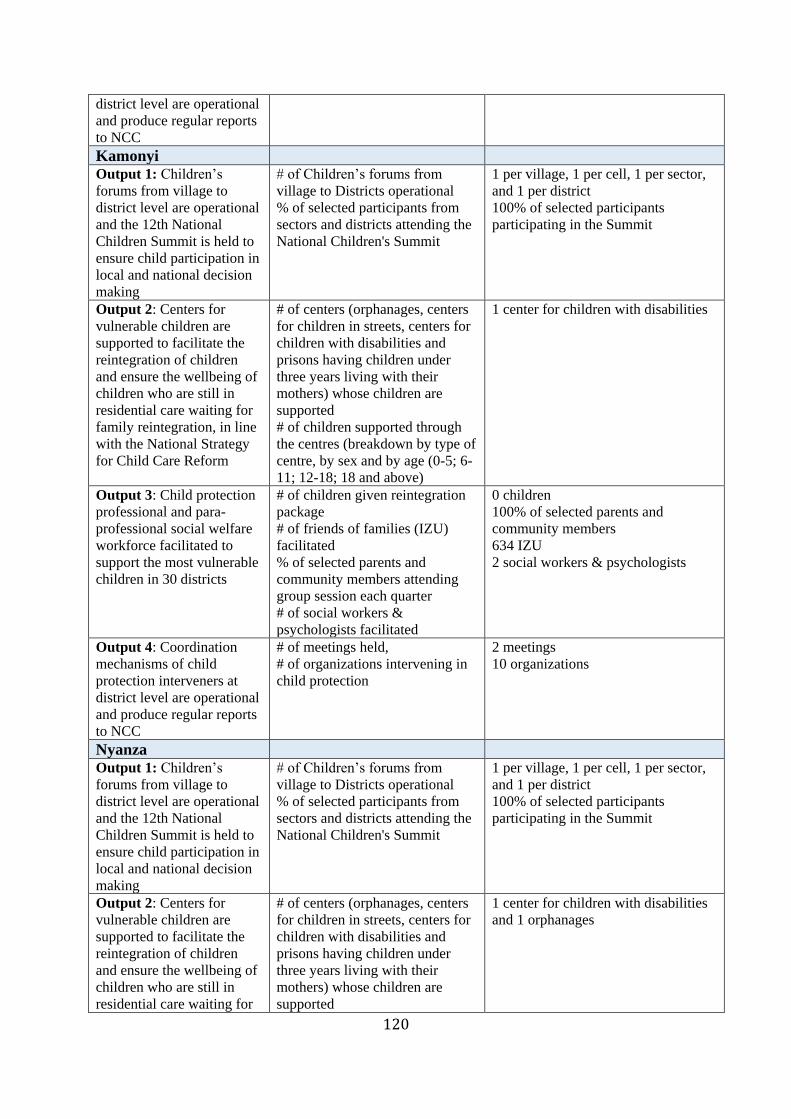
120
district level are operational
and produce regular reports
to NCC
Kamonyi Output 1: Children’s
forums from village to
district level are operational
and the 12th National
Children Summit is held to
ensure child participation in
local and national decision
making
# of Children’s forums from
village to Districts operational
% of selected participants from
sectors and districts attending the
National Children's Summit
1 per village, 1 per cell, 1 per sector,
and 1 per district
100% of selected participants
participating in the Summit
Output 2: Centers for
vulnerable children are
supported to facilitate the
reintegration of children
and ensure the wellbeing of
children who are still in
residential care waiting for
family reintegration, in line
with the National Strategy
for Child Care Reform
# of centers (orphanages, centers
for children in streets, centers for
children with disabilities and
prisons having children under
three years living with their
mothers) whose children are
supported
# of children supported through
the centres (breakdown by type of
centre, by sex and by age (0-5; 6-
11; 12-18; 18 and above)
1 center for children with disabilities
Output 3: Child protection
professional and para-
professional social welfare
workforce facilitated to
support the most vulnerable
children in 30 districts
# of children given reintegration
package
# of friends of families (IZU)
facilitated
% of selected parents and
community members attending
group session each quarter
# of social workers &
psychologists facilitated
0 children
100% of selected parents and
community members
634 IZU
2 social workers & psychologists
Output 4: Coordination
mechanisms of child
protection interveners at
district level are operational
and produce regular reports
to NCC
# of meetings held,
# of organizations intervening in
child protection
2 meetings
10 organizations
Nyanza Output 1: Children’s
forums from village to
district level are operational
and the 12th National
Children Summit is held to
ensure child participation in
local and national decision
making
# of Children’s forums from
village to Districts operational
% of selected participants from
sectors and districts attending the
National Children's Summit
1 per village, 1 per cell, 1 per sector,
and 1 per district
100% of selected participants
participating in the Summit
Output 2: Centers for
vulnerable children are
supported to facilitate the
reintegration of children
and ensure the wellbeing of
children who are still in
residential care waiting for
# of centers (orphanages, centers
for children in streets, centers for
children with disabilities and
prisons having children under
three years living with their
mothers) whose children are
supported
1 center for children with disabilities
and 1 orphanages
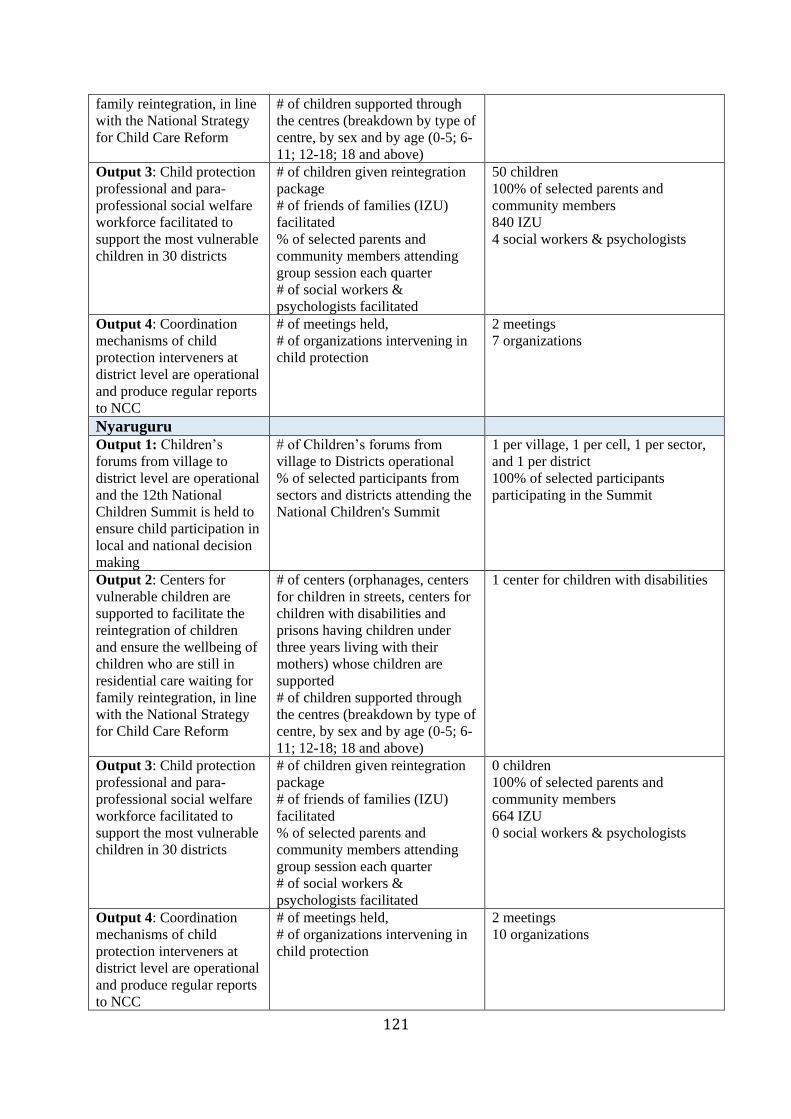
121
family reintegration, in line
with the National Strategy
for Child Care Reform
# of children supported through
the centres (breakdown by type of
centre, by sex and by age (0-5; 6-
11; 12-18; 18 and above) Output 3: Child protection
professional and para-
professional social welfare
workforce facilitated to
support the most vulnerable
children in 30 districts
# of children given reintegration
package
# of friends of families (IZU)
facilitated
% of selected parents and
community members attending
group session each quarter
# of social workers &
psychologists facilitated
50 children
100% of selected parents and
community members
840 IZU
4 social workers & psychologists
Output 4: Coordination
mechanisms of child
protection interveners at
district level are operational
and produce regular reports
to NCC
# of meetings held,
# of organizations intervening in
child protection
2 meetings
7 organizations
Nyaruguru Output 1: Children’s
forums from village to
district level are operational
and the 12th National
Children Summit is held to
ensure child participation in
local and national decision
making
# of Children’s forums from
village to Districts operational
% of selected participants from
sectors and districts attending the
National Children's Summit
1 per village, 1 per cell, 1 per sector,
and 1 per district
100% of selected participants
participating in the Summit
Output 2: Centers for
vulnerable children are
supported to facilitate the
reintegration of children
and ensure the wellbeing of
children who are still in
residential care waiting for
family reintegration, in line
with the National Strategy
for Child Care Reform
# of centers (orphanages, centers
for children in streets, centers for
children with disabilities and
prisons having children under
three years living with their
mothers) whose children are
supported
# of children supported through
the centres (breakdown by type of
centre, by sex and by age (0-5; 6-
11; 12-18; 18 and above)
1 center for children with disabilities
Output 3: Child protection
professional and para-
professional social welfare
workforce facilitated to
support the most vulnerable
children in 30 districts
# of children given reintegration
package
# of friends of families (IZU)
facilitated
% of selected parents and
community members attending
group session each quarter
# of social workers &
psychologists facilitated
0 children
100% of selected parents and
community members
664 IZU
0 social workers & psychologists
Output 4: Coordination
mechanisms of child
protection interveners at
district level are operational
and produce regular reports
to NCC
# of meetings held,
# of organizations intervening in
child protection
2 meetings
10 organizations
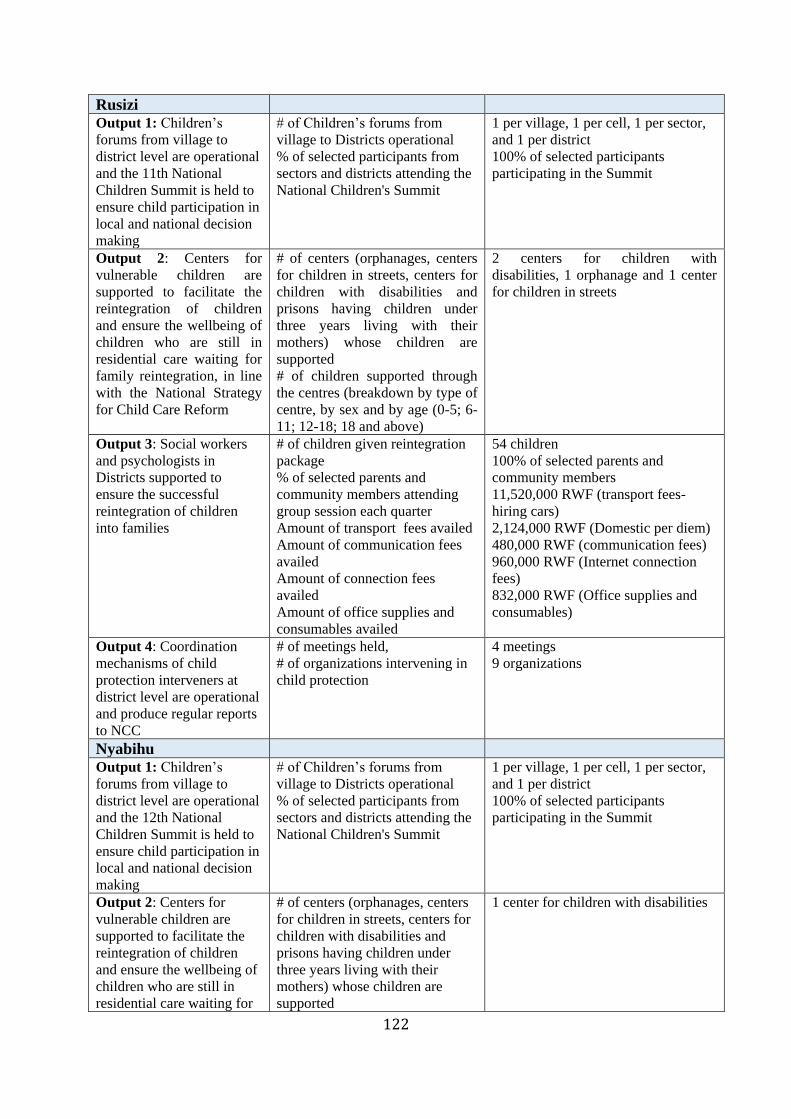
122
Rusizi Output 1: Children’s
forums from village to
district level are operational
and the 11th National
Children Summit is held to
ensure child participation in
local and national decision
making
# of Children’s forums from
village to Districts operational
% of selected participants from
sectors and districts attending the
National Children's Summit
1 per village, 1 per cell, 1 per sector,
and 1 per district
100% of selected participants
participating in the Summit
Output 2: Centers for
vulnerable children are
supported to facilitate the
reintegration of children
and ensure the wellbeing of
children who are still in
residential care waiting for
family reintegration, in line
with the National Strategy
for Child Care Reform
# of centers (orphanages, centers
for children in streets, centers for
children with disabilities and
prisons having children under
three years living with their
mothers) whose children are
supported
# of children supported through
the centres (breakdown by type of
centre, by sex and by age (0-5; 6-
11; 12-18; 18 and above)
2 centers for children with
disabilities, 1 orphanage and 1 center
for children in streets
Output 3: Social workers
and psychologists in
Districts supported to
ensure the successful
reintegration of children
into families
# of children given reintegration
package
% of selected parents and
community members attending
group session each quarter
Amount of transport fees availed
Amount of communication fees
availed
Amount of connection fees
availed
Amount of office supplies and
consumables availed
54 children
100% of selected parents and
community members
11,520,000 RWF (transport fees-
hiring cars)
2,124,000 RWF (Domestic per diem)
480,000 RWF (communication fees)
960,000 RWF (Internet connection
fees)
832,000 RWF (Office supplies and
consumables)
Output 4: Coordination
mechanisms of child
protection interveners at
district level are operational
and produce regular reports
to NCC
# of meetings held,
# of organizations intervening in
child protection
4 meetings
9 organizations
Nyabihu Output 1: Children’s
forums from village to
district level are operational
and the 12th National
Children Summit is held to
ensure child participation in
local and national decision
making
# of Children’s forums from
village to Districts operational
% of selected participants from
sectors and districts attending the
National Children's Summit
1 per village, 1 per cell, 1 per sector,
and 1 per district
100% of selected participants
participating in the Summit
Output 2: Centers for
vulnerable children are
supported to facilitate the
reintegration of children
and ensure the wellbeing of
children who are still in
residential care waiting for
# of centers (orphanages, centers
for children in streets, centers for
children with disabilities and
prisons having children under
three years living with their
mothers) whose children are
supported
1 center for children with disabilities
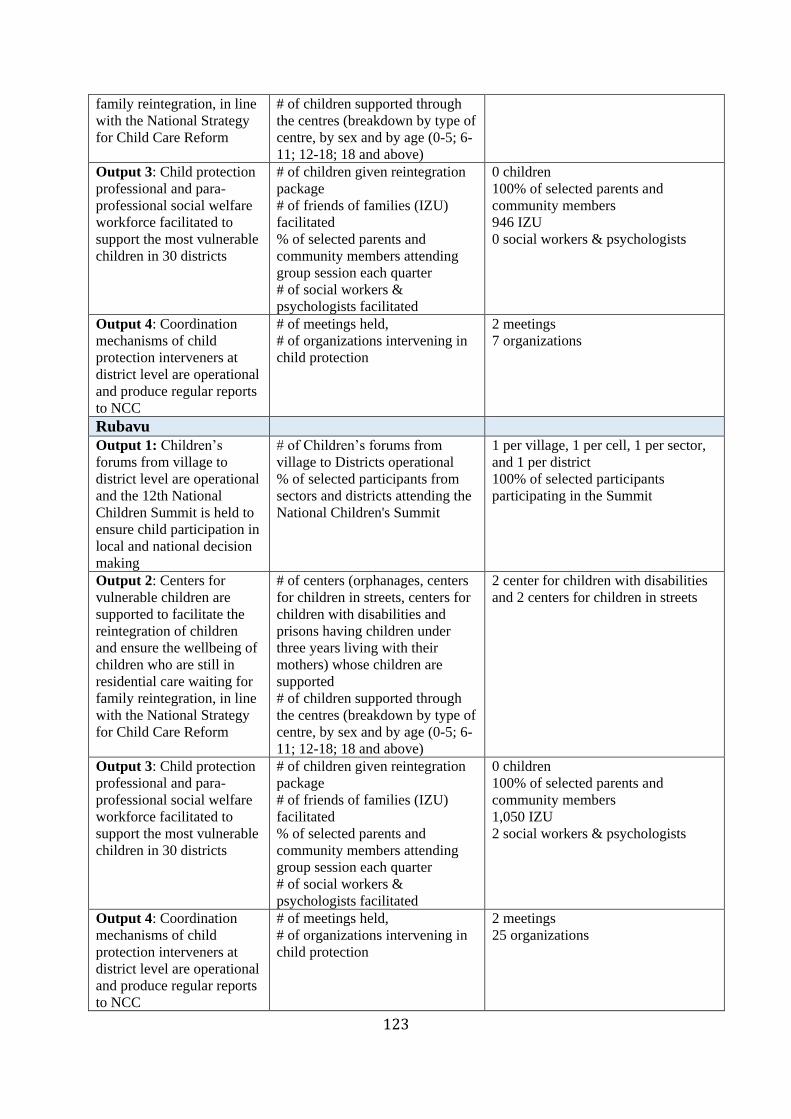
123
family reintegration, in line
with the National Strategy
for Child Care Reform
# of children supported through
the centres (breakdown by type of
centre, by sex and by age (0-5; 6-
11; 12-18; 18 and above) Output 3: Child protection
professional and para-
professional social welfare
workforce facilitated to
support the most vulnerable
children in 30 districts
# of children given reintegration
package
# of friends of families (IZU)
facilitated
% of selected parents and
community members attending
group session each quarter
# of social workers &
psychologists facilitated
0 children
100% of selected parents and
community members
946 IZU
0 social workers & psychologists
Output 4: Coordination
mechanisms of child
protection interveners at
district level are operational
and produce regular reports
to NCC
# of meetings held,
# of organizations intervening in
child protection
2 meetings
7 organizations
Rubavu
Output 1: Children’s
forums from village to
district level are operational
and the 12th National
Children Summit is held to
ensure child participation in
local and national decision
making
# of Children’s forums from
village to Districts operational
% of selected participants from
sectors and districts attending the
National Children's Summit
1 per village, 1 per cell, 1 per sector,
and 1 per district
100% of selected participants
participating in the Summit
Output 2: Centers for
vulnerable children are
supported to facilitate the
reintegration of children
and ensure the wellbeing of
children who are still in
residential care waiting for
family reintegration, in line
with the National Strategy
for Child Care Reform
# of centers (orphanages, centers
for children in streets, centers for
children with disabilities and
prisons having children under
three years living with their
mothers) whose children are
supported
# of children supported through
the centres (breakdown by type of
centre, by sex and by age (0-5; 6-
11; 12-18; 18 and above)
2 center for children with disabilities
and 2 centers for children in streets
Output 3: Child protection
professional and para-
professional social welfare
workforce facilitated to
support the most vulnerable
children in 30 districts
# of children given reintegration
package
# of friends of families (IZU)
facilitated
% of selected parents and
community members attending
group session each quarter
# of social workers &
psychologists facilitated
0 children
100% of selected parents and
community members
1,050 IZU
2 social workers & psychologists
Output 4: Coordination
mechanisms of child
protection interveners at
district level are operational
and produce regular reports
to NCC
# of meetings held,
# of organizations intervening in
child protection
2 meetings
25 organizations
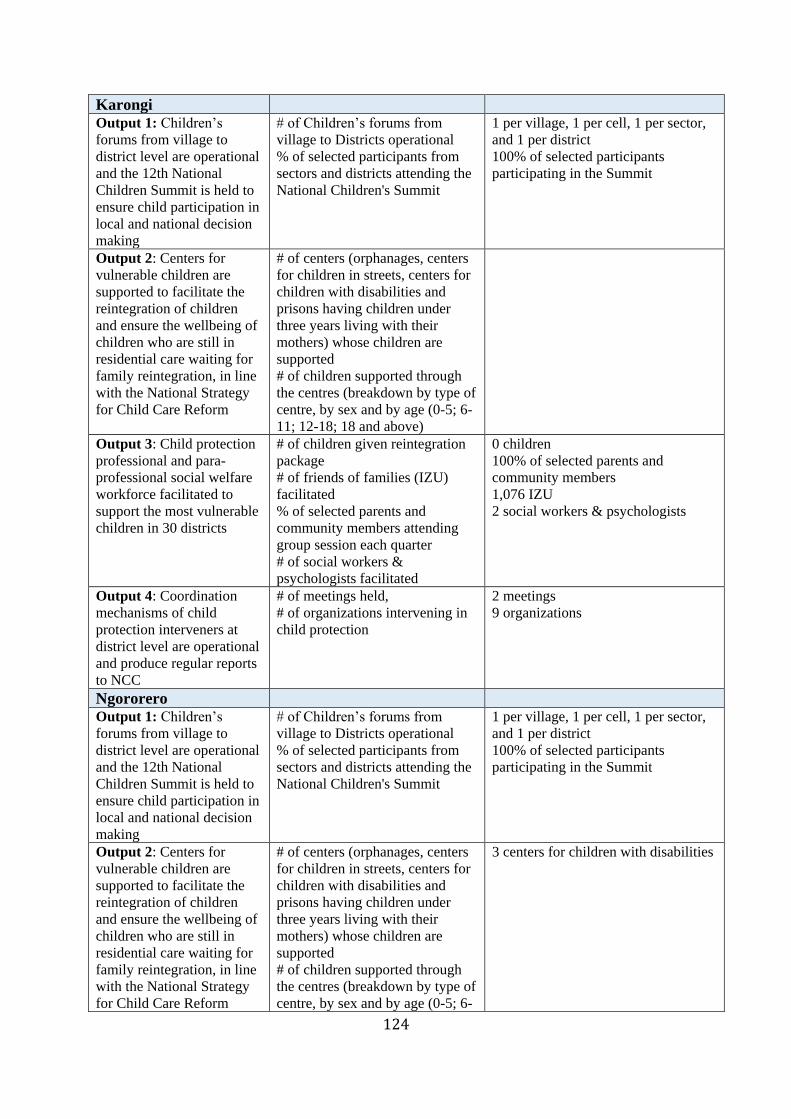
124
Karongi Output 1: Children’s
forums from village to
district level are operational
and the 12th National
Children Summit is held to
ensure child participation in
local and national decision
making
# of Children’s forums from
village to Districts operational
% of selected participants from
sectors and districts attending the
National Children's Summit
1 per village, 1 per cell, 1 per sector,
and 1 per district
100% of selected participants
participating in the Summit
Output 2: Centers for
vulnerable children are
supported to facilitate the
reintegration of children
and ensure the wellbeing of
children who are still in
residential care waiting for
family reintegration, in line
with the National Strategy
for Child Care Reform
# of centers (orphanages, centers
for children in streets, centers for
children with disabilities and
prisons having children under
three years living with their
mothers) whose children are
supported
# of children supported through
the centres (breakdown by type of
centre, by sex and by age (0-5; 6-
11; 12-18; 18 and above)
Output 3: Child protection
professional and para-
professional social welfare
workforce facilitated to
support the most vulnerable
children in 30 districts
# of children given reintegration
package
# of friends of families (IZU)
facilitated
% of selected parents and
community members attending
group session each quarter
# of social workers &
psychologists facilitated
0 children
100% of selected parents and
community members
1,076 IZU
2 social workers & psychologists
Output 4: Coordination
mechanisms of child
protection interveners at
district level are operational
and produce regular reports
to NCC
# of meetings held,
# of organizations intervening in
child protection
2 meetings
9 organizations
Ngororero Output 1: Children’s
forums from village to
district level are operational
and the 12th National
Children Summit is held to
ensure child participation in
local and national decision
making
# of Children’s forums from
village to Districts operational
% of selected participants from
sectors and districts attending the
National Children's Summit
1 per village, 1 per cell, 1 per sector,
and 1 per district
100% of selected participants
participating in the Summit
Output 2: Centers for
vulnerable children are
supported to facilitate the
reintegration of children
and ensure the wellbeing of
children who are still in
residential care waiting for
family reintegration, in line
with the National Strategy
for Child Care Reform
# of centers (orphanages, centers
for children in streets, centers for
children with disabilities and
prisons having children under
three years living with their
mothers) whose children are
supported
# of children supported through
the centres (breakdown by type of
centre, by sex and by age (0-5; 6-
3 centers for children with disabilities

125
11; 12-18; 18 and above)
Output 3: Child protection
professional and para-
professional social welfare
workforce facilitated to
support the most vulnerable
children in 30 districts
# of children given reintegration
package
# of friends of families (IZU)
facilitated
% of selected parents and
community members attending
group session each quarter
# of social workers &
psychologists facilitated
0 children
100% of selected parents and
community members
838 IZU
0 social workers & psychologists
Output 4: Coordination
mechanisms of child
protection interveners at
district level are operational
and produce regular reports
to NCC
# of meetings held,
# of organizations intervening in
child protection
2 meetings
10 organizations
Nyamasheke Output 1: Children’s
forums from village to
district level are operational
and the 12th National
Children Summit is held to
ensure child participation in
local and national decision
making
# of Children’s forums from
village to Districts operational
% of selected participants from
sectors and districts attending the
National Children's Summit
1 per village, 1 per cell, 1 per sector,
and 1 per district
100% of selected participants
participating in the Summit
Output 2: Centers for
vulnerable children are
supported to facilitate the
reintegration of children
and ensure the wellbeing of
children who are still in
residential care waiting for
family reintegration, in line
with the National Strategy
for Child Care Reform
# of centers (orphanages, centers
for children in streets, centers for
children with disabilities and
prisons having children under
three years living with their
mothers) whose children are
supported
# of children supported through
the centres (breakdown by type of
centre, by sex and by age (0-5; 6-
11; 12-18; 18 and above)
1 center for children with disabilities
Output 3: Child protection
professional and para-
professional social welfare
workforce facilitated to
support the most vulnerable
children in 30 districts
# of children given reintegration
package
# of friends of families (IZU)
facilitated
% of selected parents and
community members attending
group session each quarter
# of social workers &
psychologists facilitated
0 children
100% of selected parents and
community members
1,176 IZU
0 social workers & psychologists
Output 4: Coordination
mechanisms of child
protection interveners at
district level are operational
and produce regular reports
to NCC
# of meetings held,
# of organizations intervening in
child protection
2 meetings
13 organizations
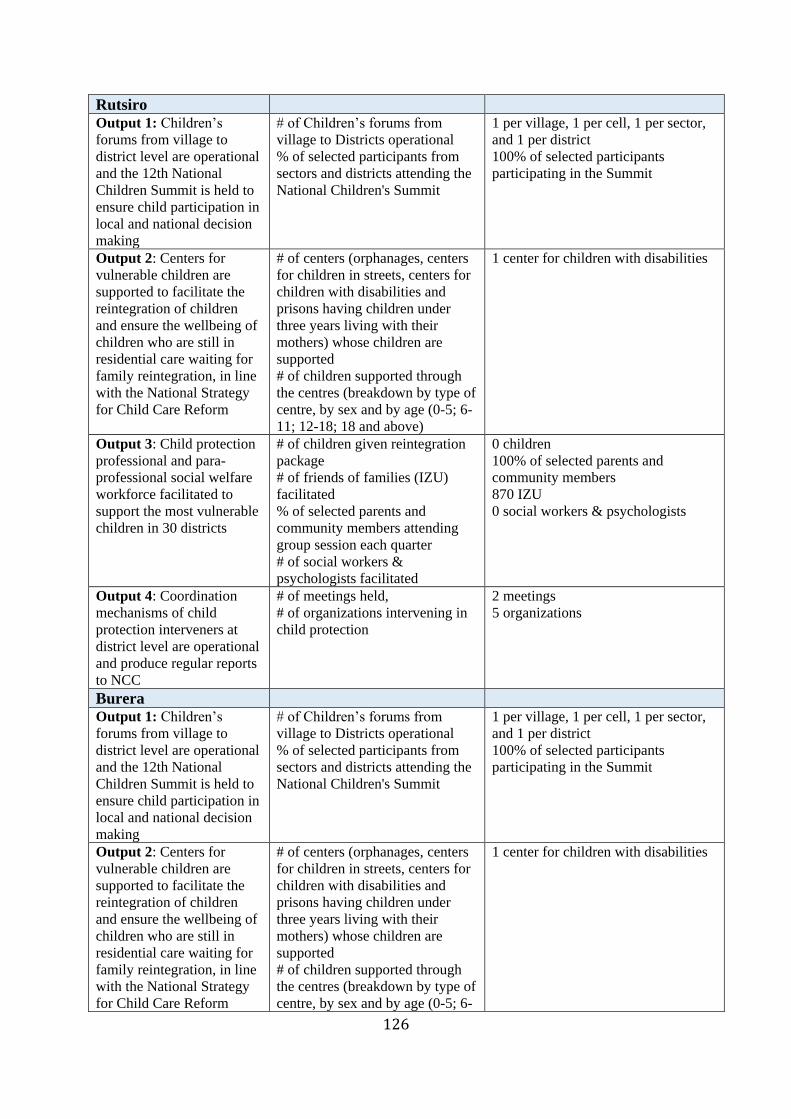
126
Rutsiro Output 1: Children’s
forums from village to
district level are operational
and the 12th National
Children Summit is held to
ensure child participation in
local and national decision
making
# of Children’s forums from
village to Districts operational
% of selected participants from
sectors and districts attending the
National Children's Summit
1 per village, 1 per cell, 1 per sector,
and 1 per district
100% of selected participants
participating in the Summit
Output 2: Centers for
vulnerable children are
supported to facilitate the
reintegration of children
and ensure the wellbeing of
children who are still in
residential care waiting for
family reintegration, in line
with the National Strategy
for Child Care Reform
# of centers (orphanages, centers
for children in streets, centers for
children with disabilities and
prisons having children under
three years living with their
mothers) whose children are
supported
# of children supported through
the centres (breakdown by type of
centre, by sex and by age (0-5; 6-
11; 12-18; 18 and above)
1 center for children with disabilities
Output 3: Child protection
professional and para-
professional social welfare
workforce facilitated to
support the most vulnerable
children in 30 districts
# of children given reintegration
package
# of friends of families (IZU)
facilitated
% of selected parents and
community members attending
group session each quarter
# of social workers &
psychologists facilitated
0 children
100% of selected parents and
community members
870 IZU
0 social workers & psychologists
Output 4: Coordination
mechanisms of child
protection interveners at
district level are operational
and produce regular reports
to NCC
# of meetings held,
# of organizations intervening in
child protection
2 meetings
5 organizations
Burera Output 1: Children’s
forums from village to
district level are operational
and the 12th National
Children Summit is held to
ensure child participation in
local and national decision
making
# of Children’s forums from
village to Districts operational
% of selected participants from
sectors and districts attending the
National Children's Summit
1 per village, 1 per cell, 1 per sector,
and 1 per district
100% of selected participants
participating in the Summit
Output 2: Centers for
vulnerable children are
supported to facilitate the
reintegration of children
and ensure the wellbeing of
children who are still in
residential care waiting for
family reintegration, in line
with the National Strategy
for Child Care Reform
# of centers (orphanages, centers
for children in streets, centers for
children with disabilities and
prisons having children under
three years living with their
mothers) whose children are
supported
# of children supported through
the centres (breakdown by type of
centre, by sex and by age (0-5; 6-
1 center for children with disabilities
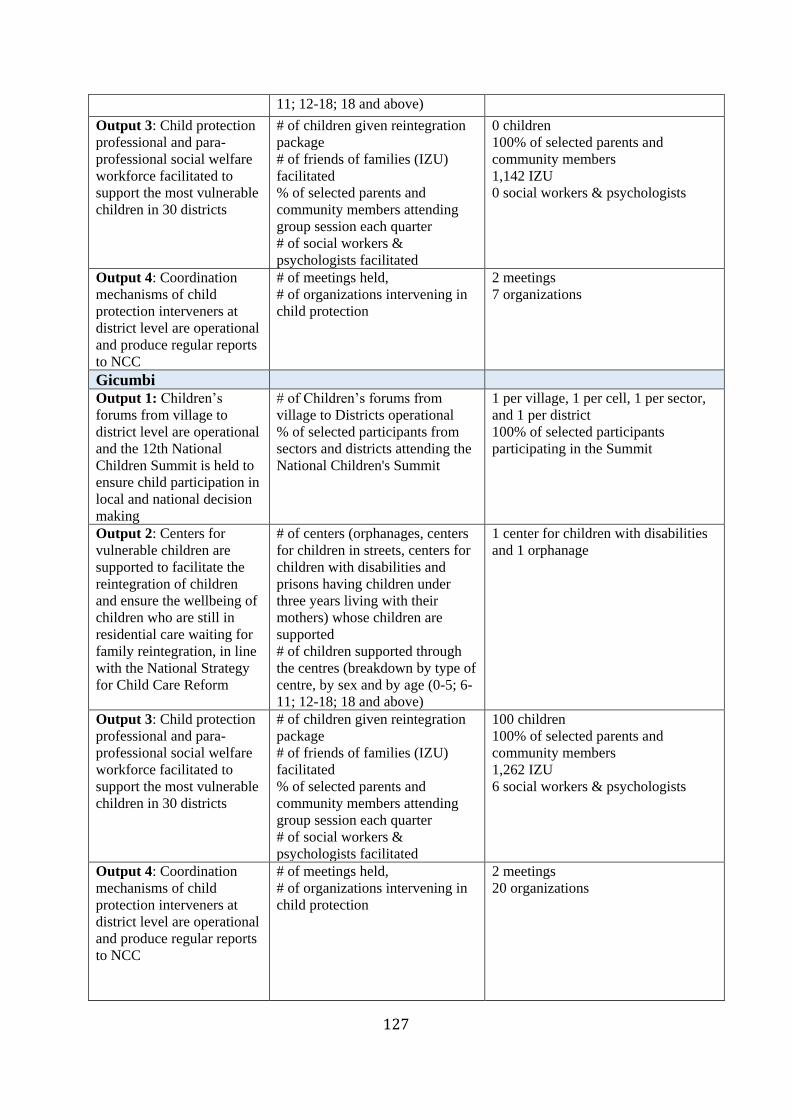
127
11; 12-18; 18 and above)
Output 3: Child protection
professional and para-
professional social welfare
workforce facilitated to
support the most vulnerable
children in 30 districts
# of children given reintegration
package
# of friends of families (IZU)
facilitated
% of selected parents and
community members attending
group session each quarter
# of social workers &
psychologists facilitated
0 children
100% of selected parents and
community members
1,142 IZU
0 social workers & psychologists
Output 4: Coordination
mechanisms of child
protection interveners at
district level are operational
and produce regular reports
to NCC
# of meetings held,
# of organizations intervening in
child protection
2 meetings
7 organizations
Gicumbi Output 1: Children’s
forums from village to
district level are operational
and the 12th National
Children Summit is held to
ensure child participation in
local and national decision
making
# of Children’s forums from
village to Districts operational
% of selected participants from
sectors and districts attending the
National Children's Summit
1 per village, 1 per cell, 1 per sector,
and 1 per district
100% of selected participants
participating in the Summit
Output 2: Centers for
vulnerable children are
supported to facilitate the
reintegration of children
and ensure the wellbeing of
children who are still in
residential care waiting for
family reintegration, in line
with the National Strategy
for Child Care Reform
# of centers (orphanages, centers
for children in streets, centers for
children with disabilities and
prisons having children under
three years living with their
mothers) whose children are
supported
# of children supported through
the centres (breakdown by type of
centre, by sex and by age (0-5; 6-
11; 12-18; 18 and above)
1 center for children with disabilities
and 1 orphanage
Output 3: Child protection
professional and para-
professional social welfare
workforce facilitated to
support the most vulnerable
children in 30 districts
# of children given reintegration
package
# of friends of families (IZU)
facilitated
% of selected parents and
community members attending
group session each quarter
# of social workers &
psychologists facilitated
100 children
100% of selected parents and
community members
1,262 IZU
6 social workers & psychologists
Output 4: Coordination
mechanisms of child
protection interveners at
district level are operational
and produce regular reports
to NCC
# of meetings held,
# of organizations intervening in
child protection
2 meetings
20 organizations

128
Musanze
Output 1: Children’s
forums from village to
district level are operational
and the 12th National
Children Summit is held to
ensure child participation in
local and national decision
making
# of Children’s forums from
village to Districts operational
% of selected participants from
sectors and districts attending the
National Children's Summit
1 per village, 1 per cell, 1 per sector,
and 1 per district
100% of selected participants
participating in the Summit
Output 2: Centers for
vulnerable children are
supported to facilitate the
reintegration of children
and ensure the wellbeing of
children who are still in
residential care waiting for
family reintegration, in line
with the National Strategy
for Child Care Reform
# of centers (orphanages, centers
for children in streets, centers for
children with disabilities and
prisons having children under
three years living with their
mothers) whose children are
supported
# of children supported through
the centres (breakdown by type of
centre, by sex and by age (0-5; 6-
11; 12-18; 18 and above)
1 center for children in streets, 2
centers for children with disabilities
and 1 prison having children under
three years living with their mothers
Output 3: Child protection
professional and para-
professional social welfare
workforce facilitated to
support the most vulnerable
children in 30 districts
# of children given reintegration
package
# of friends of families (IZU)
facilitated
% of selected parents and
community members attending
group session each quarter
# of social workers &
psychologists facilitated
40 children
100% of selected parents and
community members
864 IZU
4 social workers & psychologists
Output 4: Coordination
mechanisms of child
protection interveners at
district level are operational
and produce regular reports
to NCC
# of meetings held,
# of organizations intervening in
child protection
2 meetings
15 organizations
Rulindo Output 1: Children’s
forums from village to
district level are operational
and the 12th National
Children Summit is held to
ensure child participation in
local and national decision
making
# of Children’s forums from
village to Districts operational
% of selected participants from
sectors and districts attending the
National Children's Summit
1 per village, 1 per cell, 1 per sector,
and 1 per district
100% of selected participants
participating in the Summit
Output 2: Centers for
vulnerable children are
supported to facilitate the
reintegration of children
and ensure the wellbeing of
children who are still in
residential care waiting for
family reintegration, in line
with the National Strategy
# of centers (orphanages, centers
for children in streets, centers for
children with disabilities and
prisons having children under
three years living with their
mothers) whose children are
supported
# of children supported through
the centres (breakdown by type of
1 center for children with disabilities
and 1 orphanage
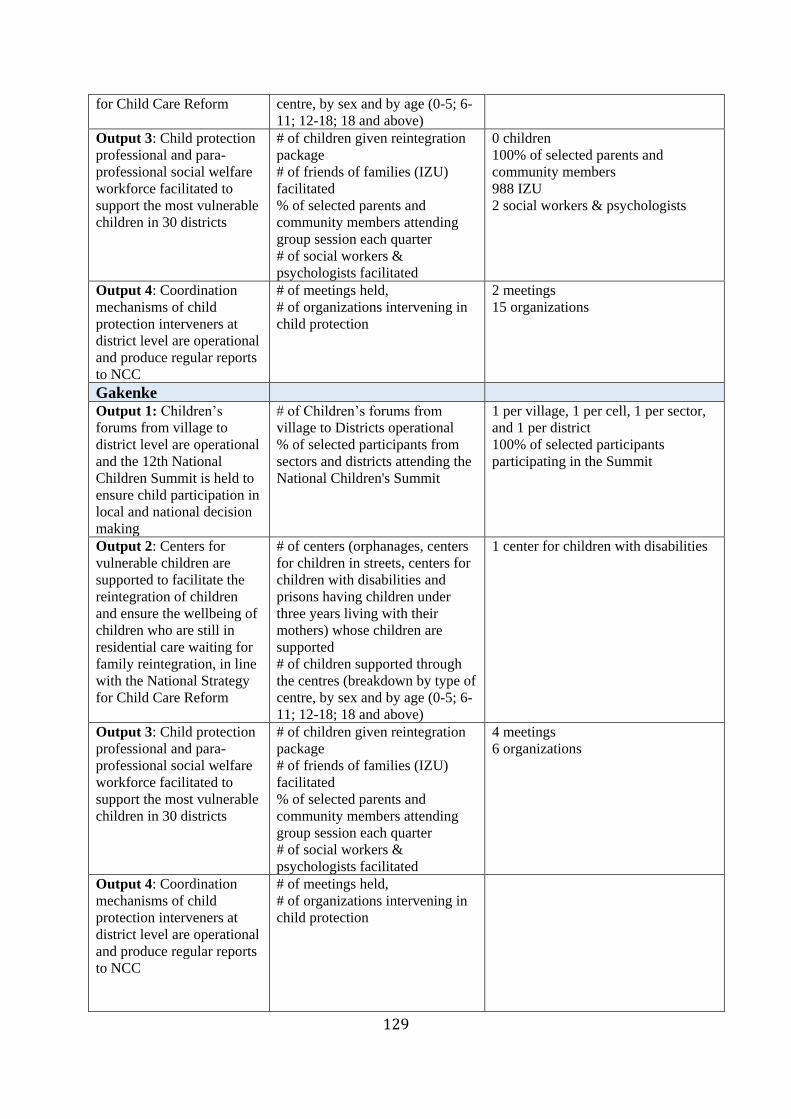
129
for Child Care Reform centre, by sex and by age (0-5; 6-
11; 12-18; 18 and above) Output 3: Child protection
professional and para-
professional social welfare
workforce facilitated to
support the most vulnerable
children in 30 districts
# of children given reintegration
package
# of friends of families (IZU)
facilitated
% of selected parents and
community members attending
group session each quarter
# of social workers &
psychologists facilitated
0 children
100% of selected parents and
community members
988 IZU
2 social workers & psychologists
Output 4: Coordination
mechanisms of child
protection interveners at
district level are operational
and produce regular reports
to NCC
# of meetings held,
# of organizations intervening in
child protection
2 meetings
15 organizations
Gakenke Output 1: Children’s
forums from village to
district level are operational
and the 12th National
Children Summit is held to
ensure child participation in
local and national decision
making
# of Children’s forums from
village to Districts operational
% of selected participants from
sectors and districts attending the
National Children's Summit
1 per village, 1 per cell, 1 per sector,
and 1 per district
100% of selected participants
participating in the Summit
Output 2: Centers for
vulnerable children are
supported to facilitate the
reintegration of children
and ensure the wellbeing of
children who are still in
residential care waiting for
family reintegration, in line
with the National Strategy
for Child Care Reform
# of centers (orphanages, centers
for children in streets, centers for
children with disabilities and
prisons having children under
three years living with their
mothers) whose children are
supported
# of children supported through
the centres (breakdown by type of
centre, by sex and by age (0-5; 6-
11; 12-18; 18 and above)
1 center for children with disabilities
Output 3: Child protection
professional and para-
professional social welfare
workforce facilitated to
support the most vulnerable
children in 30 districts
# of children given reintegration
package
# of friends of families (IZU)
facilitated
% of selected parents and
community members attending
group session each quarter
# of social workers &
psychologists facilitated
4 meetings
6 organizations
Output 4: Coordination
mechanisms of child
protection interveners at
district level are operational
and produce regular reports
to NCC
# of meetings held,
# of organizations intervening in
child protection
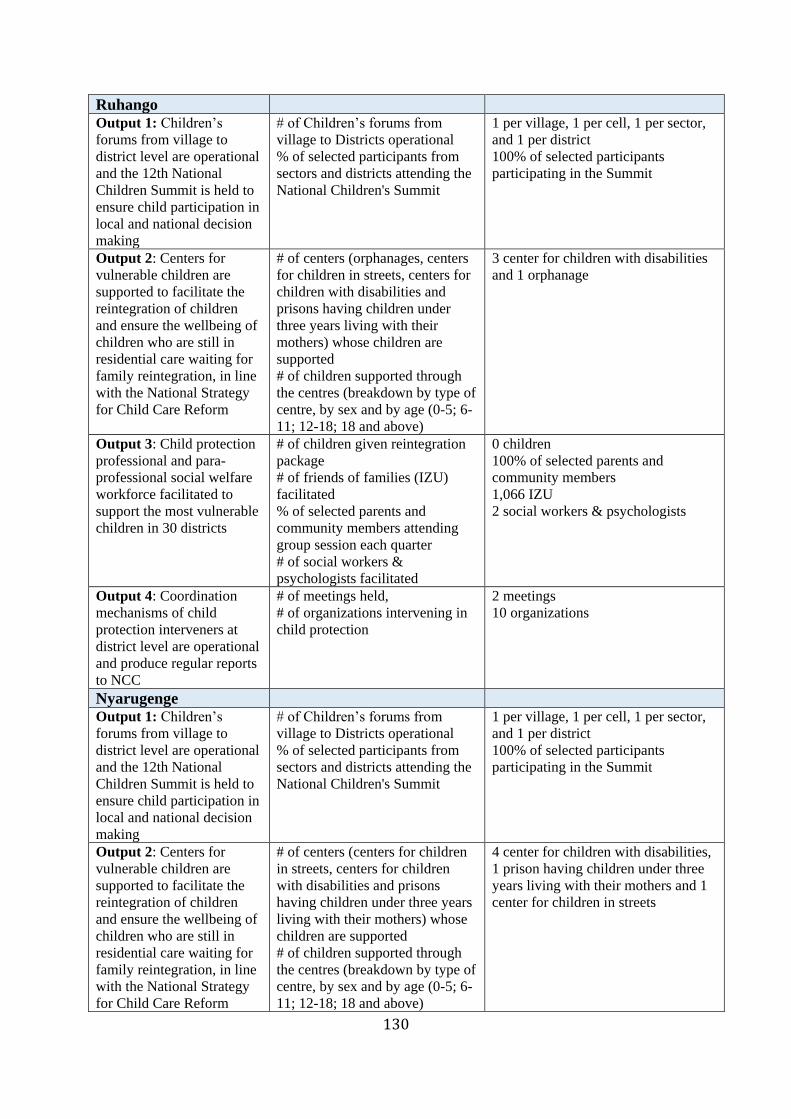
130
Ruhango Output 1: Children’s
forums from village to
district level are operational
and the 12th National
Children Summit is held to
ensure child participation in
local and national decision
making
# of Children’s forums from
village to Districts operational
% of selected participants from
sectors and districts attending the
National Children's Summit
1 per village, 1 per cell, 1 per sector,
and 1 per district
100% of selected participants
participating in the Summit
Output 2: Centers for
vulnerable children are
supported to facilitate the
reintegration of children
and ensure the wellbeing of
children who are still in
residential care waiting for
family reintegration, in line
with the National Strategy
for Child Care Reform
# of centers (orphanages, centers
for children in streets, centers for
children with disabilities and
prisons having children under
three years living with their
mothers) whose children are
supported
# of children supported through
the centres (breakdown by type of
centre, by sex and by age (0-5; 6-
11; 12-18; 18 and above)
3 center for children with disabilities
and 1 orphanage
Output 3: Child protection
professional and para-
professional social welfare
workforce facilitated to
support the most vulnerable
children in 30 districts
# of children given reintegration
package
# of friends of families (IZU)
facilitated
% of selected parents and
community members attending
group session each quarter
# of social workers &
psychologists facilitated
0 children
100% of selected parents and
community members
1,066 IZU
2 social workers & psychologists
Output 4: Coordination
mechanisms of child
protection interveners at
district level are operational
and produce regular reports
to NCC
# of meetings held,
# of organizations intervening in
child protection
2 meetings
10 organizations
Nyarugenge Output 1: Children’s
forums from village to
district level are operational
and the 12th National
Children Summit is held to
ensure child participation in
local and national decision
making
# of Children’s forums from
village to Districts operational
% of selected participants from
sectors and districts attending the
National Children's Summit
1 per village, 1 per cell, 1 per sector,
and 1 per district
100% of selected participants
participating in the Summit
Output 2: Centers for
vulnerable children are
supported to facilitate the
reintegration of children
and ensure the wellbeing of
children who are still in
residential care waiting for
family reintegration, in line
with the National Strategy
for Child Care Reform
# of centers (centers for children
in streets, centers for children
with disabilities and prisons
having children under three years
living with their mothers) whose
children are supported
# of children supported through
the centres (breakdown by type of
centre, by sex and by age (0-5; 6-
11; 12-18; 18 and above)
4 center for children with disabilities,
1 prison having children under three
years living with their mothers and 1
center for children in streets
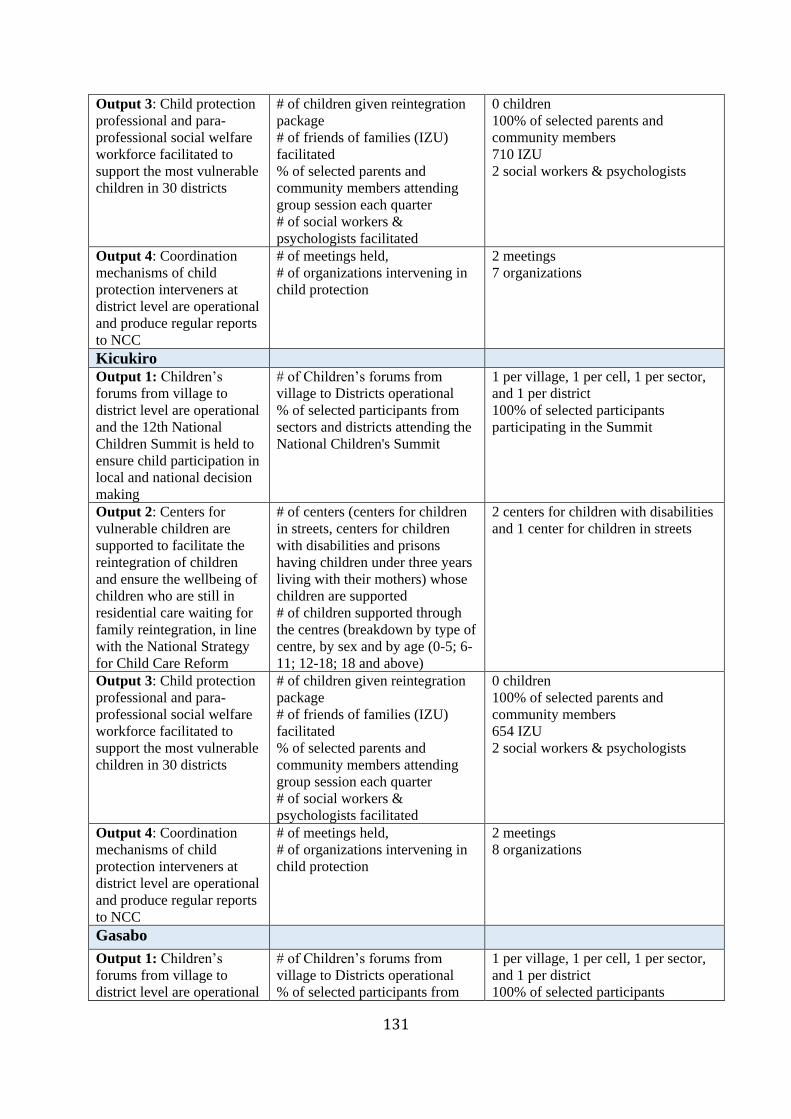
131
Output 3: Child protection
professional and para-
professional social welfare
workforce facilitated to
support the most vulnerable
children in 30 districts
# of children given reintegration
package
# of friends of families (IZU)
facilitated
% of selected parents and
community members attending
group session each quarter
# of social workers &
psychologists facilitated
0 children
100% of selected parents and
community members
710 IZU
2 social workers & psychologists
Output 4: Coordination
mechanisms of child
protection interveners at
district level are operational
and produce regular reports
to NCC
# of meetings held,
# of organizations intervening in
child protection
2 meetings
7 organizations
Kicukiro Output 1: Children’s
forums from village to
district level are operational
and the 12th National
Children Summit is held to
ensure child participation in
local and national decision
making
# of Children’s forums from
village to Districts operational
% of selected participants from
sectors and districts attending the
National Children's Summit
1 per village, 1 per cell, 1 per sector,
and 1 per district
100% of selected participants
participating in the Summit
Output 2: Centers for
vulnerable children are
supported to facilitate the
reintegration of children
and ensure the wellbeing of
children who are still in
residential care waiting for
family reintegration, in line
with the National Strategy
for Child Care Reform
# of centers (centers for children
in streets, centers for children
with disabilities and prisons
having children under three years
living with their mothers) whose
children are supported
# of children supported through
the centres (breakdown by type of
centre, by sex and by age (0-5; 6-
11; 12-18; 18 and above)
2 centers for children with disabilities
and 1 center for children in streets
Output 3: Child protection
professional and para-
professional social welfare
workforce facilitated to
support the most vulnerable
children in 30 districts
# of children given reintegration
package
# of friends of families (IZU)
facilitated
% of selected parents and
community members attending
group session each quarter
# of social workers &
psychologists facilitated
0 children
100% of selected parents and
community members
654 IZU
2 social workers & psychologists
Output 4: Coordination
mechanisms of child
protection interveners at
district level are operational
and produce regular reports
to NCC
# of meetings held,
# of organizations intervening in
child protection
2 meetings
8 organizations
Gasabo
Output 1: Children’s
forums from village to
district level are operational
# of Children’s forums from
village to Districts operational
% of selected participants from
1 per village, 1 per cell, 1 per sector,
and 1 per district
100% of selected participants
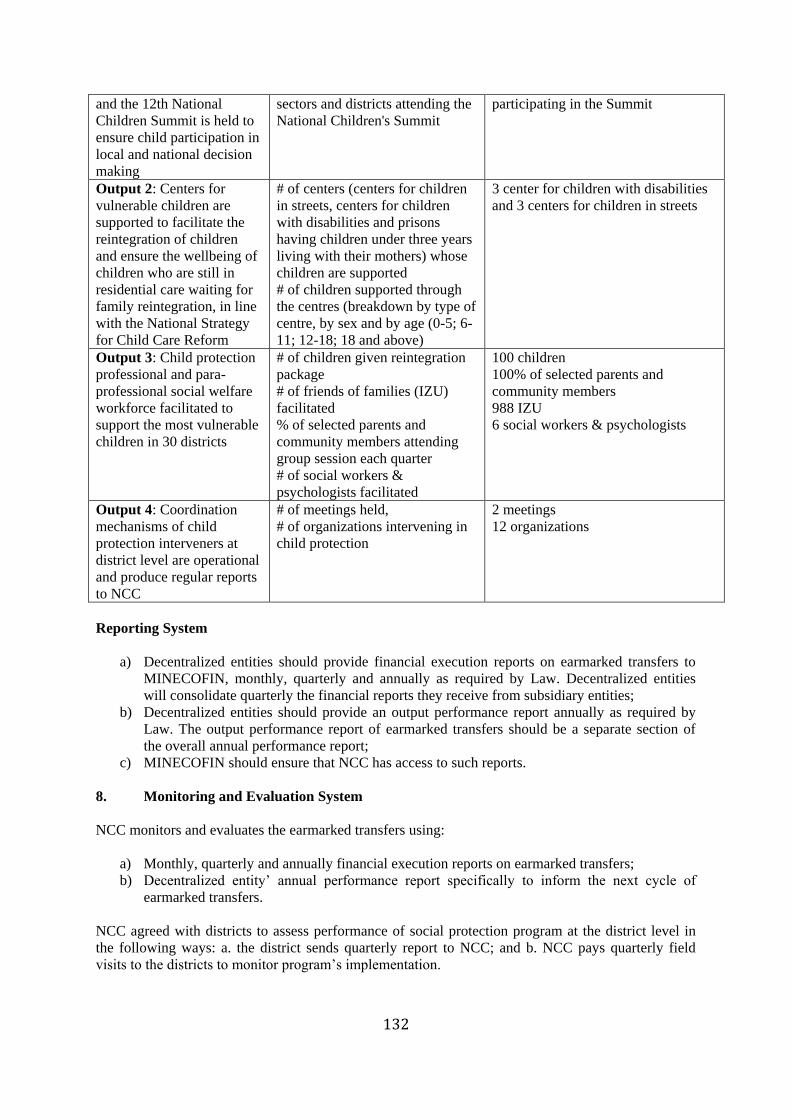
132
and the 12th National
Children Summit is held to
ensure child participation in
local and national decision
making
sectors and districts attending the
National Children's Summit
participating in the Summit
Output 2: Centers for
vulnerable children are
supported to facilitate the
reintegration of children
and ensure the wellbeing of
children who are still in
residential care waiting for
family reintegration, in line
with the National Strategy
for Child Care Reform
# of centers (centers for children
in streets, centers for children
with disabilities and prisons
having children under three years
living with their mothers) whose
children are supported
# of children supported through
the centres (breakdown by type of
centre, by sex and by age (0-5; 6-
11; 12-18; 18 and above)
3 center for children with disabilities
and 3 centers for children in streets
Output 3: Child protection
professional and para-
professional social welfare
workforce facilitated to
support the most vulnerable
children in 30 districts
# of children given reintegration
package
# of friends of families (IZU)
facilitated
% of selected parents and
community members attending
group session each quarter
# of social workers &
psychologists facilitated
100 children
100% of selected parents and
community members
988 IZU
6 social workers & psychologists
Output 4: Coordination
mechanisms of child
protection interveners at
district level are operational
and produce regular reports
to NCC
# of meetings held,
# of organizations intervening in
child protection
2 meetings
12 organizations
Reporting System
a) Decentralized entities should provide financial execution reports on earmarked transfers to
MINECOFIN, monthly, quarterly and annually as required by Law. Decentralized entities
will consolidate quarterly the financial reports they receive from subsidiary entities;
b) Decentralized entities should provide an output performance report annually as required by
Law. The output performance report of earmarked transfers should be a separate section of
the overall annual performance report;
c) MINECOFIN should ensure that NCC has access to such reports.
8. Monitoring and Evaluation System
NCC monitors and evaluates the earmarked transfers using:
a) Monthly, quarterly and annually financial execution reports on earmarked transfers;
b) Decentralized entity’ annual performance report specifically to inform the next cycle of
earmarked transfers.
NCC agreed with districts to assess performance of social protection program at the district level in
the following ways: a. the district sends quarterly report to NCC; and b. NCC pays quarterly field
visits to the districts to monitor program’s implementation.

133
Disbursement Schedule and Conditions
Table 6: Disbursement Modalities by Program/Subprogram
Program &
Subprogram Frequency Destination Beneficiary
Social Protection Family Protection
and Women
Empowerment
For all Outputs Quarterly District Children’s forums
representatives, reintegrated
children, social workforce,
orphanages, centers for
children in streets, centers for
children with disabilities,
prisons having children under
three years living with their
mothers and families of the
most vulnerable children
a) Decentralized entities have the responsibility to provide cash flow plans for all earmarked
transfers and to make commitment accordingly. Commitment can be done for direct payment
or for indirect payment by transferring funds to the decentralized entity’s account;
b) However, on the basis of instructions provided by NCC, the Treasury reserves the right to
withhold any transfers committed by the Decentralized entity;
c) In such a case, the concerned Decentralized entity will formally be informed to take
corrective actions, failure of which will attract sanctions as prescribed by the Law
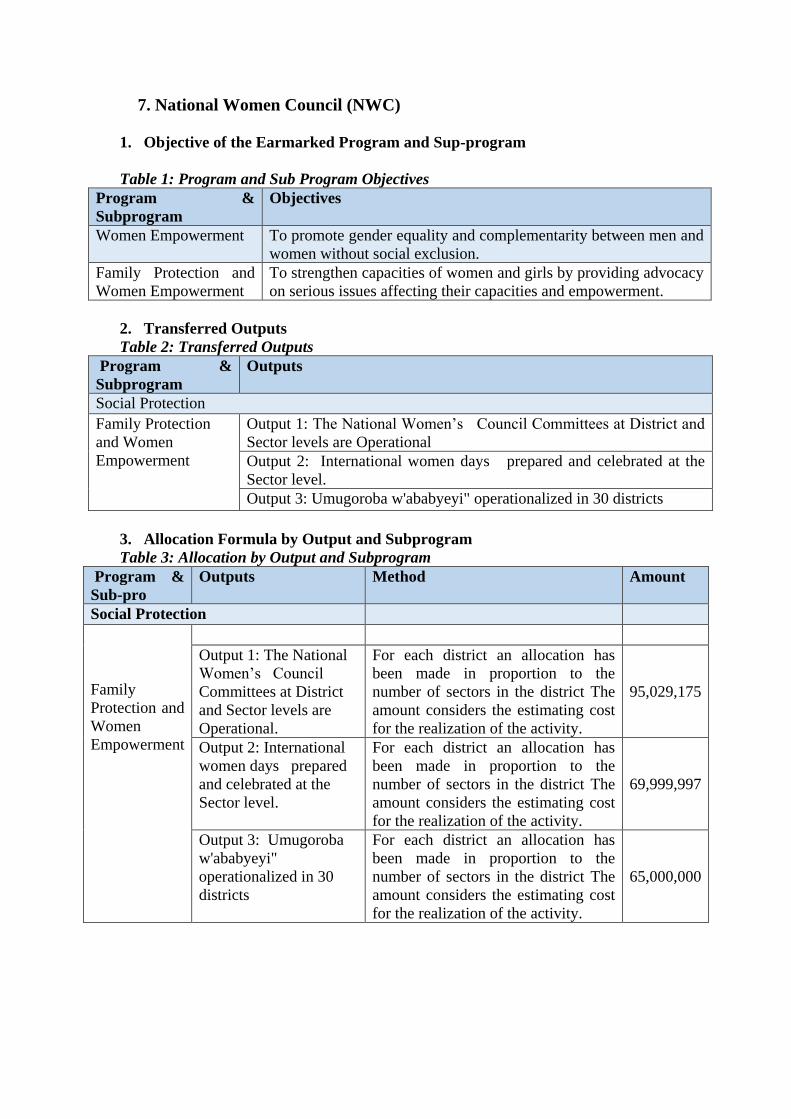
7. National Women Council (NWC)
1. Objective of the Earmarked Program and Sup-program
Table 1: Program and Sub Program Objectives
Program &
Subprogram
Objectives
Women Empowerment To promote gender equality and complementarity between men and
women without social exclusion.
Family Protection and
Women Empowerment
To strengthen capacities of women and girls by providing advocacy
on serious issues affecting their capacities and empowerment.
2. Transferred Outputs
Table 2: Transferred Outputs
Program &
Subprogram
Outputs
Social Protection
Family Protection
and Women
Empowerment
Output 1: The National Women’s Council Committees at District and
Sector levels are Operational
Output 2: International women days prepared and celebrated at the
Sector level.
Output 3: Umugoroba w'ababyeyi" operationalized in 30 districts
3. Allocation Formula by Output and Subprogram
Table 3: Allocation by Output and Subprogram
Program &
Sub-pro
Outputs Method Amount
Social Protection
Family
Protection and
Women
Empowerment
Output 1: The National
Women’s Council
Committees at District
and Sector levels are
Operational.
For each district an allocation has
been made in proportion to the
number of sectors in the district The
amount considers the estimating cost
for the realization of the activity.
95,029,175
Output 2: International
women days prepared
and celebrated at the
Sector level.
For each district an allocation has
been made in proportion to the
number of sectors in the district The
amount considers the estimating cost
for the realization of the activity.
69,999,997
Output 3: Umugoroba
w'ababyeyi"
operationalized in 30
districts
For each district an allocation has
been made in proportion to the
number of sectors in the district The
amount considers the estimating cost
for the realization of the activity.
65,000,000

4. Allocation Formula by Decentralized Entity
Where: TA= Total Budget allocated to District A; 416= Total number of Sectors; N=
Number of Sectors in each District; 230,029,169 Frw is the Total budget allocated to all
Districts
NWC allocated those amounts per activity estimating the costs associated to the
implementation of the activities
5. Performance targets and indicators
DISTRICT OUTPUT 1 OUTPUT 2 OUTPUT 3 TOTAL
NGOMA 3,198,097 2,355,769 2,187,500 7,741,366
BUGESERA 3,426,533 2,524,038 2,343,750 8,294,321
GATSIBO 3,198,097 2,355,769 2,187,500 7,741,366
KAYONZA 2,741,226 2,019,231 1,875,000 6,635,457
KIREHE 2,741,226 2,019,231 1,875,000 6,635,457
NYAGATARE 3,198,097 2,355,769 2,187,500 7,741,366
RWAMAGANA 3,198,097 2,355,769 2,187,500 7,741,366
HUYE 3,198,097 2,355,769 2,187,500 7,741,366
NYAMAGABE 3,883,404 2,860,577 2,656,250 9,400,230
GISAGARA 2,969,662 2,187,500 2,031,250 7,188,412
MUHANGA 2,741,226 2,019,231 1,875,000 6,635,457
KAMONYI 2,741,226 2,019,231 1,875,000 6,635,457
NYANZA 2,284,355 1,682,692 1,562,500 5,529,547
NYARUGURU 3,198,097 2,355,769 2,187,500 7,741,366
RUSIZI 4,111,839 3,028,846 2,812,500 9,953,185
NYABIHU 2,741,226 2,019,231 1,875,000 6,635,457
RUBAVU 2,741,226 2,019,231 1,875,000 6,635,457
KARONGI 2,969,662 2,187,500 2,031,250 7,188,412
NGORORERO 2,969,662 2,187,500 2,031,250 7,188,412
NYAMASHEKE 3,426,533 2,524,038 2,343,750 8,294,321
RUTSIRO 2,969,662 2,187,500 2,031,250 7,188,412
BURERA 3,883,404 2,860,577 2,656,250 9,400,230
GICUMBI 4,797,146 3,533,654 3,281,250 11,612,049
MUSANZE 3,426,533 2,524,038 2,343,750 8,294,321
RULINDO 3,883,404 2,860,577 2,656,250 9,400,230
GAKENKE 4,340,275 3,197,115 2,968,750 10,506,140
RUHANGO 2,055,920 1,514,423 1,406,250 4,976,593
NYARUGENGE 2,284,355 1,682,692 1,562,500 5,529,547
KICUKIRO 2,284,355 1,682,692 1,562,500 5,529,547
GASABO 3,426,533 2,524,038 2,343,750 8,294,321
TOTAL 95,029,175 69,999,997 65,000,000 230,029,168

Table 4: Performance Indicators by Decentralized Budget Agency for Output
District and Outputs Performance Indicator Annual Target
Bugesera
Output 1: The National
Women’s Council Committees
at District and Sector levels are
Operational
NWC statutory meetings
organized
General Assembly, Bureau
and Committee meetings
Output 2: International women’s
days prepared and celebrated at
the Sector level.
Women's days celebrated
and reports available
International Rural Women's
Day, 16 Days of Activism and
International Women's Day
Output 3: Umugoroba
w'ababyeyi" operationalized in 30
districts
Umugoroba w’Ababyeyi
is operational
30 Districts
Kirehe
Output 1: The National
Women’s Council Committees
at District and Sector levels are
Operational
NWC statutory meetings
organized
General Assembly, Bureau
and Committee meetings
Output 2: International women
days prepared and celebrated at
the Sector level.
Women's days celebrated
and reports available
International Rural Women's
Day, 16 Days of Activism and
International Women's Day
Output 3: Umugoroba
w'ababyeyi" operationalized in 30
districts
Umugoroba w’Ababyeyi
is operational
30 Districts
Karongi
Output 1: The National
Women’s Council Committees
at District and Sector levels are
Operational.
NWC statutory meetings
organized
General Assembly, Bureau
and Committee meetings
Output 2: International women
days prepared and celebrated at
the Sector level.
Women's days celebrated
and reports available
International Rural Women's
Day, 16 Days of Activism and
International Women's Day
Output 3: Umugoroba
w'ababyeyi" operationalized in 30
districts
Umugoroba w’Ababyeyi
is operational
30 Districts
Ngororero
Output 1: The National
Women’s Council Committees
at District and Sector levels are
Operational.
NWC statutory meetings
organized
General Assembly, Bureau
and Committee meetings
Output 2: International women
days prepared and celebrated at
the Sector level.
Women's days celebrated
and reports available
International Rural Women's
Day, 16 Days of Activism and
International Women's Day
Output 3: Umugoroba
w'ababyeyi" operationalized in 30
districts.
Umugoroba w’Ababyeyi
is operational
30 Districts
Gakenke

Output 1: The National
Women’s Council Committees
at District and Sector levels are
Operational
NWC statutory meetings
organized
General Assembly, Bureau
and Committee meetings
Output 2: International women
days prepared and celebrated at
the Sector level.
Women's days celebrated
and reports available
International Rural Women's
Day, 16 Days of Activism and
International Women's Day
Output 3: Umugoroba
w'ababyeyi" operationalized in 30
districts
Umugoroba w’Ababyeyi
is operational
30 Districts
Burera
Output 1: The National
Women’s Council Committees
at District and Sector levels are
Operational.
NWC statutory meetings
organized
General Assembly, Bureau
and Committee meetings
Output 2: International women
days prepared and celebrated at
the Sector level.
Women's days celebrated
and reports available
International Rural Women's
Day, 16 Days of Activism and
International Women's Day
Output 3: Umugoroba
w'ababyeyi" operationalized in 30
districts
Umugoroba w’Ababyeyi
is operational
30 Districts
Kamonyi
Output 1: The National
Women’s Council Committees
at District and Sector levels are
Operational
NWC statutory meetings
organized
General Assembly, Bureau
and Committee meetings
Output 2: International women
days prepared and celebrated at
the Sector level.
Women's days celebrated
and reports available
International Rural Women's
Day, 16 Days of Activism and
International Women's Day
Output 3: Umugoroba
w'ababyeyi" operationalized in 30
districts
Umugoroba w’Ababyeyi
is operational
30 Districts
Muhanga
Output 1: The National
Women’s Council Committees
at District and Sector levels are
Operational
NWC statutory meetings
organized
General Assembly, Bureau
and Committee meetings
Output 2: International women
days prepared and celebrated at
the Sector level.
Women's days celebrated
and reports available
International Rural Women's
Day, 16 Days of Activism and
International Women's Day
Output 3: Umugoroba
w'ababyeyi operationalized in 30
districts
Umugoroba w’Ababyeyi
is operational
30 Districts
Nyarugenge
Output 1: The National
Women’s Council Committees
at District and Sector levels are
Operational
NWC statutory meetings
organized
General Assembly, Bureau
and Committee meetings
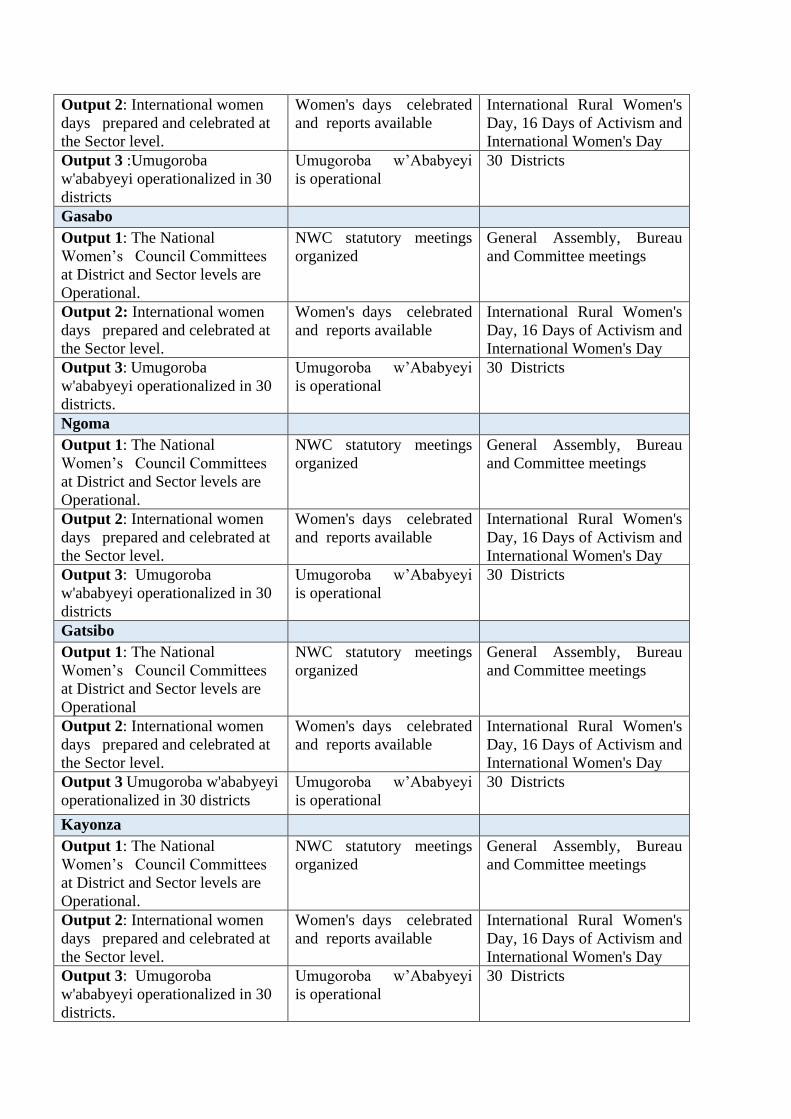
Output 2: International women
days prepared and celebrated at
the Sector level.
Women's days celebrated
and reports available
International Rural Women's
Day, 16 Days of Activism and
International Women's Day
Output 3 :Umugoroba
w'ababyeyi operationalized in 30
districts
Umugoroba w’Ababyeyi
is operational
30 Districts
Gasabo
Output 1: The National
Women’s Council Committees
at District and Sector levels are
Operational.
NWC statutory meetings
organized
General Assembly, Bureau
and Committee meetings
Output 2: International women
days prepared and celebrated at
the Sector level.
Women's days celebrated
and reports available
International Rural Women's
Day, 16 Days of Activism and
International Women's Day
Output 3: Umugoroba
w'ababyeyi operationalized in 30
districts.
Umugoroba w’Ababyeyi
is operational
30 Districts
Ngoma
Output 1: The National
Women’s Council Committees
at District and Sector levels are
Operational.
NWC statutory meetings
organized
General Assembly, Bureau
and Committee meetings
Output 2: International women
days prepared and celebrated at
the Sector level.
Women's days celebrated
and reports available
International Rural Women's
Day, 16 Days of Activism and
International Women's Day
Output 3: Umugoroba
w'ababyeyi operationalized in 30
districts
Umugoroba w’Ababyeyi
is operational
30 Districts
Gatsibo
Output 1: The National
Women’s Council Committees
at District and Sector levels are
Operational
NWC statutory meetings
organized
General Assembly, Bureau
and Committee meetings
Output 2: International women
days prepared and celebrated at
the Sector level.
Women's days celebrated
and reports available
International Rural Women's
Day, 16 Days of Activism and
International Women's Day
Output 3 Umugoroba w'ababyeyi
operationalized in 30 districts
Umugoroba w’Ababyeyi
is operational
30 Districts
Kayonza
Output 1: The National
Women’s Council Committees
at District and Sector levels are
Operational.
NWC statutory meetings
organized
General Assembly, Bureau
and Committee meetings
Output 2: International women
days prepared and celebrated at
the Sector level.
Women's days celebrated
and reports available
International Rural Women's
Day, 16 Days of Activism and
International Women's Day
Output 3: Umugoroba
w'ababyeyi operationalized in 30
districts.
Umugoroba w’Ababyeyi
is operational
30 Districts

Nyagatare
Output1: The National Women’s
Council Committees at District
and Sector levels are Operational.
NWC statutory meetings
organized
General Assembly, Bureau
and Committee meetings
Output 2: International women
days prepared and celebrated at
the Sector level.
Women's days celebrated
and reports available
International Rural Women's
Day, 16 Days of Activism and
International Women's Day
Output 3: Umugoroba
w'ababyeyi operationalized in 30
districts.
Umugoroba w’Ababyeyi
is operational
30 Districts
Rwamagana
Output 1: The National
Women’s Council Committees
at District and Sector levels are
Operational.
NWC statutory meetings
organized
General Assembly, Bureau
and Committee meetings
Output 2: International women
days prepared and celebrated at
the Sector level.
Women's days celebrated
and reports available
International Rural Women's
Day, 16 Days of Activism and
International Women's Day
Output 3: Umugoroba
w'ababyeyi operationalized in 30
districts.
Umugoroba w’Ababyeyi
is operational
30 Districts
Huye
Output 1: The National
Women’s Council Committees
at District and Sector levels are
Operational.
NWC statutory meetings
organized
General Assembly, Bureau
and Committee meetings
Output 2: International women
days prepared and celebrated at
the Sector level.
Women's days celebrated
and reports available
International Rural Women's
Day, 16 Days of Activism and
International Women's Day
Output 3: Umugoroba
w'ababyeyi operationalized in 30
districts.
Umugoroba w’Ababyeyi
is operational
30 Districts
Nyamagabe
Output 1: The National
Women’s Council Committees
at District and Sector levels are
Operational.
NWC statutory meetings
organized
General Assembly, Bureau
and Committee meetings
Output 2: International women
days prepared and celebrated at
the Sector level.
Women's days celebrated
and reports available
International Rural Women's
Day, 16 Days of Activism and
International Women's Day
Output 3: Umugoroba
w'ababyeyi operationalized in 30
districts.
Umugoroba w’Ababyeyi
is operational
30 Districts

Ruhango
Output 1: The National
Women’s Council Committees
at District and Sector levels are
Operational.
NWC statutory meetings
organized
General Assembly, Bureau
and Committee meetings
Output 2: International women
days prepared and celebrated at
the Sector level.
Women's days celebrated
and reports available
International Rural Women's
Day, 16 Days of Activism and
International Women's Day
Output 3: Umugoroba
w'ababyeyi operationalized in 30
districts.
Umugoroba w’Ababyeyi
is operational
30 Districts
Gisagara
Output 1: The National
Women’s Council Committees
at District and Sector levels are
Operational.
NWC statutory meetings
organized
General Assembly, Bureau
and Committee meetings
Output 2: International women
days prepared and celebrated at
the Sector level.
Women's days celebrated
and reports available
International Rural Women's
Day, 16 Days of Activism and
International Women's Day
Output 3: Umugoroba
w'ababyeyi operationalized in 30
districts
Umugoroba w’Ababyeyi
is operational
30 Districts
Nyanza
Output 1: The National
Women’s Council Committees
at District and Sector levels are
Operational.
NWC statutory meetings
organized
General Assembly, Bureau
and Committee meetings
Output 2: International women
days prepared and celebrated at
the Sector level.
Women's days celebrated
and reports available
International Rural Women's
Day, 16 Days of Activism and
International Women's Day
Output 3: Umugoroba
w'ababyeyi operationalized in 30
districts.
Umugoroba w’Ababyeyi
is operational
30 Districts
Nyaruguru
Output 1: The National
Women’s Council Committees
at District and Sector levels are
Operational.
NWC statutory meetings
organized
General Assembly, Bureau
and Committee meetings
Output 2: International women
days prepared and celebrated at
the Sector level.
Women's days celebrated
and reports available
International Rural Women's
Day, 16 Days of Activism and
International Women's Day
Output 3: Umugoroba
w'ababyeyi operationalized in 30
districts.
Umugoroba w’Ababyeyi
is operational
30 Districts
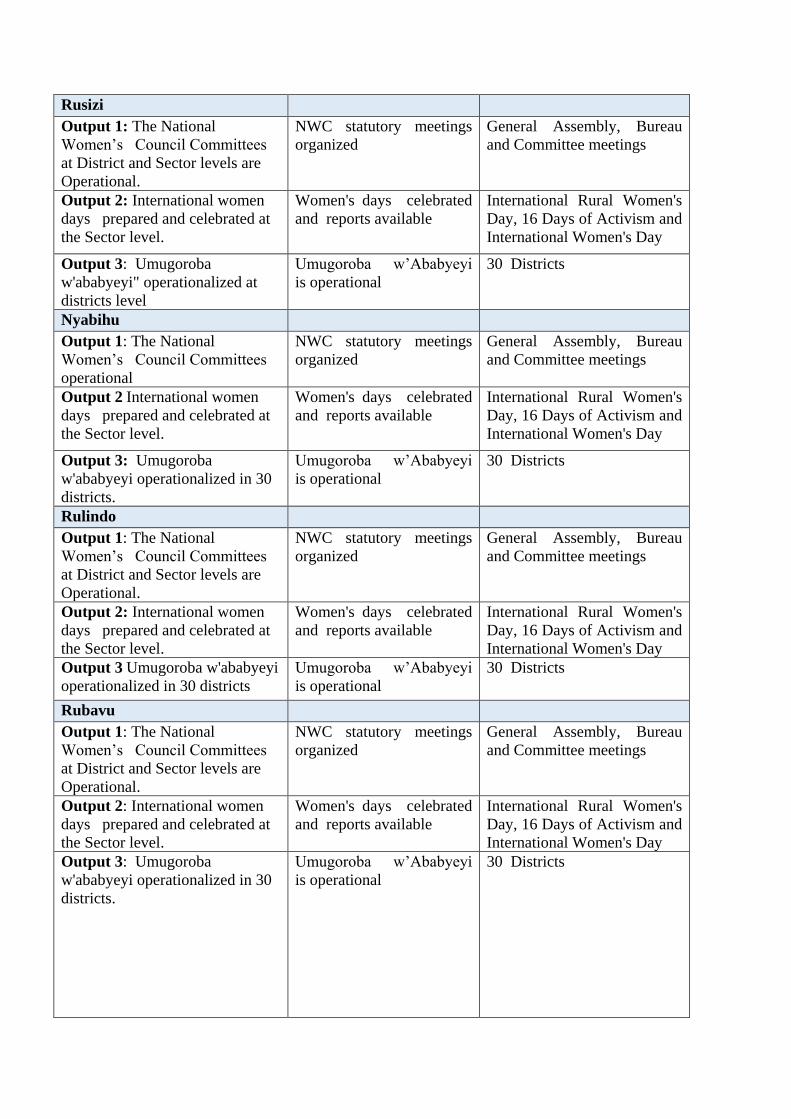
Rusizi
Output 1: The National
Women’s Council Committees
at District and Sector levels are
Operational.
NWC statutory meetings
organized
General Assembly, Bureau
and Committee meetings
Output 2: International women
days prepared and celebrated at
the Sector level.
Women's days celebrated
and reports available
International Rural Women's
Day, 16 Days of Activism and
International Women's Day
Output 3: Umugoroba
w'ababyeyi" operationalized at
districts level
Umugoroba w’Ababyeyi
is operational
30 Districts
Nyabihu
Output 1: The National
Women’s Council Committees
operational
NWC statutory meetings
organized
General Assembly, Bureau
and Committee meetings
Output 2 International women
days prepared and celebrated at
the Sector level.
Women's days celebrated
and reports available
International Rural Women's
Day, 16 Days of Activism and
International Women's Day
Output 3: Umugoroba
w'ababyeyi operationalized in 30
districts.
Umugoroba w’Ababyeyi
is operational
30 Districts
Rulindo
Output 1: The National
Women’s Council Committees
at District and Sector levels are
Operational.
NWC statutory meetings
organized
General Assembly, Bureau
and Committee meetings
Output 2: International women
days prepared and celebrated at
the Sector level.
Women's days celebrated
and reports available
International Rural Women's
Day, 16 Days of Activism and
International Women's Day
Output 3 Umugoroba w'ababyeyi
operationalized in 30 districts
Umugoroba w’Ababyeyi
is operational
30 Districts
Rubavu
Output 1: The National
Women’s Council Committees
at District and Sector levels are
Operational.
NWC statutory meetings
organized
General Assembly, Bureau
and Committee meetings
Output 2: International women
days prepared and celebrated at
the Sector level.
Women's days celebrated
and reports available
International Rural Women's
Day, 16 Days of Activism and
International Women's Day
Output 3: Umugoroba
w'ababyeyi operationalized in 30
districts.
Umugoroba w’Ababyeyi
is operational
30 Districts

Rutsiro
Output 1: The National
Women’s Council Committees
at District and Sector levels are
Operational.
NWC statutory meetings
organized
General Assembly, Bureau
and Committee meetings
Output 2: International women
days prepared and celebrated at
the Sector level.
Women's days celebrated
and reports available
International Rural Women's
Day, 16 Days of Activism and
International Women's Day
Output 3: Umugoroba
w'ababyeyi operationalized in 30
districts.
Umugoroba w’Ababyeyi
is operational
30 Districts
Nyamasheke
Output 1 The National Women’s
Council Committees at District
and Sector levels are Operational
and Sector levels are Operational.
NWC statutory meetings
organized
General Assembly, Bureau
and Committee meetings
Output 2: International women
days prepared and celebrated at
the Sector level.
Women's days celebrated
and reports available
International Rural Women's
Day, 16 Days of Activism and
International Women's Day
Output 3: Umugoroba
w'ababyeyi operationalized in 30
districts.
Umugoroba w’Ababyeyi
is operational
30 Districts
Gicumbi
Output 1: The National
Women’s Council Committees
at District and Sector levels are
Operational.
NWC statutory meetings
organized
General Assembly, Bureau
and Committee meetings
Output 2: International women
days prepared and celebrated at
the Sector level.
Women's days celebrated
and reports available
International Rural Women's
Day, 16 Days of Activism and
International Women's Day
Output 3: Umugoroba
w'ababyeyi operationalized in 30
districts.
Umugoroba w’Ababyeyi
is operational
30 Districts
Musanze
Output 1: The National
Women’s Council Committees
at District and Sector levels are
Operational.
NWC statutory meetings
organized
General Assembly, Bureau
and Committee meetings
Output 2: International women
days prepared and celebrated at
the Sector level.
Women's days celebrated
and reports available
International Rural Women's
Day, 16 Days of Activism and
International Women's Day
Output 3: Umugoroba
w'ababyeyi operationalized in 30
districts
Umugoroba w’Ababyeyi
is operational
30 Districts

Kicukiro
Output 1: The National
Women’s Council Committees
at District and Sector levels are
Operational.
NWC statutory meetings
organized
General Assembly, Bureau
and Committee meetings
Output 2: International women
days prepared and celebrated at
the Sector level.
Women's days celebrated
and reports available
International Rural Women's
Day, 16 Days of Activism and
International Women's Day
Output 3: Umugoroba
w'ababyeyi operationalized in 30
districts
Umugoroba w’Ababyeyi
is operational
30 Districts
6. Reporting System
The decentralized entities will provide financial execution reports on earmarked transfers to
MINECOFIN, monthly, quarterly and annually as required by the law.
7. Monitoring and Evaluation System
Earmarking institution will monitor and evaluate the implementation of earmarked transfers using
financial reports and performance reports from Decentralized Entities to inform the next cycle of
earmarked transfers.
8. Disbursement Schedule and Conditions
Decentralized entities have the responsibility to provide cash flow plans for all earmarked transfers and to
make commitment accordingly. Commitment can be done for direct payment or for indirect payment by
transferring funds to the decentralized entity’s account. However, on the basis of instructions provided by
the Ministry of Justice, the Treasury reserves the right to withhold any transfers committed by the
Decentralized entity. In such a case, the concerned Decentralized entity will formally be informed to take
corrective actions, failure of which, will attract sanctions as prescribed by the Law.
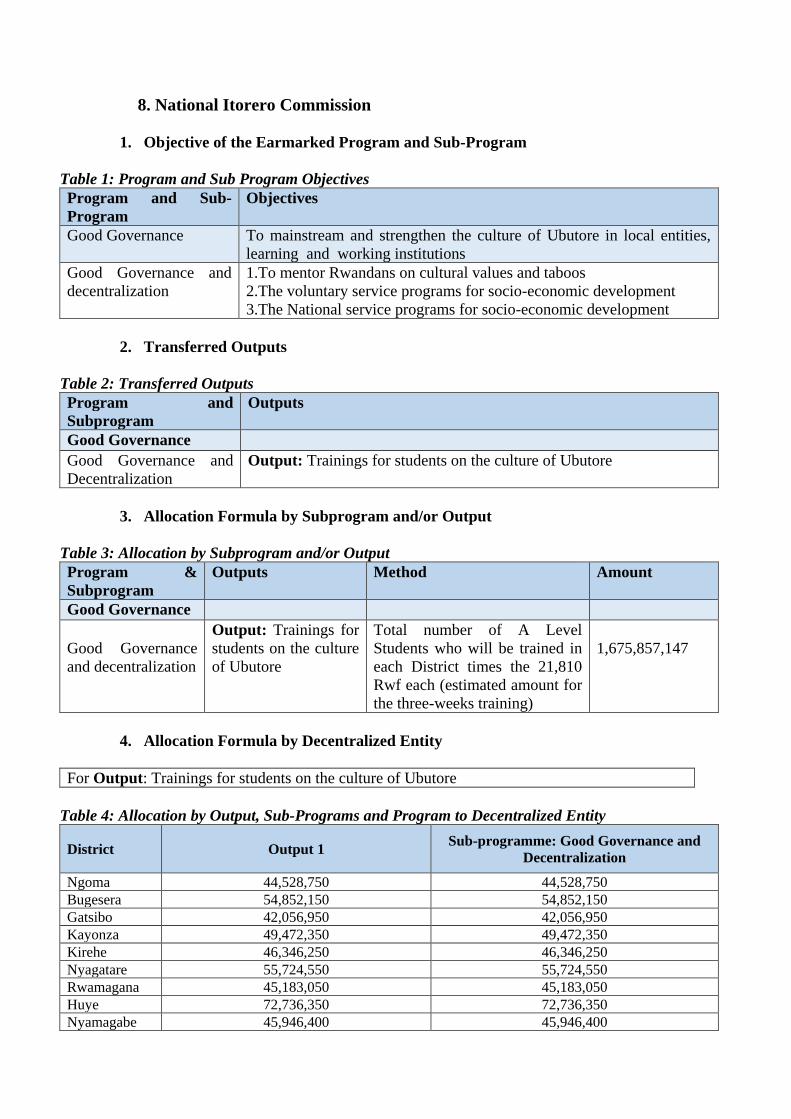
8. National Itorero Commission
1. Objective of the Earmarked Program and Sub-Program
Table 1: Program and Sub Program Objectives
Program and Sub-
Program
Objectives
Good Governance To mainstream and strengthen the culture of Ubutore in local entities,
learning and working institutions
Good Governance and
decentralization
1.To mentor Rwandans on cultural values and taboos
2.The voluntary service programs for socio-economic development
3.The National service programs for socio-economic development
2. Transferred Outputs
Table 2: Transferred Outputs
Program and
Subprogram
Outputs
Good Governance
Good Governance and
Decentralization
Output: Trainings for students on the culture of Ubutore
3. Allocation Formula by Subprogram and/or Output
Table 3: Allocation by Subprogram and/or Output
Program &
Subprogram
Outputs Method Amount
Good Governance
Good Governance
and decentralization
Output: Trainings for
students on the culture
of Ubutore
Total number of A Level
Students who will be trained in
each District times the 21,810
Rwf each (estimated amount for
the three-weeks training)
1,675,857,147
4. Allocation Formula by Decentralized Entity
For Output: Trainings for students on the culture of Ubutore
Table 4: Allocation by Output, Sub-Programs and Program to Decentralized Entity
District Output 1 Sub-programme: Good Governance and
Decentralization
Ngoma 44,528,750 44,528,750
Bugesera 54,852,150 54,852,150
Gatsibo 42,056,950 42,056,950
Kayonza 49,472,350 49,472,350
Kirehe 46,346,250 46,346,250
Nyagatare 55,724,550 55,724,550
Rwamagana 45,183,050 45,183,050
Huye 72,736,350 72,736,350
Nyamagabe 45,946,400 45,946,400

Gisagara 33,878,200 33,878,200
Muhanga 49,072,500 49,072,500
Kamonyi 45,619,250 45,619,250
Nyanza 47,109,600 47,109,600
Nyaruguru 38,385,600 38,385,600
Rusizi 90,475,150 90,475,150
Nyabihu 47,145,950 47,145,950
Rubavu 79,897,300 79,897,300
Karongi 54,161,500 54,161,500
Ngororero 32,242,450 32,242,450
Nyamasheke 65,648,100 65,648,100
Rutsiro 32,364,597 32,364,597
Burera 42,166,000 42,166,000
Gicumbi 53,688,950 53,688,950
Musanze 73,245,250 73,245,250
Rulindo 35,259,500 35,259,500
Gakenke 45,328,450 45,328,450
Ruhango 43,801,750 43,801,750
Nyarugenge 75,644,350 75,644,350
Kicukiro 107,450,600 107,450,600
Gasabo 126,425,300 126,425,300
Total 1,675,857,147 1,675,857,147
5. Performance Targets and Indicators
Table 5: Performance Indicators by Decentralized Entity for Output
District and Output Performance Indicator Annual
Target
Ngoma
Trainings for students on the culture
of Ubutore
List of A Level Students mentored 2,040
A Level
Students
Bugesera
Trainings for students on the culture
of Ubutore
List of A Level Students mentored 2,515 A
Level
Students
Gatsibo
Trainings for students on the culture
of Ubutore.
List of A Level Students mentored 1,928 A
Level
Students
Kayonza
Students completing secondary
school mentored the culture of
Ubutore
List of A Level Students mentored 2,268 A
Level
Students
Kirehe
Trainings for students on the culture
of Ubutore
List of A Level Students mentored 2,125 A
Level
Students
Nyagatare

Trainings for students on the culture
of Ubutore
List of A Level Students mentored 2,555 A
Level
Students
Rwamagana
Trainings for students on the culture
of Ubutore
List of A Level Students mentored 2,071 A
Level
Students
Huye
Trainings for students on the culture
of Ubutore
List of A Level Students mentored 3,335 A
Level
Students
Nyamagabe
Trainings for students on the culture
of Ubutore
List of A Level Students mentored 2,106 A
Level
Students
Gisagara
Trainings for students on the culture
of Ubutore
List of A Level Students mentored 1,553 A
Level
Students
Muhanga
Trainings for students on the culture
of Ubutore
List of A Level Students mentored 2,250 A
Level
Students
Kamonyi
Trainings for students on the culture
of Ubutore
List of A Level Students mentored 2,091 A
Level
Students
Nyanza
Trainings for students on the culture
of Ubutore
List of A Level Students mentored 2,160 A
Level
Students
Nyaruguru
Trainings for students on the culture
of Ubutore
List of A Level Students mentored 1,760 A
Level
Students
Rusizi
Trainings for students on the culture
of Ubutore
List of A Level Students mentored 4,148 A
Level
Students
Nyabihu
Trainings for students on the culture
of Ubutore
List of A Level Students mentored 2,161 A
Level
Students
Rubavu
Trainings for students on the culture
of Ubutore
List of A Level Students mentored 3,663 A
Level
Students

Karongi
Trainings for students on the culture
of Ubutore
List of A Level Students mentored 2,483 A
Level
Students
Ngororero
Trainings for students on the culture
of Ubutore
List of A Level Students mentored 1,478 A
Level
Students
Nyamasheke
Trainings for students on the culture
of Ubutore
List of A Level Students mentored 3,010 A
Level
Students
Rutsiro
Trainings for students on the culture
of Ubutore
List of A Level Students mentored 1,483 A
Level
Students
Burera
Trainings for students on the culture
of Ubutore
List of A Level Students mentored 1,933 A
Level
Students
Gicumbi
Trainings for students on the culture
of Ubutore
List of A Level Students mentored 2,461 A
Level
Students
Musanze
Trainings for students on the culture
of Ubutore
List of A Level Students mentored 3,358 A
Level
Students
Rulindo
Trainings for students on the culture
of Ubutore
List of A Level Students mentored 1,616 A
Level
Students
Gakenke
Trainings for students on the culture
of Ubutore
List of A Level Students mentored 2,078 A
Level
Students
Ruhango
Trainings for students on the culture
of Ubutore
List of A Level Students mentored 2,008 A
Level
Students
Nyarugenge
Trainings for students on the culture
of Ubutore
List of A Level Students mentored 3,468 A
Level
Students
Kicukiro
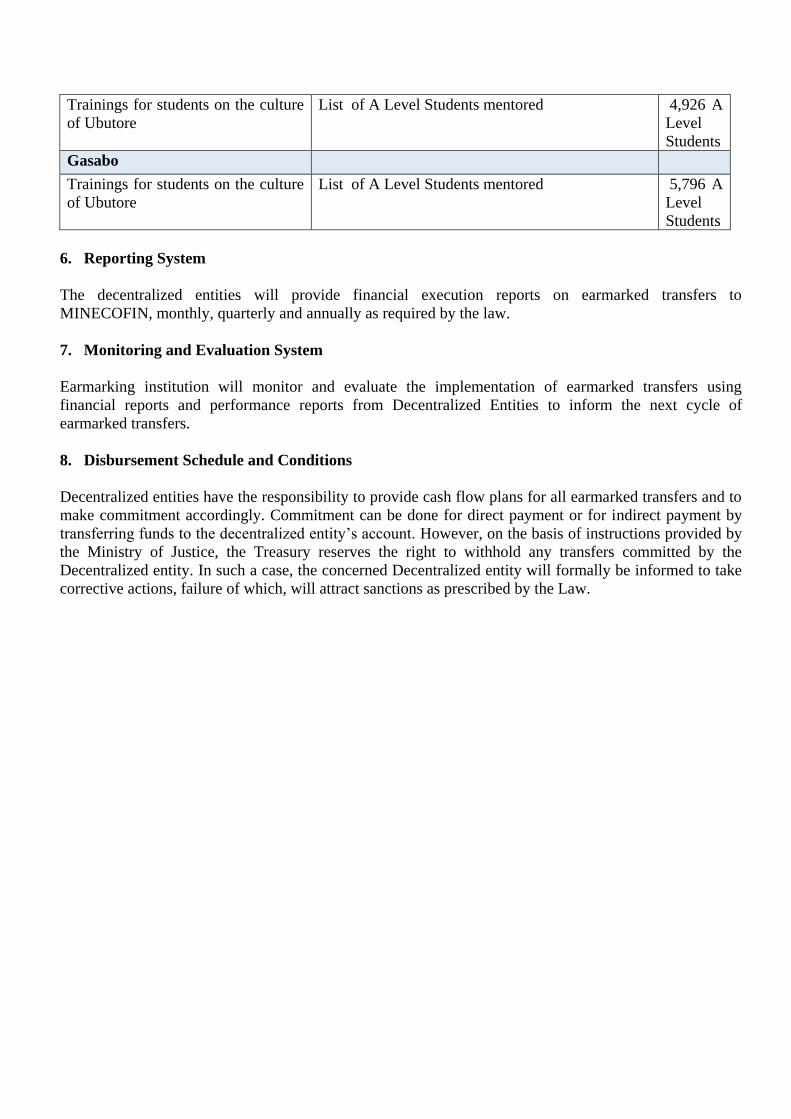
Trainings for students on the culture
of Ubutore
List of A Level Students mentored 4,926 A
Level
Students
Gasabo
Trainings for students on the culture
of Ubutore
List of A Level Students mentored 5,796 A
Level
Students
6. Reporting System
The decentralized entities will provide financial execution reports on earmarked transfers to
MINECOFIN, monthly, quarterly and annually as required by the law.
7. Monitoring and Evaluation System
Earmarking institution will monitor and evaluate the implementation of earmarked transfers using
financial reports and performance reports from Decentralized Entities to inform the next cycle of
earmarked transfers.
8. Disbursement Schedule and Conditions
Decentralized entities have the responsibility to provide cash flow plans for all earmarked transfers and to
make commitment accordingly. Commitment can be done for direct payment or for indirect payment by
transferring funds to the decentralized entity’s account. However, on the basis of instructions provided by
the Ministry of Justice, the Treasury reserves the right to withhold any transfers committed by the
Decentralized entity. In such a case, the concerned Decentralized entity will formally be informed to take
corrective actions, failure of which, will attract sanctions as prescribed by the Law.

9. National Unity and Reconciliation Commission (NURC)
1. Objective of the Earmarked Program and Sub-Program
Table 1: Program and Sub Program Objectives
Programs Objectives
Justice and Governance
Good Governance and
Decentralization
Objective of the earmarked outputs is to promote Unity and
Reconciliation
2. Transferred Outputs
Table 2: Transferred Outputs
Program & Subprogram Outputs
Justice and Governance
Governance and
Decentralization
Output 1: Unity and
Reconciliation Promotion
Activity 1. Unity and
Reconciliation sensitization in
the annual reconciliation
week.
Activity 2. Promote
partnership in unity and
reconciliation promotion
through holding meetings of
the unity and reconciliation
district dialogue platform (
forum)
Activity 3. Selection and
recognition of Abarinzi
b’Igihango within the District
Activity 4. To promote the
role of Sectors “Imirenge’’ in
unity and reconciliation
promotion by holding Sector-
competitions on unity and
reconciliation activities.
3. Allocation Formula by Subprogram and/or Output
Table 3: Allocation by Subprogram and/or Output
Program &
Subprogram
Outputs Method Amount
Justice and
Governance
Good
Governance and
decentralization
Output 1. Unity and
Reconciliation Promotion
The budget is
equal for all
Districts.
166,800,000

4. Allocation Formula by Decentralized Entity
Basis of Allocation Formula by Decentralized Entity
Activity 1. (Reconciliation Week) each District has equal budget of 1,000,000Frw x 30;
Activity 2. (Unity and Reconciliation District dialogue platform) each Sector has
112,499Frw x 30;
Activity 3. (Identification of Abarinzi b’Igihango), its 1,000,000Frw per District x 30;
Activity 4. (Holding Sector competitions of Unity and Reconciliation activities), each
District has an equal allocation of 2,000,000Frw x 30;
Table 4: Allocation by Output, Sub-Programs and Program to Decentralized Entity
District Output 1 Output 2 Output 3 Output 4 Total
Ngoma 1,000,000 1,575,000 1,000,000 2,000,000 5,575,000
Bugesera 1,000,000 1,687,500 1,000,000 2,000,000 5,687,500
Gatsibo 1,000,000 1,575,000 1,000,000 2,000,000 5,575,000
Kayonza 1,000,000 1,350,000 1,000,000 2,000,000 5,350,000
Kirehe 1,000,000 1,350,000 1,000,000 2,000,000 5,350,000
Nyagatare 1,000,000 1,575,000 1,000,000 2,000,000 5,575,000
Rwamagana 1,000,000 1,575,000 1,000,000 2,000,000 5,575,000
Huye 1,000,000 1,575,000 1,000,000 2,000,000 5,575,000
Nyamagabe 1,000,000 1,912,500 1,000,000 2,000,000 5,912,500
Gisagara 1,000,000 1,462,500 1,000,000 2,000,000 5,462,500
Muhanga 1,000,000 1,350,000 1,000,000 2,000,000 5,350,000
Kamonyi 1,000,000 1,350,000 1,000,000 2,000,000 5,350,000
Nyanza 1,000,000 1,125,000 1,000,000 2,000,000 5,125,000
Nyaruguru 1,000,000 1,575,000 1,000,000 2,000,000 5,575,000
Rusizi 1,000,000 2,025,000 1,000,000 2,000,000 6,025,000
Nyabihu 1,000,000 1,350,000 1,000,000 2,000,000 5,350,000
Rubavu 1,000,000 1,350,000 1,000,000 2,000,000 5,350,000
Karongi 1,000,000 1,462,500 1,000,000 2,000,000 5,462,500
Ngororero 1,000,000 1,462,500 1,000,000 2,000,000 5,462,500
Nyamasheke 1,000,000 1,687,500 1,000,000 2,000,000 5,687,500
Rutsiro 1,000,000 1,462,500 1,000,000 2,000,000 5,462,500
Burera 1,000,000 1,912,500 1,000,000 2,000,000 5,912,500
Gicumbi 1,000,000 2,362,500 1,000,000 2,000,000 6,362,500
Musanze 1,000,000 1,687,500 1,000,000 2,000,000 5,687,500
Rulindo 1,000,000 1,912,500 1,000,000 2,000,000 5,912,500
Gakenke 1,000,000 2,137,500 1,000,000 2,000,000 6,137,500
Ruhango 1,000,000 1,012,500 1,000,000 2,000,000 5,012,500
Nyarugenge 1,000,000 1,125,000 1,000,000 2,000,000 5,125,000
Kicukiro 1,000,000 1,125,000 1,000,000 2,000,000 5,125,000
Gasabo 1,000,000 1,687,500 1,000,000 2,000,000 5,687,500
Total 30,000,000 46,800,000 30,000,000 60,000,000 166,800,000

5. Performance Targets and Indicators
Table 5: Performance Indicators by Decentralized Budget Agency for Output
Program & Subprogram Performance Indicator Annual Target
Ngoma
Output 1 Unity and
Reconciliation Promotion 5,575,000 5,575,000 Bugesera
Output 1 Unity and
Reconciliation Promotion
5,687,500 5,687,500 Gatsibo
Output 1 Unity and
Reconciliation Promotion 5,575,000 5,575,000 Kayonza
Output 1 Unity and
Reconciliation Promotion 5,350,000 5,350,000 Kirehe
Output 1 Unity and
Reconciliation Promotion 5,350,000 5,350,000 Nyagatare
Output 1 Unity and
Reconciliation Promotion 5,575,000 5,575,000 Rwamagana
Output 1 Unity and
Reconciliation Promotion 5,575,000 5,575,000 Huye
Output 1 Unity and
Reconciliation Promotion 5,575,000 5,575,000 Nyamagabe
Output 1 Unity and
Reconciliation Promotion
5,912,500 5,912,500 Gisagara
Output 1 Unity and
Reconciliation Promotion 5,462,500 5,462,500 Muhanga
Output 1 Unity and
Reconciliation Promotion 5,350,000 5,350,000 Kamonyi
Output 1 Unity and
Reconciliation Promotion 5,350,000 5,350,000 Nyanza
Output 1 Unity and
Reconciliation Promotion 5,125,000 5,125,000
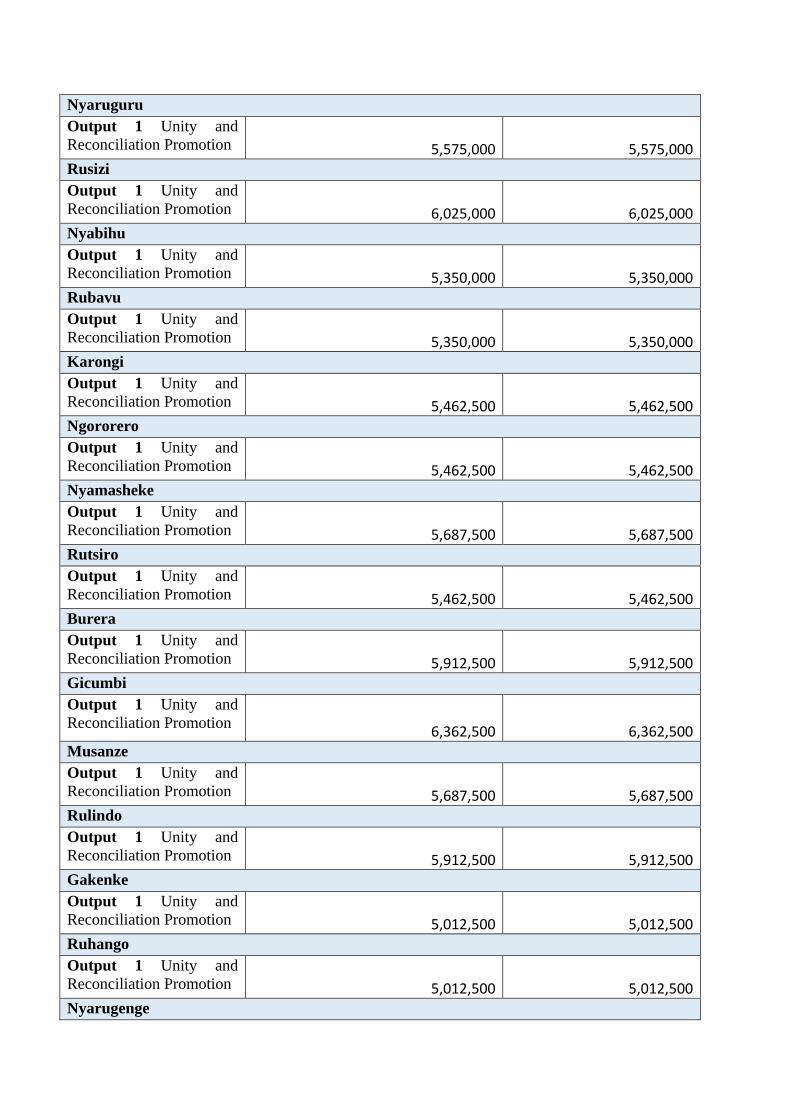
Nyaruguru
Output 1 Unity and
Reconciliation Promotion 5,575,000 5,575,000 Rusizi
Output 1 Unity and
Reconciliation Promotion 6,025,000 6,025,000 Nyabihu
Output 1 Unity and
Reconciliation Promotion 5,350,000 5,350,000 Rubavu
Output 1 Unity and
Reconciliation Promotion 5,350,000 5,350,000 Karongi
Output 1 Unity and
Reconciliation Promotion 5,462,500 5,462,500 Ngororero
Output 1 Unity and
Reconciliation Promotion 5,462,500 5,462,500 Nyamasheke
Output 1 Unity and
Reconciliation Promotion 5,687,500 5,687,500 Rutsiro
Output 1 Unity and
Reconciliation Promotion 5,462,500 5,462,500 Burera
Output 1 Unity and
Reconciliation Promotion 5,912,500 5,912,500 Gicumbi
Output 1 Unity and
Reconciliation Promotion 6,362,500 6,362,500
Musanze
Output 1 Unity and
Reconciliation Promotion 5,687,500 5,687,500 Rulindo
Output 1 Unity and
Reconciliation Promotion 5,912,500 5,912,500 Gakenke
Output 1 Unity and
Reconciliation Promotion 5,012,500 5,012,500 Ruhango
Output 1 Unity and
Reconciliation Promotion 5,012,500 5,012,500 Nyarugenge
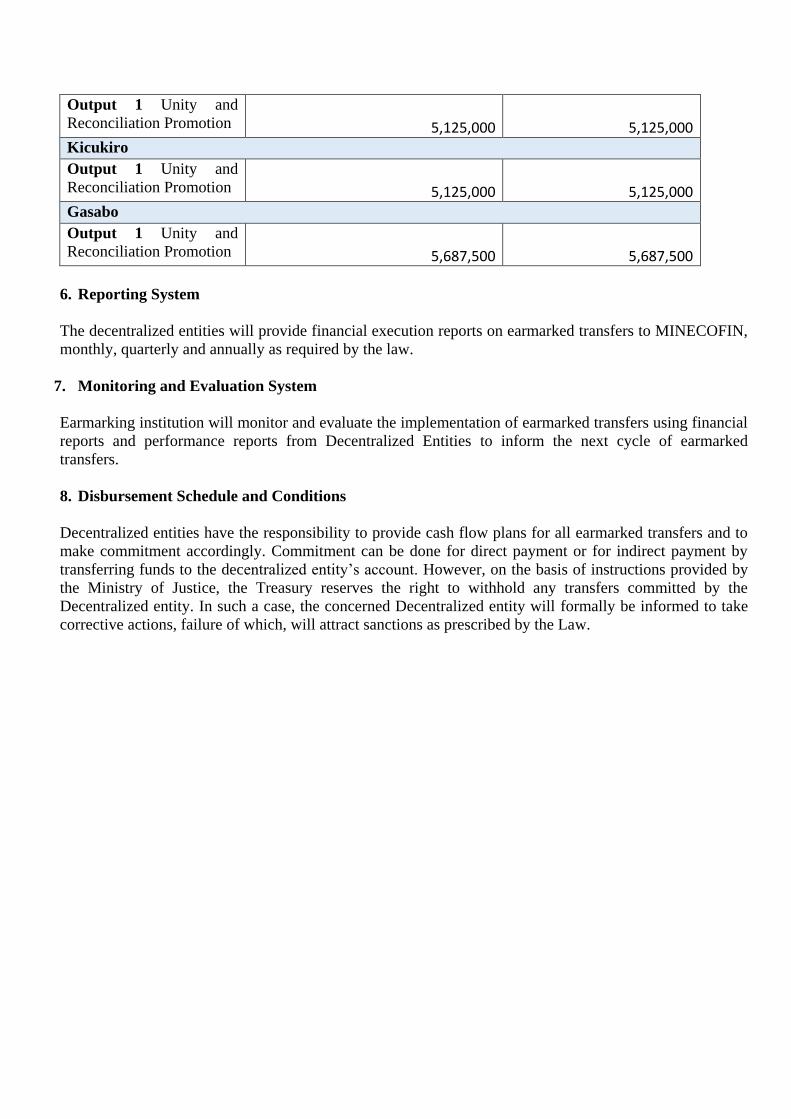
Output 1 Unity and
Reconciliation Promotion 5,125,000 5,125,000 Kicukiro
Output 1 Unity and
Reconciliation Promotion 5,125,000 5,125,000 Gasabo
Output 1 Unity and
Reconciliation Promotion 5,687,500 5,687,500
6. Reporting System
The decentralized entities will provide financial execution reports on earmarked transfers to MINECOFIN,
monthly, quarterly and annually as required by the law.
7. Monitoring and Evaluation System
Earmarking institution will monitor and evaluate the implementation of earmarked transfers using financial
reports and performance reports from Decentralized Entities to inform the next cycle of earmarked
transfers.
8. Disbursement Schedule and Conditions
Decentralized entities have the responsibility to provide cash flow plans for all earmarked transfers and to
make commitment accordingly. Commitment can be done for direct payment or for indirect payment by
transferring funds to the decentralized entity’s account. However, on the basis of instructions provided by
the Ministry of Justice, the Treasury reserves the right to withhold any transfers committed by the
Decentralized entity. In such a case, the concerned Decentralized entity will formally be informed to take
corrective actions, failure of which, will attract sanctions as prescribed by the Law.
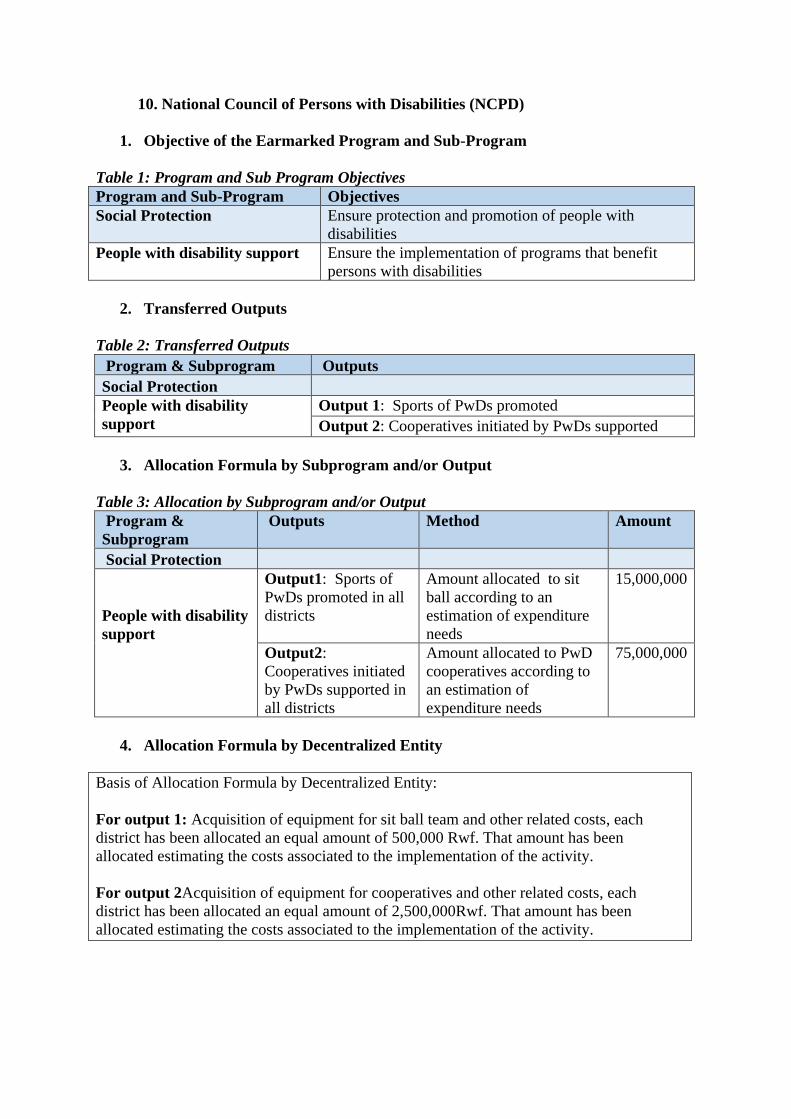
10. National Council of Persons with Disabilities (NCPD)
1. Objective of the Earmarked Program and Sub-Program
Table 1: Program and Sub Program Objectives
Program and Sub-Program Objectives
Social Protection Ensure protection and promotion of people with
disabilities
People with disability support Ensure the implementation of programs that benefit
persons with disabilities
2. Transferred Outputs
Table 2: Transferred Outputs
Program & Subprogram Outputs
Social Protection
People with disability
support
Output 1: Sports of PwDs promoted
Output 2: Cooperatives initiated by PwDs supported
3. Allocation Formula by Subprogram and/or Output
Table 3: Allocation by Subprogram and/or Output
Program &
Subprogram
Outputs Method Amount
Social Protection
People with disability
support
Output1: Sports of
PwDs promoted in all
districts
Amount allocated to sit
ball according to an
estimation of expenditure
needs
15,000,000
Output2:
Cooperatives initiated
by PwDs supported in
all districts
Amount allocated to PwD
cooperatives according to
an estimation of
expenditure needs
75,000,000
4. Allocation Formula by Decentralized Entity
Basis of Allocation Formula by Decentralized Entity:
For output 1: Acquisition of equipment for sit ball team and other related costs, each
district has been allocated an equal amount of 500,000 Rwf. That amount has been
allocated estimating the costs associated to the implementation of the activity.
For output 2Acquisition of equipment for cooperatives and other related costs, each
district has been allocated an equal amount of 2,500,000Rwf. That amount has been
allocated estimating the costs associated to the implementation of the activity.

Table 4: Allocation by Output, Sub-Programs and Program to Decentralized Entity
District Output 1 Output 2 Total
Ngoma 500,000 2,500,000 3,000,000
Bugesera 500,000 2,500,000 3,000,000
Gatsibo 500,000 2,500,000 3,000,000
Kayonza 500,000 2,500,000 3,000,000
Kirehe 500,000 2,500,000 3,000,000
Nyagatare 500,000 2,500,000 3,000,000
Rwamagana 500,000 2,500,000 3,000,000
Huye 500,000 2,500,000 3,000,000
Nyamagabe 500,000 2,500,000 3,000,000
Gisagara 500,000 2,500,000 3,000,000
Muhanga 500,000 2,500,000 3,000,000
Kamonyi 500,000 2,500,000 3,000,000
Nyanza 500,000 2,500,000 3,000,000
Nyaruguru 500,000 2,500,000 3,000,000
Rusizi 500,000 2,500,000 3,000,000
Nyabihu 500,000 2,500,000 3,000,000
Rubavu 500,000 2,500,000 3,000,000
Karongi 500,000 2,500,000 3,000,000
Ngororero 500,000 2,500,000 3,000,000
Nyamasheke 500,000 2,500,000 3,000,000
Rutsiro 500,000 2,500,000 3,000,000
Burera 500,000 2,500,000 3,000,000
Gicumbi 500,000 2,500,000 3,000,000
Musanze 500,000 2,500,000 3,000,000
Rulindo 500,000 2,500,000 3,000,000
Gakenke 500,000 2,500,000 3,000,000
Ruhango 500,000 2,500,000 3,000,000
Nyarugenge 500,000 2,500,000 3,000,000
Kicukiro 500,000 2,500,000 3,000,000
Gasabo 500,000 2,500,000 3,000,000
Total 15,000,000 75,000,000 90,000,000

5. Performance targets and indicators
Table 5: Performance Indicators by Decentralized Budget Agency for Output
Program & Subprogram Performance Indicator Performance Target
Ngoma
Sports of PwDs promoted in all
districts
Number of Sport teams
supported 1 Sport team supported
Cooperatives initiated by PwDs
supported in all districts
Number of cooperatives
supported 2 cooperatives supported
Bugesera
Sports of PwDs promoted in all
districts
Number of Sport teams
supported 1 Sport team supported
Cooperatives initiated by PwDs
supported in all districts
Number of cooperatives
supported 2 cooperatives supported
Gatsibo
Sports of PwDs promoted in all
districts
Number of Sport teams
supported 1 Sport team supported
Cooperatives initiated by PwDs
supported in all districts
Number of cooperatives
supported 2 cooperatives supported
Kayonza
Sports of PwDs promoted in all
districts
Number of Sport teams
supported 1 Sport team supported
Cooperatives initiated by PwDs
supported in all districts
Number of cooperatives
supported 2 cooperatives supported
Kirehe
Sports of PwDs promoted in all
districts
Number of Sport teams
supported 1 Sport team supported
Cooperatives initiated by PwDs
supported in all districts
Number of cooperatives
supported 2 cooperatives supported
Nyagatare
Sports of PwDs promoted in all
districts
Number of Sport teams
supported 1 Sport team supported
Cooperatives initiated by PwDs
supported in all districts
Number of cooperatives
supported 2 cooperatives supported
Rwamagana
Sports of PwDs promoted in all
districts
Number of Sport teams
supported 1 Sport team supported
Cooperatives initiated by PwDs
supported in all districts
Number of cooperatives
supported 2 cooperatives supported
Huye
Sports of PwDs promoted in all
districts
Number of Sport teams
supported 1 Sport team supported
Cooperatives initiated by PwDs
supported in all districts
Number of cooperatives
supported 2 cooperatives supported

Nyamagabe
Sports of PwDs promoted in all
districts
Number of Sport teams
supported 1 Sport team supported
Cooperatives initiated by PwDs
supported in all districts
Number of cooperatives
supported 2 cooperatives supported
Gisagara
Sports of PwDs promoted in all
districts
Number of Sport teams
supported 1 Sport team supported
Cooperatives initiated by PwDs
supported in all districts
Number of cooperatives
supported 2 cooperatives supported
Muhanga
Sports of PwDs promoted in all
districts
Number of Sport teams
supported 1 Sport team supported
Cooperatives initiated by PwDs
supported in all districts
Number of cooperatives
supported 2 cooperatives supported
Kamonyi
Sports of PwDs promoted in all
districts
Number of Sport teams
supported 1 Sport team supported
Cooperatives initiated by PwDs
supported in all districts
Number of cooperatives
supported 2 cooperatives supported
Nyanza
Sports of PwDs promoted in all
districts
Number of Sport teams
supported 1 Sport team supported
Cooperatives initiated by PwDs
supported in all districts
Number of cooperatives
supported 2 cooperatives supported
Nyaruguru
Sports of PwDs promoted in all
districts
Number of Sport teams
supported 1 Sport team supported
Cooperatives initiated by PwDs
supported in all districts
Number of cooperatives
supported 2 cooperatives supported
Rusizi
Sports of PwDs promoted in all
districts
Number of Sport teams
supported 1 Sport team supported
Cooperatives initiated by PwDs
supported in all districts
Number of cooperatives
supported 2 cooperatives supported
Nyabihu
Sports of PwDs promoted in all
districts
Number of Sport teams
supported 1 Sport team supported
Cooperatives initiated by PwDs
supported in all districts
Number of cooperatives
supported 2 cooperatives supported
Rubavu
Sports of PwDs promoted in all
districts
Number of Sport teams
supported 1 Sport team supported
Cooperatives initiated by PwDs
supported in all districts
Number of cooperatives
supported
2 cooperatives supported

Karongi
Sports of PwDs promoted in all
districts
Number of Sport teams
supported 1 Sport team supported
Cooperatives initiated by PwDs
supported in all districts
Number of cooperatives
supported 2 cooperatives supported
Ngororero
Sports of PwDs promoted in all
districts
Number of Sport teams
supported 1 Sport team supported
Cooperatives initiated by PwDs
supported in all districts
Number of cooperatives
supported 2 cooperatives supported
Nyamasheke
Sports of PwDs promoted in all
districts
Number of Sport teams
supported 1 Sport team supported
Cooperatives initiated by PwDs
supported in all districts
Number of cooperatives
supported 2 cooperatives supported
Rutsiro
Sports of PwDs promoted in all
districts
Number of Sport teams
supported 1 Sport team supported
Cooperatives initiated by PwDs
supported in all districts
Number of cooperatives
supported 2 cooperatives supported
Burera
Sports of PwDs promoted in all
districts
Number of Sport teams
supported 1 Sport team supported
Cooperatives initiated by PwDs
supported in all districts
Number of cooperatives
supported 2 cooperatives supported
Gicumbi
Sports of PwDs promoted in all
districts
Number of Sport teams
supported 1 Sport team supported
Cooperatives initiated by PwDs
supported in all districts
Number of cooperatives
supported 2 cooperatives supported
Musanze
Sports of PwDs promoted in all
districts
Number of Sport teams
supported 1 Sport team supported
Cooperatives initiated by PwDs
supported in all districts
Number of cooperatives
supported 2 cooperatives supported
Rulindo
Sports of PwDs promoted in all
districts
Number of Sport teams
supported 1 Sport team supported
Cooperatives initiated by PwDs
supported in all districts
Number of cooperatives
supported 2 cooperatives supported
Gakenke
Sports of PwDs promoted in all
districts
Number of Sport teams
supported 1 Sport team supported

Cooperatives initiated by PwDs
supported in all districts
Number of cooperatives
supported 2 cooperatives supported
Ruhango
Sports of PwDs promoted in all
districts
Number of Sport teams
supported 1 Sport team supported
Cooperatives initiated by PwDs
supported in all districts
Number of cooperatives
supported 2 cooperatives supported
Nyarugenge
Sports of PwDs promoted in all
districts
Number of Sport teams
supported 1 Sport team supported
Cooperatives initiated by PwDs
supported in all districts
Number of cooperatives
supported 2 cooperatives supported
Kicukiro
Sports of PwDs promoted in all
districts
Number of Sport teams
supported 1 Sport team supported
Cooperatives initiated by PwDs
supported in all districts
Number of cooperatives
supported 2 cooperatives supported
Gasabo
Sports of PwDs promoted in all
districts
Number of Sport teams
supported 1 Sport team supported
Cooperatives initiated by PwDs
supported in all districts
Number of cooperatives
supported 2 cooperatives supported
6. Reporting System
The decentralized entities will provide financial execution reports on earmarked transfers to
MINECOFIN, monthly, quarterly and annually as required by the law.
7. Monitoring and Evaluation System
Earmarking institution will monitor and evaluate the implementation of earmarked transfers
using financial reports and performance reports from Decentralized Entities to inform the next
cycle of earmarked transfers.
8. Disbursement Schedule and Conditions
Decentralized entities have the responsibility to provide cash flow plans for all earmarked
transfers and to make commitment accordingly. Commitment can be done for direct payment or
for indirect payment by transferring funds to the decentralized entity’s account. However, on the
basis of instructions provided by the Ministry of Justice, the Treasury reserves the right to
withhold any transfers committed by the Decentralized entity. In such a case, the concerned
Decentralized entity will formally be informed to take corrective actions, failure of which, will
attract sanctions as prescribed by the Law.

11. Government Assistance Fund for Survivors (FARG)
1. Objective of the Earmarked Program and Sub-Program
Table 1: Program and Sub Program Objectives
Program and Sub-
Program
Objectives
Social Protection To promote and protect genocide survivors
Genocide survivors
support
To ensure the welfare of genocide survivors and their families
through direct support, paying school fees for among of them and
provision of housing to the households remained without shelter.
2. Transferred Outputs
Table 2: Transferred Outputs
Program &
Subprogram
Outputs
Genocide
survivors support
Output 1: 6,808 secondary school students are financially supported to
attend school
Output 2: 23,186 vulnerable genocide survivors are provided direct
support
Output 3: 1,356 vulnerable genocide survivors are provided special direct
support(Incike)
Output 4: 502 families of vulnerable genocide survivors are resettled
Output 5: Assistance to construct cowsheds
3. Allocation Formula by Sub-Program and/or Output
Table 3: Allocation by Sub-Program and/or Output Program &
Subprogram
Outputs Method Amount
Social Protection
Genocide survivors
support
Output 1: 6,808 secondary
school students are
financially supported to
attend school
Cost per year for each
secondary school student
is 66,631Rwf
453,627,200
Output 2: 23,186
vulnerable genocide
survivors are provided
direct support
Each vulnerable genocide
survivor requiring direct
support is provided
91,657Rwf per month
2,125,170,000
Output 3:1536 vulnerable
genocide survivors (those
who are old at the same
time without any children)
are provided special direct
support
Each vulnerable genocide
survivor requiring direct
support is provided
347,109Rwf per month
533,160,000

Output 4: 502 families of
vulnerable genocide
survivors are resettled
Cost of rehabilitation for
each house is estimated at
18,960,913 Rwf
10,704,461,485
Output 5: Assistance to
construct cowsheds
Cost to construct
cowsheds.
1,186,083,185
4. Allocation Formula by Decentralized Entity
For Output 1: 6,808 secondary school students are financially supported to attend school,
the cost of secondary school fees is 66,631 Rwf per year/per student and each district has
been allocated an amount according to the following computation: District allocation =
(number of students in district to pay secondary school fees for) x 66,631 Rwf. Amount on
which it is added the other for different scholastic materials and other facilities.
For Output 2: 23,186 vulnerable genocide survivors are provided direct support, direct
support of 7,500 Rwf per month/individual (91,657 Rwf per year) is to be provided to each
vulnerable genocide survivor requiring support and each district has been allocated an
amount according to the following computation: District allocation = number of genocide
survivors per district to be supported x 91,657 Rwf
For Output 3: 1,536 vulnerable genocide survivors (those who are old at the same time
without any children) are provided special direct support, direct support of 30,000 Rwf per
month/individual (347,109 Rwf per year) is to be provided to each vulnerable genocide
survivor requiring support and each district has been allocated an amount according to the
following computation: District allocation = number of genocide survivors per district to be
supported x 347,109 Rwf
For Output 4: 502 families of vulnerable genocide survivors are resettled, the cost of
rehabilitating/construction each house estimated at 18,960,913 Rwf has been allocated this
amount according to the following computation: District allocation = number of houses to be
built in district x 18,960,913 Rwf
Output 5: Assistance to construct cowsheds the cost of construction for cowsheds in all
districts is estimated at 1,186,083,185 Rwf.
Table 4: Allocation by Output, Sub-Programs and Program to Decentralized Entity
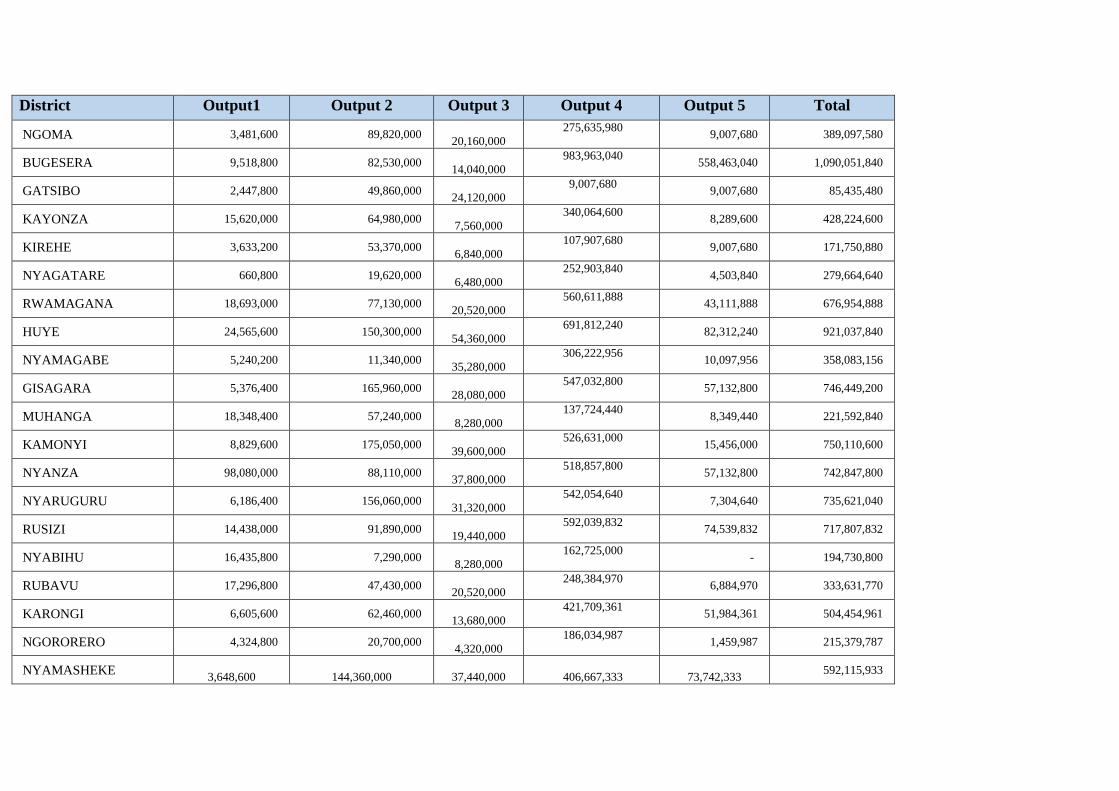
District Output1 Output 2 Output 3 Output 4 Output 5 Total
NGOMA 3,481,600 89,820,000
20,160,000
275,635,980 9,007,680 389,097,580
BUGESERA 9,518,800 82,530,000
14,040,000
983,963,040 558,463,040 1,090,051,840
GATSIBO 2,447,800 49,860,000
24,120,000
9,007,680 9,007,680 85,435,480
KAYONZA 15,620,000 64,980,000
7,560,000
340,064,600 8,289,600 428,224,600
KIREHE 3,633,200 53,370,000
6,840,000
107,907,680 9,007,680 171,750,880
NYAGATARE 660,800 19,620,000
6,480,000
252,903,840 4,503,840 279,664,640
RWAMAGANA 18,693,000 77,130,000
20,520,000
560,611,888 43,111,888 676,954,888
HUYE 24,565,600 150,300,000
54,360,000
691,812,240 82,312,240 921,037,840
NYAMAGABE 5,240,200 11,340,000
35,280,000
306,222,956 10,097,956 358,083,156
GISAGARA 5,376,400 165,960,000
28,080,000
547,032,800 57,132,800 746,449,200
MUHANGA 18,348,400 57,240,000
8,280,000
137,724,440 8,349,440 221,592,840
KAMONYI 8,829,600 175,050,000
39,600,000
526,631,000 15,456,000 750,110,600
NYANZA 98,080,000 88,110,000
37,800,000
518,857,800 57,132,800 742,847,800
NYARUGURU 6,186,400 156,060,000
31,320,000
542,054,640 7,304,640 735,621,040
RUSIZI 14,438,000 91,890,000
19,440,000
592,039,832 74,539,832 717,807,832
NYABIHU 16,435,800 7,290,000
8,280,000
162,725,000 - 194,730,800
RUBAVU 17,296,800 47,430,000
20,520,000
248,384,970 6,884,970 333,631,770
KARONGI 6,605,600 62,460,000
13,680,000
421,709,361 51,984,361 504,454,961
NGORORERO 4,324,800 20,700,000
4,320,000
186,034,987 1,459,987 215,379,787
NYAMASHEKE
3,648,600
144,360,000
37,440,000
406,667,333
73,742,333 592,115,933

RUTSIRO 2,627,800 30,870,000
5,040,000
177,664,980 4,589,980 216,202,780
BURERA 450,000 1,350,000
-
149,500,000 - 151,300,000
GICUMBI 3,527,800 19,260,000
3,960,000
216,517,946 12,392,946 243,265,746
MUSANZE 7,297,200 15,660,000
720,000
149,776,900 3,726,900 173,454,100
RULINDO 6,500,200 80,100,000
12,960,000
351,380,952 9,255,952 450,941,152
GAKENKE 270,000 6,750,000
2,160,000
166,750,000 - 175,930,000
RUHANGO 91,648,600 117,630,000
12,960,000
368,207,800 57,132,800 590,446,400
NYARUGENGE 11,532,000 72,720,000
24,120,000
466,095,200 3,795,200 574,467,200
KICUKIRO 32,968,800 52,380,000
10,440,000
310,655,440 3,605,440 406,444,240
GASABO 13,373,400 112,950,000
22,680,000
529,920,200 3,795,200 678,923,600
Total
453,627,200
2,125,170,000
533,160,000
10,704,461,485
1,186,083,185
13,816,418,685
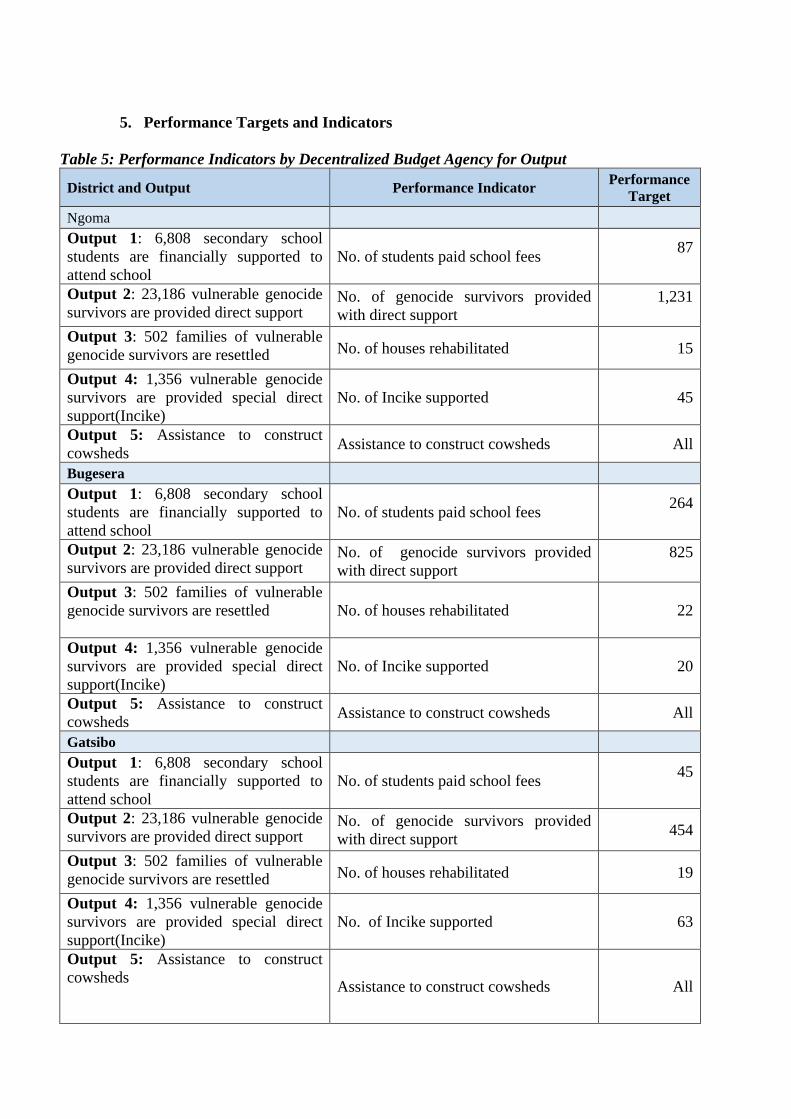
5. Performance Targets and Indicators
Table 5: Performance Indicators by Decentralized Budget Agency for Output
District and Output Performance Indicator Performance
Target
Ngoma
Output 1: 6,808 secondary school
students are financially supported to
attend school
No. of students paid school fees 87
Output 2: 23,186 vulnerable genocide
survivors are provided direct support No. of genocide survivors provided
with direct support
1,231
Output 3: 502 families of vulnerable
genocide survivors are resettled No. of houses rehabilitated 15
Output 4: 1,356 vulnerable genocide
survivors are provided special direct
support(Incike)
No. of Incike supported 45
Output 5: Assistance to construct
cowsheds Assistance to construct cowsheds All
Bugesera
Output 1: 6,808 secondary school
students are financially supported to
attend school
No. of students paid school fees 264
Output 2: 23,186 vulnerable genocide
survivors are provided direct support No. of genocide survivors provided
with direct support
825
Output 3: 502 families of vulnerable
genocide survivors are resettled No. of houses rehabilitated
22
Output 4: 1,356 vulnerable genocide
survivors are provided special direct
support(Incike)
No. of Incike supported 20
Output 5: Assistance to construct
cowsheds Assistance to construct cowsheds All
Gatsibo
Output 1: 6,808 secondary school
students are financially supported to
attend school
No. of students paid school fees 45
Output 2: 23,186 vulnerable genocide
survivors are provided direct support No. of genocide survivors provided
with direct support 454
Output 3: 502 families of vulnerable
genocide survivors are resettled No. of houses rehabilitated 19
Output 4: 1,356 vulnerable genocide
survivors are provided special direct
support(Incike)
No. of Incike supported 63
Output 5: Assistance to construct
cowsheds
Assistance to construct cowsheds All

Kayonza
Output 1: 6,808 secondary school
students are financially supported to
attend school
No. of students paid school fees 150
Output 2: 23,186 vulnerable genocide
survivors are provided direct support No. of genocide survivors provided
with direct support
761
Output 3: 502 families of vulnerable
genocide survivors are resettled No. of houses rehabilitated
14
Output 4: 1,356 vulnerable genocide
survivors are provided special direct
support(Incike)
No. of Incike supported 13
Output 5: Assistance to construct
cowsheds Assistance to construct cowsheds All
Kirehe
Output 1: 6,808 secondary school
students are financially supported to
attend school
No. of students paid school fees 71
Output 2: 23,186 vulnerable genocide
survivors are provided direct support No. of genocide survivors provided
with direct support
571
Output 3: 502 families of vulnerable
genocide survivors are resettled No. of houses rehabilitated
21
Output 4: 1,356 vulnerable genocide
survivors are provided special direct
support(Incike)
No. of Incike supported 8
Output 5: Assistance to construct
cowsheds Assistance to construct cowsheds
All
Nyagatare
Output 1: 6,808 secondary school
students are financially supported to
attend school
No. of students for which school fees
are paid
19
Output 2: 23,186 vulnerable genocide
survivors are provided direct support No. of genocide survivors provided
with direct support
201
Output 3: 502 families of vulnerable
genocide survivors are resettled No. of houses rehabilitated
14
Output 4: 1,356 vulnerable genocide
survivors are provided special direct
support(Incike)
No. of Incike supported 13
Output 5: Assistance to construct
cowsheds Assistance to construct cowsheds All
Rwamagana
Output 1: 6,808 secondary school
students are financially supported to
attend school
No. of students paid school fees 253
Output 2: 23,186 vulnerable genocide
survivors are provided direct support No. of genocide survivors provided
with direct support
885

Output 3: 502 families of vulnerable
genocide survivors are resettled No. of houses rehabilitated
16
Output 4: 1,356 vulnerable genocide
survivors are provided special direct
support(Incike)
No. of Incike supported 35
Output 5: Assistance to construct
cowsheds Assistance to construct cowsheds All
Huye
Output 1: 6,808 secondary school
students are financially supported to
attend school
No. of students paid school fees 187
Output 2: 23,186 vulnerable genocide
survivors are provided direct support No. of genocide survivors provided
with direct support
1,659
Output 3: 502 families of vulnerable
genocide survivors are resettled No. of houses rehabilitated
16
Output 4: 1,356 vulnerable genocide
survivors are provided special direct
support(Incike)
No. of Incike supported 138
Output 5: Assistance to construct
cowsheds Assistance to construct cowsheds All
Nyamagabe
Output 1: 6,808 secondary school
students are financially supported to
attend school
No. of students paid school fees 58
Output 2: 23,186 vulnerable genocide
survivors are provided direct support No. of genocide survivors provided
with direct support
208
Output 3: 502 families of vulnerable
genocide survivors are resettled No. of houses rehabilitated
16
Output 4: 1,356 vulnerable genocide
survivors are provided special direct
support(Incike)
No. of Incike supported 92
Output 5: Assistance to construct
cowsheds Assistance to construct cowsheds All
Gisagara
Output 1: 6,808 secondary school
students are financially supported to
attend school
No. of students paid school fees 69
Output 2: 23,186 vulnerable genocide
survivors are provided direct support No. of genocide survivors provided
with direct support
1,861
Output 3: 502 families of vulnerable
genocide survivors are resettled No. of houses rehabilitated
19
Output 4: 1,356 vulnerable genocide
survivors are provided special direct
support(Incike)
No. of Incike supported 72
Output 5: Assistance to construct
cowsheds Assistance to construct cowsheds All

Muhanga
Output 1: 6,808 secondary school
students are financially supported to
attend school
No. of students paid school fees 216
Output 2: 23,186 vulnerable genocide
survivors are provided direct support No. of genocide survivors provided
with direct support
541
Output 3: 502 families of vulnerable
genocide survivors are resettled No. of houses rehabilitated
14
Output 4: 1,356 vulnerable genocide
survivors are provided special direct
support(Incike)
No. of Incike supported 26
Output 5: Assistance to construct
cowsheds Assistance to construct cowsheds All
Kamonyi
Output 1: 6,808 secondary school
students are financially supported to
attend school
No. of students paid school fees 154
Output 2: 23,186 vulnerable genocide
survivors are provided direct support No. of genocide survivors provided
with direct support
1,937
Output 3: 502 families of vulnerable
genocide survivors are resettled No. of houses rehabilitated
23
Output 4: 1,356 vulnerable genocide
survivors are provided special direct
support(Incike)
No. of Incike supported 80
Output 5: Assistance to construct
cowsheds Assistance to construct cowsheds All
Nyanza
Output 1: 6,808 secondary school
students are financially supported to
attend school
No. of students paid school fees 1,272
Output 2: 23,186 vulnerable genocide
survivors are provided direct support No. of genocide survivors provided
with direct support
986
Output 3: 502 families of vulnerable
genocide survivors are resettled No. of houses rehabilitated
23
Output 4: 1,356 vulnerable genocide
survivors are provided special direct
support(Incike)
No. of Incike supported 107
Output 5: Assistance to construct
cowsheds Assistance to construct cowsheds All
Nyaruguru
Output 1: 6,808 secondary school
students are financially supported to
attend school
No. of students paid school fees 109
Output 2: 23,186 vulnerable genocide
survivors are provided direct support No. of genocide survivors provided
with direct support
1,572
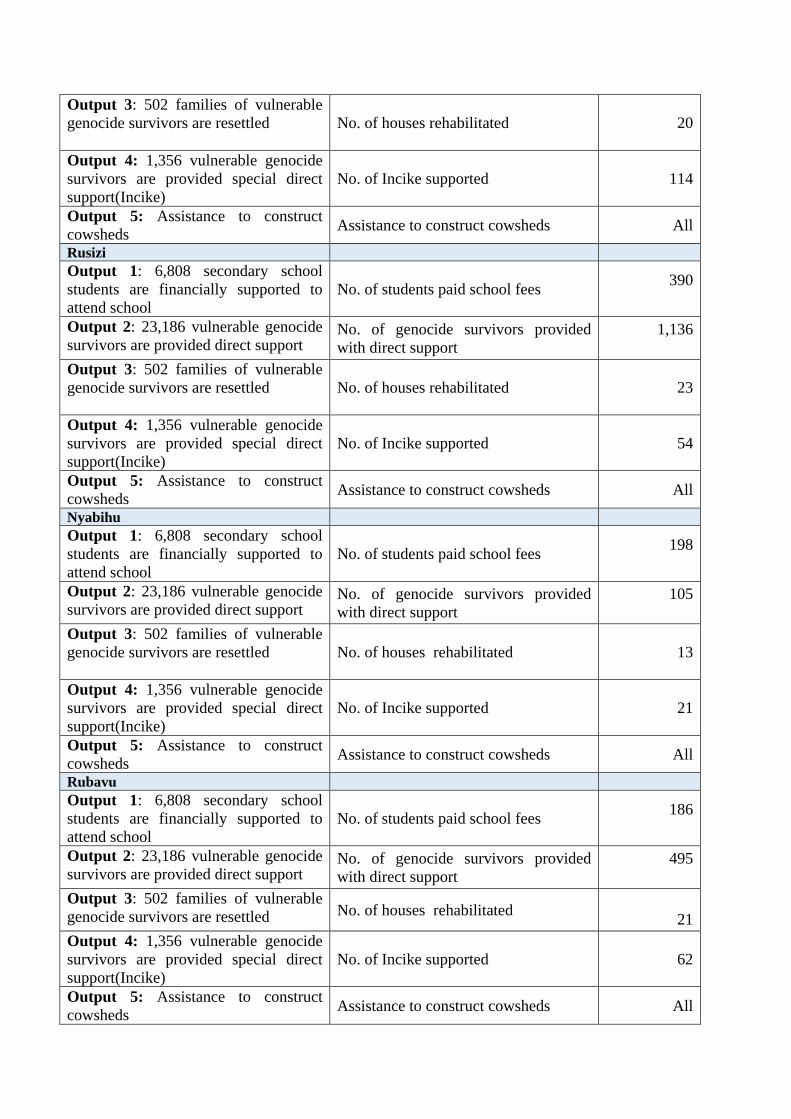
Output 3: 502 families of vulnerable
genocide survivors are resettled No. of houses rehabilitated
20
Output 4: 1,356 vulnerable genocide
survivors are provided special direct
support(Incike)
No. of Incike supported 114
Output 5: Assistance to construct
cowsheds Assistance to construct cowsheds All
Rusizi
Output 1: 6,808 secondary school
students are financially supported to
attend school
No. of students paid school fees 390
Output 2: 23,186 vulnerable genocide
survivors are provided direct support No. of genocide survivors provided
with direct support
1,136
Output 3: 502 families of vulnerable
genocide survivors are resettled No. of houses rehabilitated
23
Output 4: 1,356 vulnerable genocide
survivors are provided special direct
support(Incike)
No. of Incike supported 54
Output 5: Assistance to construct
cowsheds Assistance to construct cowsheds All
Nyabihu
Output 1: 6,808 secondary school
students are financially supported to
attend school
No. of students paid school fees 198
Output 2: 23,186 vulnerable genocide
survivors are provided direct support No. of genocide survivors provided
with direct support
105
Output 3: 502 families of vulnerable
genocide survivors are resettled No. of houses rehabilitated
13
Output 4: 1,356 vulnerable genocide
survivors are provided special direct
support(Incike)
No. of Incike supported 21
Output 5: Assistance to construct
cowsheds Assistance to construct cowsheds All
Rubavu
Output 1: 6,808 secondary school
students are financially supported to
attend school
No. of students paid school fees 186
Output 2: 23,186 vulnerable genocide
survivors are provided direct support No. of genocide survivors provided
with direct support
495
Output 3: 502 families of vulnerable
genocide survivors are resettled No. of houses rehabilitated
21
Output 4: 1,356 vulnerable genocide
survivors are provided special direct
support(Incike)
No. of Incike supported 62
Output 5: Assistance to construct
cowsheds Assistance to construct cowsheds All

Karongi
Output 1: 6,808 secondary school
students are financially supported to
attend school
No. of students paid school fees 118
Output 2: 23,186 vulnerable genocide
survivors are provided direct support No. of genocide survivors provided
with direct support
693
Output 3: 502 families of vulnerable
genocide survivors are resettled No. of houses rehabilitated
19
Output 4: 1,356 vulnerable genocide
survivors are provided special direct
support(Incike)
No. of Incike supported 52
Output 5: Assistance to construct
cowsheds Assistance to construct cowsheds All
Ngororero
Output 1: 6,808 secondary school
students are financially supported to
attend school
No. of students paid school fees 67
Output 2: 23,186 vulnerable genocide
survivors are provided direct support No. of genocide survivors provided
with direct support
249
Output 3: 502 families of vulnerable
genocide survivors are resettled No. of houses rehabilitated
13
Output 4: 1,356 vulnerable genocide
survivors are provided special direct
support(Incike)
No. of Incike supported 8
Output 5: Assistance to construct
cowsheds Assistance to construct cowsheds All
Nyamasheke
Output 1: 6,808 secondary school
students are financially supported to
attend school
No. of students paid school fees 131
Output 2: 23,186 vulnerable genocide
survivors are provided direct support No. of genocide survivors provided
with direct support
1,391
Output 3: 502 families of vulnerable
genocide survivors are resettled No. of houses rehabilitated
15
Output 4: 1,356 vulnerable genocide
survivors are provided special direct
support(Incike)
No. of Incike supported 94
Output 5: Assistance to construct
cowsheds
Assistance to construct cowsheds All
Rutsiro
Output 1: 6,808 secondary school
students are financially supported to No. of students paid school fees 21

attend school
Output 2: 23,186 vulnerable genocide
survivors are provided direct support No. of genocide survivors provided
with direct support
383
Output 3: 502 families of vulnerable
genocide survivors are resettled No. of houses rehabilitated
13
Output 4: 1,356 vulnerable genocide
survivors are provided special direct
support(Incike)
No. of Incike supported 7
Output 5: Assistance to construct
cowsheds Assistance to construct cowsheds All
Burera
Output 1: 6,808 secondary school
students are financially supported to
attend school
No. of students paid school fees 74
Output 2: 23,186 vulnerable genocide
survivors are provided direct support No. of genocide survivors provided
with direct support
15
Output 3: 502 families of vulnerable
genocide survivors are resettled No. of houses rehabilitated 0
Output 4: 1,356 vulnerable genocide
survivors are provided special direct
support(Incike)
No. of Incike supported 0
Output 5: Assistance to construct
cowsheds Assistance to construct cowsheds All
Gicumbi
Output 1: 6,808 secondary school
students are financially supported to
attend school
No. of students paid school fees 54
Output 2: 23,186 vulnerable genocide
survivors are provided direct support No. of genocide survivors provided
with direct support
145
Output 3: 502 families of vulnerable
genocide survivors are resettled No. of houses rehabilitated
13
Output 4: 1,356 vulnerable genocide
survivors are provided special direct
support(Incike)
No. of Incike supported 13
Output 5: Assistance to construct
cowsheds Assistance to construct cowsheds All
Musanze
Output 1: 6,808 secondary school
students are financially supported to
attend school
No. of students paid school fees 50
Output 2: 23,186 vulnerable genocide
survivors are provided direct support No. of genocide survivors provided
with direct support 174
Output 3: 502 families of vulnerable
genocide survivors are resettled No. of houses rehabilitated
13

Output 4: 1,356 vulnerable genocide
survivors are provided special direct
support(Incike)
No. of Incike supported 10
Output 5: Assistance to construct
cowsheds Assistance to construct cowsheds All
Rulindo
Output 1: 6,808 secondary school
students are financially supported to
attend school
No. of students paid school fees 99
Output 2: 23,186 vulnerable genocide
survivors are provided direct support No. of genocide survivors provided
with direct support
976
Output 3: 502 families of vulnerable
genocide survivors are resettled No. of houses rehabilitated
13
Output 4: 1,356 vulnerable genocide
survivors are provided special direct
support(Incike)
No. of Incike supported 36
Output 5: Assistance to construct
cowsheds Assistance to construct cowsheds All
Gakenke
Output 1: 6,808 secondary school
students are financially supported to
attend school
No. of students paid school fees 24
Output 2: 23,186 vulnerable genocide
survivors are provided direct support No. of genocide survivors provided
with direct support
83
Output 3: 502 families of vulnerable
genocide survivors are resettled No. of houses rehabilitated
13
Output 4: 1,356 vulnerable genocide
survivors are provided special direct
support(Incike)
No. of Incike supported 7
Output 5: Assistance to construct
cowsheds Assistance to construct cowsheds All
Ruhango
Output 1: 6,808 secondary school
students are financially supported to
attend school
No. of students paid school fees 1,367
Output 2: 23,186 vulnerable genocide
survivors are provided direct support No. of genocide survivors provided
with direct support
1,294
Output 3: 502 families of vulnerable
genocide survivors are resettled No. of houses rehabilitated
18
Output 4: 1,356 vulnerable genocide
survivors are provided special direct
support(Incike)
No. of Incike supported 34
Output 5: Assistance to construct
cowsheds Assistance to construct cowsheds All
Nyarugenge
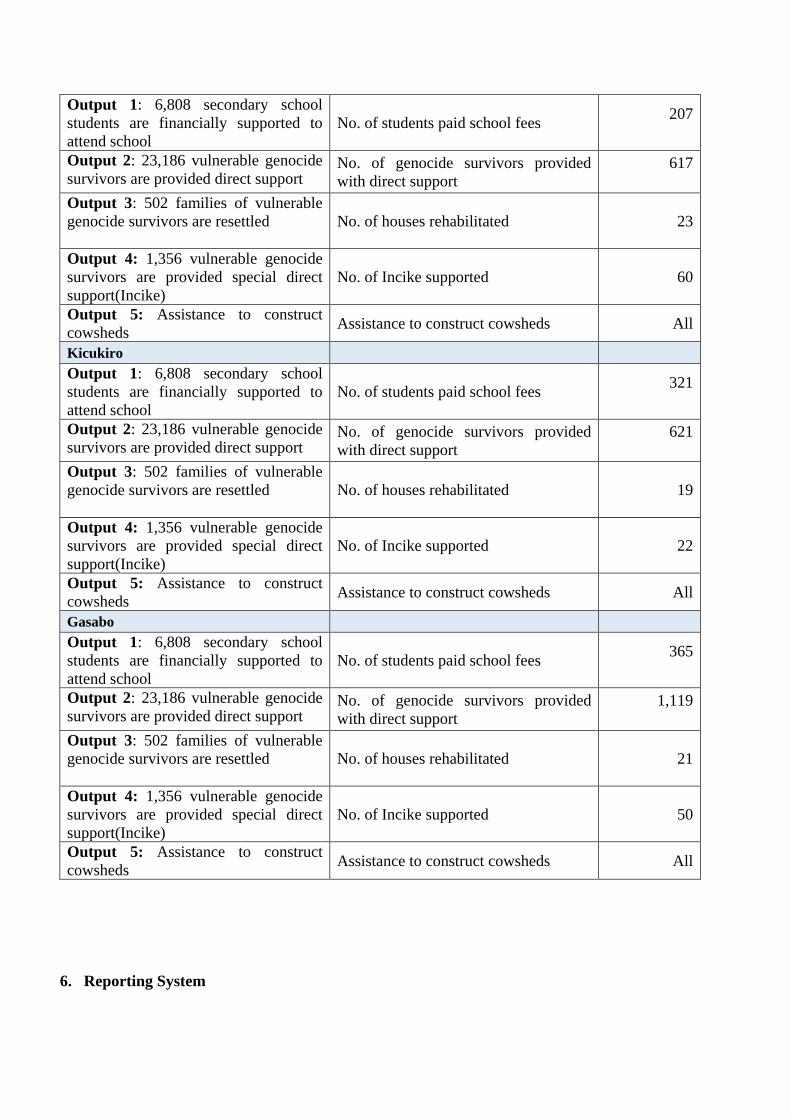
Output 1: 6,808 secondary school
students are financially supported to
attend school
No. of students paid school fees 207
Output 2: 23,186 vulnerable genocide
survivors are provided direct support No. of genocide survivors provided
with direct support
617
Output 3: 502 families of vulnerable
genocide survivors are resettled No. of houses rehabilitated
23
Output 4: 1,356 vulnerable genocide
survivors are provided special direct
support(Incike)
No. of Incike supported 60
Output 5: Assistance to construct
cowsheds Assistance to construct cowsheds All
Kicukiro
Output 1: 6,808 secondary school
students are financially supported to
attend school
No. of students paid school fees 321
Output 2: 23,186 vulnerable genocide
survivors are provided direct support No. of genocide survivors provided
with direct support
621
Output 3: 502 families of vulnerable
genocide survivors are resettled No. of houses rehabilitated
19
Output 4: 1,356 vulnerable genocide
survivors are provided special direct
support(Incike)
No. of Incike supported 22
Output 5: Assistance to construct
cowsheds Assistance to construct cowsheds All
Gasabo
Output 1: 6,808 secondary school
students are financially supported to
attend school
No. of students paid school fees 365
Output 2: 23,186 vulnerable genocide
survivors are provided direct support No. of genocide survivors provided
with direct support
1,119
Output 3: 502 families of vulnerable
genocide survivors are resettled No. of houses rehabilitated
21
Output 4: 1,356 vulnerable genocide
survivors are provided special direct
support(Incike)
No. of Incike supported 50
Output 5: Assistance to construct
cowsheds Assistance to construct cowsheds All
6. Reporting System
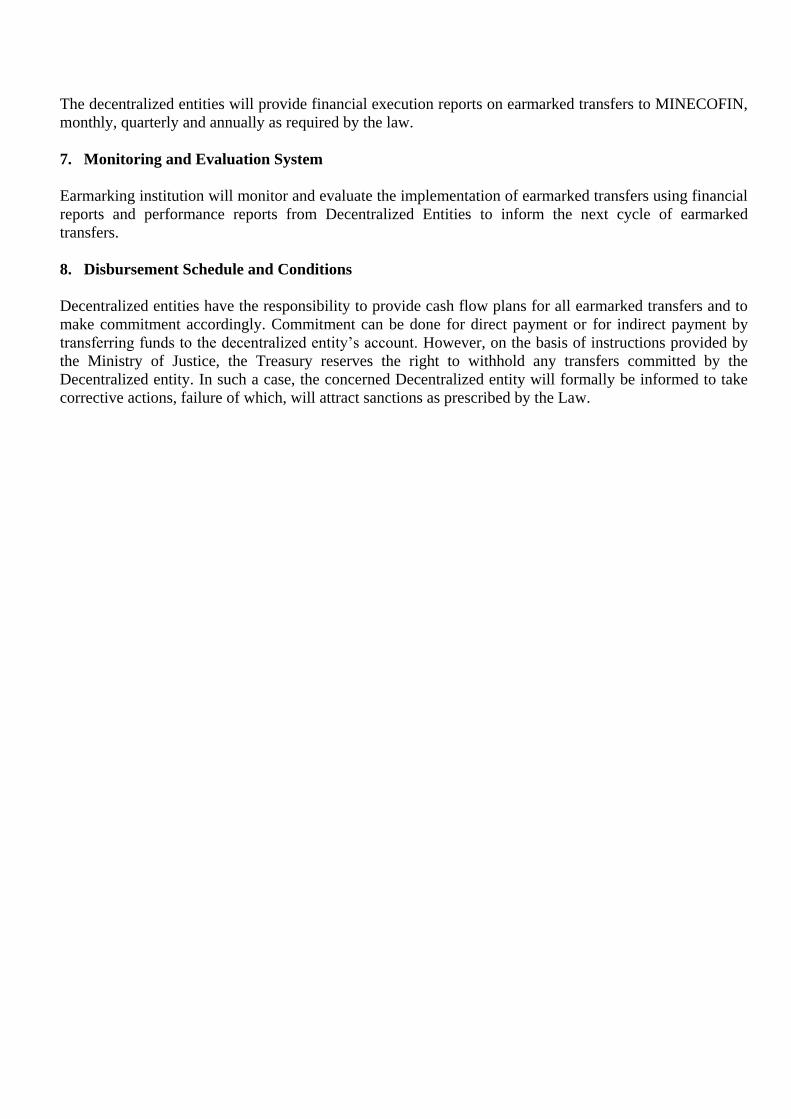
The decentralized entities will provide financial execution reports on earmarked transfers to MINECOFIN,
monthly, quarterly and annually as required by the law.
7. Monitoring and Evaluation System
Earmarking institution will monitor and evaluate the implementation of earmarked transfers using financial
reports and performance reports from Decentralized Entities to inform the next cycle of earmarked
transfers.
8. Disbursement Schedule and Conditions
Decentralized entities have the responsibility to provide cash flow plans for all earmarked transfers and to
make commitment accordingly. Commitment can be done for direct payment or for indirect payment by
transferring funds to the decentralized entity’s account. However, on the basis of instructions provided by
the Ministry of Justice, the Treasury reserves the right to withhold any transfers committed by the
Decentralized entity. In such a case, the concerned Decentralized entity will formally be informed to take
corrective actions, failure of which, will attract sanctions as prescribed by the Law.

12. Ministry of Youth and ICT (MYICT)
1. Objective of the Earmarked Program and Sub-Program
Table 1: Program and Sub Program Objectives
Programs & Subprogram Objectives
Youth, Sports and Culture Promote the values, institutions and expressions of
the Rwandan culture and restore the national heritage
National Employment
Program
To promote youth employment and empowerment for
poverty reduction
Youth Protection and
Promotion
To promote youth employment and empowerment for
poverty reduction
ICT To Enhance access and usage of ICT infrastructures
so as to promote digital literacy and online services
via establishments
2. Transferred Outputs
Table 2: Transferred Outputs
Program & Subprogram Outputs Activities
Youth, Sports and Culture
National Employment
Program
Output 1: Youth
mobilized and benefited
from NEP Interventions:
entrepreneurship, hands
on skills, start toolkits
scheme, access to
finance.
Activity 1:
Mobilize and constitute
a database of youth that
benefited NEP
interventions at sector
levels
Activity 2:
Mobilize youth
graduated from NEP to
form
cooperative/companies
and
acquire start up tool kits
loan facility for self-
employment
Activity 3:
Mobilize and identify
Youth with competitive
and attractive Business
projects and MSMEs
Activity 4: Mobilize Private
Companies and NGOs for
providing more
opportunities internship
and apprenticeship
program
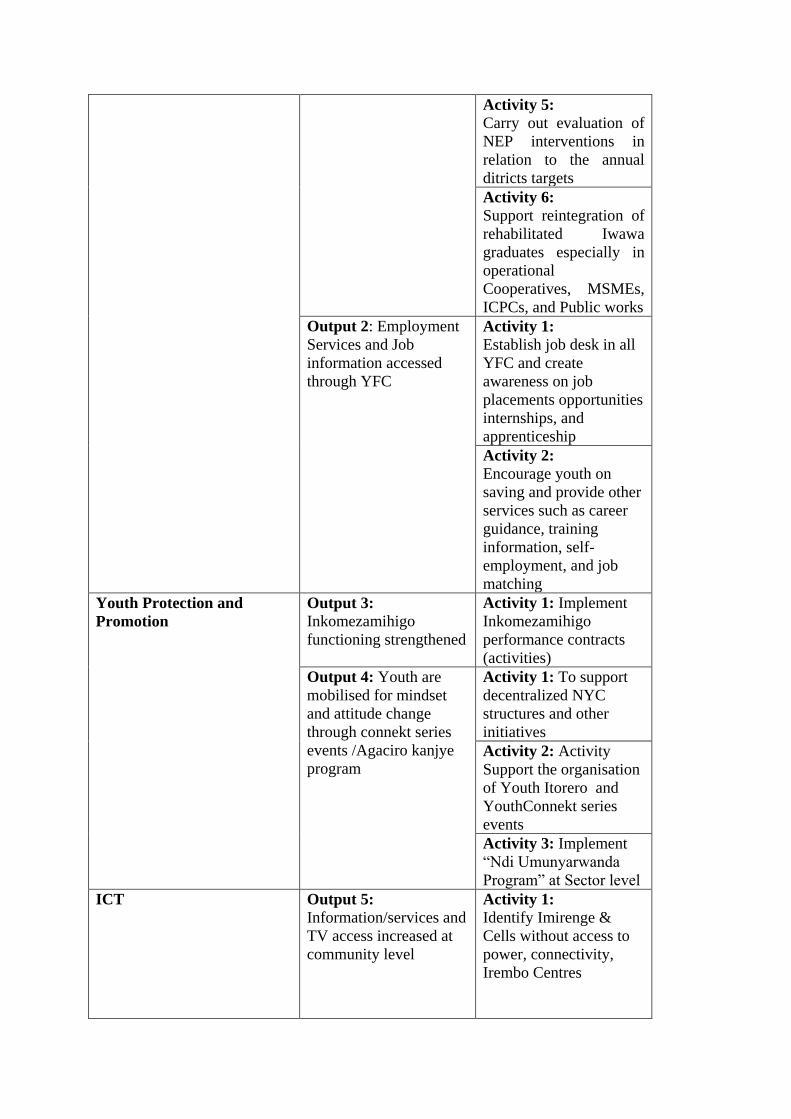
Activity 5:
Carry out evaluation of
NEP interventions in
relation to the annual
ditricts targets
Activity 6:
Support reintegration of
rehabilitated Iwawa
graduates especially in
operational
Cooperatives, MSMEs,
ICPCs, and Public works
Output 2: Employment
Services and Job
information accessed
through YFC
Activity 1:
Establish job desk in all
YFC and create
awareness on job
placements opportunities
internships, and
apprenticeship
Activity 2:
Encourage youth on
saving and provide other
services such as career
guidance, training
information, self-
employment, and job
matching
Youth Protection and
Promotion
Output 3:
Inkomezamihigo
functioning strengthened
Activity 1: Implement
Inkomezamihigo
performance contracts
(activities)
Output 4: Youth are
mobilised for mindset
and attitude change
through connekt series
events /Agaciro kanjye
program
Activity 1: To support
decentralized NYC
structures and other
initiatives
Activity 2: Activity
Support the organisation
of Youth Itorero and
YouthConnekt series
events
Activity 3: Implement
“Ndi Umunyarwanda
Program” at Sector level
ICT
Output 5:
Information/services and
TV access increased at
community level
Activity 1:
Identify Imirenge &
Cells without access to
power, connectivity,
Irembo Centres

Activity 2:
Supply ICT equipments
and accessories to
Imirenge to enable them
using ICT and provide
online services
Activity 3:
Mobilize Citizens about
the use of Rwanda
Online for accessing
online services/Irembo
Centres
Activity 4:
Monitor the
operationalization of
Irembo centres and
online service
3. Allocation Formula by Subprogram and/or Output
Table 3: Allocation by Subprogram and/or Output
Program &
Subprogram
Outputs] Method Amount
Youth,
Sports and
Culture
Youth
Protection
and
Promotion
Output 1: Youth
mobilized and
benefited from NEP
Interventions:
entrepreneurship,
hands on skills, start
toolkits scheme,
access to finance
14 Districts which were not
given fund to support the
reintegration of Iwawa
Graduates in phase one, they
have got higher budget based
on the number of Iwawa
Graduates per Districts.
The budget allocated to
district varies between Frw
4,000,000 to Frw 6,400,000.
159,500,000
Output 2:
Employment
Services and Job
information
accessed through
YFC
2, 400,000 Rwf each District
on the basis of an estimation
of expenditure needs
72,000,000
Youth
Protection
and
Promotion
Output 3:
Inkomezamihigo
functioning
strengthened
1, 200,000 Rwf each District
on the basis of an estimation
of expenditure needs
36,000,000
Output 4: Youth
are mobilised for
3, 300,000 Rwf each District
on the basis of an estimation
99,000,000

mindset and attitude
change through
connekt series
events /Agaciro
kanjye program
of expenditure needs
ICT Output 5:
Information/services
and TV access
increased at
community level
4, 300,000 Rwf each District
on the basis of an estimation
of expenditure needs
129,000,000
4. Allocation Formula by Decentralized Entity
For Output 1:
Activity 1: an equal amount of Frw 900,000 is allocated to each district.
Activity 2, 3, 4, 5: an equal amount of Frw 500,000 per activity is allocated to each district.
Activity 6: an equal amount of Frw 3,000,000 to 1 District, other 13 Districts were allocated
Frw 3,500,000 and the amount of Frw 1,500,000 is allocated to 16 Districts.
For Output 2:
Activity 1: an equal amount of Frw 1,000,000 is allocated to each district.
Activity 2: an equal amount of Frw 1,400,000 is allocated to each district
For Output 3:
Activity 1: an equal amount of Frw 1,200,000 is allocated to each district.
For Output 4:
Activity 1: An equal amount of Frw 800,000 is allocated to each district.
Activity 2: An equal amount of Frw 1,500,000 is allocated to each district.
Activity 3: an equal amount of Frw 1,000,000 is allocated to each district
For Output 5:
Activity 1: An equal amount of Frw 300,000 is allocated to each district.
Activity 2: An equal amount of Frw 3,000,000 is allocated to each district.
Activity 3: an equal amount of Frw 500,000 is allocated to each district
Activity 4: an equal amount of Frw 500,000 is allocated to each district
MYICT allocated those amounts per activity estimating the costs associated to the implementation
of the activities.

178
Table 4: Allocation by Output, Sub-Programs and Program to Decentralized
Entities
Districts Output 1 Output 2 Output 3
Output 4 Output 5 Sub-
Program
Ngoma 5,900,000 2,400,000 1,200,000 3,300,000 4,300,000 17,100,000
Bugesera 4,400,000 2,400,000 1,200,000 3,300,000 4,300,000 15,600,000
Gatsibo 6,400,000 2,400,000 1,200,000 3,300,000 4,300,000 17,600,000
Kayonza 6,400,000 2,400,000 1,200,000 3,300,000 4,300,000 17,600,000
Kirehe 6,400,000 2,400,000 1,200,000 3,300,000 4,300,000 17,600,000
Nyagatare 6,400,000 2,400,000 1,200,000 3,300,000 4,300,000 17,600,000
Rwamagana 6,400,000 2,400,000 1,200,000 3,300,000 4,300,000 17,600,000
Huye 4,400,000 2,400,000 1,200,000 3,300,000 4,300,000 15,600,000
Nyamagabe 6,400,000 2,400,000 1,200,000 3,300,000 4,300,000 17,600,000
Gisagara 4,400,000 2,400,000 1,200,000 3,300,000 4,300,000 15,600,000
Muhanga 4,400,000 2,400,000 1,200,000 3,300,000 4,300,000 15,600,000
Kamonyi 4,400,000 2,400,000 1,200,000 3,300,000 4,300,000 15,600,000
Nyanza 6,400,000 2,400,000 1,200,000 3,300,000 4,300,000 17,600,000
Nyaruguru 6,400,000 2,400,000 1,200,000 3,300,000 4,300,000 17,600,000
Rusizi 4,400,000 2,400,000 1,200,000 3,300,000 4,300,000 15,600,000
Nyabihu 6,400,000 2,400,000 1,200,000 3,300,000 4,300,000 17,600,000
Rubavu 4,400,000 2,400,000 1,200,000 3,300,000 4,300,000 15,600,000
Karongi 4,400,000 2,400,000 1,200,000 3,300,000 4,300,000 15,600,000
Ngororero 4,400,000 2,400,000 1,200,000 3,300,000 4,300,000 15,600,000
Nyamasheke 4,400,000 2,400,000 1,200,000 3,300,000 4,300,000 15,600,000
Rutsiro 4,400,000 2,400,000 1,200,000 3,300,000 4,300,000 15,600,000
Burera 6,400,000 2,400,000 1,200,000 3,300,000 4,300,000 17,600,000
Gicumbi 6,400,000 2,400,000 1,200,000 3,300,000 4,300,000 17,600,000
Musanze 6,400,000 2,400,000 1,200,000 3,300,000 4,300,000 17,600,000
Rulindo 4,400,000 2,400,000 1,200,000 3,300,000 4,300,000 15,600,000
Gakenke 6,400,000 2,400,000 1,200,000 3,300,000 4,300,000 17,600,000
Ruhango 4,400,000 2,400,000 1,200,000 3,300,000 4,300,000 15,600,000
Nyarugenge 4,400,000 2,400,000 1,200,000 3,300,000 4,300,000 15,600,000
Kicukiro 4,400,000 2,400,000 1,200,000 3,300,000 4,300,000 15,600,000
Gasabo 4,400,000 2,400,000 1,200,000 3,300,000 4,300,000 15,600,000
Totals 159,500,000 72,000,000 36,000,000 99,000,000 129,000,000 495,500,000
5. Performance Targets and Indicators
Table 5: Performance Indicators by Decentralized Budget Agency for Output
District / Outputs Performance Indicator Annual
Target
Ngoma
Output 1: Youth mobilized and benefited
from NEP Interventions: entrepreneurship,
hands on skills, start toolkits scheme,
access to finance.
Number of Youth startups &
early growing MSMEs accessing
finance through BDF products
( Y3: 1000)
Portfolio ratio by amount of loan
1,000

179
provided to youth MSMEs (60%)
% of youth graduated from MST,
IBT, RRT supported to access
tool kits scheme (Y3:60%)
Output 2: Employment Services and Job
information accessed through YFC
% YFC’s Job Desk
operationalized 100%
Output 3: Inkomezamihigo functioning
strengthened Quarterly reports produced
Quarterly
reports
produced
Output 4: Youth are mobilised for mindset
and attitude change through connekt series
events /Agaciro kanjye program
Number of new youth
participated in Itorero
Inkomezamihigo and those
reached by “Ndi Umunyarwanda
( Y3: Itorero: 1000 Ndi
Munyarwanda: 4,000)
5,000
Output 5: Information/services and TV
access increased at community level
Number of knowledge
hubs/Irembo Centres
operationalized
1 per Sector
Bugesera
Output 1: Youth mobilized and benefited
from NEP Interventions: entrepreneurship,
hands on skills, start toolkits scheme,
access to finance.
Number of Youth startups &
early growing MSMEs accessing
finance through BDF products
( Y3: 1000)
Portfolio ratio by amount of loan
provided to youth MSMEs (60%)
% of youth graduated from MST,
IBT, RRT supported to access
tool kits scheme (Y3:60%)
1,000
Output 2: Employment Services and Job
information accessed through YFC
% YFC’s Job Desk
operationalized 100%
Output 3: Inkomezamihigo functioning
strengthened Quarterly reports produced
Quarterly
reports
produced
Output 4: Youth are mobilised for mindset
and attitude change through connekt series
events /Agaciro kanjye program
Number of new youth
participated in Itorero
Inkomezamihigo and those
reached by “Ndi Umunyarwanda
( Y3: Itorero: 1000 Ndi
Munyarwanda: 4,000)
5,000
Output 5: Information/services and TV
access increased at community level
Number of knowledge
hubs/Irembo Centres
operationalized
1 per Sector
Gatsibo
Output 1: Youth mobilized and benefited
from NEP Interventions: entrepreneurship,
hands on skills, start toolkits scheme,
access to finance.
Number of Youth startups &
early growing MSMEs accessing
finance through BDF products
( Y3: 1000)
Portfolio ratio by amount of loan
1,000

180
provided to youth MSMEs (60%)
% of youth graduated from MST,
IBT, RRT supported to access
tool kits scheme (Y3:60%)
Output 2: Employment Services and Job
information accessed through YFC
% YFC’s Job Desk
operationalized 100%
Output 3: Inkomezamihigo functioning
strengthened Quarterly reports produced
Quarterly
reports
produced
Output 4: Youth are mobilised for mindset
and attitude change through connekt series
events /Agaciro kanjye program
Number of new youth
participated in Itorero
Inkomezamihigo and those
reached by “Ndi Umunyarwanda
( Y3: Itorero: 1000 Ndi
Munyarwanda: 4,000)
5,000
Output 5: Information/services and TV
access increased at community level
Number of knowledge
hubs/Irembo Centres
operationalized
1 per Sector
Kayonza
Output 1: Youth mobilized and benefited
from NEP Interventions: entrepreneurship,
hands on skills, start toolkits scheme,
access to finance.
Number of Youth startups &
early growing MSMEs accessing
finance through BDF products
( Y3: 1000)
Portfolio ratio by amount of loan
provided to youth MSMEs (60%)
% of youth graduated from MST,
IBT, RRT supported to access
tool kits scheme (Y3:60%)
1,000
Output 2: Employment Services and Job
information accessed through YFC
% YFC’s Job Desk
operationalized 100%
Output 3: Inkomezamihigo functioning
strengthened Quarterly reports produced
Quarterly
reports
produced
Output 4: Youth are mobilised for mindset
and attitude change through connekt series
events /Agaciro kanjye program
Number of new youth
participated in Itorero
Inkomezamihigo and those
reached by “Ndi Umunyarwanda
( Y3: Itorero: 1000 Ndi
Munyarwanda: 4,000)
5,000
Output 5: Information/services and TV
access increased at community level
Number of knowledge
hubs/Irembo Centres
operationalized
1 per Sector
Kirehe
Output 1: Youth mobilized and benefited
from NEP Interventions: entrepreneurship,
hands on skills, start toolkits scheme,
access to finance.
Number of Youth startups &
early growing MSMEs accessing
finance through BDF products
( Y3: 1000)
1,000

181
Portfolio ratio by amount of loan
provided to youth MSMEs (60%)
% of youth graduated from MST,
IBT, RRT supported to access
tool kits scheme (Y3:60%)
Output 2: Employment Services and Job
information accessed through YFC
% YFC’s Job Desk
operationalized 100%
Output 3: Inkomezamihigo functioning
strengthened Quarterly reports produced
Quarterly
reports
produced
Output 4: Youth are mobilised for mindset
and attitude change through connekt series
events /Agaciro kanjye program
Number of new youth
participated in Itorero
Inkomezamihigo and those
reached by “Ndi Umunyarwanda
( Y3: Itorero: 1000 Ndi
Munyarwanda: 4,000)
5,000
Output 5: Information/services and TV
access increased at community level
Number of knowledge
hubs/Irembo Centres
operationalized
1 per Sector
Nyagatare
Output 1: Youth mobilized and benefited
from NEP Interventions: entrepreneurship,
hands on skills, start toolkits scheme,
access to finance.
Number of Youth startups &
early growing MSMEs accessing
finance through BDF products
( Y3: 1000)
Portfolio ratio by amount of loan
provided to youth MSMEs (60%)
% of youth graduated from MST,
IBT, RRT supported to access
tool kits scheme (Y3:60%)
1,000
Output 2: Employment Services and Job
information accessed through YFC
% YFC’s Job Desk
operationalized 100%
Output 3: Inkomezamihigo functioning
strengthened Quarterly reports produced
Quarterly
reports
produced
Output 4: Youth are mobilised for mindset
and attitude change through connekt series
events /Agaciro kanjye program
Number of new youth
participated in Itorero
Inkomezamihigo and those
reached by “Ndi Umunyarwanda
( Y3: Itorero: 1000 Ndi
Munyarwanda: 4,000)
5,000
Output 5: Information/services and TV
access increased at community level
Number of knowledge
hubs/Irembo Centres
operationalized
1 per Sector
Rwamagana
Output 1: Youth mobilized and benefited
from NEP Interventions: entrepreneurship,
hands on skills, start toolkits scheme,
access to finance.
Number of Youth startups &
early growing MSMEs accessing
finance through BDF products
( Y3: 1000)
1,000
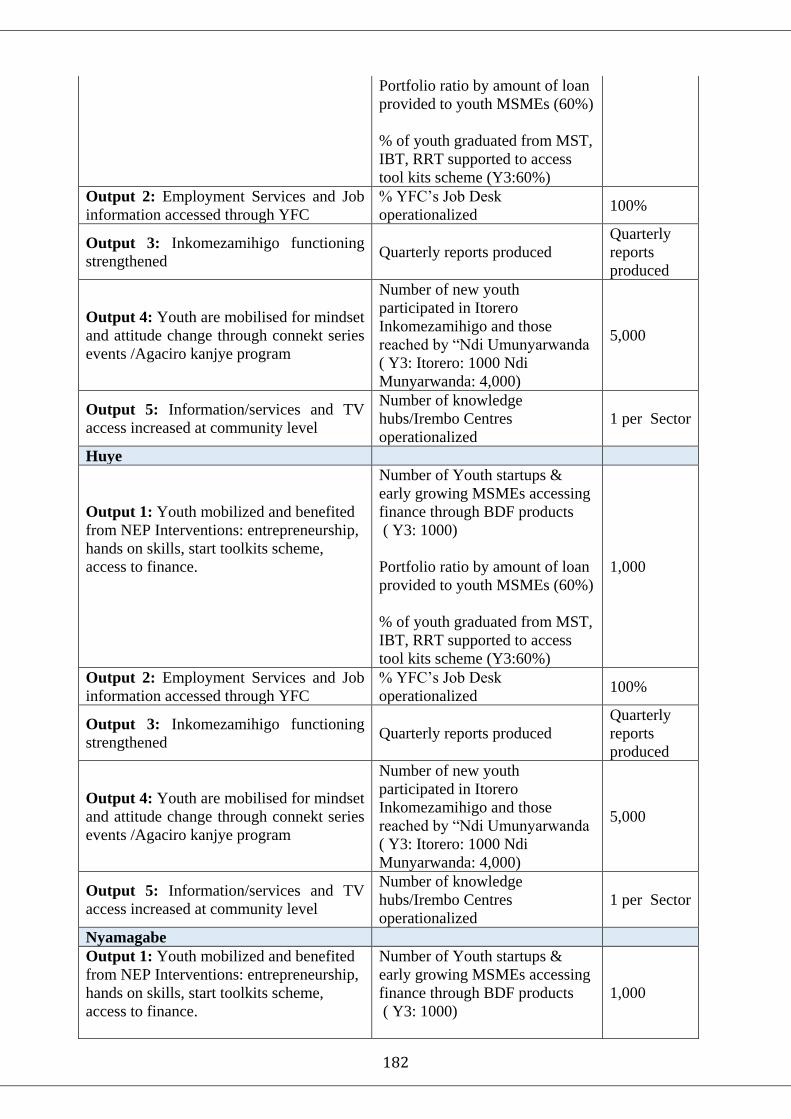
182
Portfolio ratio by amount of loan
provided to youth MSMEs (60%)
% of youth graduated from MST,
IBT, RRT supported to access
tool kits scheme (Y3:60%)
Output 2: Employment Services and Job
information accessed through YFC
% YFC’s Job Desk
operationalized 100%
Output 3: Inkomezamihigo functioning
strengthened Quarterly reports produced
Quarterly
reports
produced
Output 4: Youth are mobilised for mindset
and attitude change through connekt series
events /Agaciro kanjye program
Number of new youth
participated in Itorero
Inkomezamihigo and those
reached by “Ndi Umunyarwanda
( Y3: Itorero: 1000 Ndi
Munyarwanda: 4,000)
5,000
Output 5: Information/services and TV
access increased at community level
Number of knowledge
hubs/Irembo Centres
operationalized
1 per Sector
Huye
Output 1: Youth mobilized and benefited
from NEP Interventions: entrepreneurship,
hands on skills, start toolkits scheme,
access to finance.
Number of Youth startups &
early growing MSMEs accessing
finance through BDF products
( Y3: 1000)
Portfolio ratio by amount of loan
provided to youth MSMEs (60%)
% of youth graduated from MST,
IBT, RRT supported to access
tool kits scheme (Y3:60%)
1,000
Output 2: Employment Services and Job
information accessed through YFC
% YFC’s Job Desk
operationalized 100%
Output 3: Inkomezamihigo functioning
strengthened Quarterly reports produced
Quarterly
reports
produced
Output 4: Youth are mobilised for mindset
and attitude change through connekt series
events /Agaciro kanjye program
Number of new youth
participated in Itorero
Inkomezamihigo and those
reached by “Ndi Umunyarwanda
( Y3: Itorero: 1000 Ndi
Munyarwanda: 4,000)
5,000
Output 5: Information/services and TV
access increased at community level
Number of knowledge
hubs/Irembo Centres
operationalized
1 per Sector
Nyamagabe
Output 1: Youth mobilized and benefited
from NEP Interventions: entrepreneurship,
hands on skills, start toolkits scheme,
access to finance.
Number of Youth startups &
early growing MSMEs accessing
finance through BDF products
( Y3: 1000)
1,000
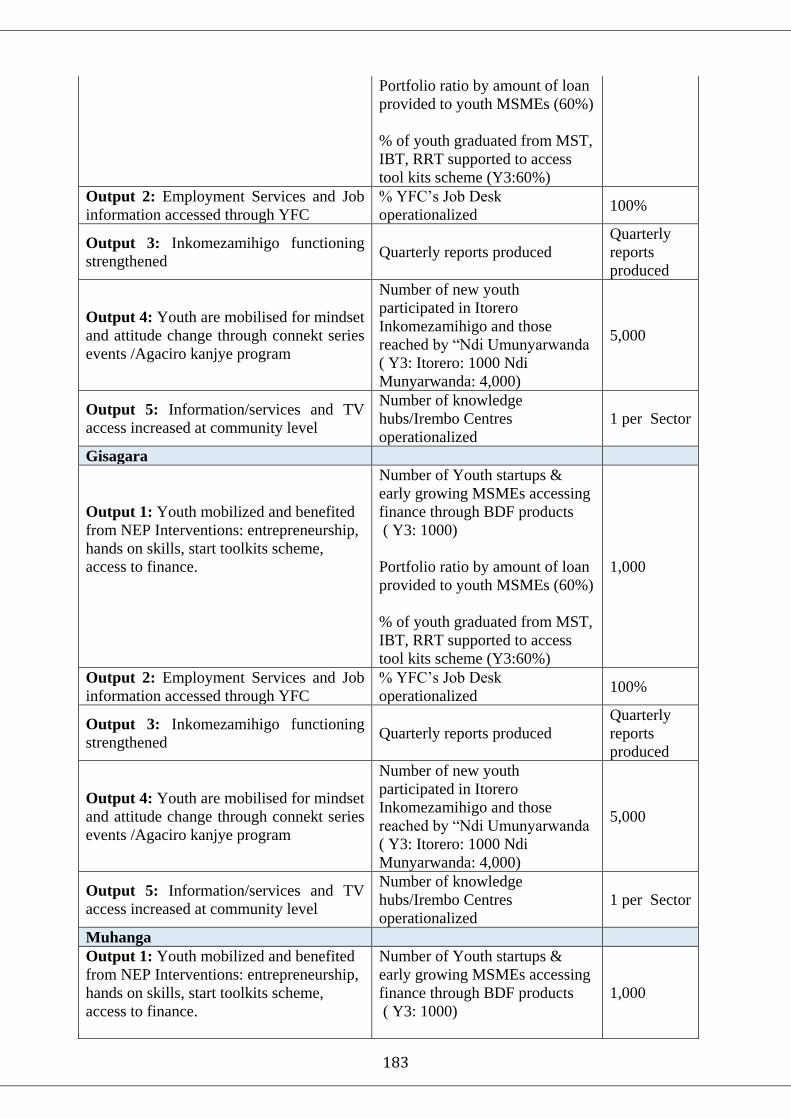
183
Portfolio ratio by amount of loan
provided to youth MSMEs (60%)
% of youth graduated from MST,
IBT, RRT supported to access
tool kits scheme (Y3:60%)
Output 2: Employment Services and Job
information accessed through YFC
% YFC’s Job Desk
operationalized 100%
Output 3: Inkomezamihigo functioning
strengthened Quarterly reports produced
Quarterly
reports
produced
Output 4: Youth are mobilised for mindset
and attitude change through connekt series
events /Agaciro kanjye program
Number of new youth
participated in Itorero
Inkomezamihigo and those
reached by “Ndi Umunyarwanda
( Y3: Itorero: 1000 Ndi
Munyarwanda: 4,000)
5,000
Output 5: Information/services and TV
access increased at community level
Number of knowledge
hubs/Irembo Centres
operationalized
1 per Sector
Gisagara
Output 1: Youth mobilized and benefited
from NEP Interventions: entrepreneurship,
hands on skills, start toolkits scheme,
access to finance.
Number of Youth startups &
early growing MSMEs accessing
finance through BDF products
( Y3: 1000)
Portfolio ratio by amount of loan
provided to youth MSMEs (60%)
% of youth graduated from MST,
IBT, RRT supported to access
tool kits scheme (Y3:60%)
1,000
Output 2: Employment Services and Job
information accessed through YFC
% YFC’s Job Desk
operationalized 100%
Output 3: Inkomezamihigo functioning
strengthened Quarterly reports produced
Quarterly
reports
produced
Output 4: Youth are mobilised for mindset
and attitude change through connekt series
events /Agaciro kanjye program
Number of new youth
participated in Itorero
Inkomezamihigo and those
reached by “Ndi Umunyarwanda
( Y3: Itorero: 1000 Ndi
Munyarwanda: 4,000)
5,000
Output 5: Information/services and TV
access increased at community level
Number of knowledge
hubs/Irembo Centres
operationalized
1 per Sector
Muhanga
Output 1: Youth mobilized and benefited
from NEP Interventions: entrepreneurship,
hands on skills, start toolkits scheme,
access to finance.
Number of Youth startups &
early growing MSMEs accessing
finance through BDF products
( Y3: 1000)
1,000
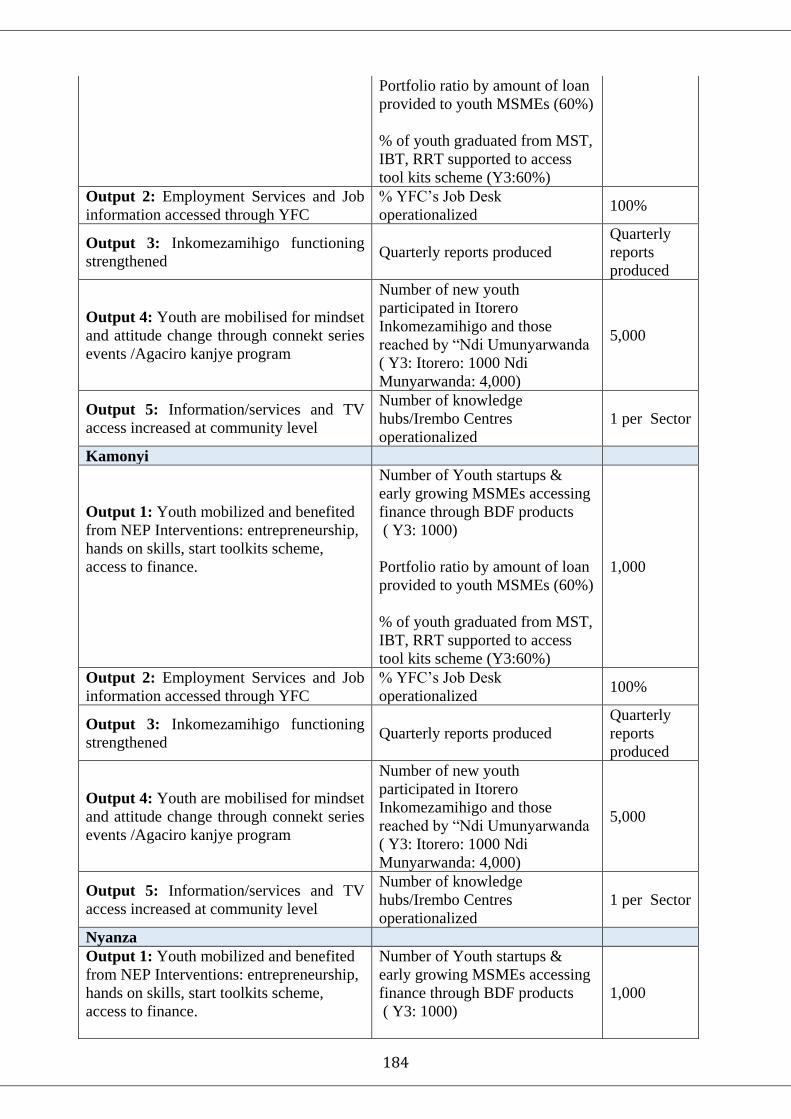
184
Portfolio ratio by amount of loan
provided to youth MSMEs (60%)
% of youth graduated from MST,
IBT, RRT supported to access
tool kits scheme (Y3:60%)
Output 2: Employment Services and Job
information accessed through YFC
% YFC’s Job Desk
operationalized 100%
Output 3: Inkomezamihigo functioning
strengthened Quarterly reports produced
Quarterly
reports
produced
Output 4: Youth are mobilised for mindset
and attitude change through connekt series
events /Agaciro kanjye program
Number of new youth
participated in Itorero
Inkomezamihigo and those
reached by “Ndi Umunyarwanda
( Y3: Itorero: 1000 Ndi
Munyarwanda: 4,000)
5,000
Output 5: Information/services and TV
access increased at community level
Number of knowledge
hubs/Irembo Centres
operationalized
1 per Sector
Kamonyi
Output 1: Youth mobilized and benefited
from NEP Interventions: entrepreneurship,
hands on skills, start toolkits scheme,
access to finance.
Number of Youth startups &
early growing MSMEs accessing
finance through BDF products
( Y3: 1000)
Portfolio ratio by amount of loan
provided to youth MSMEs (60%)
% of youth graduated from MST,
IBT, RRT supported to access
tool kits scheme (Y3:60%)
1,000
Output 2: Employment Services and Job
information accessed through YFC
% YFC’s Job Desk
operationalized 100%
Output 3: Inkomezamihigo functioning
strengthened Quarterly reports produced
Quarterly
reports
produced
Output 4: Youth are mobilised for mindset
and attitude change through connekt series
events /Agaciro kanjye program
Number of new youth
participated in Itorero
Inkomezamihigo and those
reached by “Ndi Umunyarwanda
( Y3: Itorero: 1000 Ndi
Munyarwanda: 4,000)
5,000
Output 5: Information/services and TV
access increased at community level
Number of knowledge
hubs/Irembo Centres
operationalized
1 per Sector
Nyanza
Output 1: Youth mobilized and benefited
from NEP Interventions: entrepreneurship,
hands on skills, start toolkits scheme,
access to finance.
Number of Youth startups &
early growing MSMEs accessing
finance through BDF products
( Y3: 1000)
1,000

185
Portfolio ratio by amount of loan
provided to youth MSMEs (60%)
% of youth graduated from MST,
IBT, RRT supported to access
tool kits scheme (Y3:60%)
Output 2: Employment Services and Job
information accessed through YFC
% YFC’s Job Desk
operationalized 100%
Output 3: Inkomezamihigo functioning
strengthened Quarterly reports produced
Quarterly
reports
produced
Output 4: Youth are mobilised for mindset
and attitude change through connekt series
events /Agaciro kanjye program
Number of new youth
participated in Itorero
Inkomezamihigo and those
reached by “Ndi Umunyarwanda
( Y3: Itorero: 1000 Ndi
Munyarwanda: 4,000)
5,000
Output 5: Information/services and TV
access increased at community level
Number of knowledge
hubs/Irembo Centres
operationalized
1 per Sector
Nyaruguru
Output 1: Youth mobilized and benefited
from NEP Interventions: entrepreneurship,
hands on skills, start toolkits scheme,
access to finance.
Number of Youth startups &
early growing MSMEs accessing
finance through BDF products
( Y3: 1000)
Portfolio ratio by amount of loan
provided to youth MSMEs (60%)
% of youth graduated from MST,
IBT, RRT supported to access
tool kits scheme (Y3:60%)
1,000
Output 2: Employment Services and Job
information accessed through YFC
% YFC’s Job Desk
operationalized 100%
Output 3: Inkomezamihigo functioning
strengthened Quarterly reports produced
Quarterly
reports
produced
Output 4: Youth are mobilised for mindset
and attitude change through connekt series
events /Agaciro kanjye program
Number of new youth
participated in Itorero
Inkomezamihigo and those
reached by “Ndi Umunyarwanda
( Y3: Itorero: 1000 Ndi
Munyarwanda: 4,000)
5,000
Output 5: Information/services and TV
access increased at community level
Number of knowledge
hubs/Irembo Centres
operationalized
1 per Sector
Rusizi
Output 1: Youth mobilized and benefited
from NEP Interventions: entrepreneurship,
hands on skills, start toolkits scheme,
access to finance.
Number of Youth startups &
early growing MSMEs accessing
finance through BDF products
( Y3: 1000)
1,000

186
Portfolio ratio by amount of loan
provided to youth MSMEs (60%)
% of youth graduated from MST,
IBT, RRT supported to access
tool kits scheme (Y3:60%)
Output 2: Employment Services and Job
information accessed through YFC
% YFC’s Job Desk
operationalized 100%
Output 3: Inkomezamihigo functioning
strengthened Quarterly reports produced
Quarterly
reports
produced
Output 4: Youth are mobilised for mindset
and attitude change through connekt series
events /Agaciro kanjye program
Number of new youth
participated in Itorero
Inkomezamihigo and those
reached by “Ndi Umunyarwanda
( Y3: Itorero: 1000 Ndi
Munyarwanda: 4,000)
5,000
Output 5: Information/services and TV
access increased at community level
Number of knowledge
hubs/Irembo Centres
operationalized
1 per Sector
Nyabihu
Output 1: Youth mobilized and benefited
from NEP Interventions: entrepreneurship,
hands on skills, start toolkits scheme,
access to finance.
Number of Youth startups &
early growing MSMEs accessing
finance through BDF products
( Y3: 1000)
Portfolio ratio by amount of loan
provided to youth MSMEs (60%)
% of youth graduated from MST,
IBT, RRT supported to access
tool kits scheme (Y3:60%)
1,000
Output 2: Employment Services and Job
information accessed through YFC
% YFC’s Job Desk
operationalized 100%
Output 3: Inkomezamihigo functioning
strengthened Quarterly reports produced
Quarterly
reports
produced
Output 4: Youth are mobilised for mindset
and attitude change through connekt series
events /Agaciro kanjye program
Number of new youth
participated in Itorero
Inkomezamihigo and those
reached by “Ndi Umunyarwanda
( Y3: Itorero: 1000 Ndi
Munyarwanda: 4,000)
5,000
Output 5: Information/services and TV
access increased at community level
Number of knowledge
hubs/Irembo Centres
operationalized
1 per Sector
Rubavu
Output 1: Youth mobilized and benefited
from NEP Interventions: entrepreneurship,
hands on skills, start toolkits scheme,
access to finance.
Number of Youth startups &
early growing MSMEs accessing
finance through BDF products
( Y3: 1000)
1,000

187
Portfolio ratio by amount of loan
provided to youth MSMEs (60%)
% of youth graduated from MST,
IBT, RRT supported to access
tool kits scheme (Y3:60%)
Output 2: Employment Services and Job
information accessed through YFC
% YFC’s Job Desk
operationalized 100%
Output 3: Inkomezamihigo functioning
strengthened Quarterly reports produced
Quarterly
reports
produced
Output 4: Youth are mobilised for mindset
and attitude change through connekt series
events /Agaciro kanjye program
Number of new youth
participated in Itorero
Inkomezamihigo and those
reached by “Ndi Umunyarwanda
( Y3: Itorero: 1000 Ndi
Munyarwanda: 4,000)
5,000
Output 5: Information/services and TV
access increased at community level
Number of knowledge
hubs/Irembo Centres
operationalized
1 per Sector
Karongi
Output 1: Youth mobilized and benefited
from NEP Interventions: entrepreneurship,
hands on skills, start toolkits scheme,
access to finance.
Number of Youth startups &
early growing MSMEs accessing
finance through BDF products
( Y3: 1000)
Portfolio ratio by amount of loan
provided to youth MSMEs (60%)
% of youth graduated from MST,
IBT, RRT supported to access
tool kits scheme (Y3:60%)
1,000
Output 2: Employment Services and Job
information accessed through YFC
% YFC’s Job Desk
operationalized 100%
Output 3: Inkomezamihigo functioning
strengthened Quarterly reports produced
Quarterly
reports
produced
Output 4: Youth are mobilised for mindset
and attitude change through connekt series
events /Agaciro kanjye program
Number of new youth
participated in Itorero
Inkomezamihigo and those
reached by “Ndi Umunyarwanda
( Y3: Itorero: 1000 Ndi
Munyarwanda: 4,000)
5,000
Output 5: Information/services and TV
access increased at community level
Number of knowledge
hubs/Irembo Centres
operationalized
1 per Sector
Ngororero
Output 1: Youth mobilized and benefited
from NEP Interventions: entrepreneurship,
hands on skills, start toolkits scheme,
access to finance.
Number of Youth startups &
early growing MSMEs accessing
finance through BDF products
( Y3: 1000)
1,000

188
Portfolio ratio by amount of loan
provided to youth MSMEs (60%)
% of youth graduated from MST,
IBT, RRT supported to access
tool kits scheme (Y3:60%)
Output 2: Employment Services and Job
information accessed through YFC
% YFC’s Job Desk
operationalized 100%
Output 3: Inkomezamihigo functioning
strengthened Quarterly reports produced
Quarterly
reports
produced
Output 4: Youth are mobilised for mindset
and attitude change through connekt series
events /Agaciro kanjye program
Number of new youth
participated in Itorero
Inkomezamihigo and those
reached by “Ndi Umunyarwanda
( Y3: Itorero: 1000 Ndi
Munyarwanda: 4,000)
5,000
Output 5: Information/services and TV
access increased at community level
Number of knowledge
hubs/Irembo Centres
operationalized
1 per Sector
Nyamasheke
Output 1: Youth mobilized and benefited
from NEP Interventions: entrepreneurship,
hands on skills, start toolkits scheme,
access to finance.
Number of Youth startups &
early growing MSMEs accessing
finance through BDF products
( Y3: 1000)
Portfolio ratio by amount of loan
provided to youth MSMEs (60%)
% of youth graduated from MST,
IBT, RRT supported to access
tool kits scheme (Y3:60%)
1,000
Output 2: Employment Services and Job
information accessed through YFC
% YFC’s Job Desk
operationalized 100%
Output 3: Inkomezamihigo functioning
strengthened Quarterly reports produced
Quarterly
reports
produced
Output 4: Youth are mobilised for mindset
and attitude change through connekt series
events /Agaciro kanjye program
Number of new youth
participated in Itorero
Inkomezamihigo and those
reached by “Ndi Umunyarwanda
( Y3: Itorero: 1000 Ndi
Munyarwanda: 4,000)
5,000
Output 5: Information/services and TV
access increased at community level
Number of knowledge
hubs/Irembo Centres
operationalized
1 per Sector
Rutsiro
Output 1: Youth mobilized and benefited
from NEP Interventions: entrepreneurship,
hands on skills, start toolkits scheme,
access to finance.
Number of Youth startups &
early growing MSMEs accessing
finance through BDF products
( Y3: 1000)
1,000
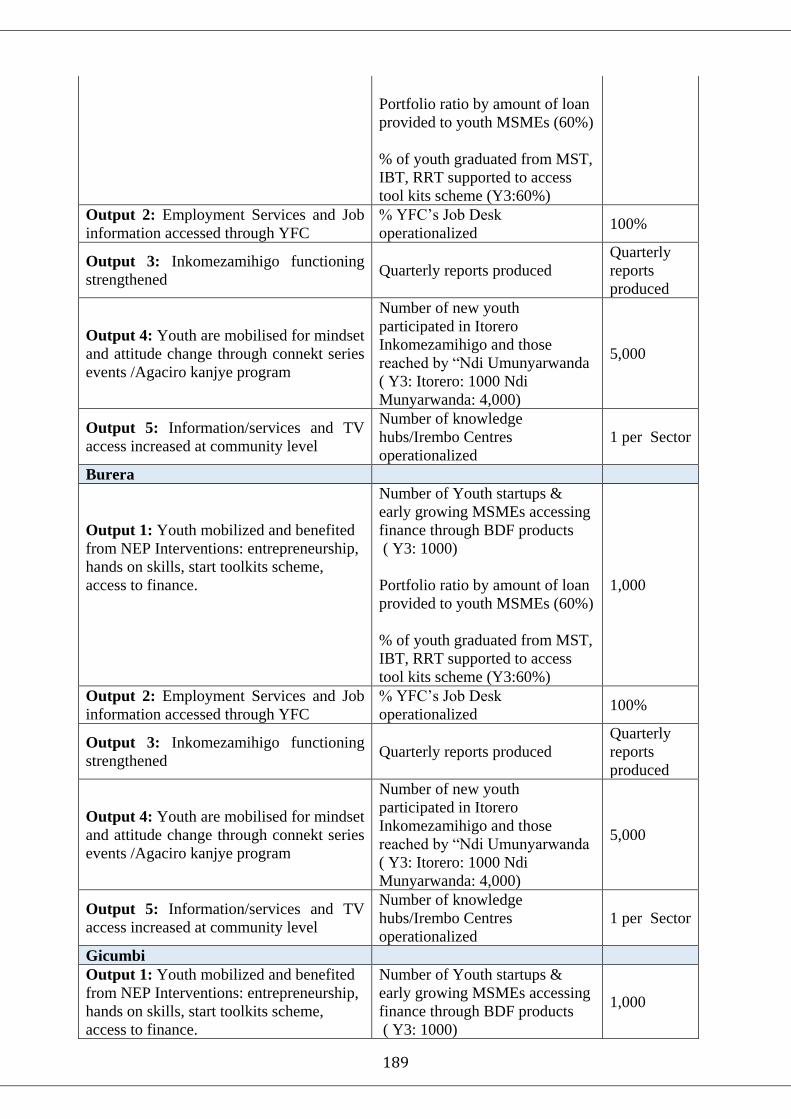
189
Portfolio ratio by amount of loan
provided to youth MSMEs (60%)
% of youth graduated from MST,
IBT, RRT supported to access
tool kits scheme (Y3:60%)
Output 2: Employment Services and Job
information accessed through YFC
% YFC’s Job Desk
operationalized 100%
Output 3: Inkomezamihigo functioning
strengthened Quarterly reports produced
Quarterly
reports
produced
Output 4: Youth are mobilised for mindset
and attitude change through connekt series
events /Agaciro kanjye program
Number of new youth
participated in Itorero
Inkomezamihigo and those
reached by “Ndi Umunyarwanda
( Y3: Itorero: 1000 Ndi
Munyarwanda: 4,000)
5,000
Output 5: Information/services and TV
access increased at community level
Number of knowledge
hubs/Irembo Centres
operationalized
1 per Sector
Burera
Output 1: Youth mobilized and benefited
from NEP Interventions: entrepreneurship,
hands on skills, start toolkits scheme,
access to finance.
Number of Youth startups &
early growing MSMEs accessing
finance through BDF products
( Y3: 1000)
Portfolio ratio by amount of loan
provided to youth MSMEs (60%)
% of youth graduated from MST,
IBT, RRT supported to access
tool kits scheme (Y3:60%)
1,000
Output 2: Employment Services and Job
information accessed through YFC
% YFC’s Job Desk
operationalized 100%
Output 3: Inkomezamihigo functioning
strengthened Quarterly reports produced
Quarterly
reports
produced
Output 4: Youth are mobilised for mindset
and attitude change through connekt series
events /Agaciro kanjye program
Number of new youth
participated in Itorero
Inkomezamihigo and those
reached by “Ndi Umunyarwanda
( Y3: Itorero: 1000 Ndi
Munyarwanda: 4,000)
5,000
Output 5: Information/services and TV
access increased at community level
Number of knowledge
hubs/Irembo Centres
operationalized
1 per Sector
Gicumbi
Output 1: Youth mobilized and benefited
from NEP Interventions: entrepreneurship,
hands on skills, start toolkits scheme,
access to finance.
Number of Youth startups &
early growing MSMEs accessing
finance through BDF products
( Y3: 1000)
1,000

190
Portfolio ratio by amount of loan
provided to youth MSMEs (60%)
% of youth graduated from MST,
IBT, RRT supported to access
tool kits scheme (Y3:60%)
Output 2: Employment Services and Job
information accessed through YFC
% YFC’s Job Desk
operationalized 100%
Output 3: Inkomezamihigo functioning
strengthened Quarterly reports produced
Quarterly
reports
produced
Output 4: Youth are mobilised for mindset
and attitude change through connekt series
events /Agaciro kanjye program
Number of new youth
participated in Itorero
Inkomezamihigo and those
reached by “Ndi Umunyarwanda
( Y3: Itorero: 1000 Ndi
Munyarwanda: 4,000)
5,000
Output 5: Information/services and TV
access increased at community level
Number of knowledge
hubs/Irembo Centres
operationalized
1 per Sector
Musanze
Output 1: Youth mobilized and benefited
from NEP Interventions: entrepreneurship,
hands on skills, start toolkits scheme,
access to finance.
Number of Youth startups &
early growing MSMEs accessing
finance through BDF products
( Y3: 1000)
Portfolio ratio by amount of loan
provided to youth MSMEs (60%)
% of youth graduated from MST,
IBT, RRT supported to access
tool kits scheme (Y3:60%)
1,000
Output 2: Employment Services and Job
information accessed through YFC
% YFC’s Job Desk
operationalized 100%
Output 3: Inkomezamihigo functioning
strengthened Quarterly reports produced
Quarterly
reports
produced
Output 4: Youth are mobilised for mindset
and attitude change through connekt series
events /Agaciro kanjye program
Number of new youth
participated in Itorero
Inkomezamihigo and those
reached by “Ndi Umunyarwanda
( Y3: Itorero: 1000 Ndi
Munyarwanda: 4,000)
5,000
Output 5: Information/services and TV
access increased at community level
Number of knowledge
hubs/Irembo Centres
operationalized
1 per Sector
Rulindo
Output 1: Youth mobilized and benefited
from NEP Interventions: entrepreneurship,
Number of Youth startups &
early growing MSMEs accessing 1,000

191
hands on skills, start toolkits scheme,
access to finance.
finance through BDF products
( Y3: 1000)
Portfolio ratio by amount of loan
provided to youth MSMEs (60%)
% of youth graduated from MST,
IBT, RRT supported to access
tool kits scheme (Y3:60%)
Output 2: Employment Services and Job
information accessed through YFC
% YFC’s Job Desk
operationalized 100%
Output 3: Inkomezamihigo functioning
strengthened Quarterly reports produced
Quarterly
reports
produced
Output 4: Youth are mobilised for mindset
and attitude change through connekt series
events /Agaciro kanjye program
Number of new youth
participated in Itorero
Inkomezamihigo and those
reached by “Ndi Umunyarwanda
( Y3: Itorero: 1000 Ndi
Munyarwanda: 4,000)
5,000
Output 5: Information/services and TV
access increased at community level
Number of knowledge
hubs/Irembo Centres
operationalized
1 per Sector
Gakenke
Output 1: Youth mobilized and benefited
from NEP Interventions: entrepreneurship,
hands on skills, start toolkits scheme,
access to finance.
Number of Youth startups &
early growing MSMEs accessing
finance through BDF products
( Y3: 1000)
Portfolio ratio by amount of loan
provided to youth MSMEs (60%)
% of youth graduated from MST,
IBT, RRT supported to access
tool kits scheme (Y3:60%)
1,000
Output 2: Employment Services and Job
information accessed through YFC
% YFC’s Job Desk
operationalized 100%
Output 3: Inkomezamihigo functioning
strengthened Quarterly reports produced
Quarterly
reports
produced
Output 4: Youth are mobilised for mindset
and attitude change through connekt series
events /Agaciro kanjye program
Number of new youth
participated in Itorero
Inkomezamihigo and those
reached by “Ndi Umunyarwanda
( Y3: Itorero: 1000 Ndi
Munyarwanda: 4,000)
5,000
Output 5: Information/services and TV
access increased at community level
Number of knowledge
hubs/Irembo Centres
operationalized
1 per Sector
Ruhango
Output 1: Youth mobilized and benefited
from NEP Interventions: entrepreneurship,
Number of Youth startups &
early growing MSMEs accessing 1,000

192
hands on skills, start toolkits scheme,
access to finance.
finance through BDF products
( Y3: 1000)
Portfolio ratio by amount of loan
provided to youth MSMEs (60%)
% of youth graduated from MST,
IBT, RRT supported to access
tool kits scheme (Y3:60%)
Output 2: Employment Services and Job
information accessed through YFC
% YFC’s Job Desk
operationalized 100%
Output 3: Inkomezamihigo functioning
strengthened Quarterly reports produced
Quarterly
reports
produced
Output 4: Youth are mobilised for mindset
and attitude change through connekt series
events /Agaciro kanjye program
Number of new youth
participated in Itorero
Inkomezamihigo and those
reached by “Ndi Umunyarwanda
( Y3: Itorero: 1000 Ndi
Munyarwanda: 4,000)
5,000
Output 5: Information/services and TV
access increased at community level
Number of knowledge
hubs/Irembo Centres
operationalized
1 per Sector
Nyarugenge
Output 1: Youth mobilized and benefited
from NEP Interventions: entrepreneurship,
hands on skills, start toolkits scheme,
access to finance.
Number of Youth startups &
early growing MSMEs accessing
finance through BDF products
( Y3: 1000)
Portfolio ratio by amount of loan
provided to youth MSMEs (60%)
% of youth graduated from MST,
IBT, RRT supported to access
tool kits scheme (Y3:60%)
1,000
Output 2: Employment Services and Job
information accessed through YFC
% YFC’s Job Desk
operationalized 100%
Output 3: Inkomezamihigo functioning
strengthened Quarterly reports produced
Quarterly
reports
produced
Output 4: Youth are mobilised for mindset
and attitude change through connekt series
events /Agaciro kanjye program
Number of new youth
participated in Itorero
Inkomezamihigo and those
reached by “Ndi Umunyarwanda
( Y3: Itorero: 1000 Ndi
Munyarwanda: 4,000)
5,000
Output 5: Information/services and TV
access increased at community level
Number of knowledge
hubs/Irembo Centres
operationalized
1 per Sector
Kicukiro
Output 1: Youth mobilized and benefited
from NEP Interventions: entrepreneurship,
Number of Youth startups &
early growing MSMEs accessing 1,000

193
hands on skills, start toolkits scheme,
access to finance.
finance through BDF products
( Y3: 1000)
Portfolio ratio by amount of loan
provided to youth MSMEs (60%)
% of youth graduated from MST,
IBT, RRT supported to access
tool kits scheme (Y3:60%)
Output 2: Employment Services and Job
information accessed through YFC
% YFC’s Job Desk
operationalized 100%
Output 3: Inkomezamihigo functioning
strengthened Quarterly reports produced
Quarterly
reports
produced
Output 4: Youth are mobilised for mindset
and attitude change through connekt series
events /Agaciro kanjye program
Number of new youth
participated in Itorero
Inkomezamihigo and those
reached by “Ndi Umunyarwanda
( Y3: Itorero: 1000 Ndi
Munyarwanda: 4,000)
5,000
Output 5: Information/services and TV
access increased at community level
Number of knowledge
hubs/Irembo Centres
operationalized
1 per Sector
Gasabo
Output 1: Youth mobilized and benefited
from NEP Interventions: entrepreneurship,
hands on skills, start toolkits scheme,
access to finance.
Number of Youth startups &
early growing MSMEs accessing
finance through BDF products
( Y3: 1000)
Portfolio ratio by amount of loan
provided to youth MSMEs (60%)
% of youth graduated from MST,
IBT, RRT supported to access
tool kits scheme (Y3:60%)
1,000
Output 2: Employment Services and Job
information accessed through YFC
% YFC’s Job Desk
operationalized 100%
Output 3: Inkomezamihigo functioning
strengthened Quarterly reports produced
Quarterly
reports
produced
Output 4: Youth are mobilised for mindset
and attitude change through connekt series
events /Agaciro kanjye program
Number of new youth
participated in Itorero
Inkomezamihigo and those
reached by “Ndi Umunyarwanda
( Y3: Itorero: 1000 Ndi
Munyarwanda: 4,000)
5,000
Output 5: Information/services and TV
access increased at community level
Number of knowledge
hubs/Irembo Centres
operationalized
1 per Sector

194
6. Reporting System
The decentralized entities will provide financial execution reports on earmarked transfers to
MINECOFIN, monthly, quarterly and annually as required by the law.
7. Monitoring and Evaluation System
Earmarking institution will monitor and evaluate the implementation of earmarked transfers using
financial reports and performance reports from Decentralized Entities to inform the next cycle of
earmarked transfers.
8. Disbursement Schedule and Conditions
Decentralized entities have the responsibility to provide cash flow plans for all earmarked transfers
and to make commitment accordingly. Commitment can be done for direct payment or for indirect
payment by transferring funds to the decentralized entity’s account. However, on the basis of
instructions provided by the Ministry of Youth and ICT, the Treasury reserves the right to withhold
any transfers committed by the Decentralized entity. In such a case, the concerned Decentralized
entity will formally be informed to take corrective actions, failure of which, will attract sanctions as
prescribed by the Law.

195
13. Ministry of Public Service and Labour (MIFOTRA)
1. Objective of the Earmarked Program and Sub-Program
Table 1: Program and Sub Program Objectives
Programs & Subprogram Objectives
Good Governance and Justice
Labour Administration To ensure the enforcement of the law regulating Labour in
Rwanda through conducting labour inspections in formal
enterprises;
- To conduct awareness campaign on Social Dialogue and
collective Bargaining in selected economic sector and selected
Districts;
- To provide necessary office equipment’s, furniture’s and materials to
District Labour Inspectors;
-To enforce Districts Steering Committees on implementation of
Child labour elimination policy.
2. Transferred Outputs
Table 2: Transferred Outputs
Program & Subprogram Outputs Activities
Good Governance and Justice
Labour Administration Output1: To ensure the
enforcement of the law
Regulating Labour in Rwanda
through conducting labour
inspections in formal
enterprises;
Activity1: Activity1: Conduct
1646 labour inspections in
formal enterprises and
investigation on litigations
settlement process by paying
transport and communication
for District Labour Inspectors
Output 2: To conduct
awareness campaign on
Social Dialogue and
collective Bargaining in
selected economic sector and
selected Districts;
Activity1: Conduct awareness
meeting with employers, trade
unions or workers delegates in
order to promote social
dialogue in selected sector and
selected Districts
Activity 2: Training of trainers
in collective bargaining process
for selected enterprises in
selected Districts.
Output 3: To provide
necessary office equipment’s,
furniture’s and materials to
District Labour Inspectors;
Activity1: Providing all
necessary office furniture’s
(papers, pens,….) and other
necessary materials to District
Labour Inspectors. Acquiring
computers (laptop) and printers
for District Labour Inspectors.
Output 4: To facilitate Activity1: Sensitization and
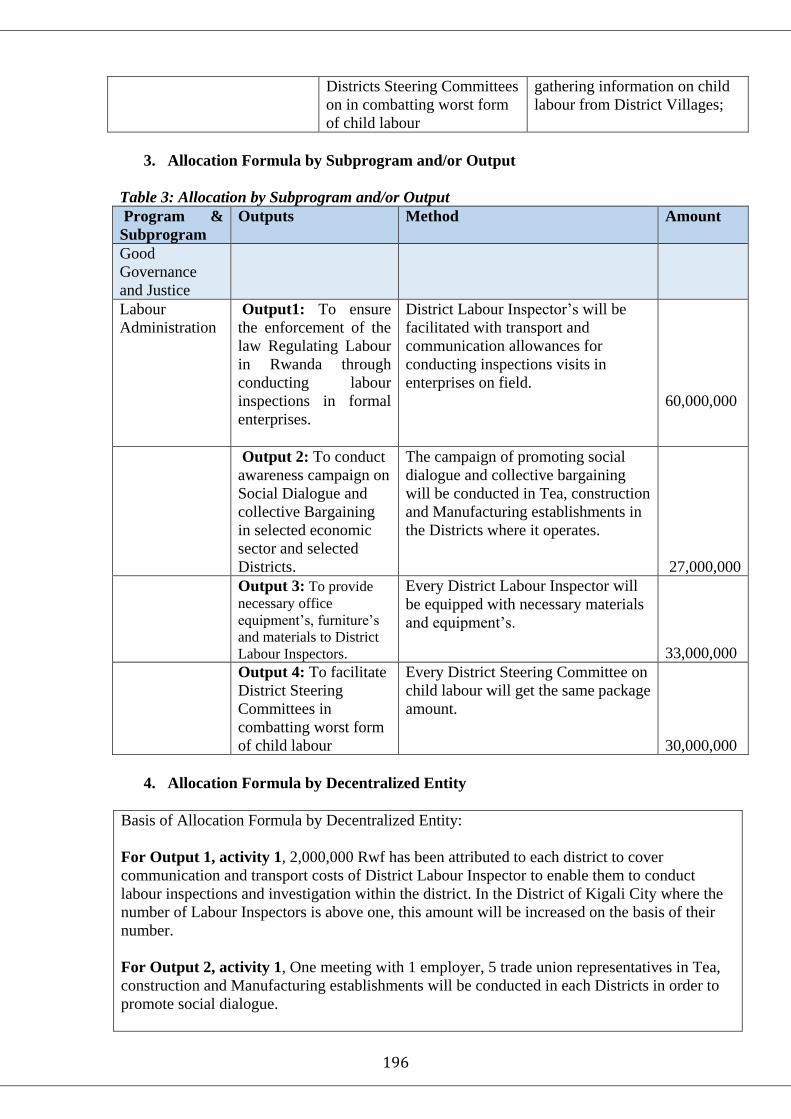
196
Districts Steering Committees
on in combatting worst form
of child labour
gathering information on child
labour from District Villages;
3. Allocation Formula by Subprogram and/or Output
Table 3: Allocation by Subprogram and/or Output
Program &
Subprogram
Outputs Method Amount
Good
Governance
and Justice
Labour
Administration
Output1: To ensure
the enforcement of the
law Regulating Labour
in Rwanda through
conducting labour
inspections in formal
enterprises.
District Labour Inspector’s will be
facilitated with transport and
communication allowances for
conducting inspections visits in
enterprises on field.
60,000,000
Output 2: To conduct
awareness campaign on
Social Dialogue and
collective Bargaining
in selected economic
sector and selected
Districts.
The campaign of promoting social
dialogue and collective bargaining
will be conducted in Tea, construction
and Manufacturing establishments in
the Districts where it operates.
27,000,000
Output 3: To provide
necessary office
equipment’s, furniture’s
and materials to District
Labour Inspectors.
Every District Labour Inspector will
be equipped with necessary materials
and equipment’s.
33,000,000
Output 4: To facilitate
District Steering
Committees in
combatting worst form
of child labour
Every District Steering Committee on
child labour will get the same package
amount.
30,000,000
4. Allocation Formula by Decentralized Entity
Basis of Allocation Formula by Decentralized Entity:
For Output 1, activity 1, 2,000,000 Rwf has been attributed to each district to cover
communication and transport costs of District Labour Inspector to enable them to conduct
labour inspections and investigation within the district. In the District of Kigali City where the
number of Labour Inspectors is above one, this amount will be increased on the basis of their
number.
For Output 2, activity 1, One meeting with 1 employer, 5 trade union representatives in Tea,
construction and Manufacturing establishments will be conducted in each Districts in order to
promote social dialogue.
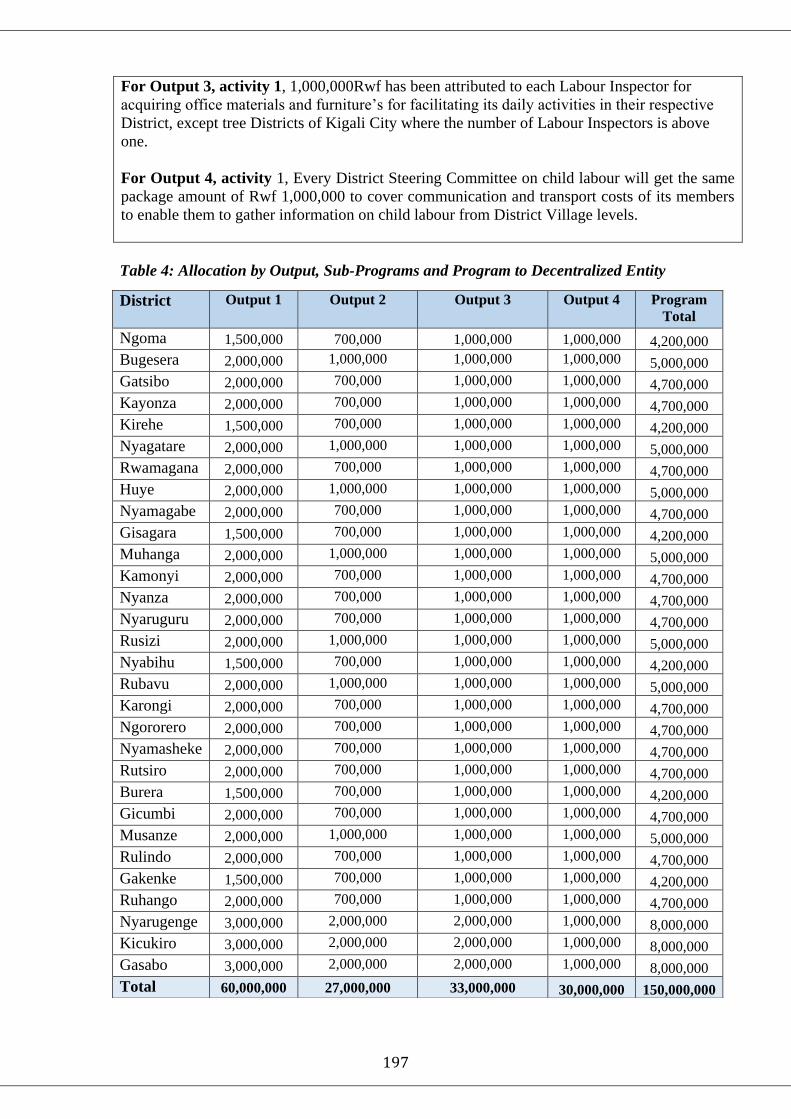
197
For Output 3, activity 1, 1,000,000Rwf has been attributed to each Labour Inspector for
acquiring office materials and furniture’s for facilitating its daily activities in their respective
District, except tree Districts of Kigali City where the number of Labour Inspectors is above
one.
For Output 4, activity 1, Every District Steering Committee on child labour will get the same
package amount of Rwf 1,000,000 to cover communication and transport costs of its members
to enable them to gather information on child labour from District Village levels.
Table 4: Allocation by Output, Sub-Programs and Program to Decentralized Entity
District Output 1 Output 2 Output 3 Output 4 Program
Total
Ngoma 1,500,000 700,000 1,000,000 1,000,000 4,200,000
Bugesera 2,000,000 1,000,000 1,000,000 1,000,000 5,000,000
Gatsibo 2,000,000 700,000 1,000,000 1,000,000 4,700,000
Kayonza 2,000,000 700,000 1,000,000 1,000,000 4,700,000
Kirehe 1,500,000 700,000 1,000,000 1,000,000 4,200,000
Nyagatare 2,000,000 1,000,000 1,000,000 1,000,000 5,000,000
Rwamagana 2,000,000 700,000 1,000,000 1,000,000 4,700,000
Huye 2,000,000 1,000,000 1,000,000 1,000,000 5,000,000
Nyamagabe 2,000,000 700,000 1,000,000 1,000,000 4,700,000
Gisagara 1,500,000 700,000 1,000,000 1,000,000 4,200,000
Muhanga 2,000,000 1,000,000 1,000,000 1,000,000 5,000,000
Kamonyi 2,000,000 700,000 1,000,000 1,000,000 4,700,000
Nyanza 2,000,000 700,000 1,000,000 1,000,000 4,700,000
Nyaruguru 2,000,000 700,000 1,000,000 1,000,000 4,700,000
Rusizi 2,000,000 1,000,000 1,000,000 1,000,000 5,000,000
Nyabihu 1,500,000 700,000 1,000,000 1,000,000 4,200,000
Rubavu 2,000,000 1,000,000 1,000,000 1,000,000 5,000,000
Karongi 2,000,000 700,000 1,000,000 1,000,000 4,700,000
Ngororero 2,000,000 700,000 1,000,000 1,000,000 4,700,000
Nyamasheke 2,000,000 700,000 1,000,000 1,000,000 4,700,000
Rutsiro 2,000,000 700,000 1,000,000 1,000,000 4,700,000
Burera 1,500,000 700,000 1,000,000 1,000,000 4,200,000
Gicumbi 2,000,000 700,000 1,000,000 1,000,000 4,700,000
Musanze 2,000,000 1,000,000 1,000,000 1,000,000 5,000,000
Rulindo 2,000,000 700,000 1,000,000 1,000,000 4,700,000
Gakenke 1,500,000 700,000 1,000,000 1,000,000 4,200,000
Ruhango 2,000,000 700,000 1,000,000 1,000,000 4,700,000
Nyarugenge 3,000,000 2,000,000 2,000,000 1,000,000 8,000,000
Kicukiro 3,000,000 2,000,000 2,000,000 1,000,000 8,000,000
Gasabo 3,000,000 2,000,000 2,000,000 1,000,000 8,000,000
Total 60,000,000 27,000,000 33,000,000 30,000,000 150,000,000
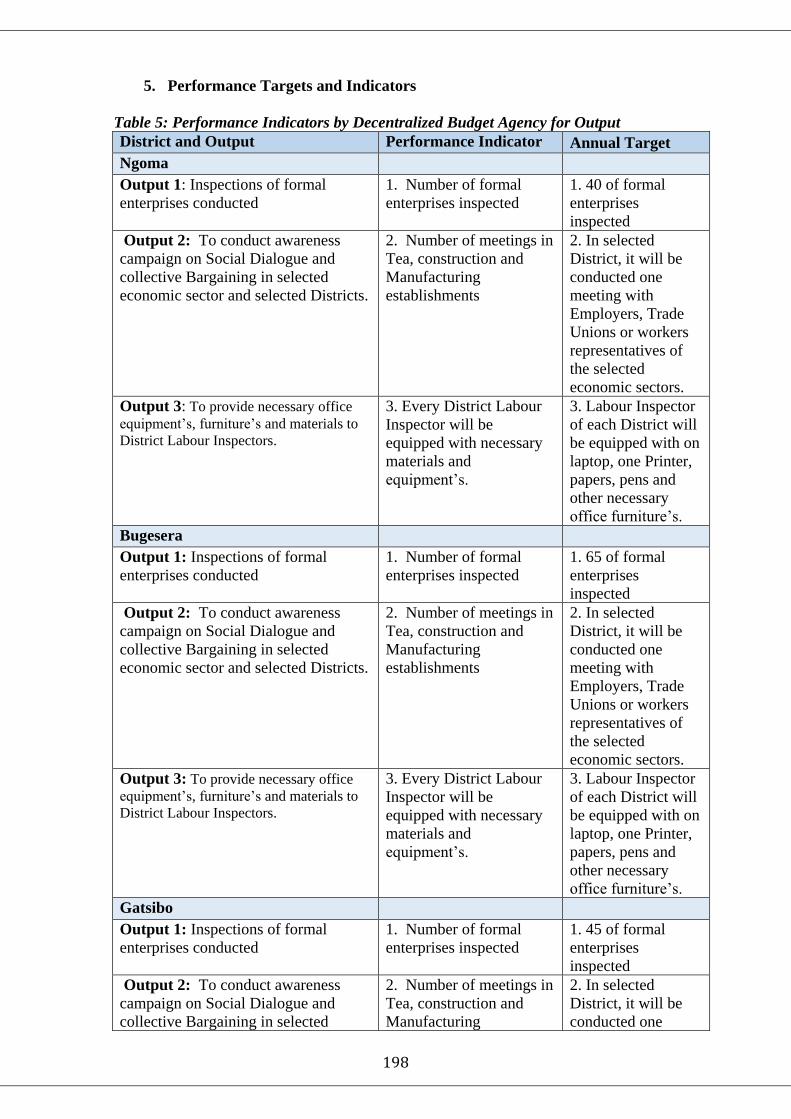
198
5. Performance Targets and Indicators
Table 5: Performance Indicators by Decentralized Budget Agency for Output
District and Output Performance Indicator Annual Target
Ngoma
Output 1: Inspections of formal
enterprises conducted
1. Number of formal
enterprises inspected
1. 40 of formal
enterprises
inspected
Output 2: To conduct awareness
campaign on Social Dialogue and
collective Bargaining in selected
economic sector and selected Districts.
2. Number of meetings in
Tea, construction and
Manufacturing
establishments
2. In selected
District, it will be
conducted one
meeting with
Employers, Trade
Unions or workers
representatives of
the selected
economic sectors.
Output 3: To provide necessary office
equipment’s, furniture’s and materials to
District Labour Inspectors.
3. Every District Labour
Inspector will be
equipped with necessary
materials and
equipment’s.
3. Labour Inspector
of each District will
be equipped with on
laptop, one Printer,
papers, pens and
other necessary
office furniture’s.
Bugesera
Output 1: Inspections of formal
enterprises conducted
1. Number of formal
enterprises inspected
1. 65 of formal
enterprises
inspected
Output 2: To conduct awareness
campaign on Social Dialogue and
collective Bargaining in selected
economic sector and selected Districts.
2. Number of meetings in
Tea, construction and
Manufacturing
establishments
2. In selected
District, it will be
conducted one
meeting with
Employers, Trade
Unions or workers
representatives of
the selected
economic sectors.
Output 3: To provide necessary office
equipment’s, furniture’s and materials to
District Labour Inspectors.
3. Every District Labour
Inspector will be
equipped with necessary
materials and
equipment’s.
3. Labour Inspector
of each District will
be equipped with on
laptop, one Printer,
papers, pens and
other necessary
office furniture’s.
Gatsibo
Output 1: Inspections of formal
enterprises conducted
1. Number of formal
enterprises inspected
1. 45 of formal
enterprises
inspected
Output 2: To conduct awareness
campaign on Social Dialogue and
collective Bargaining in selected
2. Number of meetings in
Tea, construction and
Manufacturing
2. In selected
District, it will be
conducted one
199
economic sector and selected Districts. establishments meeting with
Employers, Trade
Unions or workers
representatives of
the selected
economic sectors.
Output 3: To provide necessary office
equipment’s, furniture’s and materials to
District Labour Inspectors.
3. Every District Labour
Inspector will be
equipped with necessary
materials and
equipment’s.
3. Labour Inspector
of each District will
be equipped with on
laptop, one Printer,
papers, pens and
other necessary
office furniture’s.
Output 4: Gathering information on
child labour from District to Village;
3. Number of identified
Child Labourers in each
District
3. Child Labourers
identified at
75% of Villages
Kayonza
Output 1: Inspections of formal
enterprises conducted
1. Number of formal
enterprises inspected
1. 55 of formal
enterprises
inspected
Output 2: To conduct awareness
campaign on Social Dialogue and
collective Bargaining in selected
economic sector and selected Districts.
2. Number of meetings in
Tea, construction and
Manufacturing
establishments
2. In selected
District, it will be
conducted one
meeting with
Employers, Trade
Unions or workers
representatives of
the selected
economic sectors.
Output 3: To provide necessary office
equipment’s, furniture’s and materials to
District Labour Inspectors.
3. Every District Labour
Inspector will be
equipped with necessary
materials and
equipment’s.
3. Labour Inspector
of each District will
be equipped with on
laptop, one Printer,
papers, pens and
other necessary
office furniture’s.
Output 4: Gathering information on
child labour from District to Village;
3. Number of identified
Child Labourers in each
District
3. Child Labourers
identified at
75% of Villages
Kirehe
Output 1: Inspections of formal
enterprises conducted
1. Number of formal
enterprises inspected
1. 35 of formal
enterprises
inspected
Output 2: To conduct awareness
campaign on Social Dialogue and
collective Bargaining in selected
economic sector and selected Districts.
2. Number of meetings in
Tea, construction and
Manufacturing
establishments
2. In selected
District, it will be
conducted one
meeting with
Employers, Trade
Unions or workers

200
representatives of
the selected
economic sectors.
Output 3: To provide necessary office
equipment’s, furniture’s and materials to
District Labour Inspectors.
3. Every District Labour
Inspector will be
equipped with necessary
materials and
equipment’s.
3. Labour Inspector
of each District will
be equipped with on
laptop, one Printer,
papers, pens and
other necessary
office furniture’s.
Output 4: Gathering information on
child labour from District to Village;
3. Number of identified
Child Labourers in each
District
3. Child Labourers
identified at
75% of Villages
Nyagatare
Output 1: Inspections of formal
enterprises conducted
1. Number of formal
enterprises inspected
1. 60 of formal
enterprises
inspected
Output 2: To conduct awareness
campaign on Social Dialogue and
collective Bargaining in selected
economic sector and selected Districts.
2. Number of meetings in
Tea, construction and
Manufacturing
establishments
2. In selected
District, it will be
conducted one
meeting with
Employers, Trade
Unions or workers
representatives of
the selected
economic sectors.
Output 3: To provide necessary office
equipment’s, furniture’s and materials to
District Labour Inspectors.
3. Every District Labour
Inspector will be
equipped with necessary
materials and
equipment’s.
3. Labour Inspector
of each District will
be equipped with on
laptop, one Printer,
papers, pens and
other necessary
office furniture’s.
Output 4: Gathering information on
child labour from District to Village;
3. Number of identified
Child Labourers in each
District
3. Child Labourers
identified at
75% of Villages
Rwamagana
Output 1: Inspections of formal
enterprises conducted
1. Number of formal
enterprises inspected
1. 55 of formal
enterprises
inspected
Output 2: To conduct awareness
campaign on Social Dialogue and
collective Bargaining in selected
economic sector and selected Districts.
2. Number of meetings in
Tea, construction and
Manufacturing
establishments
2. In selected
District, it will be
conducted one
meeting with
Employers, Trade
Unions or workers
representatives of
the selected
economic sectors.
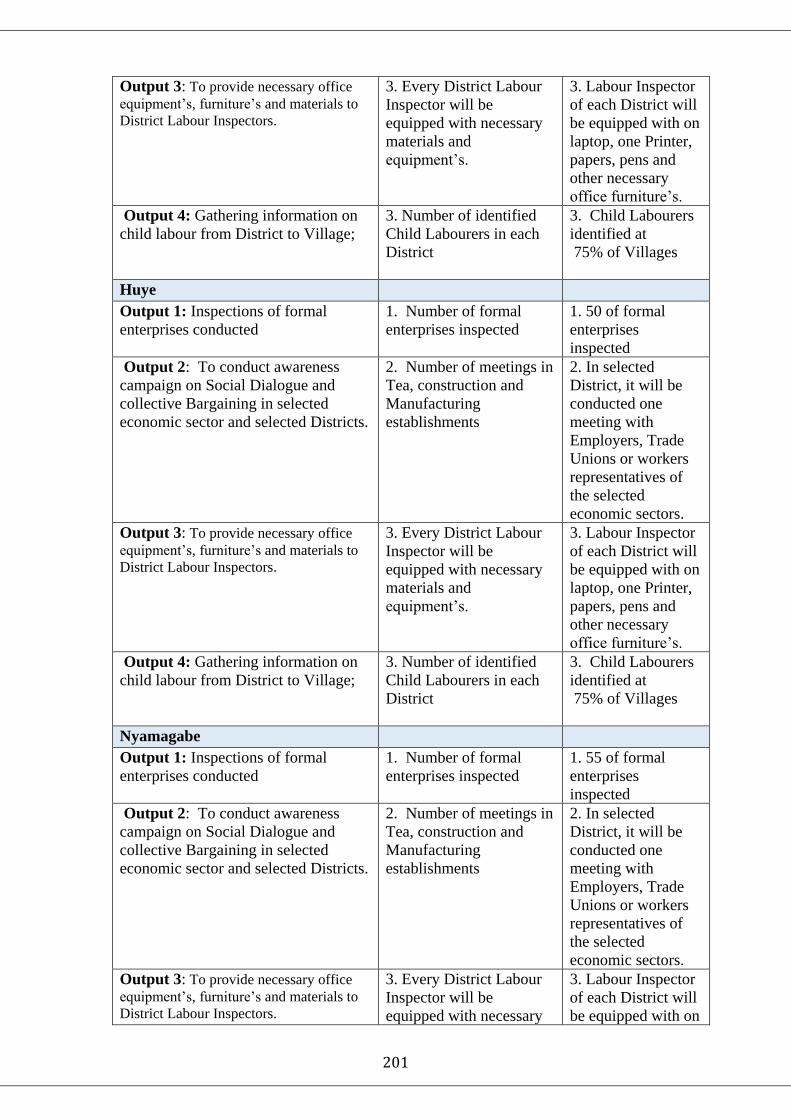
201
Output 3: To provide necessary office
equipment’s, furniture’s and materials to
District Labour Inspectors.
3. Every District Labour
Inspector will be
equipped with necessary
materials and
equipment’s.
3. Labour Inspector
of each District will
be equipped with on
laptop, one Printer,
papers, pens and
other necessary
office furniture’s.
Output 4: Gathering information on
child labour from District to Village;
3. Number of identified
Child Labourers in each
District
3. Child Labourers
identified at
75% of Villages
Huye
Output 1: Inspections of formal
enterprises conducted
1. Number of formal
enterprises inspected
1. 50 of formal
enterprises
inspected
Output 2: To conduct awareness
campaign on Social Dialogue and
collective Bargaining in selected
economic sector and selected Districts.
2. Number of meetings in
Tea, construction and
Manufacturing
establishments
2. In selected
District, it will be
conducted one
meeting with
Employers, Trade
Unions or workers
representatives of
the selected
economic sectors.
Output 3: To provide necessary office
equipment’s, furniture’s and materials to
District Labour Inspectors.
3. Every District Labour
Inspector will be
equipped with necessary
materials and
equipment’s.
3. Labour Inspector
of each District will
be equipped with on
laptop, one Printer,
papers, pens and
other necessary
office furniture’s.
Output 4: Gathering information on
child labour from District to Village;
3. Number of identified
Child Labourers in each
District
3. Child Labourers
identified at
75% of Villages
Nyamagabe
Output 1: Inspections of formal
enterprises conducted
1. Number of formal
enterprises inspected
1. 55 of formal
enterprises
inspected
Output 2: To conduct awareness
campaign on Social Dialogue and
collective Bargaining in selected
economic sector and selected Districts.
2. Number of meetings in
Tea, construction and
Manufacturing
establishments
2. In selected
District, it will be
conducted one
meeting with
Employers, Trade
Unions or workers
representatives of
the selected
economic sectors.
Output 3: To provide necessary office
equipment’s, furniture’s and materials to
District Labour Inspectors.
3. Every District Labour
Inspector will be
equipped with necessary
3. Labour Inspector
of each District will
be equipped with on
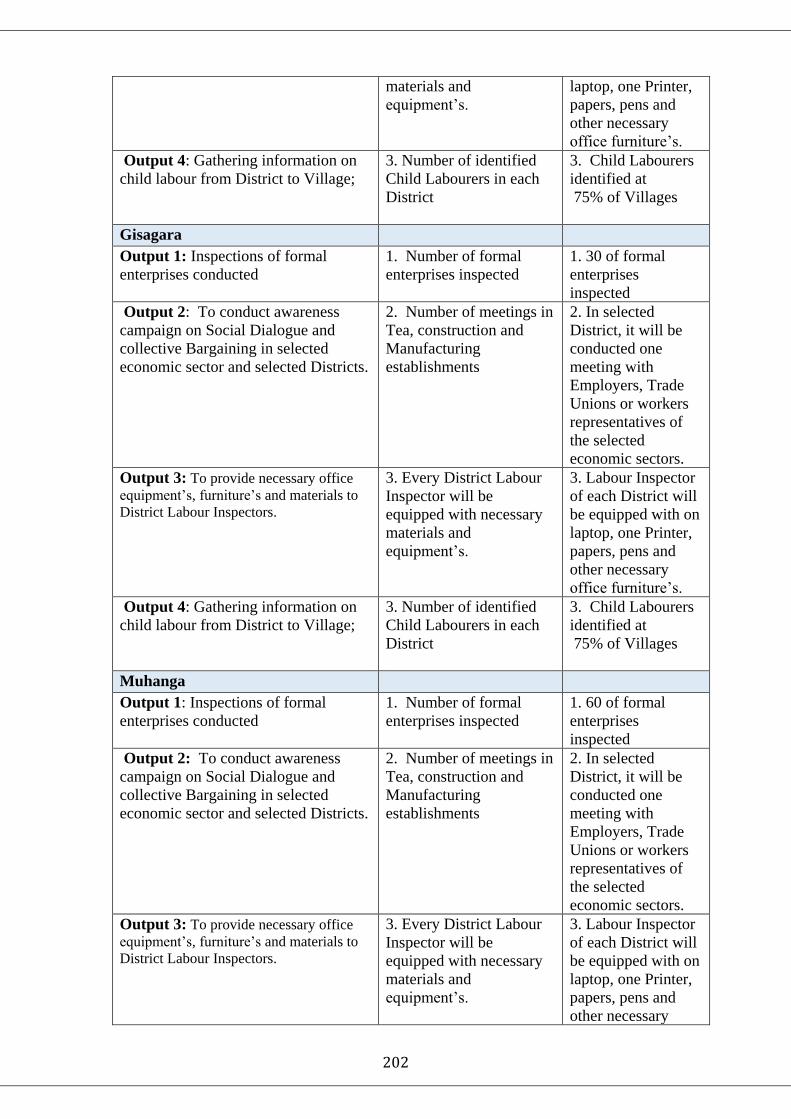
202
materials and
equipment’s.
laptop, one Printer,
papers, pens and
other necessary
office furniture’s.
Output 4: Gathering information on
child labour from District to Village;
3. Number of identified
Child Labourers in each
District
3. Child Labourers
identified at
75% of Villages
Gisagara
Output 1: Inspections of formal
enterprises conducted
1. Number of formal
enterprises inspected
1. 30 of formal
enterprises
inspected
Output 2: To conduct awareness
campaign on Social Dialogue and
collective Bargaining in selected
economic sector and selected Districts.
2. Number of meetings in
Tea, construction and
Manufacturing
establishments
2. In selected
District, it will be
conducted one
meeting with
Employers, Trade
Unions or workers
representatives of
the selected
economic sectors.
Output 3: To provide necessary office
equipment’s, furniture’s and materials to
District Labour Inspectors.
3. Every District Labour
Inspector will be
equipped with necessary
materials and
equipment’s.
3. Labour Inspector
of each District will
be equipped with on
laptop, one Printer,
papers, pens and
other necessary
office furniture’s.
Output 4: Gathering information on
child labour from District to Village;
3. Number of identified
Child Labourers in each
District
3. Child Labourers
identified at
75% of Villages
Muhanga
Output 1: Inspections of formal
enterprises conducted
1. Number of formal
enterprises inspected
1. 60 of formal
enterprises
inspected
Output 2: To conduct awareness
campaign on Social Dialogue and
collective Bargaining in selected
economic sector and selected Districts.
2. Number of meetings in
Tea, construction and
Manufacturing
establishments
2. In selected
District, it will be
conducted one
meeting with
Employers, Trade
Unions or workers
representatives of
the selected
economic sectors.
Output 3: To provide necessary office
equipment’s, furniture’s and materials to
District Labour Inspectors.
3. Every District Labour
Inspector will be
equipped with necessary
materials and
equipment’s.
3. Labour Inspector
of each District will
be equipped with on
laptop, one Printer,
papers, pens and
other necessary
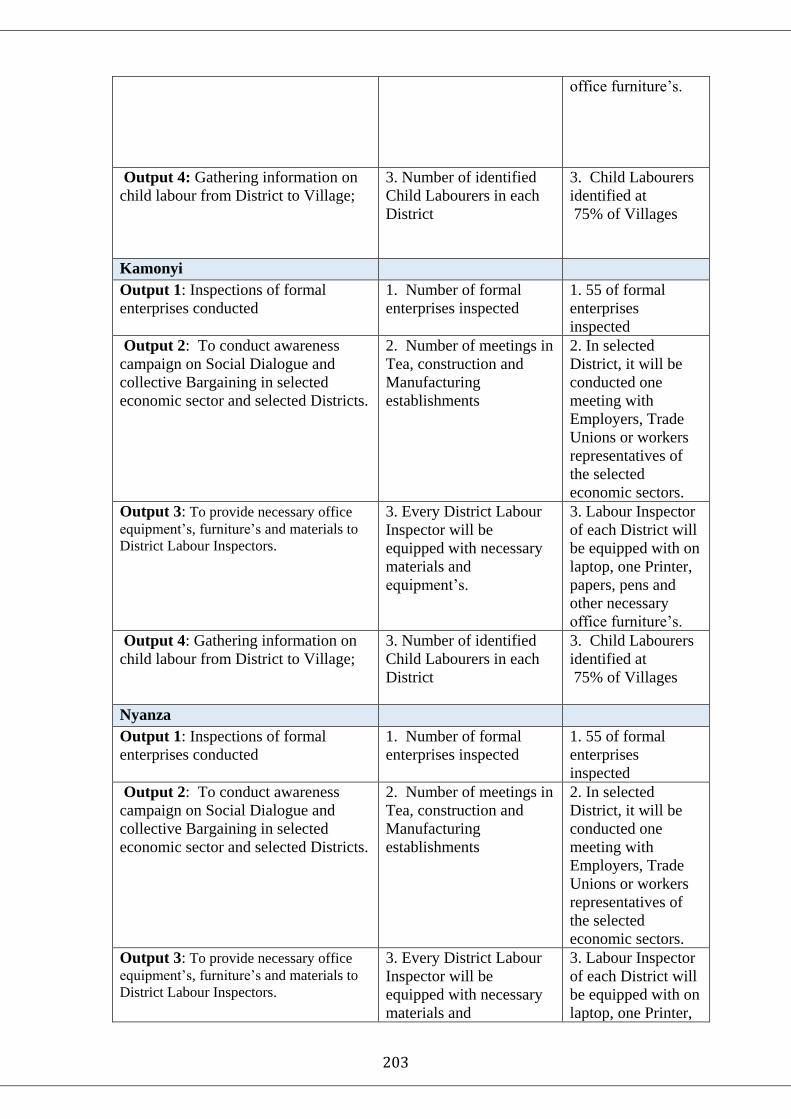
203
office furniture’s.
Output 4: Gathering information on
child labour from District to Village;
3. Number of identified
Child Labourers in each
District
3. Child Labourers
identified at
75% of Villages
Kamonyi
Output 1: Inspections of formal
enterprises conducted
1. Number of formal
enterprises inspected
1. 55 of formal
enterprises
inspected
Output 2: To conduct awareness
campaign on Social Dialogue and
collective Bargaining in selected
economic sector and selected Districts.
2. Number of meetings in
Tea, construction and
Manufacturing
establishments
2. In selected
District, it will be
conducted one
meeting with
Employers, Trade
Unions or workers
representatives of
the selected
economic sectors.
Output 3: To provide necessary office
equipment’s, furniture’s and materials to
District Labour Inspectors.
3. Every District Labour
Inspector will be
equipped with necessary
materials and
equipment’s.
3. Labour Inspector
of each District will
be equipped with on
laptop, one Printer,
papers, pens and
other necessary
office furniture’s.
Output 4: Gathering information on
child labour from District to Village;
3. Number of identified
Child Labourers in each
District
3. Child Labourers
identified at
75% of Villages
Nyanza
Output 1: Inspections of formal
enterprises conducted
1. Number of formal
enterprises inspected
1. 55 of formal
enterprises
inspected
Output 2: To conduct awareness
campaign on Social Dialogue and
collective Bargaining in selected
economic sector and selected Districts.
2. Number of meetings in
Tea, construction and
Manufacturing
establishments
2. In selected
District, it will be
conducted one
meeting with
Employers, Trade
Unions or workers
representatives of
the selected
economic sectors.
Output 3: To provide necessary office
equipment’s, furniture’s and materials to
District Labour Inspectors.
3. Every District Labour
Inspector will be
equipped with necessary
materials and
3. Labour Inspector
of each District will
be equipped with on
laptop, one Printer,

204
equipment’s. papers, pens and
other necessary
office furniture’s.
Output 4: Gathering information on
child labour from District to Village;
3. Number of identified
Child Labourers in each
District
3. Child Labourers
identified at
75% of Villages
Nyaruguru
Output 1: Inspections of formal
enterprises conducted
1. Number of formal
enterprises inspected
1. 50 of formal
enterprises
inspected
Output 2: To conduct awareness
campaign on Social Dialogue and
collective Bargaining in selected
economic sector and selected Districts.
2. Number of meetings in
Tea, construction and
Manufacturing
establishments
2. In selected
District, it will be
conducted one
meeting with
Employers, Trade
Unions or workers
representatives of
the selected
economic sectors.
Output 3: To provide necessary office
equipment’s, furniture’s and materials to
District Labour Inspectors.
3. Every District Labour
Inspector will be
equipped with necessary
materials and
equipment’s.
3. Labour Inspector
of each District will
be equipped with on
laptop, one Printer,
papers, pens and
other necessary
office furniture’s.
Output 4: Gathering information on
child labour from District to Village;
3. Number of identified
Child Labourers in each
District
3. Child Labourers
identified at
75% of Villages
Rusizi
Output 1: Inspections of formal
enterprises conducted
1. Number of formal
enterprises inspected
1. 65 of formal
enterprises
inspected
Output 2: To conduct awareness
campaign on Social Dialogue and
collective Bargaining in selected
economic sector and selected Districts.
2. Number of meetings in
Tea, construction and
Manufacturing
establishments
2. In selected
District, it will be
conducted one
meeting with
Employers, Trade
Unions or workers
representatives of
the selected
economic sectors.
Output 3: To provide necessary office
equipment’s, furniture’s and materials to
District Labour Inspectors.
3. Every District Labour
Inspector will be
equipped with necessary
materials and
equipment’s.
3. Labour Inspector
of each District will
be equipped with on
laptop, one Printer,
papers, pens and
other necessary
office furniture’s.

205
Output 4: Gathering information on
child labour from District to Village;
3. Number of identified
Child Labourers in each
District
3. Child Labourers
identified at
75% of Villages
Nyabihu
Output 1: Inspections of formal
enterprises conducted
1. Number of formal
enterprises inspected
1. 35 of formal
enterprises
inspected
Output 2: To conduct awareness
campaign on Social Dialogue and
collective Bargaining in selected
economic sector and selected Districts.
2. Number of meetings in
Tea, construction and
Manufacturing
establishments
2. In selected
District, it will be
conducted one
meeting with
Employers, Trade
Unions or workers
representatives of
the selected
economic sectors.
Output 3: To provide necessary office
equipment’s, furniture’s and materials to
District Labour Inspectors.
3. Every District Labour
Inspector will be
equipped with necessary
materials and
equipment’s.
3. Labour Inspector
of each District will
be equipped with on
laptop, one Printer,
papers, pens and
other necessary
office furniture’s.
Output 4: Gathering information on
child labour from District to Village;
3. Number of identified
Child Labourers in each
District
3. Child Labourers
identified at
75% of Villages
Rubavu
Output 1: Inspections of formal
enterprises conducted
1. Number of formal
enterprises inspected
1. 65 of formal
enterprises
inspected
Output 2: To conduct awareness
campaign on Social Dialogue and
collective Bargaining in selected
economic sector and selected Districts.
2. Number of meetings in
Tea, construction and
Manufacturing
establishments
2. In selected
District, it will be
conducted one
meeting with
Employers, Trade
Unions or workers
representatives of
the selected
economic sectors.
Output 3: To provide necessary office
equipment’s, furniture’s and materials to
District Labour Inspectors.
3. Every District Labour
Inspector will be
equipped with necessary
materials and
equipment’s.
3. Labour Inspector
of each District will
be equipped with on
laptop, one Printer,
papers, pens and
other necessary
office furniture’s.
Output 4: Gathering information on
child labour from District to Village;
3. Number of identified
Child Labourers in each
District
3. Child Labourers
identified at
75% of Villages

206
Karongi
Output 1: Inspections of formal
enterprises conducted
1. Number of formal
enterprises inspected
1. 55 of formal
enterprises
inspected
Output 2: To conduct awareness
campaign on Social Dialogue and
collective Bargaining in selected
economic sector and selected Districts.
2. Number of meetings in
Tea, construction and
Manufacturing
establishments
2. In selected
District, it will be
conducted one
meeting with
Employers, Trade
Unions or workers
representatives of
the selected
economic sectors.
Output 3: To provide necessary office
equipment’s, furniture’s and materials to
District Labour Inspectors.
3. Every District Labour
Inspector will be
equipped with necessary
materials and
equipment’s.
3. Labour Inspector
of each District will
be equipped with on
laptop, one Printer,
papers, pens and
other necessary
office furniture’s.
Output 4: Gathering information on
child labour from District to Village;
3. Number of identified
Child Labourers in each
District
3. Child Labourers
identified at
75% of Villages
Ngororero
Output 1: Inspections of formal
enterprises conducted
1. Number of formal
enterprises inspected
1. 45 of formal
enterprises
inspected
Output 2: To conduct awareness
campaign on Social Dialogue and
collective Bargaining in selected
economic sector and selected Districts.
2. Number of meetings in
Tea, construction and
Manufacturing
establishments
2. In selected
District, it will be
conducted one
meeting with
Employers, Trade
Unions or workers
representatives of
the selected
economic sectors.
Output 3: To provide necessary office
equipment’s, furniture’s and materials to
District Labour Inspectors.
3. Every District Labour
Inspector will be
equipped with necessary
materials and
equipment’s.
3. Labour Inspector
of each District will
be equipped with on
laptop, one Printer,
papers, pens and
other necessary
office furniture’s.
Output 4: Gathering information on
child labour from District to Village;
3. Number of identified
Child Labourers in each
District
3. Child Labourers
identified at
75% of Villages
Nyamasheke
Output 1: Inspections of formal
enterprises conducted
1. Number of formal
enterprises inspected
1. 45 of formal
enterprises
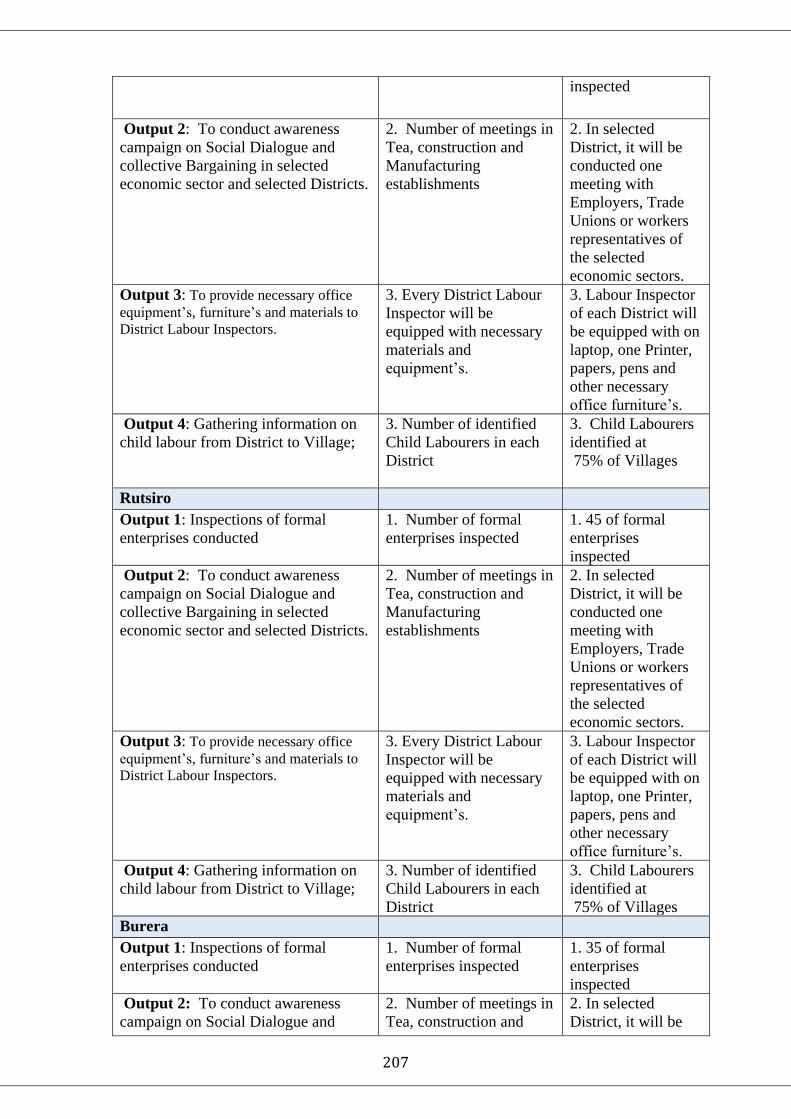
207
inspected
Output 2: To conduct awareness
campaign on Social Dialogue and
collective Bargaining in selected
economic sector and selected Districts.
2. Number of meetings in
Tea, construction and
Manufacturing
establishments
2. In selected
District, it will be
conducted one
meeting with
Employers, Trade
Unions or workers
representatives of
the selected
economic sectors.
Output 3: To provide necessary office
equipment’s, furniture’s and materials to
District Labour Inspectors.
3. Every District Labour
Inspector will be
equipped with necessary
materials and
equipment’s.
3. Labour Inspector
of each District will
be equipped with on
laptop, one Printer,
papers, pens and
other necessary
office furniture’s.
Output 4: Gathering information on
child labour from District to Village;
3. Number of identified
Child Labourers in each
District
3. Child Labourers
identified at
75% of Villages
Rutsiro
Output 1: Inspections of formal
enterprises conducted
1. Number of formal
enterprises inspected
1. 45 of formal
enterprises
inspected
Output 2: To conduct awareness
campaign on Social Dialogue and
collective Bargaining in selected
economic sector and selected Districts.
2. Number of meetings in
Tea, construction and
Manufacturing
establishments
2. In selected
District, it will be
conducted one
meeting with
Employers, Trade
Unions or workers
representatives of
the selected
economic sectors.
Output 3: To provide necessary office
equipment’s, furniture’s and materials to
District Labour Inspectors.
3. Every District Labour
Inspector will be
equipped with necessary
materials and
equipment’s.
3. Labour Inspector
of each District will
be equipped with on
laptop, one Printer,
papers, pens and
other necessary
office furniture’s.
Output 4: Gathering information on
child labour from District to Village;
3. Number of identified
Child Labourers in each
District
3. Child Labourers
identified at
75% of Villages
Burera
Output 1: Inspections of formal
enterprises conducted
1. Number of formal
enterprises inspected
1. 35 of formal
enterprises
inspected
Output 2: To conduct awareness
campaign on Social Dialogue and
2. Number of meetings in
Tea, construction and
2. In selected
District, it will be

208
collective Bargaining in selected
economic sector and selected Districts.
Manufacturing
establishments
conducted one
meeting with
Employers, Trade
Unions or workers
representatives of
the selected
economic sectors.
Output 3: To provide necessary office
equipment’s, furniture’s and materials to
District Labour Inspectors.
3. Every District Labour
Inspector will be
equipped with necessary
materials and
equipment’s.
3. Labour Inspector
of each District will
be equipped with on
laptop, one Printer,
papers, pens and
other necessary
office furniture’s.
Output 4: Gathering information on
child labour from District to Village;
3. Number of identified
Child Labourers in each
District
3. Child Labourers
identified at
75% of Villages
Gicumbi
Output 1: Inspections of formal
enterprises conducted
1. Number of formal
enterprises inspected
1. 55 of formal
enterprises
inspected
Output 2: To conduct awareness
campaign on Social Dialogue and
collective Bargaining in selected
economic sector and selected Districts.
2. Number of meetings in
Tea, construction and
Manufacturing
establishments
2. In selected
District, it will be
conducted one
meeting with
Employers, Trade
Unions or workers
representatives of
the selected
economic sectors.
Output 3: To provide necessary office
equipment’s, furniture’s and materials to
District Labour Inspectors.
3. Every District Labour
Inspector will be
equipped with necessary
materials and
equipment’s.
3. Labour Inspector
of each District will
be equipped with on
laptop, one Printer,
papers, pens and
other necessary
office furniture’s.
Output 4: Gathering information on
child labour from District to Village;
3. Number of identified
Child Labourers in each
District
3. Child Labourers
identified at
75% of Villages
Musanze
Output 1: Inspections of formal
enterprises conducted
1. Number of formal
enterprises inspected
1. 65 of formal
enterprises
inspected
Output 2: To conduct awareness
campaign on Social Dialogue and
collective Bargaining in selected
economic sector and selected Districts.
2. Number of meetings in
Tea, construction and
Manufacturing
establishments
2. In selected
District, it will be
conducted one
meeting with
Employers, Trade
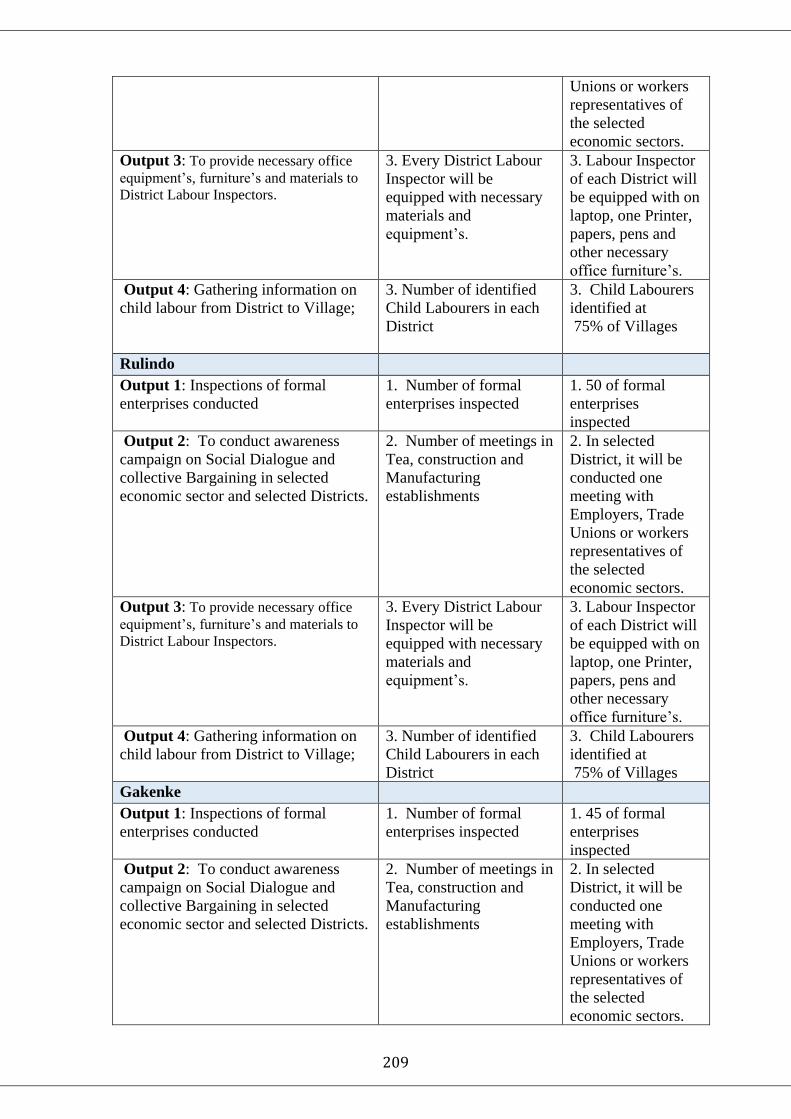
209
Unions or workers
representatives of
the selected
economic sectors.
Output 3: To provide necessary office
equipment’s, furniture’s and materials to
District Labour Inspectors.
3. Every District Labour
Inspector will be
equipped with necessary
materials and
equipment’s.
3. Labour Inspector
of each District will
be equipped with on
laptop, one Printer,
papers, pens and
other necessary
office furniture’s.
Output 4: Gathering information on
child labour from District to Village;
3. Number of identified
Child Labourers in each
District
3. Child Labourers
identified at
75% of Villages
Rulindo
Output 1: Inspections of formal
enterprises conducted
1. Number of formal
enterprises inspected
1. 50 of formal
enterprises
inspected
Output 2: To conduct awareness
campaign on Social Dialogue and
collective Bargaining in selected
economic sector and selected Districts.
2. Number of meetings in
Tea, construction and
Manufacturing
establishments
2. In selected
District, it will be
conducted one
meeting with
Employers, Trade
Unions or workers
representatives of
the selected
economic sectors.
Output 3: To provide necessary office
equipment’s, furniture’s and materials to
District Labour Inspectors.
3. Every District Labour
Inspector will be
equipped with necessary
materials and
equipment’s.
3. Labour Inspector
of each District will
be equipped with on
laptop, one Printer,
papers, pens and
other necessary
office furniture’s.
Output 4: Gathering information on
child labour from District to Village;
3. Number of identified
Child Labourers in each
District
3. Child Labourers
identified at
75% of Villages
Gakenke
Output 1: Inspections of formal
enterprises conducted
1. Number of formal
enterprises inspected
1. 45 of formal
enterprises
inspected
Output 2: To conduct awareness
campaign on Social Dialogue and
collective Bargaining in selected
economic sector and selected Districts.
2. Number of meetings in
Tea, construction and
Manufacturing
establishments
2. In selected
District, it will be
conducted one
meeting with
Employers, Trade
Unions or workers
representatives of
the selected
economic sectors.

210
Output 3: To provide necessary office
equipment’s, furniture’s and materials to
District Labour Inspectors.
3. Every District Labour
Inspector will be
equipped with necessary
materials and
equipment’s.
3. Labour Inspector
of each District will
be equipped with on
laptop, one Printer,
papers, pens and
other necessary
office furniture’s.
Output 4: Gathering information on
child labour from District to Village;
3. Number of identified
Child Labourers in each
District
3. Child Labourers
identified at
75% of Villages
Ruhango
Output 1: Inspections of formal
enterprises conducted
1. Number of formal
enterprises inspected
1. 55 of formal
enterprises
inspected
Output 2: To conduct awareness
campaign on Social Dialogue and
collective Bargaining in selected
economic sector and selected Districts.
2. Number of meetings in
Tea, construction and
Manufacturing
establishments
2. In selected
District, it will be
conducted one
meeting with
Employers, Trade
Unions or workers
representatives of
the selected
economic sectors.
Output 3: To provide necessary office
equipment’s, furniture’s and materials to
District Labour Inspectors.
3. Every District Labour
Inspector will be
equipped with necessary
materials and
equipment’s.
3. Labour Inspector
of each District will
be equipped with on
laptop, one Printer,
papers, pens and
other necessary
office furniture’s.
Output 4: Gathering information on
child labour from District to Village;
3. Number of identified
Child Labourers in each
District
3. Child Labourers
identified at
75% of Villages
Nyarugenge
Output 1: Inspections of formal
enterprises conducted
1. Number of formal
enterprises inspected
1. 150 of formal
enterprises
inspected
Output 2: To conduct awareness
campaign on Social Dialogue and
collective Bargaining in selected
economic sector and selected Districts.
2. Number of meetings in
Tea, construction and
Manufacturing
establishments
2. In selected
District, it will be
conducted one
meeting with
Employers, Trade
Unions or workers
representatives of
the selected
economic sectors.
Output 3: To provide necessary office
equipment’s, furniture’s and materials to
District Labour Inspectors.
3. Every District Labour
Inspector will be
equipped with necessary
materials and
3. Labour Inspector
of each District will
be equipped with on
laptop, one Printer,

211
equipment’s. papers, pens and
other necessary
office furniture’s.
Output 4: Gathering information on
child labour from District to Village;
3. Number of identified
Child Labourers in each
District
3. Child Labourers
identified at
75% of Villages
Kicukiro
Output 1: Inspections of formal
enterprises conducted
1. Number of formal
enterprises inspected
1. 150 of formal
enterprises
inspected
Output 2: To conduct awareness
campaign on Social Dialogue and
collective Bargaining in selected
economic sector and selected Districts.
2. Number of meetings in
Tea, construction and
Manufacturing
establishments
2. In selected
District, it will be
conducted one
meeting with
Employers, Trade
Unions or workers
representatives of
the selected
economic sectors.
Output 3: To provide necessary office
equipment’s, furniture’s and materials to
District Labour Inspectors.
3. Every District Labour
Inspector will be
equipped with necessary
materials and
equipment’s.
3. Labour Inspector
of each District will
be equipped with on
laptop, one Printer,
papers, pens and
other necessary
office furniture’s.
Output 4: Gathering information on
child labour from District to Village;
3. Number of identified
Child Labourers in each
District
3. Child Labourers
identified at
75% of Villages
Gasabo
Output 1: Inspections of formal
enterprises conducted
1. Number of formal
enterprises inspected
1. 150 of formal
enterprises
inspected
Output 2: To conduct awareness
campaign on Social Dialogue and
collective Bargaining in selected
economic sector and selected Districts.
2. Number of meetings in
Tea, construction and
Manufacturing
establishments
2. In selected
District, it will be
conducted one
meeting with
Employers, Trade
Unions or workers
representatives of
the selected
economic sectors.
Output 3: To provide necessary office
equipment’s, furniture’s and materials to
District Labour Inspectors.
3. Every District Labour
Inspector will be
equipped with necessary
materials and
equipment’s.
3. Labour Inspector
of each District will
be equipped with on
laptop, one Printer,
papers, pens and
other necessary
office furniture’s.

212
Output 4: Gathering information on
child labour from District to Village;
3. Number of identified
Child Labourers in each
District
3. Child Labourers
identified at
75% of Villages
6. Reporting System
Decentralized entities should provide financial execution reports on earmarked
transfers to MINECOFIN and a copy to respective earmarking institutions, monthly,
quarterly and annually. Decentralized entities will also consolidate the quarterly
financial reports they receive from subsidiary entities;
7. Monitoring and Evaluation System
It is imperative that Sector Ministries and Central Budget Agencies monitor and
evaluate the earmarked transfers using:
a. Monthly, quarterly and yearly financial execution reports on earmarked
transfers;
b. Decentralized entity’ annual performance report specifically to inform the next
cycle of earmarked transfers.
8. Disbursement Schedule and Conditions
Table 6: Disbursement Modalities by Program/Subprogram
Program &
Subprogram
Frequency Destination Beneficiary
Good Governance
and Justice
Labour
Administration
Output 1:
Inspections of
formal enterprises
conducted
Quarterly District
Labour Inspectors
Output 2: To
conduct awareness
campaign on
Social Dialogue
and collective
Bargaining in
selected economic
sector and selected
Districts.
Quarterly District
Labour Inspectors
Output 3: To
provide necessary
office equipment’s,
furniture’s and
materials to District
Labour Inspectors.
Quarterly District Labour Inspectors
a. Decentralized entities have the responsibility to provide cash flow plans for all
earmarked transfers and to make commitment accordingly. Commitment can be

213
done for direct payment or for indirect payment by transferring funds to the
decentralized entity’s account;
b. However, on the basis of instructions provided by the earmarking institution, the
Treasury reserves the right to withhold any transfers committed by the Decentralized
entity;
c. In such a case, the concerned Decentralized entity will formally be informed to take
corrective actions.

214
14 Local Development Agency (LODA) 1. Objective of the Earmarked Program and Sub-Program Table 1: Program and Sub Program Objectives
Programs Objectives 1 Social Protection 1.1 Vulnerable Group
Support Strengthening economic growth and accelerate the rate of poverty reduction in Rwanda and its goal is to eradicate extreme poverty by 2020. VUP and UBUDEHE improve the graduation from poverty of vulnerable Rwandans
2
Agriculture and animal resource intensification
This program is aimed at intensifying the sector’s development in the areas of erosion control, water and soil management, input use, food security, livestock development and nutrition. It also incorporates the training activities that need to accompany the provision of physical infrastructures and inputs.
2.1
Soil conservation and land husbandry
To decrease sharply the rate of soil erosion and increase the water retention capacity of watersheds, hence increasing the productivity of terraced area.
2.2 Irrigation and water management
To increase the total area of land under irrigation which will facilitate crop growing throughout the year, reduce weather risks to yields and improve productivity. For the earmarked transfers for irrigation development, the objective of the subprogram is to provide hillside irrigation infrastructures for small scale irrigation.
2.4 Inputs to improve soil fertility and management
Lime and compost purchasing and distribution to improve soil fertility and management through purchasing and distribution of lime and compost for consolidated sites & unused terraces
2.6 Livestock Development Promote livestock farming to reduce poverty; improve nutrition and income generation; through increased number of household with livestock, improve genetic performance of livestock, improve the disease control and veterinary services and improve animal nutrition
2.7 Nutrition and Household Vulnerability
To reduce prevalence of stunting among children under 5
3
Research and technology transfer, advisory services and professionalization of farmers
To make the sector more knowledge-intensive through professionalization and capacity building for producer organizations and through improvements in the systems for technology generation and dissemination
3.3
Farmer cooperatives and organizations: TWIGIRE
To empower farmers by giving them greater ability to develop solutions on their own initiatives and to access the technical assistance they need on particular issues that will lead to an efficient and effective farmer-oriented extension system which can build up the capacity of all Rwandan farmers and which is integrated in local development process through a practical decentralization without losing

215
the continued technical support from central level. 4. Different Programs 4.1 Different Subprograms Support socio-economic development activities in local
administrative entities 3 Transferred Outputs/Activities LODA is responsible for the coordination of all local development projects. In addition, LODA funds at the district level the management of the cash transfers to extremely poor households (Direct support), the realization of labour intensive projects (PW), the provision of credit to small income generating projects (Financial support) and finally the realization of Village/community and households’ projects at the village level. Table 2: Transferred Outputs/Activities
Program & Subprogram Outputs Activities
1 Social Protection 1.1 Vulnerable group
support Output 1: Direct Support delivered to extremely poor households headed by females & males without labour in 416 Sectors
Activity 1: Identification of beneficiaries and provision of timely cash transfers to household beneficiaries
Output 2: Sustainable graduation from extreme poverty for VUP beneficiaries supported
Activity 1: Identification of beneficiaries and provision of asset transfers to household beneficiaries ; Activity 2: Caseworkers provide linkages for MPG beneficiaries to livelihoods opportunities and monitor beneficiaries’ status
Output 3: Household &community projects funded at village level in Districts
Activity 1: Identification and provision of financing for household and community projects at village level Activity 2: Organize and conduct SP beneficiary and Ubudehe profiling & training
Output 4: Investment capital to poor households headed by females & males to develop sustainable micro-businesses provided through FS
Activity 1: Identification and provision of FS loans in partnership with SACCOs
Output 5: Social protection programs implemented in partnership with civil society organizations
Activity 1: Operationalization of MoU& contracts in implementation of SP program in partnership with CSOs
Output 6: Local community capacities & VUP beneficiaries’ capacities developed
Activity 1: VUP beneficiary skills development Activity 2: VUP & Livelihoods Programme Monitoring and Implementation Support

216
Program & Subprogram Outputs Activities
2 Agriculture and animal resource intensification
2.1
Soil erosion controlled - Increased productivity
- Decreased soil loss and water
pollution downstream
- Decreased destructive floods
and landslides
- Construction of radical terraces (800Ha) to protect irrigation schemes
- Lime and compost application
- Use of agroforestry systems (pennisetum and trees)
- Construction of water ways and check dams
2.2
Area under irrigation increased
- Additional area (2000Ha)
under SSIT
- Agriculture production
increased
- Growing three seasons
- Community Mobilization - Planning and Designing of
systems - Supply and Installation of SSIT
equipment - Capacity building of farmers - Commissioning of SSIT
Equipment
2.4 Inputs to improve soil fertility and management
- LIME use
- COMPOST use
to increase agricultural
productivity (Yield) of both
consolidated and unused
terraces resulting from
Improved soil fertility and
good agricultural practices
Select shortlist and sign
Framework Contract with Lime
suppliers. The compost supply
will be contract using
community approach
Validation of Farmers lists for
lime and compost required
Lime purchase to be used in
unused terraces (1,667 ha)
Lime purchase to be used in
consolidated sites (2,446ha)
Compost making and
distribution for unused terraces
(1,667 ha ) as a primarily and

217
Program & Subprogram Outputs Activities
for consolidated and Twigire
sites secondarily
Monitor Lime and compost use
by farmers
2.6 Livestock Development Agricultural and livestock productivity increased
Activity 1 Cow purchase and distribution; Activity 2: providing veterinary package for Girinka Activity 2: Distribution of small stock Activity 3: Artificial Insemination Activity 4: Semen freezing equipment Activity 5: Vaccination Activity 6: Veterinary support services
2.7 Nutrition and Household Vulnerability
86,980 pupils received 3,131,280 liters of milk
Milk purchase and distributed to pupils
3 Research and technology transfer, advisory services and professionalization of fa
3.3 Farmer cooperatives and organizations: TWIGIRE
- Increased use of quality inputs
- Increased application of Good
Agricultural Practices (GAP)
- Increased productivity
- Strong farmer groups
- Capacity building of Farmer
Promoters by RAB (not in
earmarked transfer)
- Providing incentives for Farmer
Promoters (Bicycles)
- Contract with the Cooperative of
FFS Facilitators to create and
facilitate new FFS groups
- Planning meetings at sector and
district level
- Monitoring and Evaluation
4 Different Programs
4.1 Different Subprograms Output 1: Labour intensive cPW
delivered to extremely poor
households headed by females &
males
Activity 1: Identification and
implementation of labour intensive
projects providing an average of 72
days work a year for cPW
beneficiaries ;
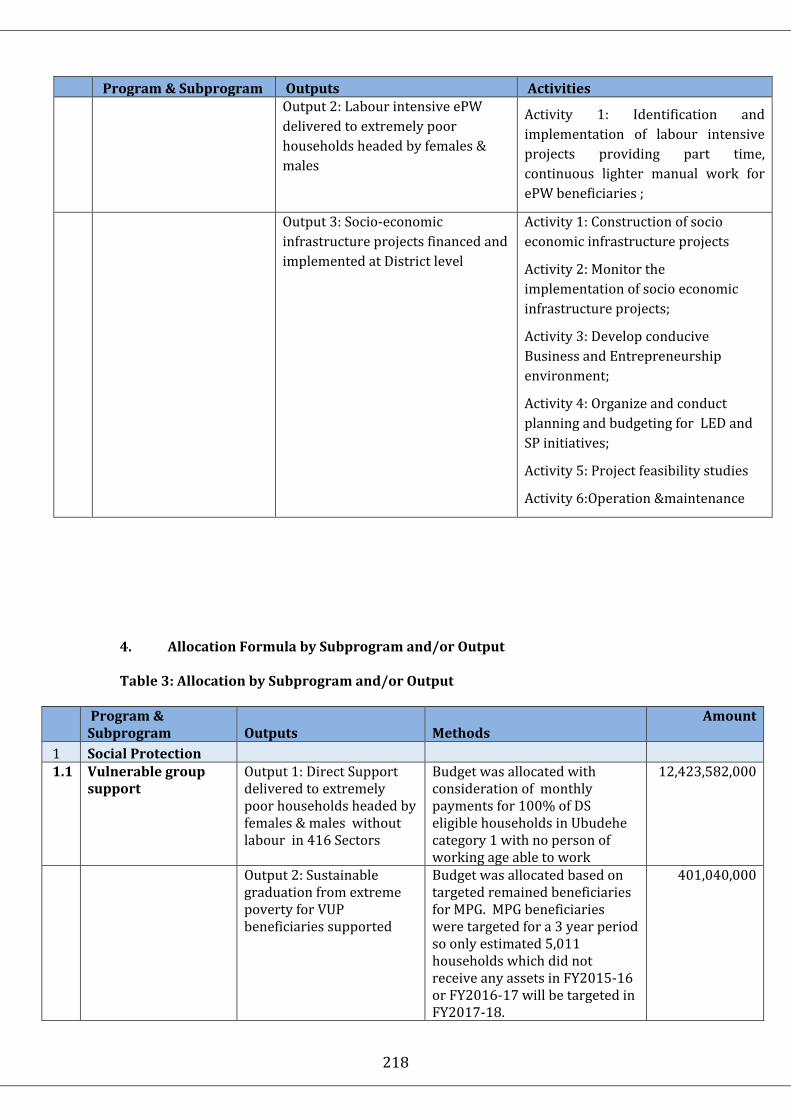
218
Program & Subprogram Outputs Activities
Output 2: Labour intensive ePW
delivered to extremely poor
households headed by females &
males
Activity 1: Identification and
implementation of labour intensive
projects providing part time,
continuous lighter manual work for
ePW beneficiaries ;
Output 3: Socio-economic
infrastructure projects financed and
implemented at District level
Activity 1: Construction of socio
economic infrastructure projects
Activity 2: Monitor the
implementation of socio economic
infrastructure projects;
Activity 3: Develop conducive
Business and Entrepreneurship
environment;
Activity 4: Organize and conduct
planning and budgeting for LED and
SP initiatives;
Activity 5: Project feasibility studies
Activity 6:Operation &maintenance
4. Allocation Formula by Subprogram and/or Output Table 3: Allocation by Subprogram and/or Output
Program & Subprogram Outputs Methods
Amount
1 Social Protection
1.1 Vulnerable group support
Output 1: Direct Support delivered to extremely poor households headed by females & males without labour in 416 Sectors
Budget was allocated with consideration of monthly payments for 100% of DS eligible households in Ubudehe category 1 with no person of working age able to work
12,423,582,000
Output 2: Sustainable graduation from extreme poverty for VUP beneficiaries supported
Budget was allocated based on targeted remained beneficiaries for MPG. MPG beneficiaries were targeted for a 3 year period so only estimated 5,011 households which did not receive any assets in FY2015-16 or FY2016-17 will be targeted in FY2017-18.
401,040,000

219
Program & Subprogram Outputs Methods
Amount
Case workers employed in 30 pilot sectors to support the implementation of the Minimum Package
122,640,000
Output 3: Household &community projects funded at village level in Districts
Ubudehe funds were allocated to Districts basing on number of Villages in Districts;
4,000,000,000
Budget for SP beneficiary Ubudehe proofing & Training was allocated to Districts basing on the number of Villages in Districts.
500,000,215
Output 4: Investment capital to poor households headed by females & males to develop sustainable micro-businesses provided through FS
No new budget allocation to Financial services. Districts are required to use revolving funds in issuance of new loans
0
Output 5: Social protection programs implemented in partnership with civil society organizations
Budget allocation was based on 20% of the VUP sensitization and training budget and 10% of the Livelihoods monitoring budget so that civil society organizations can contribute to the capacity building and monitoring of social protection beneficiaries
688,448,951
Output 5: Local community capacities & VUP beneficiaries’ capacities developed
VUP beneficiary skills development
987,814,708
VUP & Livelihoods Programme Monitoring and Implementation Support
1,195,560,000
2 Agriculture and animal resource intensification
2.1
Soil conservation and land husbandry
Construction of Radical terraces
Procurement: Community approach
Cost estimation: 1,500,000Frw/Ha
Encourage worker to save (30%) for Agricultural Inputs for the next season
1,200,000,000
2.2
Irrigation and water management
Increased area under SSIT
Procurement: Framework contract
Cost estimation: 500,000/Ha
Provision of subsidy (50%)
1,000,000,000
2.4 Inputs to improve soil fertility and management
LIME & COMPOST use to
increase agricultural
productivity (Yield) of
both consolidated and
Lime - Procurement: Framework
contract - Provision of subsidy for
1,000,000,000
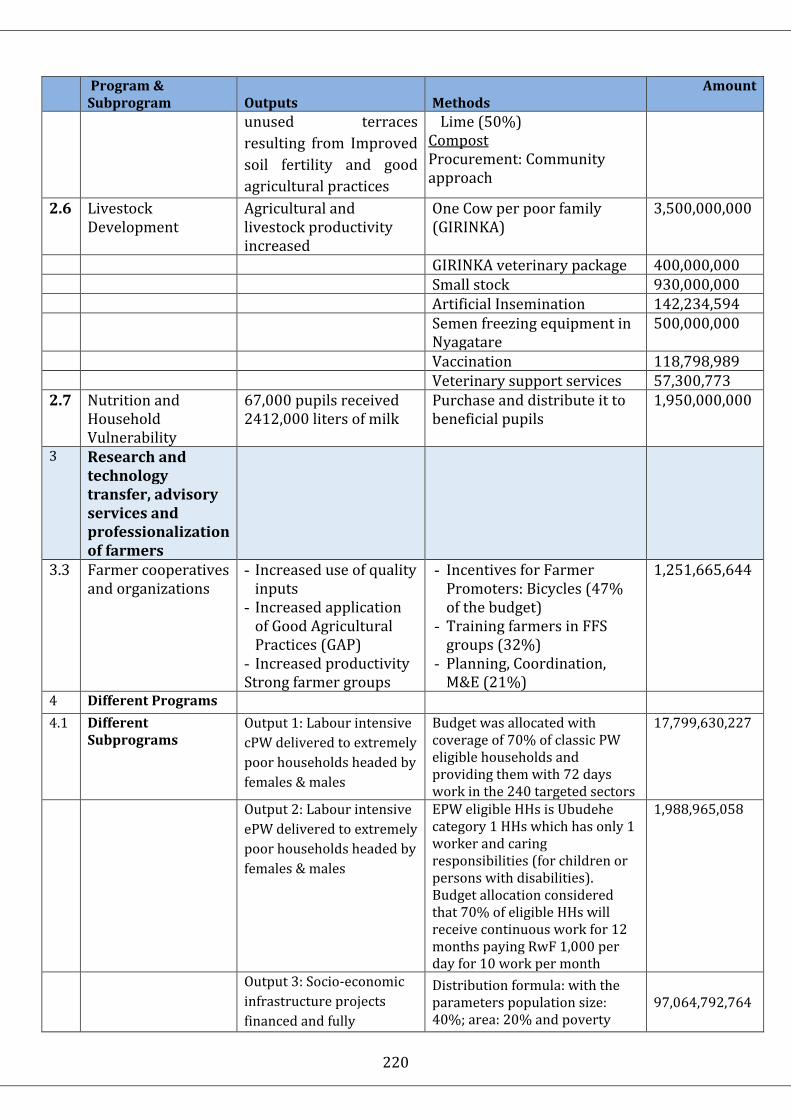
220
Program & Subprogram Outputs Methods
Amount
unused terraces
resulting from Improved
soil fertility and good
agricultural practices
Lime (50%) Compost Procurement: Community approach
2.6 Livestock Development
Agricultural and livestock productivity increased
One Cow per poor family (GIRINKA)
3,500,000,000
GIRINKA veterinary package 400,000,000 Small stock 930,000,000 Artificial Insemination 142,234,594 Semen freezing equipment in
Nyagatare 500,000,000
Vaccination 118,798,989 Veterinary support services 57,300,773 2.7 Nutrition and
Household Vulnerability
67,000 pupils received 2412,000 liters of milk
Purchase and distribute it to beneficial pupils
1,950,000,000
3 Research and technology transfer, advisory services and professionalization of farmers
3.3 Farmer cooperatives and organizations
- Increased use of quality inputs
- Increased application of Good Agricultural Practices (GAP)
- Increased productivity Strong farmer groups
- Incentives for Farmer Promoters: Bicycles (47% of the budget)
- Training farmers in FFS groups (32%)
- Planning, Coordination, M&E (21%)
1,251,665,644
4 Different Programs
4.1 Different Subprograms
Output 1: Labour intensive
cPW delivered to extremely
poor households headed by
females & males
Budget was allocated with coverage of 70% of classic PW eligible households and providing them with 72 days work in the 240 targeted sectors
17,799,630,227
Output 2: Labour intensive
ePW delivered to extremely
poor households headed by
females & males
EPW eligible HHs is Ubudehe category 1 HHs which has only 1 worker and caring responsibilities (for children or persons with disabilities). Budget allocation considered that 70% of eligible HHs will receive continuous work for 12 months paying RwF 1,000 per day for 10 work per month
1,988,965,058
Output 3: Socio-economic
infrastructure projects
financed and fully
Distribution formula: with the parameters population size: 40%; area: 20% and poverty
97,064,792,764

221
Program & Subprogram Outputs Methods
Amount
implemented level: 40%
Equal funds amounting to 3,952,769 RwF was allocated to each District for developing Business and Entrepreneurship in LG.
118,583,070
Planning, budgeting, monitoring &evaluation activities
210,000,000
Coordinated planning & budgeting activities by Province and City of Kigali level basing on the number of Districts
40,527,690
Project feasibility studies 1,400,000,000
Operation &maintenance 1,000,000,000
5. Allocation Formula by Decentralized Entity
Basis of Allocation Formula by Decentralized Budget Agency For different programs and subprograms (decentralized development projects):
Before allocating total envelope of funds local infrastructure projects to Districts in fiscal year 2017/2018, a
special fund was taken from the available funds and it was allocated to Ngororero, Muhanga, Rutsiro,
Nyamasheke, Gakenke and Nyaruguru Districts. The remaining funds were then allocated to Districts based
on population size, District area, and poverty level of District.
Given that City of Kigali is an entity that receives funds from LODA as a Local Government entity, and
considering that applying equalization formula would double the effect on the entity as the latter is made of
other beneficiary entities; its financial share (K) equals the total budget (B) divided by 31. Therefore, formula
is presented as follows:
40% * (B-K) Rwf * pi+ 20% * (B-K) Rwf * si + 40%* (B-K) Rwf * wi
P S W
Thus, the financial allocation was calculated using the above formula as follows:
P stands for the population of Rwanda, and pi the District population;
S stands for the area of Rwanda, and si the area of the District;
wi stands for District welfare index and i and W the sum of the indexes;
B stands for the annual budget allocated to LODA.
With:

222
• Population size: 40% (based on National Census and Habitat data 2012)
• Area: 20%
• Poverty level: 40% (based on EICV2013/2014 data)
For other LED funds, the principles below were considered to allocate funds to Districts:
Equal funds amounting to 3,952,769 RwF was allocated to each District for business and
Entrepreneurship development in LG;
Equal funds amounting to 7,000,000 for reinforcing planning, budgeting, monitoring and evaluation in
LG were allocated and for each Districts;
Funds for reinforcing coordinated planning and budgeting in LG were budgeted at Province and Kigali
City level basing on the number of Districts and were allocated to Huye, Rwamagana, Karongi,
Musanze Districts and CoK;
Equal funds amounting to 33,333,333 for reinforcing operation & maintenance of infrastructures were
allocated to each District.
Equal funds amounting to 46,666,666 for reinforcing project feasibility studies were allocated to each
District.
For the social protection program, vulnerable groups subprogram:
The principles below were guiding the budget allocation for VUP components to Districts:
Classic Public works: cPW eligible HHs are Ubudehe category 1 HHs which are not targeted for DS or
ePW, that is Ubudehe category 1 HHs which have more than one HH member able to work. Therefore,
budget allocation was based on beneficiary payments calculated as a number of eligible HHs in each
targeted sector x 70% of eligible HHs x average 72 days work per household x current sector wage
rate. Allocation has also considered a maximum of 30% of the total project costs for other costs. In
addition to this, allocation to district based on number of targeted beneficiaries in each sector
Expanded Public works: ePW eligible HHs are Ubudehe category 1 HHs which have only 1 worker
and caring responsibilities (for children or persons with disabilities). Budget allocation was based on
70% of targeted HHs in the targeted sectors which will receive continuous part time light manual work
for 12 months paying RwF 10,000 per month based on an average of 10 days work per month.
Allocation is also based on number of targeted beneficiaries in each targeted sector.
Direct Support: DS eligible households are Ubudehe category 1 HHs which have no person of working
age able to work. Budget allocation has considered that 100% of entitled HHs receive payment
according to the DS payment scale
Financial Services: No new budget allocation for financial services. Districts are supposed to issuing
FS loans using revolving funds.
VUP beneficiaries’ Skills Development: The skills development budget comprises three budget lines
namely sensitization, skills Development and financial literacy. Financial literacy is specifically targeted
at loan applicants for financial services loans, where having attended financial literacy training is a
precondition for a financial services loan. The other two are less specific in nature and comprise a fund

223
at the District level for beneficiary sensitization, and training and skills development to support
building livelihoods.
VUP & Livelihoods Programme Monitoring and Implementation Support: In order to support local
government in monitoring and reporting on VUP and livelihoods programs, a budget was allocated to
districts for such purpose. Hence, allocation was based on the number of sectors in each district.
Support to CSO for implementation of SP program: In order to implement and scale up the
partnership between GoR and CSOs for social protection implementation programs, a budget was to
districts for operationalization of such MoUs. Budget allocation to district was based on number sector
implementing VUP components.
Ubudehe projects budget was allocated to Districts basing on number of Villages in Districts;
District allocation: Total budget for Ubudehe projects X No of villages per District Total Number of villages from all Districts
SP beneficiary, ubudehe profiling and training was allocated to district based on the on number of
Villages in Districts.
District allocation: Total budget for Ubudehe training X No of Villages per District Total Number of villages in all Districts

224
Table 4: Allocation by Programme and Sub-programme to Decentralized Entities
PROGRAMS
4000 4100 4200 4300 4400 4500 4600 4700 4800 4900 5000 5100 5200 5300 5400 5500
NGOMA BUGESERA GATSIBO KAYONZA KIREHE NYAGATARE RWAMAGANA HUYE NYAMAGABE GISAGARA MUHANGA KAMONYI NYANZA NYARUGURU RUSIZI NYABIHU
01 Administrative support services
7,000,000
-
245,654,699
86,999,999
162,565,898
-
- - 97,473,963
-
-
7,000,000
325,474,471
-
46,666,666
-
90 Transport
1,304,618,611
1,453,043,973
1,001,838,443
739,867,506
2,651,648,814
5,482,630,241
473,333,049
3,564,367,846
561,460,327
516,295,052
4,278,230,648
477,733,204
1,067,696,260
1,099,381,592
4,584,734,342
2,424,829,930
95 Water And Sanitation
1,434,290,530
1,133,826,420
494,181,068
371,350,070
294,754,595
744,319,315
676,730,096
822,674,859
532,927,056
637,001,186
362,079,268
714,929,934
182,249,953
287,485,886
453,645,344
241,000,600
B1 Social Protection
759,748,692
1,058,448,974
687,988,839
706,371,137
710,233,135
521,921,980
345,518,734
861,199,356
951,250,677
680,670,325
598,724,795
465,753,690
669,960,747
804,613,481
984,491,992
658,305,253
D0 Good Governance And Justice
- 130,091,999
- 73,952,769
22,151,619
149,622,801
137,364,182
21,411,528
- 293,695,154
129,184,768
125,552,999
90,952,768
222,212,421
24,286,102
560,468,325
D1 Education
- 125,000,000
71,626,381
30,000,000
720,372,711
-
- - 18,368,000
15,000,000
-
22,852,124
- 173,293,327
-
-
D2 Health 100,000,000
-
380,946,032
85,000,000
681,000,000
-
- 384,971,575
- 181,613,334
-
-
150,000,000
90,000,000
80,000,000
-
D4 Private Sector Development
118,492,357
3,952,769
402,531,630
106,000,000
87,763,951
666,240,000
- 45,678,000
3,952,769
826,141,334
139,069,800
73,902,000
- 29,597,036
1,250,993,202
-
D5 Agriculture
214,775,349
316,900,071
360,175,538
238,513,689
356,219,438
585,481,390
188,387,228
304,088,463
550,993,318
889,651,494
393,207,706
253,445,739
243,103,186
1,070,399,835
570,719,558
123,875,271
D6 Environment And Natural Resources
150,852,425
35,122,492
97,290,815
162,038,783
39,328,099
144,223,790
56,216,046
97,947,633
175,165,911
198,127,323
781,001,477
39,322,905
118,706,388
54,146,430
65,781,736
160,785,565
D7 Energy 131,554,450
153,672,770
468,829,234
169,382,211
173,458,947
554,965,439
93,291,290
81,055,898
18,649,458
133,675,654
112,966,252
228,157,637
20,532,930
231,379,992
250,189,601
14,481,119
D8 Housing, Urban Development And Land Management
364,723,837
2,150,162,658
459,727,476
399,273,640
643,685,835
858,295,120
361,089,196
240,781,000
183,473,160
802,694,872
574,233,468
542,341,771
334,324,137
1,477,558,839
365,096,720
419,916,502
A6 Land Administration And Land Use Management
- -
- 109,979,260
-
-
- - - -
-
-
- -
-
-
D3 Youth, Sport And Culture
- -
- -
-
-
- - - 105,420,000
-
-
200,000,000
-
-
-
E1 Social Development
0 0 0 0 0 0 0 0 0 0 0 0 0 0 0 0
D9 Economic Development
0 0 0 0 0 0 0 0 0 0 0 0 0 0 0 0
TOTAL 4,586,056,251 6,560,222,126 4,670,790,155 3,278,729,064
6,543,183,042 9,707,700,076 2,331,929,821 6,424,176,158 3,093,714,639 5,279,985,728 7,368,698,182 2,950,992,003 3,403,000,840 5,540,068,839
8,676,605,263 4,603,662,565

225
PROGRAMS 5600 5700 5800 5900 6000 6100 6200 6300 6400 6500 6600 6700 6800 6900 7000 TOTAL
RUBAVU KARONGI NGORORERO NYAMASHEKE RUTSIRO BURERA GICUMBI MUSANZE RULINDO GAKENKE RUHANGO NYARUGENGE KICUKIRO GASABO KIGALI
01 Administrative support services
-
-
14,400,000 139,193,508
89,762,428
- -
- -
21,855,157
7,000,000
-
7,000,000
-
5,229,379
1,263,276,168
90 Transport 5,716,526,005
856,759,007
3,826,738,538 2,360,801,497
1,848,999,886
619,230,821
1,052,279,200
4,629,322,136
697,363,905
1,466,491,773
1,950,837,682
913,886,783
2,544,030,043
1,003,166,397
-
61,168,143,511
95 Water And Sanitation
-
232,261,047
117,000,003
519,212,117
283,658,232
713,294,780
784,928,390
57,861,980
423,982,923
-
-
-
378,641,012
674,031,914
-
13,568,318,578
B1 Social Protection
678,692,493
746,973,835
685,108,358
1,083,969,664 530,978,471
914,717,191
1,079,892,991
689,728,503
760,017,090
667,054,023
762,833,741
353,350,282
394,178,173
651,716,946
-
21,464,413,567
D0 Good Governance And Justice
167,536,953
230,003,866
358,859,923 341,019,112
155,000,000
87,000,019
466,540,325
40,696,997
225,046,494
167,245,685
79,999,999
114,712,768
-
557,619,435
-
4,972,229,011
D1 Education -
-
48,000,000 42,229,430 96,853,780
232,659,631
31,720,578
- 226,547,046
31,000,000
-
-
-
-
-
1,885,523,008
D2 Health -
-
- 154,187,804
57,400,000
- 250,852,832
219,078,755
-
184,000,000
30,000,000
2,212,500,000
-
1,000,578,295
-
6,242,128,627
D4 Private Sector Development
114,128,876
391,532,168
- 1,250,993,202
615,192,769
287,093,179
3,952,769
200,000,000
200,000,000
366,240,000
-
-
3,952,769
-
-
7,187,400,580
D5 Agriculture
349,572,797
450,536,850
471,641,172
1,338,259,304
442,339,050
287,477,467
379,199,464
237,593,015
289,910,260
1,012,061,193
240,179,298
197,809,345
56,260,874
187,175,905
-
12,599,953,267
D6 Environment And Natural Resources
71,247,017
622,212,302
976,225,010
75,338,126
878,362,059
486,646,164
413,920,696
587,417,301
168,892,946
39,292,624
169,924,775
22,451,055
27,449,326
44,251,035
-
6,959,688,254
D7 Energy 46,531,016
67,198,383
301,896,670
96,195,742
206,821,947
246,627,051
99,565,463
63,044,811
37,556,221
254,779,064
363,776,539
38,750,116
45,651,181
218,861,186
-
4,923,498,272
D8 Housing, Urban Development And Land Management
929,263,703
187,861,840
222,674,015
416,404,725
494,178,839
181,092,600
286,396,199
324,114,333
194,060,640
163,748,520
132,971,280
69,036,240
272,014,800
144,534,000
-
14,195,729,965
A6 Land Administration And Land Use Management
-
-
- - - - -
- -
-
-
-
-
-
-
109,979,260
D3 Youth, Sport And Culture
-
-
262,047,047 155,872,934
- - -
- -
-
51,781,552
-
-
-
-
775,121,533
E1 Social Development
0 0 0 0 0 0 0 0 0 0 0 0 0 0 0 -
D9 Economic Development
0 0 0 0 0 0 0 0 0 0 0 0 0 0 8371007734 8,371,007,734
TOTAL 8,073,498,859 3,785,339,298
7,284,590,736 7,973,677,165 5,699,547,461 4,055,838,903 4,849,248,907 7,048,857,831 3,223,377,525 4,373,768,039
3,789,304,866 3,922,496,589 3,729,178,178
4,481,935,113
8,376,237,113
165,686,411,334

226
6 Performance Targets and Indicators Table 5: Performance Indicators by Decentralized Budget Agency for Output
Program & Subprogram Performance Indicator Annual Performance
Target Bugesera Social Protection Vulnerable Group Support
% of DS eligible HHs headed by females & males 100%
No of eligible households headed by females & males benefiting from cPW
4,097
No of eligible households headed by females & males benefiting from ePW
392
Number of asset beneficiary HHs in MPG 450 Burera Social Protection Vulnerable Group Support
% of DS eligible HHs headed by females & males 100%
No of eligible households headed by females & males benefiting from cPW
4,004
No of eligible households headed by females & males benefiting from ePW
393
Number of asset beneficiary HHs in MPG 541 Gakenke Social Protection Vulnerable Group Support
% of DS eligible HHs headed by females & males 100%
No of eligible households headed by females & males benefiting from cPW
2,964
No of eligible households headed by females & males benefiting from ePW
250
Number of asset beneficiary HHs in MPG 151 Gasabo Social Protection Vulnerable Group Support
% of DS eligible HHs headed by females & males 100%
No of eligible households headed by females & males benefiting from cPW
5,610
No of eligible households headed by females & males benefiting from ePW
357
Number of asset beneficiary HHs in MPG 423 Gatsibo Social Protection Vulnerable Group Support
% of DS eligible HHs headed by females & males 100%
No of eligible households headed by females & males benefiting from cPW
5,418
No of eligible households headed by females & males benefiting from ePW
409
Number of asset beneficiary HHs in MPG 110

227
Program & Subprogram Performance Indicator Annual Performance
Target Gicumbi Social Protection Vulnerable Group Support
% of DS eligible HHs headed by females & males 100%
No of eligible households headed by females & males benefiting from cPW
5,287
No of eligible households headed by females & males benefiting from ePW
546
Number of asset beneficiary HHs in MPG 0 Gisagara Social Protection Vulnerable Group Support
% of DS eligible HHs headed by females & males 100%
No of eligible households headed by females & males benefiting from cPW
8,482
No of eligible households headed by females & males benefiting from ePW
688
Number of asset beneficiary HHs in MPG 0 Huye Social Protection Vulnerable Group Support
% of DS eligible HHs headed by females & males 100%
No of eligible households headed by females & males benefiting from cPW
3,510
No of eligible households headed by females & males benefiting from ePW
166
Number of asset beneficiary HHs in MPG 0 Kamonyi Social Protection Vulnerable Group Support
% of DS eligible HHs headed by females & males 100%
No of eligible households headed by females & males benefiting from cPW
2,638
No of eligible households headed by females & males benefiting from ePW
100
Number of asset beneficiary HHs in MPG 187 Karongi Social Protection Vulnerable Group Support
% of DS eligible HHs headed by females & males 100%
No of eligible households headed by females & males benefiting from cPW
5,645
No of eligible households headed by females & males benefiting from ePW
474
Number of asset beneficiary HHs in MPG 515 Kayonza Social Protection Vulnerable Group Support
% of DS eligible HHs headed by females & males 100%

228
Program & Subprogram Performance Indicator Annual Performance
Target No of eligible households headed by females & males
benefiting from cPW
3,270 No of eligible households headed by females & males
benefiting from ePW
163 Number of asset beneficiary HHs in MPG 341 Kicukiro Social Protection Vulnerable Group Support
% of DS eligible HHs headed by females & males 100%
No of eligible households headed by females & males benefiting from cPW
1,047
No of eligible households headed by females & males benefiting from ePW
100
Number of asset beneficiary HHs in MPG 314 Kirehe Social Protection Vulnerable Group Support
% of DS eligible HHs headed by females & males 100%
No of eligible households headed by females & males benefiting from cPW
4,513
No of eligible households headed by females & males benefiting from ePW
433
Number of asset beneficiary HHs in MPG 0 Muhanga Social Protection Vulnerable Group Support
% of DS eligible HHs headed by females & males 100%
No of eligible households headed by females & males benefiting from cPW
2,951
No of eligible households headed by females & males benefiting from ePW
100
Number of asset beneficiary HHs in MPG 2 Musanze Social Protection Vulnerable Group Support
% of DS eligible HHs headed by females & males 100%
No of eligible households headed by females & males benefiting from cPW
2,906
No of eligible households headed by females & males benefiting from ePW
363
Number of asset beneficiary HHs in MPG 0 Ngoma Social Protection Vulnerable Group Support
% of DS eligible HHs headed by females & males 100%
No of eligible households headed by females & males benefiting from cPW
4,764
No of eligible households headed by females & males benefiting from ePW
442
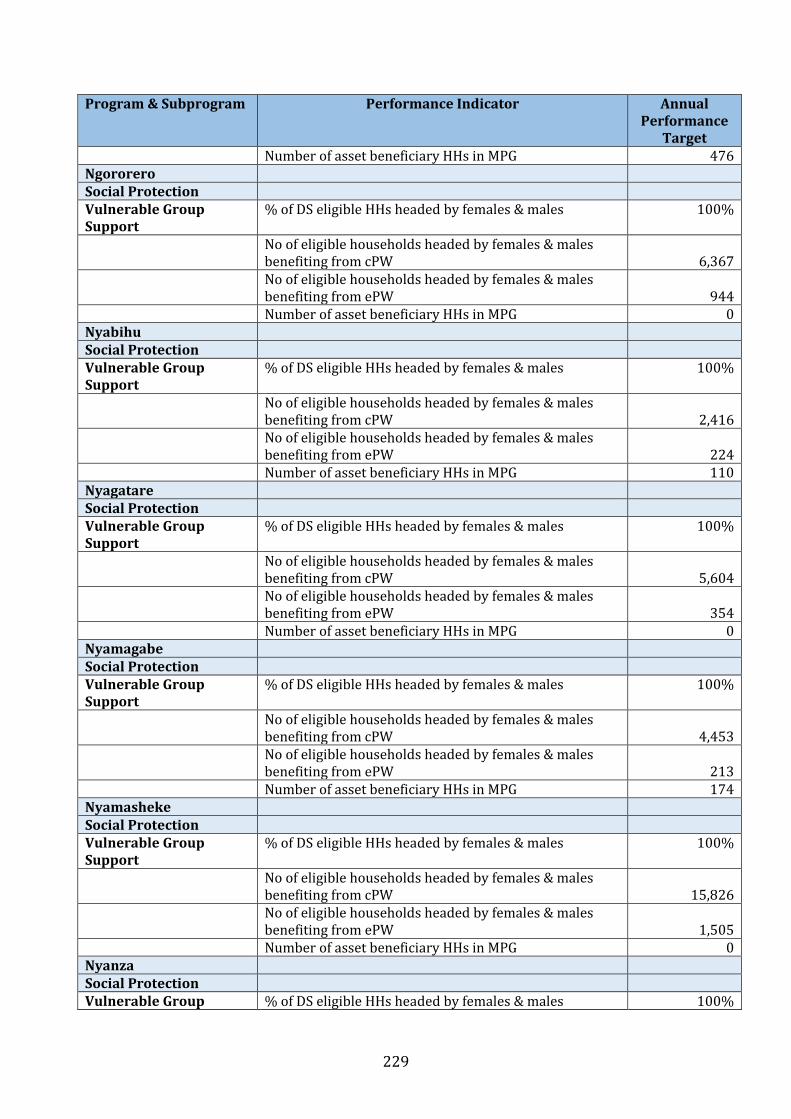
229
Program & Subprogram Performance Indicator Annual Performance
Target Number of asset beneficiary HHs in MPG 476 Ngororero Social Protection Vulnerable Group Support
% of DS eligible HHs headed by females & males 100%
No of eligible households headed by females & males benefiting from cPW
6,367
No of eligible households headed by females & males benefiting from ePW
944
Number of asset beneficiary HHs in MPG 0 Nyabihu Social Protection Vulnerable Group Support
% of DS eligible HHs headed by females & males 100%
No of eligible households headed by females & males benefiting from cPW
2,416
No of eligible households headed by females & males benefiting from ePW
224
Number of asset beneficiary HHs in MPG 110 Nyagatare Social Protection Vulnerable Group Support
% of DS eligible HHs headed by females & males 100%
No of eligible households headed by females & males benefiting from cPW
5,604
No of eligible households headed by females & males benefiting from ePW
354
Number of asset beneficiary HHs in MPG 0 Nyamagabe Social Protection Vulnerable Group Support
% of DS eligible HHs headed by females & males 100%
No of eligible households headed by females & males benefiting from cPW
4,453
No of eligible households headed by females & males benefiting from ePW
213
Number of asset beneficiary HHs in MPG 174 Nyamasheke Social Protection Vulnerable Group Support
% of DS eligible HHs headed by females & males 100%
No of eligible households headed by females & males benefiting from cPW
15,826
No of eligible households headed by females & males benefiting from ePW
1,505
Number of asset beneficiary HHs in MPG 0 Nyanza Social Protection Vulnerable Group % of DS eligible HHs headed by females & males 100%

230
Program & Subprogram Performance Indicator Annual Performance
Target Support No of eligible households headed by females & males
benefiting from cPW
5,995 No of eligible households headed by females & males
benefiting from ePW
474 Number of asset beneficiary HHs in MPG 0 Nyarugenge Social Protection Vulnerable Group Support
% of DS eligible HHs headed by females & males 100%
No of eligible households headed by females & males benefiting from cPW
1,890
No of eligible households headed by females & males benefiting from ePW
113
Number of asset beneficiary HHs in MPG 25 Nyaruguru Social Protection Vulnerable Group Support
% of DS eligible HHs headed by females & males 100%
No of eligible households headed by females & males benefiting from cPW
7,388
No of eligible households headed by females & males benefiting from ePW
324
Number of asset beneficiary HHs in MPG 298 Rubavu Social Protection Vulnerable Group Support
% of DS eligible HHs headed by females & males 100%
No of eligible households headed by females & males benefiting from cPW
4,984
No of eligible households headed by females & males benefiting from ePW
335
Number of asset beneficiary HHs in MPG 0 Ruhango Social Protection Vulnerable Group Support
% of DS eligible HHs headed by females & males 100%
No of eligible households headed by females & males benefiting from cPW
8,413
No of eligible households headed by females & males benefiting from ePW
544
Number of asset beneficiary HHs in MPG 68 Rulindo Social Protection Vulnerable Group Support
% of DS eligible HHs headed by females & males 100%
No of eligible households headed by females & males benefiting from cPW
2,238
No of eligible households headed by females & males

231
Program & Subprogram Performance Indicator Annual Performance
Target benefiting from ePW 258
Number of asset beneficiary HHs in MPG 204 Rusizi Social Protection Vulnerable Group Support
% of DS eligible HHs headed by females & males 100%
No of eligible households headed by females & males benefiting from cPW
2,948
No of eligible households headed by females & males benefiting from ePW
222
Number of asset beneficiary HHs in MPG 482 Rutsiro Social Protection Vulnerable Group Support
% of DS eligible HHs headed by females & males 100%
No of eligible households headed by females & males benefiting from cPW
5,690
No of eligible households headed by females & males benefiting from ePW
1,067
Number of asset beneficiary HHs in MPG 31 Rwamagana Social Protection Vulnerable Group Support
% of DS eligible HHs headed by females & males 100%
No of eligible households headed by females & males benefiting from cPW
1,575
No of eligible households headed by females & males benefiting from ePW
100
Number of asset beneficiary HHs in MPG 113 Grand Total Social Protection Vulnerable Group Support
% of DS eligible HHs headed by females & males 100%
No of eligible households headed by females & males benefiting from cPW
142,893
No of eligible households headed by females & males benefiting from ePW
12,053
Number of asset beneficiary HHs in MPG 5,011
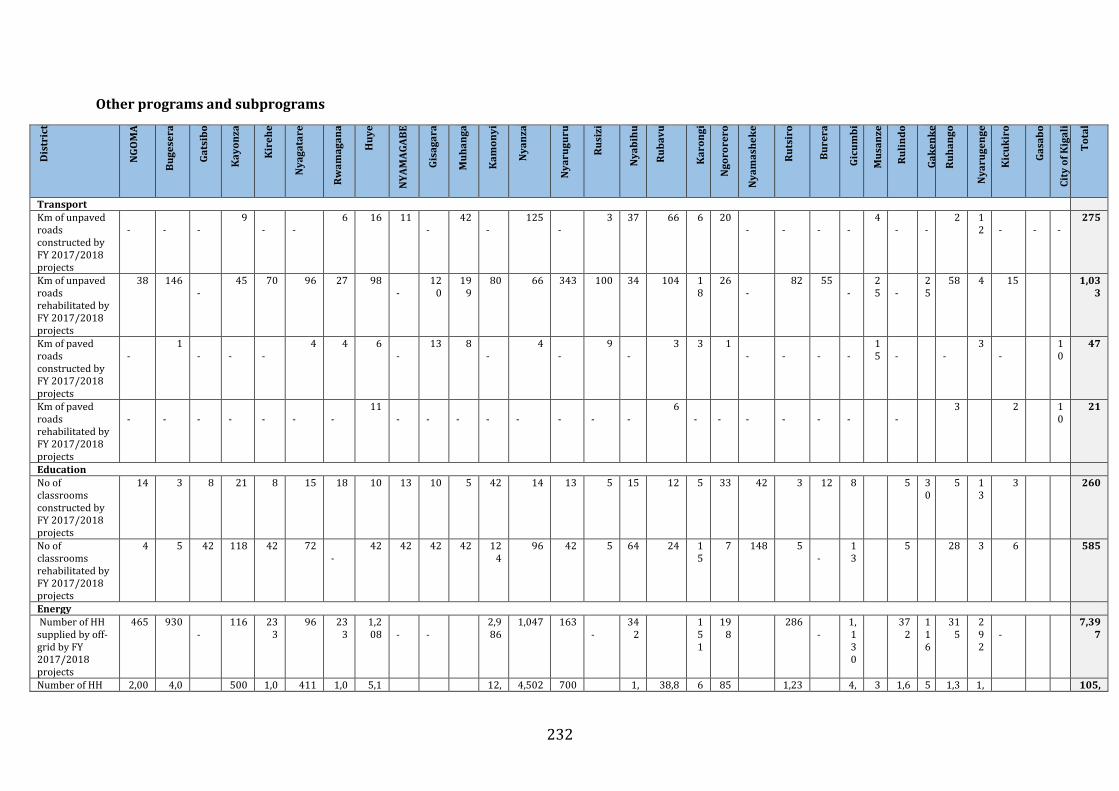
232
Other programs and subprograms
Dis
tric
t
NG
OM
A
Bu
ge
sera
Ga
tsib
o
Ka
yo
nza
Kir
eh
e
Ny
ag
ata
re
Rw
am
ag
an
a
Hu
ye
NY
AM
AG
AB
E
Gis
ag
ara
Mu
ha
ng
a
Ka
mo
ny
i
Ny
an
za
Ny
aru
gu
ru
Ru
sizi
Ny
ab
ihu
Ru
ba
vu
Ka
ron
gi
Ng
oro
rero
Ny
am
ash
ek
e
Ru
tsir
o
Bu
rera
Gic
um
bi
Mu
san
ze
Ru
lin
do
Ga
ke
nk
e
Ru
ha
ng
o
Ny
aru
ge
ng
e
Kic
uk
iro
Ga
sab
o
Cit
y o
f K
iga
li
To
tal
Transport Km of unpaved roads constructed by FY 2017/2018 projects
-
-
-
9 -
-
6 16 11 -
42 -
125 -
3 37 66 6 20 -
-
-
-
4 -
-
2 12
-
-
-
275
Km of unpaved roads rehabilitated by FY 2017/2018 projects
38 146 -
45 70 96 27 98 -
120
199
80 66 343 100 34 104 18
26 -
82 55 -
25
-
25
58 4 15 1,033
Km of paved roads constructed by FY 2017/2018 projects
-
1 -
-
-
4 4 6 -
13 8 -
4 -
9 -
3 3 1 -
-
-
-
15
-
-
3 -
10
47
Km of paved roads rehabilitated by FY 2017/2018 projects
-
-
-
-
-
-
-
11 -
-
-
-
-
-
-
-
6 -
-
-
-
-
-
-
3 2 10
21
Education No of classrooms constructed by FY 2017/2018 projects
14 3 8 21 8 15 18 10 13 10 5 42 14 13 5 15 12 5 33 42 3 12 8 5 30
5 13
3 260
No of classrooms rehabilitated by FY 2017/2018 projects
4 5 42 118 42 72 -
42 42 42 42 124
96 42 5 64 24 15
7 148 5 -
13
5 28 3 6 585
Energy Number of HH supplied by off-grid by FY 2017/2018 projects
465 930 -
116 233
96 233
1,208
-
-
2,986
1,047 163 -
342
151
198
286 -
1,130
372
116
315
292
-
7,397
Number of HH 2,00 4,0 500 1,0 411 1,0 5,1 12, 4,502 700 1, 38,8 6 85 1,23 4, 3 1,6 5 1,3 1, 105,

233
Dis
tric
t
NG
OM
A
Bu
ge
sera
Ga
tsib
o
Ka
yo
nza
Kir
eh
e
Ny
ag
ata
re
Rw
am
ag
an
a
Hu
ye
NY
AM
AG
AB
E
Gis
ag
ara
Mu
ha
ng
a
Ka
mo
ny
i
Ny
an
za
Ny
aru
gu
ru
Ru
sizi
Ny
ab
ihu
Ru
ba
vu
Ka
ron
gi
Ng
oro
rero
Ny
am
ash
ek
e
Ru
tsir
o
Bu
rera
Gic
um
bi
Mu
san
ze
Ru
lin
do
Ga
ke
nk
e
Ru
ha
ng
o
Ny
aru
ge
ng
e
Kic
uk
iro
Ga
sab
o
Cit
y o
f K
iga
li
To
tal
supplied by off-grid by FY 2017/2018 projects
0 00 - 00 00 95 - - 838
- 469
08 50
0 0 - 857
4,866
00 00
54 255
- 479
Water and sanitation Km of water pipelines constructed by FY 2017/2018 projects
30 30 57 -
-
98 61KM
4 30 -
29 60 -
112 -
-
52 -
37 -
66 38 65
52 -
4 20
15 520
Km of water pipelines rehabilitated by FY 2017/2018 projects
87 -
-
20 35 -
3 53 20 47 95 -
-
10 15 20
52 -
30 -
123
7 11 -
15 426
HH with access due to FY 2017/2018 Water supply projects
1,628
5,814
465 4,884
2,326
2,871
84 1,595
2,372
-
3,721
6,512
698 233
-
1,25
6
686 744 898
814
-
824
-
925
-
-
17,310
HH with access due to FY 2017/2018 Water supply projects (persons)
69,532
7,000
25,00
0
2,000
21,00
0
10,000
12,34
7
360 6,860
10,20
0
16,00
0
67,981
28,000
3,000
1,00
0
73,600
-
5,40
0
2,950
3,200
3,862
3,500
3,545
16,78
0
3,976
65,000
297,794
Environment & NR Area planted with new forest trees by FY 2017/2018 projects (ha)
200 60 80 250 246
1,200
1,700
150 170
3,200
1,350
1,850 391 50 2,00
0
900 230
100
300 400 416
5,000
525
121
700
150
725
19 15,227
Agriculture Radical terraces (Ha)
80,000
-
-
-
80,000
-
-
-
-
80,000
-
-
-
80,000
80,000
-
-
0 80000
0 8000
0
240000
0 0 0 800,000
Small scale irrigation (Ha)
80 100 108
180 80 180 80 90 0 120
60 60 90 50 61.3333
61.3
20 61.
24.8
24.8 20 61.33
61.
61.
50 50
90 24.
24.8 24.
2,000
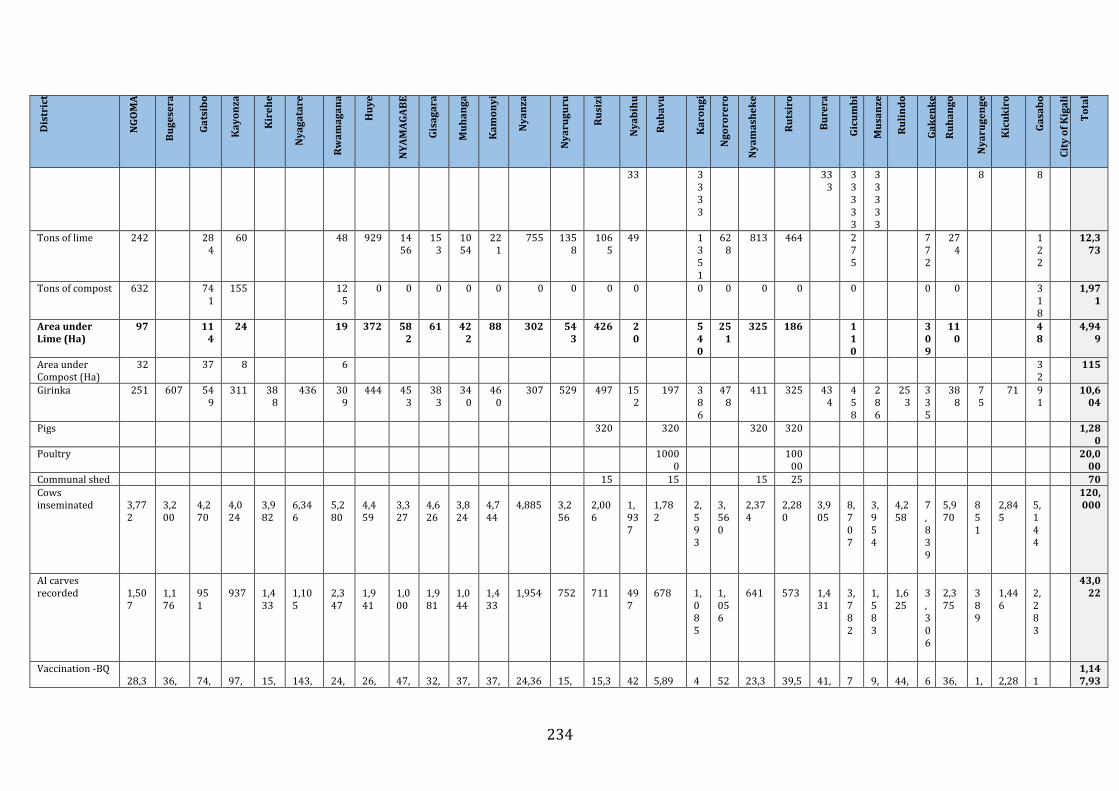
234
Dis
tric
t
NG
OM
A
Bu
ge
sera
Ga
tsib
o
Ka
yo
nza
Kir
eh
e
Ny
ag
ata
re
Rw
am
ag
an
a
Hu
ye
NY
AM
AG
AB
E
Gis
ag
ara
Mu
ha
ng
a
Ka
mo
ny
i
Ny
an
za
Ny
aru
gu
ru
Ru
sizi
Ny
ab
ihu
Ru
ba
vu
Ka
ron
gi
Ng
oro
rero
Ny
am
ash
ek
e
Ru
tsir
o
Bu
rera
Gic
um
bi
Mu
san
ze
Ru
lin
do
Ga
ke
nk
e
Ru
ha
ng
o
Ny
aru
ge
ng
e
Kic
uk
iro
Ga
sab
o
Cit
y o
f K
iga
li
To
tal
33 3333
333
33333
33333
8 8
Tons of lime 242 284
60 48 929 1456
153
1054
221
755 1358
1065
49 1351
628
813 464 275
772
274
122
12,373
Tons of compost 632 741
155 125
0 0 0 0 0 0 0 0 0 0 0 0 0 0 0 0 318
1,971
Area under Lime (Ha)
97 114
24 19 372 582
61 422
88 302 543
426 20
540
251
325 186 110
309
110
48
4,949
Area under Compost (Ha)
32 37 8 6 32
115
Girinka 251 607 549
311 388
436 309
444 453
383
340
460
307 529 497 152
197 386
478
411 325 434
458
286
253
335
388
75
71 91
10,604
Pigs 320 320 320 320 1,280
Poultry 10000
10000
20,000
Communal shed 15 15 15 25 70 Cows inseminated
3,772
3,200
4,270
4,024
3,982
6,346
5,280
4,459
3,327
4,626
3,824
4,744
4,885
3,256
2,006
1,937
1,782
2,593
3,560
2,374
2,280
3,905
8,707
3,954
4,258
7,839
5,970
851
2,845
5,144
120,000
AI carves recorded
1,507
1,176
951
937
1,433
1,105
2,347
1,941
1,000
1,981
1,044
1,433
1,954
752
711
497
678
1,085
1,056
641
573
1,431
3,782
1,583
1,625
3,306
2,375
389
1,446
2,283
43,022
Vaccination -BQ 28,3
36,
74,
97,
15,
143,
24,
26,
47,
32,
37,
37,
24,36
15,
15,3
42
5,89
4
52
23,3
39,5
41,
7
9,
44,
6
36,
1,
2,28
1
1,147,93

235
Dis
tric
t
NG
OM
A
Bu
ge
sera
Ga
tsib
o
Ka
yo
nza
Kir
eh
e
Ny
ag
ata
re
Rw
am
ag
an
a
Hu
ye
NY
AM
AG
AB
E
Gis
ag
ara
Mu
ha
ng
a
Ka
mo
ny
i
Ny
an
za
Ny
aru
gu
ru
Ru
sizi
Ny
ab
ihu
Ru
ba
vu
Ka
ron
gi
Ng
oro
rero
Ny
am
ash
ek
e
Ru
tsir
o
Bu
rera
Gic
um
bi
Mu
san
ze
Ru
lin
do
Ga
ke
nk
e
Ru
ha
ng
o
Ny
aru
ge
ng
e
Kic
uk
iro
Ga
sab
o
Cit
y o
f K
iga
li
To
tal
03 722 257
220 058
697 723
159 441
651
577
612
2 676 04 ,250
1 6,633
,143
27 00 123
0,949
633
718
1,147
928
043
0 3,609
6
Vaccination- FMD
35,000
25,000
10,000
22,000
10,000
102,000
Vaccination -LSD
25,945
39,495
68,069
89,119
13,803
131,722
28,663
23,979
43,487
29,930
34,445
34,478
22,332
14,369
14,029
38,729
5,400
42,747
47,798
21,383
46,291
37,696
65,036
8,830
40,992
56,051
33,851
1,956
2,090
12,475
1,075,19
0
Vaccination -Rabies
205
200
154
200
175
200
350
800
200
300
200
250
350
300
350
150
250
400
250
350
250
300
750
350
180
250
300
210
250
300
8,774
Vaccination - RVF
7,500
15,000
3,500
12,500
7,500
25,000
10,000
6,000
6,500
13,000
7,500
2,000
2,500
5,000
650
1,143
2,500
127,793
Vaccination -Brucellosis
2,359
7,227
6,188
8,102
1,255
11,975
2,060
2,180
3,953
2,721
3,131
3,134
2,030
1,306
1,275
3,521
491
3,886
4,345
1,944
4,208
3,427
5,912
803
3,727
5,096
3,077
87
190
1,134
100,744
Number of farmers registered
37,840
45,520
48,240
32,960
48,960
50,320
38,640
40,640
42,880
41,920
26,480
25,120
33,600
26,560
47,280
37,840
36,080
42,9
33,520
47,040
38,640
45,680
50,4
34,5
39,520
49,
42,720
9,12
10,480
22,8
1,127,76
0
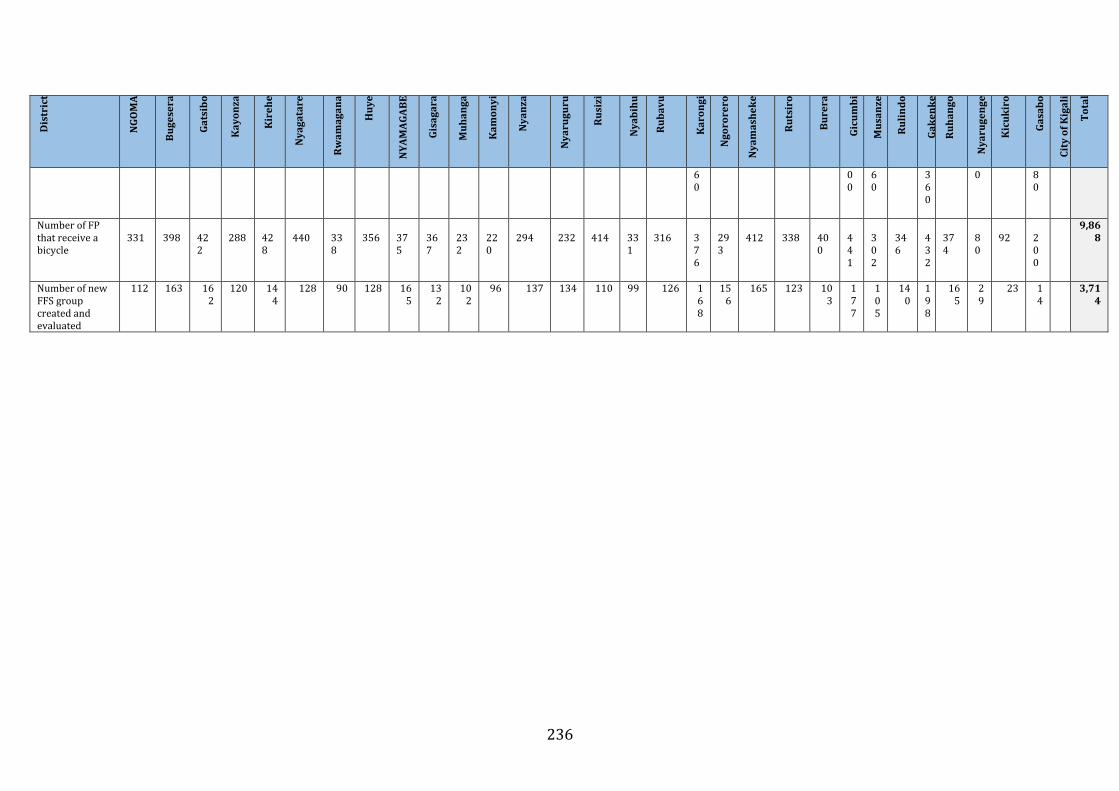
236
Dis
tric
t
NG
OM
A
Bu
ge
sera
Ga
tsib
o
Ka
yo
nza
Kir
eh
e
Ny
ag
ata
re
Rw
am
ag
an
a
Hu
ye
NY
AM
AG
AB
E
Gis
ag
ara
Mu
ha
ng
a
Ka
mo
ny
i
Ny
an
za
Ny
aru
gu
ru
Ru
sizi
Ny
ab
ihu
Ru
ba
vu
Ka
ron
gi
Ng
oro
rero
Ny
am
ash
ek
e
Ru
tsir
o
Bu
rera
Gic
um
bi
Mu
san
ze
Ru
lin
do
Ga
ke
nk
e
Ru
ha
ng
o
Ny
aru
ge
ng
e
Kic
uk
iro
Ga
sab
o
Cit
y o
f K
iga
li
To
tal
60
00
60
360
0 80
Number of FP that receive a bicycle
331
398
422
288
428
440
338
356
375
367
232
220
294
232
414
331
316
376
293
412
338
400
441
302
346
432
374
80
92
200
9,868
Number of new FFS group created and evaluated
112 163 162
120 144
128 90 128 165
132
102
96 137 134 110 99 126 168
156
165 123 103
177
105
140
198
165
29
23 14
3,714
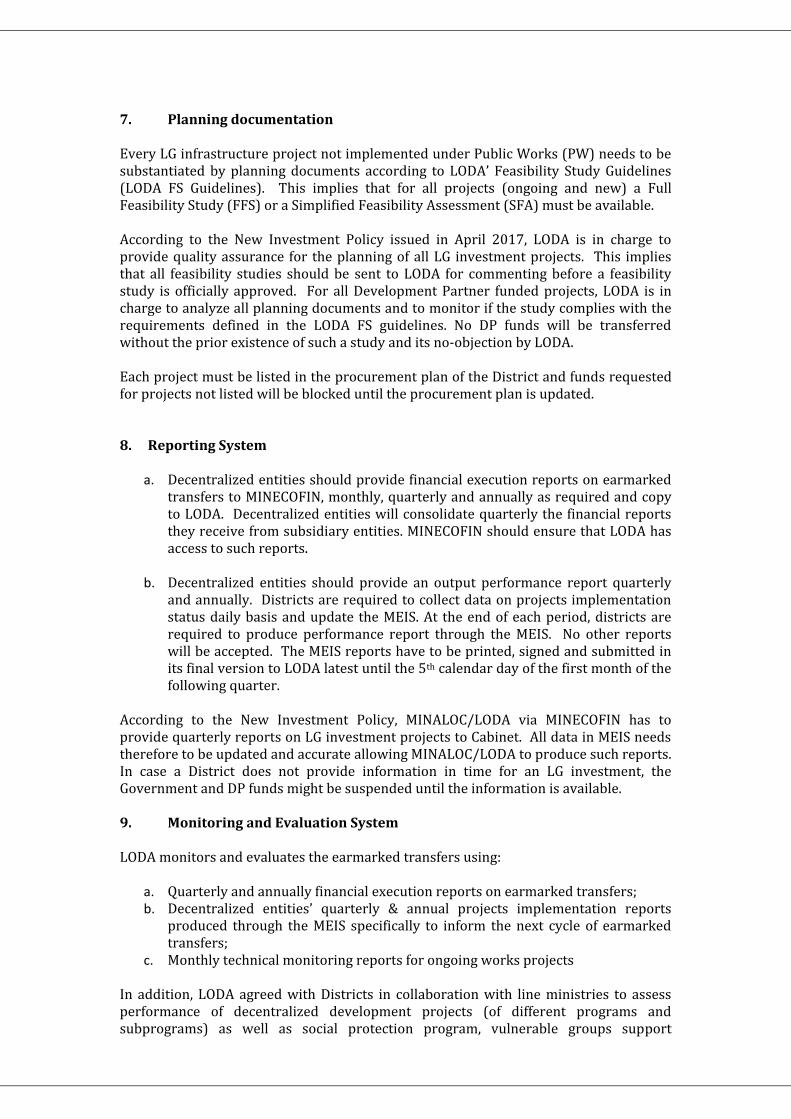
7. Planning documentation Every LG infrastructure project not implemented under Public Works (PW) needs to be substantiated by planning documents according to LODA’ Feasibility Study Guidelines (LODA FS Guidelines). This implies that for all projects (ongoing and new) a Full Feasibility Study (FFS) or a Simplified Feasibility Assessment (SFA) must be available. According to the New Investment Policy issued in April 2017, LODA is in charge to provide quality assurance for the planning of all LG investment projects. This implies that all feasibility studies should be sent to LODA for commenting before a feasibility study is officially approved. For all Development Partner funded projects, LODA is in charge to analyze all planning documents and to monitor if the study complies with the requirements defined in the LODA FS guidelines. No DP funds will be transferred without the prior existence of such a study and its no-objection by LODA. Each project must be listed in the procurement plan of the District and funds requested for projects not listed will be blocked until the procurement plan is updated. 8. Reporting System
a. Decentralized entities should provide financial execution reports on earmarked transfers to MINECOFIN, monthly, quarterly and annually as required and copy to LODA. Decentralized entities will consolidate quarterly the financial reports they receive from subsidiary entities. MINECOFIN should ensure that LODA has access to such reports.
b. Decentralized entities should provide an output performance report quarterly
and annually. Districts are required to collect data on projects implementation status daily basis and update the MEIS. At the end of each period, districts are required to produce performance report through the MEIS. No other reports will be accepted. The MEIS reports have to be printed, signed and submitted in its final version to LODA latest until the 5th calendar day of the first month of the following quarter.
According to the New Investment Policy, MINALOC/LODA via MINECOFIN has to provide quarterly reports on LG investment projects to Cabinet. All data in MEIS needs therefore to be updated and accurate allowing MINALOC/LODA to produce such reports. In case a District does not provide information in time for an LG investment, the Government and DP funds might be suspended until the information is available. 9. Monitoring and Evaluation System LODA monitors and evaluates the earmarked transfers using:
a. Quarterly and annually financial execution reports on earmarked transfers; b. Decentralized entities’ quarterly & annual projects implementation reports
produced through the MEIS specifically to inform the next cycle of earmarked transfers;
c. Monthly technical monitoring reports for ongoing works projects In addition, LODA agreed with Districts in collaboration with line ministries to assess performance of decentralized development projects (of different programs and subprograms) as well as social protection program, vulnerable groups support

subprogram at the district level through regular reports, field visits and regular meetings with sector specialists at the decentralized budget agency level. Requests for transfer will only be granted if the reports to be produced in the MEIS provide sufficient information and are updated to justify the transfer. All transfer related reports should be produced by the MEIS, printed and be signed. The same holds true for the submission of monthly technical monitoring reports. 10. Disbursement Schedule and Conditions Table 6: Disbursement Modalities by Program/Subprogram Program & Subprogram Frequency Destination Beneficiary Social Protection Vulnerable Groups Support For all Outputs Quarterly District VUP beneficiaries Agriculture and animal resource intensification
Soil conservation and land husbandry
Quarterly District Local community
Irrigation and water management Quarterly District Contractor Inputs to improve soil fertility and management (Lime and Compost)
Quarterly District Local community & Contractor
Livestock Development (Girinka and Small Stock)
Quarterly District Contractor
Research and technology transfer, advisory services and professionalization of farmers
Farmer cooperatives and organizations: TWIGIRE
Quarterly District Local community & Contractor
Different Programs Different Subprograms Output 1: Socio-economic infrastructure projects financed and implemented
Quarterly District Service Providers (Contractors); Districts
a. Decentralized entities have the responsibility to provide cash flow plans for all
earmarked transfers and to make commitment accordingly. Commitment can be done for direct payment or for indirect payment by transferring funds to the decentralized entity’s account;
b. However, on the basis of instructions provided by LODA, the Treasury reserves the right to withhold any transfers committed by the Decentralized entity;
c. In such a case, the concerned Decentralized entity will formally be informed to take corrective actions, failure of which will attract sanctions as prescribed by the Law