reqno jrc59826 jrc-2010-energy efficiency and co2 emissions prospective...
TRANSCRIPT

EUR 24592 EN - 2010
Energy Efficiency and CO2 Emissions: Prospective Scenarios
for the Cement Industry
J.A. Moya, N. Pardo, A. Mercier

The mission of the JRC-IE is to provide support to Community policies related to both nuclear and non-nuclear energy in order to ensure sustainable, secure and efficient energy production, distribution and use. European Commission Joint Research Centre Institute for Energy Contact information Address: P.O. Box 2, 1755 ZG Petten, the Netherlands E-mail: [email protected] Tel.: +31-224-565244 Fax: +31-224-565616 http://ie.jrc.ec.europa.eu/ http://www.jrc.ec.europa.eu/ Legal notice Neither the European Commission nor any person acting on behalf of the Commission is responsible for the use which might be made of this publication.
Europe Direct is a service to help you find answers to your questions about the European Union.
Freephone number (*):
00 800 6 7 8 9 10 11
(*) Certain mobile telephone operators do not allow access to 00 800 numbers or these calls may be billed.
A great deal of additional information on the European Union is available on the Internet. It can be accessed through the Europa server http://europa.eu/ JRC 59826 EUR 24592 EN ISBN 978-92-79-17644-9 ISSN 1018-5593
doi:10.2790/25732
Luxembourg: Publications Office of the European Union, 2010
© European Union, 2010
Reproduction is authorised provided the source is acknowledged. Printed in the Netherlands

3
INDEX Executive summary............................................................................................................. 8 1. Introduction................................................................................................................... 10
1.1 Raw materials in cement......................................................................................... 10 1.2 Kinds of cement, depending on composition.......................................................... 11 1.3 Properties of different kinds of cement................................................................... 13
2. Main technologies and processes in cement manufacture ............................................ 17 2.1 Preparing/grinding the raw materials...................................................................... 18 2.2 Producing the clinker .............................................................................................. 18 2.3 Clinker cooler and finish grinding .......................................................................... 20
3. Policy context................................................................................................................ 22 3.1 IPPC Directive ........................................................................................................ 22
3.1.1 Best available technology for cement manufacture ......................................... 23 3.2 The Kyoto Protocol and the EU emission trading scheme ..................................... 23 3.3 Other relevant European legislation........................................................................ 25 3.4 Sectoral approach.................................................................................................... 25
4. Sector indicators............................................................................................................ 27 4.1 State of the industry ................................................................................................ 27 4.2 Energy consumption in cement manufacture in EU27 ........................................... 28 4.3 CO2 emissions......................................................................................................... 30
5. Reference plants............................................................................................................ 32 5.1 Use of fuels in the European industry; Fuels used in the reference plant............... 33 5.2 Clinker-to-cement ratio in the European industry: Raw materials used in the reference plant............................................................................................................... 36 5.3 Size and age of the European industry: Size and age of the reference plants......... 38 • Kilns...................................................................................................................... 38 • Cement mills ......................................................................................................... 41 • Clinker cooler........................................................................................................ 42 Summary of the reference plants .................................................................................. 43 5.4 Economics of the reference plants .......................................................................... 43
6. Methodology ................................................................................................................. 51 6.1 Demand ................................................................................................................... 51 6.2 Construction of the model....................................................................................... 55 6.3 Energy efficiency measures and reductions in CO2 emissions............................... 58 • Retrofitting of rotary kilns .................................................................................... 59 • Conversion to a reciprocating grate cooler ........................................................... 59 • Final grinding........................................................................................................ 60 • Heat recovery for power generation ..................................................................... 60 • Carbon capture and storage (CCS) ....................................................................... 61 6.4 Other potential energy efficiency and GHG emission measures not considered in the model....................................................................................................................... 63 • New cements and other technologies at the research stage .................................. 63
7. Modelling...................................................................................................................... 64 7.1 Adjustment to energy consumption data for the scenarios ..................................... 64 7.2 Scenarios ................................................................................................................. 65 7.3 Conclusions............................................................................................................. 76
8. BIBLIOGRAPHY......................................................................................................... 77

4
FIGURES
Figure 1: Chemical composition of cement and clinker substitutes [4] [CEMBUREAU 2006] ........ 12
Figure 2: Mass balance for 1 kg of cement ............................................................................................. 16
Figure 3: Processes and system boundaries in cement production [1] [CEMBUREAU 1999a] ..... 18
Figure 4: Rotary kiln technologies and functional zones [9] [Van Oss 2002] .................................... 19
Figure 5: Use of waste and biomass instead of fossil fuels in the cement industry reduced European absolute emissions by 11 Mt of CO2 in 2005 Source: [58] [Vanderborght 2008] . 34
Figure 6: Share of non-conventional fuels in the specific consumption per tonne of clinker (toe/t) [60] [ODYSSEE 2008] ..................................................................................................................... 35
Figure 7: Benchmarking of the specific energy consumption for cement production in 2005 [60] [ODYSSEE 2008] ..................................................................................................................... 37
Figure 8: Distribution of kiln capacity per technology by age in 2002 ................................................. 39
Figure 9: Percentage of facilities with a specific number of kilns (by technology) ............................ 40
Figure 10: Capacity installed by technology and age The ‘Dry’ category includes preheater kilns, kilns with preheater and pre-calciner and dry long kilns. The ‘Semi-dry’ category includes semi-dry and semi-wet kilns. .......................................................................................................... 41
Figure 11: Distribution of the number of mills by age in 2002 (left-hand figure) and by mill capacity (right-hand figure)............................................................................................................................. 42
Figure 12: Cement production in EU27 and the world since 1950 [3] [BREF 2010]......................... 52
Figure 13: Cement consumption per capita [42] [CEMBUREAU 2009c] ............................................ 53
Figure 14: Commodity intensity of cement [71] [LAFARGE 2008]....................................................... 53
Figure 15: Prices of hydrocarbon imports into Europe .......................................................................... 54
Figure 16: Method used to decide whether or not to carry out retrofitting If all the answers to the first criterion (payback period) are no, no retrofitting is carried out in that facility. In cases where several retrofittings meet the first criterion, the second criterion is applied to select which one is carried out. ................................................................................................................. 56
Figure 17: Algorithm of the cement plant model ..................................................................................... 57
Figure 18: Historical number of plants commissioned or major retrofittings....................................... 58
Figure 19: Past trends in energy efficiency in the non-metallic minerals industry [46] [European Commission 2007] and trend in energy efficiency in industry [60] [ODYSSEE 2008] ........... 58
Figure 20: CFD of European thermal energy per tonne of clinker from 1990 to 2007 (left-hand figure) and results of the model from 2002 to 2007 (right-hand figure).................................... 64

5
Figure 21: CFD of electricity consumption in Europe per tonne of cement from 1990 to 2007 (left-hand figure) and results of the model from 2002 to 2007 (right-hand figure).......................... 65
Figure 22: Weighted average thermal consumption over the simulation period for cases BS, BSInf and BSInfNrc and reference range ................................................................................................ 66
Figure 23: Total thermal energy consumption up to 2030 in a scenario with and without changes in the technology used ......................................................................................................................... 67
Figure 24: Weighted average electricity consumption over the simulation period for cases BS, BSInf, BSInfNrc and BM.................................................................................................................. 68
Figure 25: Weighted average CO2 emissions for cases BS, BSInf and BSInfNrc and reference range for gross CO2 emissions ...................................................................................................... 69
Figure 26: Trends in the technologies used over time in the baseline scenario ................................ 69
Figure 27: Electricity price that makes the investment profitable as a function of the internal rate of return for four different amounts of electricity recovered............................................................ 71
Figure 28: Price of CO2 allowances that makes CCS investments profitable as a function of the discount rate for two different investment costs for post-combustion given in the literature. 72
Figure 29: Weighted average thermal consumption over the simulation period for cases Ref 1x, 2x and 5x and reference range............................................................................................................ 73
Figure 30: Weighted average CO2 emissions over the simulation period for cases Ref 1x, 2x and 5x and BM ......................................................................................................................................... 74
Figure 31: Weighted average thermal consumption over the simulation period for cases Ref 25.8, 50, 100 and 150 €/t CO2 and reference range ............................................................................. 75
Figure 32: Weighted average CO2 emissions over the simulation period for cases Ref 25.8, 50, 100 and 150 €/t CO2 and reference range ................................................................................... 75

6
TABLES
Table 1: Chemical analysis of cement raw meal [3] [BREF 2010]....................................................... 11
Table 2: Typical composition of various cement types.......................................................................... 13
Table 3: Typical mineral composition of Portland cement [8] [USGS 2005] ...................................... 14
Table 4: Trend in the number of cement plants in EU countries between 1995 and 2006 [43] [CEMBUREAU 2000], [3] [BREF 2010]................................................................................. 27
Table 5: Trend in the shares of cement production technologies from 1997 to 2008....................... 28
Table 6: Specific thermal energy demand by technology ..................................................................... 29
Table 7: Range of CO2 emissions as a function of the fuel used and the kind of technology [53] [IPCC 2006], (*) [54] [EIA 2009] ............................................................................................. 30
Table 8: Fuel consumption expressed as percentage of heat generation by the cement industry in EU27 in 2006 [3] [BREF 2010]....................................................................................................... 33
Table 9: Market shares for the five main types of cement defined in standard EN197-1 in Europe in 2004 [4] [CEMBUREAU 2006] ................................................................................................... 37
Table 10: Number of mills by technology ................................................................................................ 42
Table 11: Summary of the old reference plant (ORP) and the new reference plant (NRP) ............. 43
Table 12: Capital cost for the NRP ........................................................................................................... 44
Table 13: Relative investment costs for different clinker capacity [15] [Alsop 2005] ........................ 45
Table 14: Relative investment costs for different manufacturing technologies .................................. 45
Table 15: Breakdown of the annual fixed costs for the NRP ................................................................ 45
Table 16: Breakdown of the variable costs for the new reference plant ............................................. 46
Table 17: Energy consumption by the technologies of each clinker cooler........................................ 48
Table 18: Relative electricity consumption for different cement mill technologies ............................ 49
Table 19: Annual costs for the NRP ......................................................................................................... 49
Table 20: Relative costs of the feasible retrofitting options as a percentage of an average greenfield investment....................................................................................................................... 59
Table 21: Investment costs for a greenfield CCS post-combustion plant ........................................... 62
Table 22: Annual fixed costs for a greenfield CCS post-combustion plant ........................................ 62
Table 23: Variable costs for a greenfield CCS post-combustion plant................................................ 63
Table 24: Electricity price that makes waste heat recovery cost-effective as a function of the electricity recovered per tonne of clinker ...................................................................................... 71

7
Table 25: CO2 allowance prices needed to make the investment attractive under several decision criteria ................................................................................................................................................ 73

8
Executive summary Meeting the ambition of the EU energy and climate change policy of decarbonising the energy system by 80 % by 2050 will require reinvention of the European energy system between now and 2050 and have a profound effect on its technology mix. The EU Strategic Energy Technology Plan (SET-Plan) is the technology pillar of the EU’s energy and climate policy. It was adopted in 2008 by the European Council and the European Parliament as the EU’s response to speed up the development of a world-class mix of affordable, clean, efficient and low-emission energy technologies through coordinated research efforts. The SET-Plan is currently in the implementation phase, moving towards establishment of large-scale programmes such as the European Industrial Initiatives (EIIs) that bring together industry, the research community, the Member States and the Commission in risk-sharing, public-private partnerships on development of key energy technologies at European level. Six priority technologies have already been identified as the focal points of the first EIIs: wind, solar, electricity grids, bioenergy, carbon capture and storage and sustainable nuclear fission. So far, no such comprehensive R&DD technology master plan, equivalent to the framework created by the SET-Plan for the energy supply sector, exists for energy-intensive industries. However, in recent years, new public-private partnerships have been set up in various fields for energy-intensive industries using different instruments and legal bases. Furthermore, a number of existing initiatives and laws already provide incentives and stimulate markets for innovative products and services. Among the main instruments in place are the Emission Trading Scheme (ETS) Directive, the REACH and cosmetics legislation, the Action Plan on Sustainable Consumption and Production and Sustainable Industrial Policy, the revised Eco-Design Directive, the Lead Market Initiative (LMI), etc. Recognising the importance of innovation as a precondition for a knowledge-based, low-carbon economy, the Commission Communication on reviewing Community innovation policy in a changing world (COM(2009) 442) proposed submitting to the Council, in spring 2010, a European Innovation Act encompassing all the conditions for sustainable development to enhance the governance of the EU innovation system. This innovation framework provides a timely opportunity to investigate the added value which could be offered by a European Action Plan on energy-intensive industries in the wake of the SET-Plan. This also responds to the recommendations made by the Council and the European Parliament, at the time

9
of adoption of the SET-Plan in 2008, to investigate ways to broaden the scope of technology priorities within the SET-Plan: ‘Further Industrial Initiatives may be necessary, and therefore the Council encourages the Commission to continue to examine areas with great potential such as marine energy, energy storage and energy efficiency for this purpose’, European Council, April 2008. ‘[The European Parliament] Calls on the Commission to add energy efficiency technologies, including co- and polygeneration, to the areas covered by the EIIs…’, European Parliament, June 2008. This document, prepared under the auspices of the SET-Plan Information System (SETIS), aims to assess the current role of technological innovation in improving energy efficiency and reducing CO2 emissions in the cement industry, the foreseeable technological developments and their market potential. The first chapter gives an introduction to what cement is, its raw materials, its composition and its hydraulic properties. The second chapter describes the processes and technologies employed to manufacture it. The EU regulations applicable are described in the third chapter. The fourth outlines the current state of the industry in the European Union. The fifth chapter focuses on two selected reference plants, one representative of current facilities, the other representing new facilities. The sixth chapter describes the method developed to study trends in this sector, based on cost-benefit analysis of the options of retrofitting at facility level, introducing new facilities and phasing out uncompetitive ones. The last chapter analyses three scenarios: a baseline scenario in which current trends in cement manufacture are maintained and two alternative scenarios, the first including a sensitivity analysis on different fuel prices and the second with different CO2 prices. The results show that, with the technological improvements available today, a thermal energy improvement of around 10 % is possible between 2006 and 2030 and a decrease of about 4 % in CO2 emissions from clinker manufacturing. However, the insensitivity of the alternative scenarios to higher CO2 and fuel prices prove that the large number of retrofits economically feasible in the base line scenario leave little room for any additional improvements in the industry.

10
1. Introduction Cement is a finely ground, non-metallic, inorganic powder which, when mixed with water, forms a paste that sets and hardens. This hydraulic hardening is primarily due to the formation of calcium silicate hydrates as a result of the reaction between water and the constituents of the cement. Cement is a basic material for building and civil engineering. In Europe use of cement and concrete (a mixture of cement, aggregates, sand and water) in large civic works can be traced back to antiquity. Nowadays, output from the cement industry is directly related to the state of the construction business in general and therefore tracks the overall economic situation closely [1] [CEMBUREAU 1999a]. The most important use of cement is for production of concrete, binding the other key ingredients (water, sand and gravel). Cement typically accounts for up to 12 % of the entire concrete mix [1] [CEMBUREAU 1999a]. Concrete is the most used man-made material in the world. Every year almost three tonnes of concrete are produced in the world per person, twice as much as all other materials together, including wood, steel, plastics and aluminium [2] [Aïtcin 2000]. Clinker, the main component of cement, is obtained from calcination of limestone. Four processes are currently available to produce clinker: wet, semi-wet, semi-dry and dry. The main steps in cement production are (i) preparing and grinding the raw materials, (ii) producing the intermediate clinker and (iii) grinding and blending the clinker with other products to make cement.
1.1 Raw materials in cement
Cement is a closely controlled chemical combination of calcium, silicon, aluminium, iron and small amounts of other ingredients to which gypsum is added in the final grinding process to regulate the setting time of the concrete. Table 1 shows examples of ranges from chemical analysis of raw meal [3] [BREF 2010] and the sources of these components. Apart from the main components, these raw materials also contain small quantities of other metals.

11
Components rich in Raw material source Percentage in the raw meal (*)
Calcium (CaO) Limestone, chalk, marble, calcareous marl
40-45
Silicon (SiO2) Iron (Fe2O3)
Sand, marl, marly clay, shale, clay
12-16 1.5-2.5
Aluminium (Al2O3) Kaolin, fly ash
2-5
Loss on ignition 32-36
Table 1: Chemical analysis of cement raw meal [3] [BREF 2010]
1.2 Kinds of cement, depending on composition
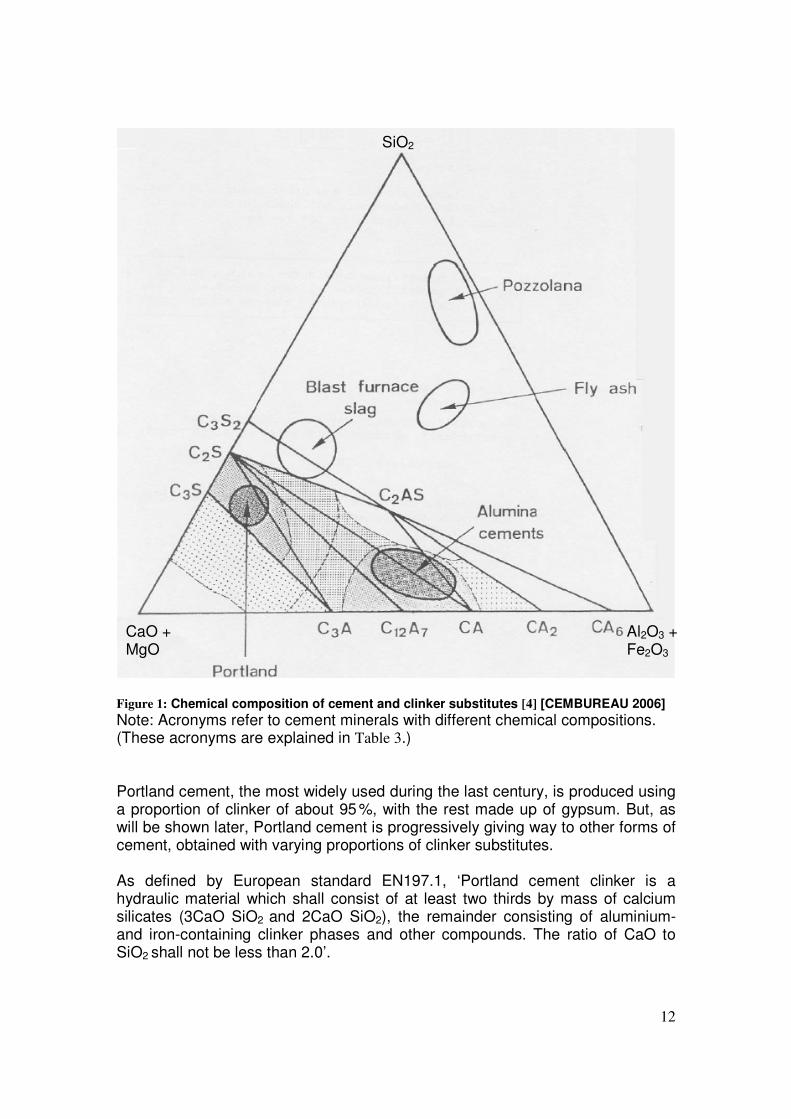
Rankin diagrams are useful to illustrate the different compositions of cement. Each of the three corners of the diagram (see Figure 1) represents one of the pure basic chemical building blocks of cement. Each edge of the triangle represents different ratios of the components of the adjoining vertices with nothing of the component in the opposite corner. Lines parallel to each edge have a fixed amount of the component in the opposite corner and a varying ratio of the other two components. The different kinds of cement have different ratios of the three building blocks.
12
Figure 1: Chemical composition of cement and clinker substitutes [4] [CEMBUREAU 2006]
Note: Acronyms refer to cement minerals with different chemical compositions. (These acronyms are explained in Table 3.)
Portland cement, the most widely used during the last century, is produced using a proportion of clinker of about 95 %, with the rest made up of gypsum. But, as will be shown later, Portland cement is progressively giving way to other forms of cement, obtained with varying proportions of clinker substitutes. As defined by European standard EN197.1, ‘Portland cement clinker is a hydraulic material which shall consist of at least two thirds by mass of calcium silicates (3CaO SiO2 and 2CaO SiO2), the remainder consisting of aluminium- and iron-containing clinker phases and other compounds. The ratio of CaO to SiO2 shall not be less than 2.0’.
Al2O3 +
Fe2O3 CaO + MgO
SiO2

13
One additive that can be fed into the kiln (kilns are large ovens in which calcination and sintering take place) to produce clinker is steel slag as a substitute for limestone. This material requires little or no additional fuel to convert it into cement clinker. Other options to reduce energy requirements and CO2 emissions are to use waste products with similar properties to the clinker, such as fly ash, granulated blast furnace slag or natural pozzolana.
Fly ash is one residue from combustion of coal. Fly ash is generally captured from the chimneys of coal-fired power plants. Its components include silicon dioxide (SiO2) and calcium oxide (CaO), both of which are endemic ingredients in many coal-bearing rock strata [5] [US FHA 2003].
Granulated blast furnace slag is obtained when the molten slag produced in the iron blast furnace is quenched rapidly by water. When crushed or milled to very fine cement-sized particles it has cementitious properties [6] [US DoT 2009]. Natural pozzolana is a natural fine volcanic ash, first found in the volcanic region of Pozzuoli, near Naples (Italy). Natural pozzolana can also come from diatomaceous earth (earth mainly composed of siliceous skeletons of diatoms). When natural clays or shales treated in the range of 600 to 900°C become pozzolanic those materials are then referred to as ‘calcined pozzolans’ [7] [Soroka 1993]. The typical composition of various cement types is shown in Table 2.
Cement type Portland cement
%
Portland fly-ash cement
%
Blast furnace cement
%
Pozzolanic cement mixes
%
Clinker 95-100 65-94 5-64 45-89 Fly ash 6-35 Blast furnace slag 36-95 Pozzolana 11-55 Other constituents (gypsum)
0-5 0-5 0-5 0-5
Table 2: Typical composition of various cement types
1.3 Properties of different kinds of cement
The relative proportions of the different minerals that form the clinker are adjusted to achieve the desired functional properties of the cement. Main clinker components:

14
Description Chemical
formula
Notation in terms of oxide groupings
Short notation
Typical percentage
Tri-calcium silicate (‘alite’) Ca3SiO5 (CaO)3 SiO2 C3S 50-70
Di-calcium silicate (‘belite’) Ca2SiO4 (CaO)2 SiO2 C2S 10-30
Tricalcium aluminate Ca3Al2O6 (CaO)3 Al2O3 C3A 3-13
Tetracalcium aluminoferrite Ca4Al2Fe2O10 (CaO)4 Al2O3 Fe2O3 C4AF 5-15
Calcium sulphate dehydrate (gypsum)
CaSO4 2H2O10 (CaO) (SO3) (H2O)2 3-7
Table 3: Typical mineral composition of Portland cement [8] [USGS 2005]
The reactions that the cement undergoes in the hydration process are complex and not completely understood. Part of the problem is that the hydration process usually happens unevenly, forming shells in which part of the hydrated mineral is formed around a mineral core, slowing the reaction and affecting the stoichometry [8] [USGS 2005]. The mineral C3S (alite) hydrates quickly and therefore imparts early strength and set to cement, whereas C2S (belite) hydrates slowly and is the main contributor of long-term strength. The final strength of the cement will hinge not only on the original content of C2S and C3S but also on the completeness of their hydration. If not allowed to dry, the resulting solid from the hydration of C3S gains strength with time, mainly during the first 7 to 10 days [7] [Soroka 1993]. C2S hydrates more slowly. Provided enough moisture is present, it continues developing more strength for weeks and months. The hydration reactions that develop the strength are:
For C3S: 2C3S + 6H (water) —> C3S2H3 (tormorite gel) + 3 CH (hydrated lime); For C2S: 2C2S + H —> C3S2H3 + CH.
The formula for tormorite is only approximate. In fact a whole family of silicate hydrates (C-S-H) are formed. The C-S-H is the actual binder of the cement [8] [USGS 2005]. Hydration of C3A is almost instantaneous and highly exothermic. This mineral therefore speeds up development of early strength and set. Gypsum is used to control this. However, an excess of gypsum or exposure of the hardened concrete to sulphate-rich groundwater can cause a sulphate attack (there is a big volume difference between some of the compounds that C3A forms with the sulphates; the result can be cracking or spalling of the cement) [8] [USGS 2005]. If the concrete is going to be exposed to sulphate attack, the amount of C3A has to be very limited. The main function of the aluminoferrite (C4AF) is to help to lower the temperature at which the clinkering mineral (especially C3S) forms (‘clinkering temperature’) [9] [Van Oss 2002]. It does not contribute to any particular hydraulic property of the final cement.

15
White cements are in the high range of C3S, at the expense of C2S content, and at the same time have an extremely low C4AF content to avoid the colouring effects of iron [8] [USGS 2005]. This is the reason why the thermal energy consumption of white cements is twice the average thermal consumption of cement manufacture. Alkalis can combine with C-S-H forming prone to swell complex hydrates and, at the same time, can react with various forms of silica, weakening the bond between the aggregates and the cements and forming higher volume phases [8] [USGS 2005]. The cracks produced can further increase attacks of the core of the concrete and can produce freeze-thaw damage in cold weather. The hydration of C3S and C2S releases free lime (CH), equivalent overall to around 25 to 33 % of the original CaO content of the clinker [8] [USGS 2005]. This lime can have two side-effects: it can help to protect the steel reinforcing bars in the concrete from corrosion (if oxygen and water reach the rebar through cracks) but, at the same time, it increases the reactivity of the surfaces and can leach out in unseen fashion. Materials like fly ash, capable of reacting with free lime (CH) to produce strength-building hydrate phases, are called pozzolanic materials. The pozzolanic reaction in the abbreviated notation is:
CH (hydrated lime) + SH (pozzolanic materials) —> CSH. Addition of pozzolanic materials such as fly ash and slag to cement generally improves its workability, durability and long-term strength. The performance of such cements varies significantly, depending on the source and proportion of the cementitious materials. Often, however, the concrete shows slower hydration, slower setting and lower early-age strength, especially in cold weather conditions [10] [Wang 2003]. The increased workability obtained with use of fly ash can be attributed to the spherical shape of fly ash particles, which can increase the workability of cement while reducing its water demand [5] [US FHA 2003]. On the one hand, the small pore interconnectivity (permeability) and the decrease in free lime improve the long-term durability of such cements. On the other, because of the content of porous unburned coal in the fly ash, loss on ignition (LOI) has to be controlled as it increases the water demand and decreases the frost resistance [11] [Ludwig 2009] (an increase in the amount of water adversely affects the properties of concrete [7] [Soroka 1993]). Granulated blast furnace slag also has hydraulic properties and needs an alkaline or sulphate activator to generate the hydraulic reaction. In a similar way to other pozzolanic cements, the reactivity of the material depends greatly on the grade of ground of the blast furnace slag, but in general terms these cements

16
have higher resistance to sulphate attacks and lower heat of hydration and need more time to set than ordinary Portland cements [6] [US DoT 2009]. Figure 2 shows a mass balance for production of 1kg of cement using the dry process with petcoke as fuel.
Figure 2: Mass balance for 1 kg of cement Source: [3] [BREF 2010]

17
2. Main technologies and processes in
cement manufacture There are four main process routes for manufacturing cement: the dry process, the semi-dry process, the semi-wet process and the wet process. The choice of process is largely determined by the state of the raw materials (dry or wet). A large part of world clinker production is still based on wet processes. However, in Europe, around 90 % of production is based on dry processes thanks to the availability of dry raw materials [3] [BREF 2010]. Wet processes are more energy-consuming and, thus, more expensive. Plants using semi-dry processes are likely to switch to dry technologies whenever expansion or major improvement is required [12] [Grydgaard 1998]. Plants using wet or semi-wet processes normally have access to only moist raw materials. Future new investments in wet technology can be expected to prove a remarkable exception to the general trend of phasing out this technology [13] [Kapphahn 2009]. All these process routes include the same three main activities that can be summarised as: (i) preparing/grinding the raw materials, (ii) producing the intermediate clinker and (iii) grinding and blending the clinker with other products to make cement (see Figure 3). The activity in which the biggest difference in the manufacturing process appears is in preparing and grinding the raw materials. All processes use rotary kilns for the second stage (notwithstanding that there are big differences in those kilns: the length of the wet-process kilns ranges from 120 to 180 m, with an internal diameter from around 4.5 to 7 m, whereas in the modern dry technology the length ranges are typically 45 to 75 m, with internal diameters of 3.5 to 4.5 m [8] [USGS 2005]).

18
Figure 3: Processes and system boundaries in cement production [1] [CEMBUREAU 1999a]
2.1 Preparing/grinding the raw materials
The aqueous slurry fed into the kiln in the oldest (wet) process was an effective solution to the problem of achieving a thorough mix of the crushed materials [8] [USGS 2005]. The advantage of this process is the possibility to adjust very precisely the chemical composition of the raw material before it is fed into the kiln [14] [Aïtcin 2008]. Its main disadvantage is the large amount of energy needed to evaporate the water in the slurry. In the semi-wet and semi-dry processes the wet paste is granulated or extruded before being dried, first mechanically in filter presses or pelletisers. Once dewatered, the resulting cake is extruded in pellets and can be fed into a grate preheater or a cake drier prior to the kiln. In the dry process, the raw materials need efficient homogenisation before grinding. The subsequent grinding and the physical characteristics attained (fineness and particle size distribution) are of great importance to the ensuing burning process. The solid fuels will have to undergo similar grinding and storage before they are fed into the kiln.
2.2 Producing the clinker
The common component in all production of cement is the use of huge rotating furnaces (kilns) to calcinate and sintering the raw materials. All kilns are made of steel lined with firebrick, have a horizontal layout with a slight slope (2.5 to 4 %) and turn at about 0.5 to 5.0 revolutions per minute [3] [BREF 2010]. It is said that without any doubt rotary kilns are the largest pieces of moving manufacturing equipment in existence [8] [USGS 2005]). Kilns are fed from their upper end and the raw materials tumble towards the lower end, progressively increasing in

19
temperature. At the lower end, where the combustion takes place, the combustion gases reach 2000°C and the material temperature reaches around 1450°C. This intense heat triggers chemical and physical changes that produce the clinker; the calcium oxide reacts with silica, alumina and ferrous oxide to form silicates, aluminates and ferrites.
Figure 4: Rotary kiln technologies and functional zones [9] [Van Oss 2002]
Depending on the technology, the different stages prior to sintering can take place in the kiln itself or elsewhere. In the wet process the raw materials are dried in the kiln. Preheating of the raw meal also takes place in the kiln in the wet and long dry kilns. The other dry technologies add a specific component ─ ‘the preheater tower’ ─ to this end. Preheater towers provide a more efficient way to recover the heat of the combustion gases. They consist of a series of vertical cyclone chambers supported in a tower of more than 60 m [3] [BREF 2010]. Hot exit gases from the kiln heat the raw meal as they swirl through the cyclones. Cyclone preheater kilns have developed rapidly since the 1950s [15] [Alsop 2005]. The four-stage cyclone preheater kiln system was a standard technique in the ’70s. In kilns with preheaters, by the time the meal is fed in calcination is already about 30 % completed, because the meal is already heated to a temperature of around 850°C using the exhaust gases [3] [BREF 2010]. Kiln gas is cooled typically from 1150°C to 350°C. The number of cyclones will not depend exclusively on the optimum building cost compared with future savings of fuel consumption; the waste heat required for raw material drying also plays a decisive role [15] [Alsop 2005].

20
The latest development in modern kilns has been the addition of a pre-calciner between the rotary kiln and the preheater. Additional combustion takes place in this chamber. Up to 65 % of the total fuel can be burned at this level. Calcination levels of well above 90 % can be achieved [15] [Alsop 2005]. The pre-calciner has made it possible to shorten the length of the kiln by half and at the same time allowed scaling-up of production to over 3.5 Mt [15] [Alsop 2005]. Calcination simply strips the carbon dioxide from the minerals that carry it (mainly the limestone):
CaCO3 + heat —> CaO + CO2.
In the range of temperatures in which the calcination takes place (around 800 to 1200°C) other clay minerals also break down into their component oxides. In this stage there is also initial formation of C2S that continues in the sintering zone.
An additional advantage of the pre-calciners is the relatively low temperatures required for the calcination. This lower temperature than needed for the sintering (above 1300°C) allows use of lower quality fuels. A well designed pre-calciner system is capable of using up to 100 % petcoke or low-calorific, slow-reacting alternative fuels [16] [Nobis 2009].
No matter which technology is used, sintering (clinkering) reactions take place in the kiln. Many complex phenomena are involved, but an approximate net reaction to form clinker (in simplified notation) is as follows [8] [USGS 2005]:
29 C + 8S + 2A + F —> 6C3S + 2C2S + C3A + C4AF. C3S starts to form at around 1250 to 1400°C, but in the absence of Al2O3 or Fe2O3 the process is extremely slow, even at 1500°C. The presence of C3A and, especially, C3AF notably decreases the temperature at which C3S is formed, allowing meaningful production of C3S in the temperature range of 1400-1450°C [8] [USGS 2005].
2.3 Clinker cooler and finish grinding
The clinker cooler decreases the temperature from 1200°C at which the clinker leaves the kiln to 100°C. This cooling not only allows safe handling of the clinker but also stops further changes of the clinker mineral [8] [USGS 2005]. The air used to cool the clinker is subsequently used to feed the kiln or pre-calciner burners [15] [Alsop 2005]. The adjustment of the clinker cooler radically affects the energy efficiency of the plant and, due to the high thermal load that occurs, determines the reliability of the entire kiln system [16] [Nobis 2009].

21
The trend in cooler design is related to the main technological challenges: thermal expansion, wear, incorrect air flows and availability. Of the two big groups of coolers ─ rotary and grate coolers ─ the former is no longer used and is being replaced by the latest designs of grate coolers. In travelling grate coolers, the oldest design, the clinker is transported by a travelling grate. This technology ceased to be used in new installations in around 1980 [3] [BREF 2010]. In the second generation of grate coolers, reciprocating grate coolers, the clinker is moved by pushing the clinker bed, step by step, by the front edges of alternate rows of plates [3] [BREF 2010]. The latest generation of grate coolers, introduced in the 2000s, is focusing on conveying the clinker and air distribution systems separately and in optimised fashion [3] [BREF 2010]. These latest systems are characterised by (i) excess heat recovery of, in general, 70 %, although it can go up to 80 %, (ii) good clinker distribution, (iii) fewer movable components, with no parts exposed to heat, (iv) no clinker fall-through; (v) low specific cooling air requirements, (vi) lower electricity consumption and (vii) lower building height and quick installation thanks to their modular design [16] [Nobis 2009]. Once the clinker is cooled, it may be blended with clinker substitutes and then ground into finished cement in a cement mill. The final cement is much finer than cosmetic talcum powder [8] [USGS 2005]. The fineness of cement is determined using tests that measure the total surface area of a given unit of mass of cement powder. The fineness of cement is usually expressed relative to the Blaine air-permeability test, in cm2/g. The fineness of the final product normally ranges from 3000 to 4000 cm2/g. The final grinding of the cement involves the highest power consumption in cement manufacturing. The chemistry of the clinker and the burning conditions have great influence over the clinker grindabilty: the higher the belite (C2S) content, the harder the clinker is to grind [15] [Alsop 2005]. The technology and processes used for grinding the raw materials in dry processes and in the final grinding of the cement are quite similar. The main difference is that in most plants raw materials are also dried in the mill (with gas from the preheaters) [15] [Alsop 2005]. The technology most widely used is the ball mill — partly because it is the oldest — notwithstanding that those mills are highly inefficient. Energy efficiency factors are the main reason why ball mills are now rarely installed and new vertical roller mills and high-pressure grinding rolls are taking over [17] [Auxilia 2009]. Nowadays more than 80 % of new raw materials mills are vertical roller mills [15] [Alsop 2005].

22
3. Policy context
3.1 IPPC Directive
The cornerstone of the European regulations to minimise pollution from industrial production is the Integrated Pollution Prevention and Control (IPPC) Directive [18] [Directive 2008/1/EC], which replaced Directive 1996/61/EC [19]. This Directive applies to industrial production processes, including installations for production of cement clinker in rotary kilns with a production capacity exceeding 500 tonnes per day.
New installations, and existing installations which are subject to ‘substantial changes’, have been required to meet the requirements of the IPPC Directive since 30 October 1999. Other existing installations had to be brought into line by 30 October 2007.
This Directive establishes a procedure for authorising such activities and sets minimum requirements to be included in all permits, particularly on pollutants released. In order to receive a permit, each industrial installation must comply with certain basic obligations. In particular [20] [European Commission 2009d], operators must:
• use all appropriate pollution prevention measures, i.e. the best available techniques;
• use energy efficiently;
• prevent all large-scale pollution;
• prevent, recycle or dispose of waste in the least polluting way possible;
• ensure accident prevention and damage limitation;
• return sites to their original state when the activity is over.
The decision granting a permit must contain a number of specific requirements. Among other things, it has to include emission limit values for polluting substances (with the exception of greenhouse gases if the emission trading scheme applies). Emission limit values (ELVs) must be based on the best available techniques (BAT), as defined in the IPPC Directive.
Preparation of the BAT reference (BREF) documents is coordinated by the European IPPC Bureau of the Institute for Prospective Technological Studies at the EU Joint Research Centre in Seville. The first revision of the BREF for the cement industry was agreed in May 2010 [3] [BREF 2010]. The previous version dated back to December 2001 [21] [BREF 2001].
It must be stressed that the BREF does not propose ELVs. In order to determine appropriate permit conditions, due account is taken of local, site-specific factors

23
(such as technical characteristics, location and local environment) [22] [Lorea, C. 2009]. However, the BREF helps when it comes to determining appropriate ‘BAT-based’ conditions or to establishing general binding rules under Article 9(8) of the IPPC Directive.
3.1.1 Best available technology for cement manufacture
Article 2(12) of the IPPC Directive defines the term ‘best available techniques’ as ‘the most effective and advanced stage in the development of activities and their methods of operation which indicate the practical suitability of particular techniques for providing in principle the basis for emission limit values designed to prevent and, where that is not practicable, generally to reduce emissions and the impact on the environment as a whole.’ Article 2(12) goes on to clarify this definition further as follows: ‘Techniques’ includes both the technology used and the way in which the installation is designed, built, maintained, operated and decommissioned. ‘Available’ techniques are those developed on a scale which allows implementation in the relevant industrial sector, under economically and technically viable conditions, taking into consideration the costs and advantages, whether or not the techniques are used or produced inside the Member State in question, as long as they are reasonably accessible to the operator. ‘Best’ means most effective in achieving a high general level of protection of the environment as a whole. The thermal energy demand associated with the best available techniques was revised recently, as the previous version of the BREF proposed consumption of 3.0 GJ/t clinker [21] [BREF 2001] (based on a dry process kiln with multi-stage preheating and pre-calcination). This broadening of the energy consumption range for clinker production is due to the recognition that there is a realistic difference between short-term and annual average values of 160 to 320 MJ/t clinker, depending on kiln operation and reliability (e.g. number of kiln stops) [23] [Bauer 2009]. An annual load factor of 0.9 (330 working days a year) is current practice. The best performers can even reach a load factor of 95 %, but even they need a warm-up period of around 24 hours during the start-up of the kilns, from ignition to feeding in the raw materials [15] [Alsop 2005].
3.2 The Kyoto Protocol and the EU emission trading scheme
The Kyoto Protocol is an international agreement linked to the United Nations Framework Convention on Climate Change. The Kyoto Protocol sets binding targets for 37 industrialised countries and the European Union for reducing greenhouse gas (GHG) emissions. An average reduction of five per cent against

24
1990 levels over the five-year period from 2008 to 2012 was agreed [24] [UNFCCC 2009]. To meet the targets, each country will have to take measures at national level, but at the same time the Kyoto Protocol introduced three market-based mechanisms: emissions trading, the clean development mechanism and joint implementation. Emissions trading, as provided for in Article 17 of the Kyoto Protocol, allows countries that have emission units to spare — emission permits granted to them but not ‘used’ — to sell this excess capacity to countries that are over their targets. Thus, a new commodity was created in the form of emission reductions or removals [24] [UNFCCC 2009]. Emissions trading systems may be established as climate policy instruments at national and regional levels. The EU emission trading scheme (EU ETS) is the largest regional scheme in operation [24] [UNFCCC 2009], and is the cornerstone of the EU’s efforts to curb CO2 emissions in a cost-effective way. It was set up by Directive 2003/87/EC [25] and was launched at the beginning of 2005. Today, the EU ETS covers 45 % of European CO2 emissions and more than 10 000 facilities.
In April 2009, the Council adopted the climate-energy legislative package containing measures to fight climate change and promote renewable energy. The centrepiece of this package was the revision of the emissions trading scheme (ETS) for greenhouse gases in order to achieve greater reductions in emissions from energy-intensive sectors [26] [Directive 2009/29/EC]. From 2013 onwards, heavy industries will have to reduce their emissions by 21 % by 2020 compared with levels in 2005.
Despite the fact that the effect of the scheme over the whole economy is perfectly acceptable, some sectors of the economy, accounting for 1 to 2 % of total GDP, would face significant cost increases stemming from the higher carbon price [27] [European Parliament 2008], [28] [Mohr 2009], [29] [Climate Strategies 2007]. One possible effect that these costs could have is relocation of industry towards countries without these extra costs. This effect is known as ‘carbon leakage’. The revised ETS Directive has taken it into account in Article 10a. A sector or subsector is ‘deemed to be exposed to a significant risk of carbon leakage if’, among other criteria, ‘the sum of direct and indirect additional costs induced by the implementation of this Directive would lead to a particularly high increase of production costs, calculated as a proportion of the gross value added, of at least 30 %.’
Article 10b of the same Directive therefore stipulates that:
‘By 30 June 2010, the Commission shall, in the light of the outcome of the international negotiations and the extent to which these lead to global greenhouse gas emission reductions, and after consulting with all relevant social partners, submit to the European Parliament and to the Council an analytical

25
report assessing the situation with regard to energy-intensive sectors or subsectors that have been determined to be exposed to significant risks of carbon leakage. This shall be accompanied by any appropriate proposals.’
On 18 September 2009 EU Member States approved a Decision listing industrial sectors exposed to carbon leakage [30] [European Commission 2009c]. The cement industry is among them. For the sectors deemed exposed, the revised Directive provides for 100 % of allowances to be allocated free of charge, at the level of the benchmark. The Commission is taking the necessary steps to set the benchmark level by means of Community-wide, fully harmonised implementing measures for these free allocations by December 2010. Two documents ordered by the European Commission [31] [ECOFYS 2009a] and [32] [ECOFYS 2009b] present a first blueprint with the consultant’s view of a methodology for the free allocation of emissions allowances under the EU emission trading scheme for the period 2013-2020 as input for further development of the benchmarking rules.
3.3 Other relevant European legislation
• The European Waste Catalogue (EWC) classifies waste materials based on their characteristics and production pathways. It refers to a number of European Union Directives and Commission Decisions regarding waste management. The core of this EWC is the new Waste Framework Directive adopted in November 2008 [33] [Directive 2008/98/EC], which heralds a new approach to waste management. The Directive reshuffles the acquis, particularly by creating a waste hierarchy. It aims to introduce waste prevention programmes as a new policy instrument for the Member States. The Directive must be implemented before 12 December 2010 repealing the previous Waste Framework Directive [34] [Directive 2006/12/EC].
• Directive 2000/76/EC of the European Parliament and of the Council of 4 December 2000 on the incineration of waste [35].
• Directive 2004/8/EC of the European Parliament and of the Council [36] of 11 February 2004 on the promotion of cogeneration based on a useful heat demand in the internal energy market and amending Directive 92/42/EEC.
3.4 Sectoral approach
The big differences in the potential for GHG emission reductions in different parts of the world are the grounds for a sector-based approach to GHG emissions. The ‘sectoral approach’ is currently on the international policy agenda [37] [Price 2006], [38] [IEA 2008a].

26
In the case of the Cement Sustainable Initiative (CSI) [39] [WBCSD 2009a], the sectoral approach involves organised action by key producers in a specific sector of industry and their host governments to address the greenhouse gas emissions from their products and processes, under the United Nations Framework Convention on Climate Change (UNFCCC). The sectoral approach tries to strike the right balance between (1) the principle that industrialised countries take the lead in mitigating climate change and (2) the aim of treating all installations in the same sector equally for competition reasons [40] [ECOFYS 2008]. One of the advantages offered by sectoral approaches is the technology transfer to developing countries [41] [Cai 2009]. The challenge for policy-makers is to turn the concepts behind sectoral approaches into international policy instruments that encourage cost-effective deployment of the best available technology and send the right signals to facilitate early take-up of promising new technologies.

27
4. Sector indicators
4.1 State of the industry
In 2008 a total of 268 installations were producing cement clinker and finished cement in the European Union with a total of 377 kilns [3] [BREF 2010]. In addition, there were a further 90 grinding plants (cement mills) and two clinker plants without mills. The current capacity of a new kiln is around 3 000 tonnes of clinker a day [3] [BREF 2010]. In 2008 cement production in the EU was dominated by Spain and Italy (both with 16.9 % of the EU total), followed by Germany (13.3 %) [42] [CEMBUREAU 2009c]. Cement consumption in EU27 peaked in 2007 at 266 million tonnes (10.5 % of the world production). In 2008 consumption decreased to the 2005 level (around 245 million tonnes) due to the economic downturn [42] [CEMBUREAU 2009c].
Cement plants — with kilns
Grinding plants — without kilns
1995 2006 1995 2006 Austria 11 9 1 3
Belgium 5 5 3 4
Bulgaria 5 -
Cyprus 2 -
Czech Republic 6 1
Denmark 1 1 - -
Estonia 1 -
Finland 2 2 - -
France 38 33 5 6
Germany 50 38 20 20
Greece 8 8 - -
Hungary 4 -
Ireland 2 4 -
Italy 64 59 29 35
Latvia 1 -
Lithuania 1 -
Luxembourg 1 1 1 1
Malta - -
Netherlands 1 1 2 2
Poland 11 1
Portugal 6 6 1 2
Romania 8 1
Slovakia 6 -
Slovenia 2 -
Spain 37 37 5 13
Sweden 3 3 - -
United Kingdom 23 14 1 1
Total 252 268 68 90
Table 4: Trend in the number of cement plants in EU countries between 1995 and 2006 [43] [CEMBUREAU 2000], [3] [BREF 2010]

28
As can be seen from Table 4, in the former EU15 the number of cement plants with kilns decreased by 31 between 1995 and 2006, while the number of grinding plants in the same 15 countries increased by 19 over the same period. These numbers reflect the competition faced by the European industry: in 10 years 12 % of the cement plants with kilns closed and the number of grinding plants (to convert imported clinker into cement) increased by 28 %. Over those years the share of each technology was also evolving, as shown in Table 5 [44] [CEMBUREAU 1997], [3] [BREF 2010].
Process type 1997 2008
Dry 78 % 90 %
Semi-dry 16 % 7.5 %
Wet 6 % 2.5 %
Table 5: Trend in the shares of cement production technologies from 1997 to 2008
Three of the five largest cement producers in the world are based in EU27: Lafarge (France), HeidelbergCement (Germany) and Italcementi (Italy). The other two are Holcim (Switzerland) and Cemex (Mexico) [3] [BREF 2010]. This means that the European cement industry has a truly global presence, holding market shares of 95 % in Europe and 70 % in North America [45] [IEA 2008]. In addition to producing cement, these companies have also diversified into sectors other than building materials.
4.2 Energy consumption in cement manufacture in EU27
The total energy consumption in cement production (of which 71 % is consumed by cement kilns) accounted for 48.5 % of total energy consumption in the non-metallic minerals industry in 2005 [46] [European Commission 2007]. Energy costs account for about 40 % of the variable costs of cement production [46] [European Commission 2007] and [47] [CEMBUREAU 2006b]. The predominant use of energy in cement manufacturing is to fuel the kiln. However, use of electricity is another important factor as it covers around 20 % of the energy needs for cement production [46] [European Commission 2007]. The main users of electricity are the mills (grinding of raw materials and solid fuels and final grinding of the cement) which account for more than 60 % of the electricity consumption [48] [CSI/ECRA 2009] and the exhaust fans (kiln/raw materials mills and cement mills) which, together with the mills, account for more than 80 % of electricity consumption [47] [CEMBUREAU 2006b]. However, the energy efficiency of grinding is typically only 5 to 10 % [50] [IEA 2006]. The current European average electricity consumption in cement manufacturing is 111 kWh/t of cement. The best performers in terms of electricity consumption manage around 80 kWh/t of cement [49] [WBCSD/CSI 2009].

29
The actual range of thermal energy demand for different kilns is shown in the centre column of Table 6 [3] [BREF 2010]. The last column combines the values reported in [51] [WBCSD 2009b] to calculate the average consumption in 2006. These values reflect ‘working’ annual average energy efficiencies and are around 15 % higher than the values reported in [52] [IEA 2007], which reflect the best performance values during commissioning tests leaving aside the worsening of these values due to actual operating conditions.
Specific thermal energy demand
Technology MJ/t clinker
(*)
Weighted average
MJ/t clinker (**)
Dry process, multi-stage cyclone (three to six stages) preheater and pre-calciner kilns
3000 < 4000 3382
Dry process rotary kilns equipped with cyclone preheaters
3100 to 4200 3699
Semi-dry/semi-wet processes (Lepol kiln) 3300 to 5400 3844 (***)
Dry process long kilns Up to 5000 4489
Wet process long kilns 5000 to 6400 6343
Shaft kilns 3100 to 6500 and
higher -
The electricity demand is about 90 to 150 kWh/t cement
Table 6: Specific thermal energy demand by technology
(*) Source: Table 1.18 [3] [BREF 2010] (**) Source: Figure 5.1 [51] [WBCSD 2009b] (***) Not including the energy needed for drying These values contrast with the theoretical energy use for the burning process (chemical reactions) of about 1700 to 1800 MJ/t clinker. Around 200 to 1000 MJ/t clinker are required for raw material drying (based on a moisture content of 3 to 15 %) and the rest of the total thermal consumption are thermal losses [48] [CSI/ECRA 2009b]. In EU27 the average thermal energy consumption in 2006 was 3677 MJ/t clinker [51] [WBCSD 2009b]. The reference range used in this document corresponds to the lower limit of energy consumption using BAT (2900 MJ/t clinker) [3] [BREF 2010], plus between 160 to 320 MJ/t clinker to allow for the annual variability in kiln operation [23] [Bauer 2009]. This reference range (from 3060 to 3220 MJ/t)
30
applies only to a low humidity content (approximately 3 %). For other humidity contents it should be increased accordingly.
4.3 CO2 emissions
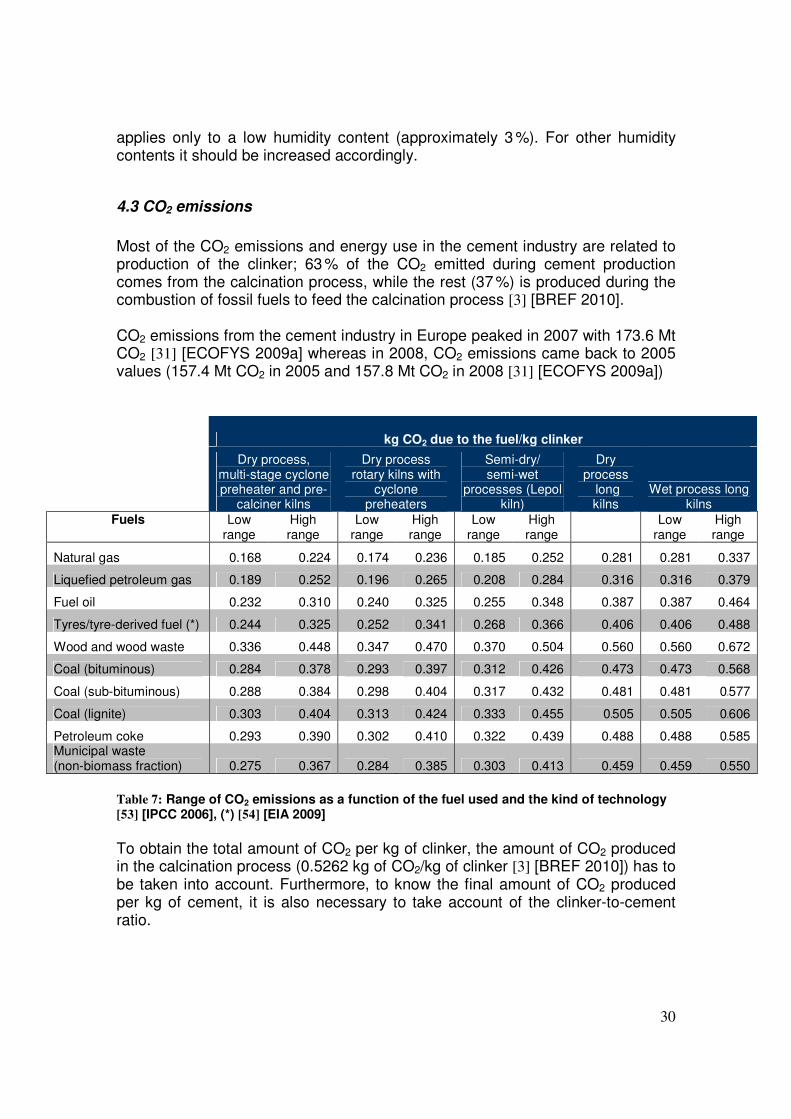
Most of the CO2 emissions and energy use in the cement industry are related to production of the clinker; 63 % of the CO2 emitted during cement production comes from the calcination process, while the rest (37 %) is produced during the combustion of fossil fuels to feed the calcination process [3] [BREF 2010]. CO2 emissions from the cement industry in Europe peaked in 2007 with 173.6 Mt CO2 [31] [ECOFYS 2009a] whereas in 2008, CO2 emissions came back to 2005 values (157.4 Mt CO2 in 2005 and 157.8 Mt CO2 in 2008 [31] [ECOFYS 2009a])
kg CO2 due to the fuel/kg clinker
Dry process, multi-stage cyclone preheater and pre-
calciner kilns
Dry process rotary kilns with
cyclone preheaters
Semi-dry/ semi-wet
processes (Lepol kiln)
Dry process
long kilns
Wet process long kilns
Fuels
Low range
High range
Low range
High range
Low range
High range
Low range
High range
Natural gas 0.168 0.224 0.174 0.236 0.185 0.252 0.281 0.281 0.337
Liquefied petroleum gas 0.189 0.252 0.196 0.265 0.208 0.284 0.316 0.316 0.379
Fuel oil 0.232 0.310 0.240 0.325 0.255 0.348 0.387 0.387 0.464
Tyres/tyre-derived fuel (*) 0.244 0.325 0.252 0.341 0.268 0.366 0.406 0.406 0.488
Wood and wood waste 0.336 0.448 0.347 0.470 0.370 0.504 0.560 0.560 0.672
Coal (bituminous) 0.284 0.378 0.293 0.397 0.312 0.426 0.473 0.473 0.568
Coal (sub-bituminous) 0.288 0.384 0.298 0.404 0.317 0.432 0.481 0.481 0.577
Coal (lignite) 0.303 0.404 0.313 0.424 0.333 0.455 0.505 0.505 0.606
Petroleum coke 0.293 0.390 0.302 0.410 0.322 0.439 0.488 0.488 0.585 Municipal waste (non-biomass fraction) 0.275 0.367 0.284 0.385 0.303 0.413 0.459 0.459 0.550
Table 7: Range of CO2 emissions as a function of the fuel used and the kind of technology [53] [IPCC 2006], (*) [54] [EIA 2009]
To obtain the total amount of CO2 per kg of clinker, the amount of CO2 produced in the calcination process (0.5262 kg of CO2/kg of clinker [3] [BREF 2010]) has to be taken into account. Furthermore, to know the final amount of CO2 produced per kg of cement, it is also necessary to take account of the clinker-to-cement ratio.

31
The amounts of CO2 indicated in Table 7 are in line with the range of 0.65 to 0.92kg of CO2 per kg cement, based on a cement plant with modern technology and equipment [55] [ECRA, 2007]. At worldwide level, the weighted average is approximately 0.83 kg of CO2 per kg of cement. One of the main sources of reductions of CO2 emissions is the decrease in the proportion of clinker in the cement (clinker-to-cement ratio). From 1990 to 2005 this ratio decreased from 0.81 to 0.77 [51] [WBCSD 2009b]. If this trend is sustained, this ratio would fall to 0.73 in 2020 and 0.70 in 2030. If this materialises, the reduction in CO2 emissions compared with current practices would be 4.7 Mt CO2 in 2020 and 8.0 Mt CO2 in 2030 (3.2 % and 5.8 % of CO2 emissions in 2020 and 2030 respectively).

32
5. Reference plants The starting point for studying energy efficiency improvements and CO2 emissions reductions in the European industry up to 2020 and 2030 is to define the main characteristics of the current number of facilities. These characteristics will serve to simulate two reference plants that will be used to model the potential improvements in energy efficiency and CO2 emissions. The core information about the current technologies in use was taken from the World Cement Directory [56] [CEMBUREAU 2002]. It also included the economic cost of these reference plants, the type of fuel and their clinker-to-cement ratio.
• The first reference plant (old reference plant — ORP) is based on the average characteristics of European cement plants. It is used to fill the gaps in the information missing in the database.
• The second reference plant (new reference plant — NRP) is used to represent new facilities in the industry.
The model calculates trends in the existing facilities (real plants or the old reference plant when details about a particular plant are missing). If there is any imbalance in supply, the model allocates new facilities (new reference plant). At the same time, uncompetitive facilities are progressively phased out, based on cost-benefit analysis. The method followed by the model is explained in more detail in Chapter 6. This chapter is structured as follows: Section 5.1 ‘Use of fuels in the European industry; Fuels used in the reference plant’ analyses the current trends in traditional fuels and in alternative fuels employed in the European cement industry and presents the combination of fuel used in the reference plants. Section 5.2 ‘Clinker-to-cement ratio in the European Industry; Raw materials used in the reference plant’ analyses the current trends in employment of additives in the European cement industry and presents the clinker-to-cement ratio assumed in the reference plants. Section 5.3 ‘Size and age of the European industry: Size and age of the reference plants’ analyses the types of kilns, mills and clinker coolers together with the age and the production capacity in the European cement industry. The same section also gives definitions of the technical characteristics of the reference plants. Finally, Section 5.4 ‘Economic values for the reference plants’ defines variables and fixed costs for any facility and the reference plants.

33
5.1 Use of fuels in the European industry; Fuels used in the reference plant
Around 71 % of the energy consumption in a cement facility takes place in the cement kilns in the form of combustion of fossil fuels to produce clinker [46] [European Commission 2007]. Table 8 shows fuel consumption in the cement industry in EU27 in 2006. Around 82 % of the energy consumed comes from conventional fuels, mainly petcoke and coal, and around 18 % from alternative fuels (waste and biomass) which is equivalent to about 5 Mt of coal [57] [CEMBUREAU 2009d].
Type of fuel %
Petcoke 38.6 Coal 18.7 Petcoal and coal 15.9 Fuel oil, including high viscous fuel oil 3.1
Lignite and other solid fuels 4.8 Natural gas 1.0 Alternative fuels 17.9 Excluded: Ireland, Cyprus, Lithuania and Slovenia Estimated: Italy, Portugal and Sweden Reported by EU23 members
Table 8: Fuel consumption expressed as percentage of heat generation by the cement industry in EU27 in 2006 [3] [BREF 2010]
In general terms, use of alternative fuels decreases dependence on (conventional) fossil fuels and, at the same time, avoids CO2 emissions. This reduction in CO2 emissions is achieved in two ways: direct and indirect. A direct reduction is due to the fact that many alternative fuels contain biomass from which CO2 emissions can be counted as zero. An indirect reduction can be obtained if waste is used as fuel in the cement facility. Indeed, if not used, this waste would have to be incinerated (increasing global emissions). Figure 5 shows the indirect reduction in CO2 emissions produced by the cement industry attributable to use of alternative fuels in 2005.

34
Figure 5: Use of waste and biomass instead of fossil fuels in the cement industry reduced European absolute emissions by 11 Mt of CO2 in 2005 Source: [58] [Vanderborght 2008]
In Europe continuous substitution of traditional fuels by alternative ones increased the share of alternative fuels from 3 % in 1990 [59] [CEMBUREAU 2004] to about 18 % in 2006. Nevertheless, use of alternative fuels varies widely, depending on the country. As shown in Figure 6, in 2008 the share of alternative fuels in the specific consumption per tonne of clinker in countries like Germany, Belgium or France stood at between 35 % and 40 %. What is more, some cement suppliers in Belgium, France, Germany, the Netherlands and Switzerland have reached average substitution rates ranging from 35 % to more than 70 % of the total energy used. Some individual plants have even achieved 100 % substitution rates using appropriate waste materials [50] [IEA 2006]. In other countries, such as Italy, Sweden or Hungary, alternative fuels take a very low share or are not used at all.

35
Figure 6: Share of non-conventional fuels in the specific consumption per tonne of clinker (toe/t) [60] [ODYSSEE 2008]
In spite of the potential to use alternative fuels, they have several technical limitations. The main one is that the calorific value of most organic material is relatively low (10-18 GJ/t) compared with the requirements for the main firing of the cement kiln (20-22 GJ/t) [48] [CSI/ECRA 2009]. However, these alternative fuels can be burnt in the pre-calciner thanks to the lower temperature requirements of this process. Nevertheless, with many alternative fuels, very high substitution rates can only be accomplished if a tailored pre-treatment and surveillance system is in place. Municipal solid waste, for example, needs to be pre-treated to obtain homogeneous calorific values and feeding characteristics [50] [IEA 2006]. Furthermore, in cases where plants are designed especially for co-incineration of certain types of waste, the thermal energy consumption can still be in the range of 3120–3400 MJ/t clinker without impairing the properties of the clinker [61] [Trezza 2005]. Extrapolating the current trends, the substitution rate could reach around 36 % in 2020 and around 50 % in 2030 resulting in savings of 0.23 EJ (5.6 Mtoe) in 2020 and 0.3 EJ (7.2 Mtoe) in 2030. These values are in line with the projected substitution rate of 50 to 60 % in developed countries provided by [48] [CSI/ECRA 2009]. The fuel mix used in the reference plants will reflect current proportions of fuels used. Prospective consumption will model the increase in use of alternative fuels that can be expected if current trends are maintained (in this case the rest of the fuels will retain their relative weight).

36
5.2 Clinker-to-cement ratio in the European industry: Raw materials used in the reference plant
Manufacturing clinker is the most energy-consuming process in cement production. Calcination of the raw materials accounts for almost two thirds of the total CO2 emissions. Any measures to decrease the clinker-to-cement ratio will therefore produce an increase in energy efficiency and a decrease in CO2 emissions [62] [Gartner 2004]. In fact, blending of the cement is one of the most effective ways to improve energy efficiency and reduce CO2 emissions [63] [Huntzinger 2009]. This section analyses the current trend in use of substitute materials in cement composition together with the set of factors on which market penetration depends. Employment of additives in cement decreases the clinker-to-cement ratio and, therefore, the specific thermal energy consumption. Nevertheless, extra electricity is needed to grind the additives. This extra electricity consumption can be significant and would have to be taken into account when estimating the actual advantage of these kinds of cement [64] [LBNL-72E, 2008], [65] [LBNL-62806 rev2 2008]. The market penetration of cement with a lower clinker-to-cement ratio will eventually depend on the following factors [48] [CSI/ECRA 2009]:
� Availability of raw materials; � Properties of these kinds of cement; � Price of clinker substitutes; � Intended application; � National standards; � Market acceptance.
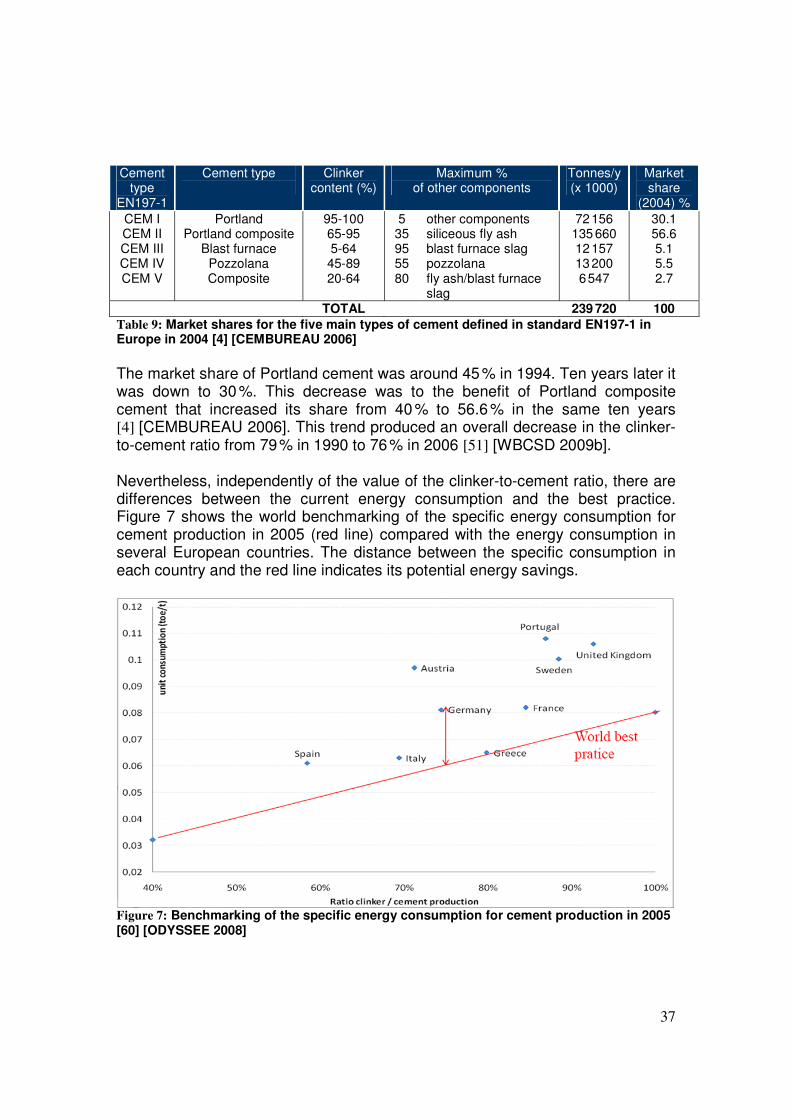
In Europe, cement is classified, depending on its composition, in European standard EN197-1. This standard defines twenty-seven different cements grouped in five main types from CEM I to CEM V [66] [CEN 2000] and [67] [CEMBUREAU 2009b]. Table 9 shows these five main types and their market shares in Europe in 2004.
37
Cement
type EN197-1
Cement type
Clinker content (%)
Maximum % of other components
Tonnes/y (x 1000)
Market share
(2004) %
CEM I CEM II CEM III CEM IV CEM V
Portland Portland composite
Blast furnace Pozzolana Composite
95-100 65-95 5-64 45-89 20-64
5 35 95 55 80
other components siliceous fly ash blast furnace slag pozzolana fly ash/blast furnace slag
72 156 135 660 12 157 13 200 6 547
30.1 56.6 5.1 5.5 2.7
TOTAL 239 720 100
Table 9: Market shares for the five main types of cement defined in standard EN197-1 in Europe in 2004 [4] [CEMBUREAU 2006]
The market share of Portland cement was around 45 % in 1994. Ten years later it was down to 30 %. This decrease was to the benefit of Portland composite cement that increased its share from 40 % to 56.6 % in the same ten years [4] [CEMBUREAU 2006]. This trend produced an overall decrease in the clinker-to-cement ratio from 79 % in 1990 to 76 % in 2006 [51] [WBCSD 2009b]. Nevertheless, independently of the value of the clinker-to-cement ratio, there are differences between the current energy consumption and the best practice. Figure 7 shows the world benchmarking of the specific energy consumption for cement production in 2005 (red line) compared with the energy consumption in several European countries. The distance between the specific consumption in each country and the red line indicates its potential energy savings.
Figure 7: Benchmarking of the specific energy consumption for cement production in 2005 [60] [ODYSSEE 2008]
38
It is noteworthy that differences between the national standards and the European concrete standard [68] [Damtoft 2009] mean that cement which can be fit for purpose in one country cannot be used for the same purpose in another. Therefore, one way to encourage use of more efficient cements would be to promote harmonisation of standards at EU level. The two reference plants will follow the current trend for the clinker-to-cement ratio for EU27 in the simulation.
5.3 Size and age of the European industry: Size and age of the reference plants
This section defines the kilns, cement mills and clinker cooler employed for both reference plants, the ORP and the NRP. The core information for defining the technical aspects of these facilities was taken from the Word Cement Directory database [56] [CEMBUREAU 2002]. This database contains information about the technology used in kilns, cement mills and clinker coolers, the percentages of each fuel used and dates of commissioning or major retrofitting in kilns and cement mills at most European cement facilities. The reference year for the model is 2002 and the energy consumption of the model has been calibrated up to 2007. An overview of the information retrieved from the database with a view to selecting the reference plants is set out below.
• Kilns
The information on kilns covers their number, technology, capacity, commissioning date and the date of any major retrofitting for most European cement plants. Figure 8 shows the percentage distribution of the installed kiln capacity per technology against the age in 2002. The technology with the highest installed capacity is the dry process with preheaters, on around 39 %, followed by the dry process with preheaters and pre-calciner, with around 27 % [56] [CEMBUREAU 2002]. The remaining capacity is equally shared between the other technologies. A steep decrease in new dry preheater technology took place after the oil crisis in the ’70s, giving way to the most energy-efficient technology based on dry preheaters with pre-calciner kilns. Figure 9 also indicates that some of the small number of new facilities commissioned recently still use old technologies. The average age of the kilns was around 30 years in 2002.

39
0%
2%
4%
6%
8%
10%
12%
55 50 45 40 35 30 25 20 15 10 5
age (y)
Pe
rce
nta
ge
of
ins
talle
d k
iln
ca
pa
cit
y Dry Preheat er - Pre-calciner
Dry Preheat er
Dry Long
Semi-Dry
Semi-Wet
Wet
Figure 8: Distribution of kiln capacity per technology by age in 2002
Figure 9 shows the percentage of facilities with a specific number of kilns, by kiln technology. For most technologies, the predominant number of kilns per facility is one. As can be seen, the older the technology the higher the number of kilns in the facility (older plants have had more time to increase the number of kilns).

40
89%
75% 72% 67%
86%
49%
7%
20%
14%
22%
4% 6%9%
11%
4%
8%19%
10%
10%
8% 8%
PH
-Pre
calc
iner
Pre
heate
r (P
H)
Dry
- lo
g
Sem
i-dry
Sem
i-w
et
Wet
6 kilns
5 kilns
4 kilns
3 kilns
2 kilns
1 kiln
Figure 9: Percentage of facilities with a specific number of kilns (by technology)
There is no clear relationship between the capacity (by technology) and the age of the European plants, as can be seen from Figure 10. Despite the wide variability in the data, there is a trend over time towards kilns with higher capacity. This rough trend appears to be independent of the technology. On average, the annual capacity is around 0.860 Mt.

41
10
100
1000
10000
1920 1940 1960 1980 2000 2020
year
Ca
pa
cit
y (
kt
clin
ke
r)
Dry
Semi Dry
Wet
Figure 10: Capacity installed by technology and age The ‘Dry’ category includes preheater kilns, kilns with preheater and pre-calciner and dry long kilns. The ‘Semi-dry’ category includes semi-dry and semi-wet kilns.
The kiln technology chosen for the old reference plant (ORP) tries to embrace most clinker production. Based on the information available, the ORP will have two dry process kilns based on four preheater stages ─ one with pre-calciner, the other without ─ with total clinker production capacity of 0.860 Mt/year and an age of 31 years. The technology assigned to the new reference plant (NRP) for new facilities corresponds to the best available technology. It will have one dry process kiln based on five preheater stages and a pre-calciner and a clinker capacity of 1 Mt/year, similar to the reference plant used in [45] [IEA 2008].
• Cement mills
The information available about mills is similar to that available for kilns: number and type of mills, total capacity, commissioning date and date of any major retrofitting of the mills at most European cement plants. Figure 11 shows the distribution by age in 2002 and by the capacity of the cement mills. The age of the cement mills follows the same pattern as the age of the kilns, while the distribution of the capacity of the mills is highest at around 100 and 200 t cement/mill with an average capacity of 320 t cement/mill.

42
Age of the mills
0
5
10
15
20
25
30
35
40
45
60 55 50 45 40 35 30 25 20 15 10 5years
nu
mb
er
of
mills
first generation of mills
enlargement
Number of mills in the range of a specific capacity
0
5
10
15
20
25
30
35
40
0
100
200
300
400
500
600
700
800
900
1000
1100
1200
1300
1400
1500
capacity ( kt / y)
nu
mb
er
of
mills
Figure 11: Distribution of the number of mills by age in 2002 (left-hand figure) and by mill capacity (right-hand figure)
The number of mills per technology is indicated in Table 10, which shows that around 95 % of the cement mills are tube mills (open or closed circuit). This is the oldest technology and also the one that consumes the most energy. As a consequence, the European cement industry has high potential for retrofitting its mills.
Technology Number
Roller press 27
Horizontal roller mill 4
Vertical roller mill 6
Tube mill (closed circuit) 770
Tube mill (open circuit) 233
Unspecified 10 Total 1050
Table 10: Number of mills by technology
Following the same criteria as were used for the kilns, the ORP will be considered to have three mills with the average capacity of the mill indicated in the database: two closed-circuit tube mills and one open-circuit tube mill with a combined grinding capacity of 1.12 Mt/year. The NRP will be considered to have two vertical roller mills, with a total grinding capacity of 1.5 Mt/year. This capacity makes it possible to decrease the cement-to-clinker ratio without having to add new mills in the future.
• Clinker cooler
From the information about the number and types of clinker coolers included in the database, about half of the installed capacity takes the form of ‘reciprocating grate coolers’, while the other half is split equally between ‘travelling grate coolers’ and ‘planetary coolers’. The technology used in one fifth of the production is not specified. Therefore, the ORP will be considered to have two clinker coolers, one reciprocating grate cooler and one travelling grate cooler.
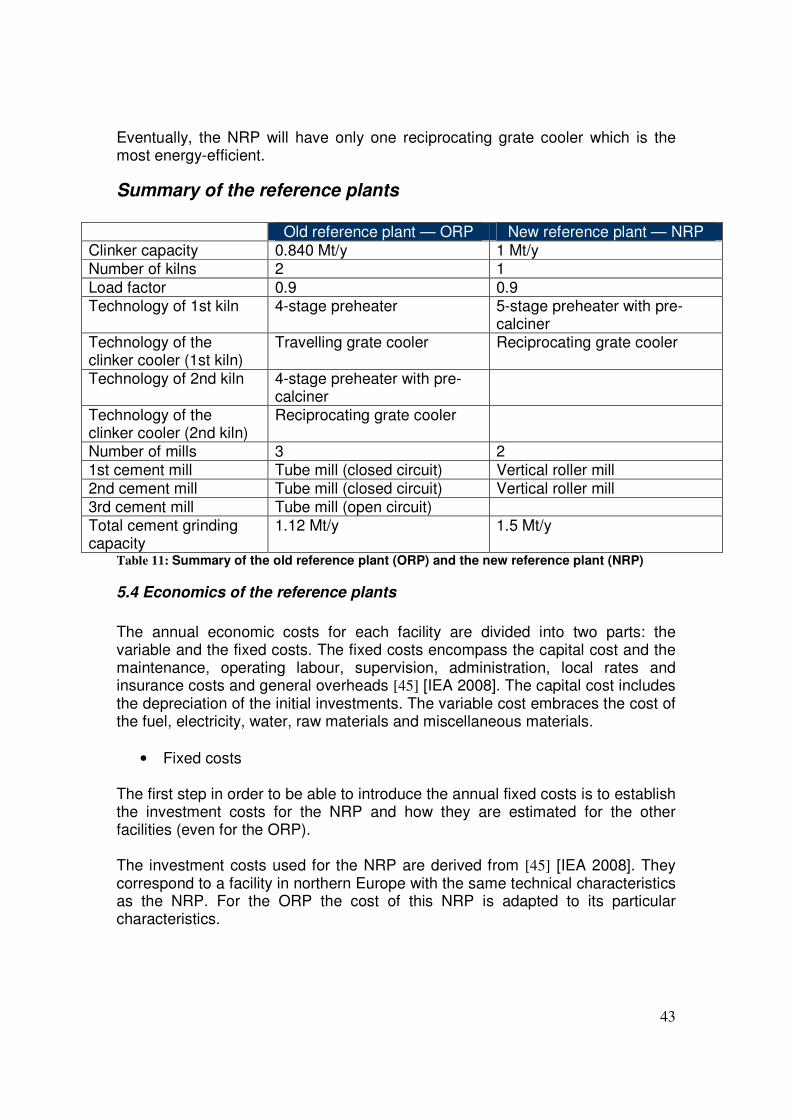
43
Eventually, the NRP will have only one reciprocating grate cooler which is the most energy-efficient.
Summary of the reference plants
Old reference plant — ORP New reference plant — NRP Clinker capacity 0.840 Mt/y 1 Mt/y Number of kilns 2 1
Load factor 0.9 0.9 Technology of 1st kiln 4-stage preheater 5-stage preheater with pre-
calciner Technology of the clinker cooler (1st kiln)
Travelling grate cooler Reciprocating grate cooler
Technology of 2nd kiln 4-stage preheater with pre-calciner
Technology of the clinker cooler (2nd kiln)
Reciprocating grate cooler
Number of mills 3 2 1st cement mill Tube mill (closed circuit) Vertical roller mill 2nd cement mill Tube mill (closed circuit) Vertical roller mill 3rd cement mill Tube mill (open circuit) Total cement grinding capacity
1.12 Mt/y 1.5 Mt/y
Table 11: Summary of the old reference plant (ORP) and the new reference plant (NRP)
5.4 Economics of the reference plants
The annual economic costs for each facility are divided into two parts: the variable and the fixed costs. The fixed costs encompass the capital cost and the maintenance, operating labour, supervision, administration, local rates and insurance costs and general overheads [45] [IEA 2008]. The capital cost includes the depreciation of the initial investments. The variable cost embraces the cost of the fuel, electricity, water, raw materials and miscellaneous materials.
• Fixed costs The first step in order to be able to introduce the annual fixed costs is to establish the investment costs for the NRP and how they are estimated for the other facilities (even for the ORP). The investment costs used for the NRP are derived from [45] [IEA 2008]. They correspond to a facility in northern Europe with the same technical characteristics as the NRP. For the ORP the cost of this NRP is adapted to its particular characteristics.
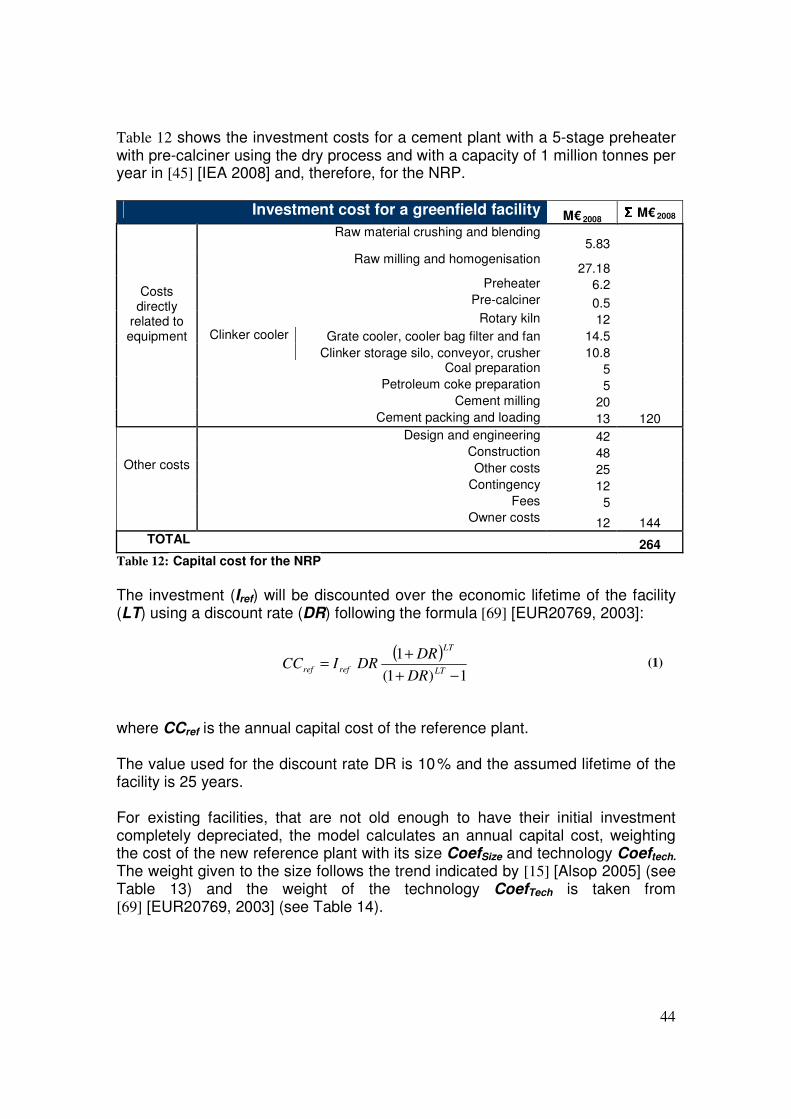
44
Table 12 shows the investment costs for a cement plant with a 5-stage preheater with pre-calciner using the dry process and with a capacity of 1 million tonnes per year in [45] [IEA 2008] and, therefore, for the NRP.
Investment cost for a greenfield facility M€ 2008 ΣΣΣΣ M€ 2008
Raw material crushing and blending 5.83
Raw milling and homogenisation 27.18
Preheater 6.2 Pre-calciner 0.5
Rotary kiln 12
Grate cooler, cooler bag filter and fan 14.5 Clinker cooler
Clinker storage silo, conveyor, crusher 10.8 Coal preparation 5
Petroleum coke preparation 5 Cement milling 20
Costs directly
related to equipment
Cement packing and loading 13 120
Design and engineering 42 Construction 48 Other costs 25
Contingency 12 Fees 5
Other costs
Owner costs 12 144
TOTAL 264
Table 12: Capital cost for the NRP The investment (Iref) will be discounted over the economic lifetime of the facility (LT) using a discount rate (DR) following the formula [69] [EUR20769, 2003]:
( )
1)1(
1
−+
+=
LT
LT
refrefDR
DRDRICC
(1)
where CCref is the annual capital cost of the reference plant. The value used for the discount rate DR is 10 % and the assumed lifetime of the facility is 25 years. For existing facilities, that are not old enough to have their initial investment completely depreciated, the model calculates an annual capital cost, weighting the cost of the new reference plant with its size CoefSize and technology Coeftech.
The weight given to the size follows the trend indicated by [15] [Alsop 2005] (see Table 13) and the weight of the technology CoefTech is taken from [69] [EUR20769, 2003] (see Table 14).

45
Clinker capacity CoefSize 1 Mt 100 % 2 Mt 82.5 % 3 Mt 71.1 %
Table 13: Relative investment costs for different clinker capacity [15] [Alsop 2005]
Technology CoefTech Wet 80 %
Semi-wet 100 % Semi-dry 100 % Dry long 80 %
Dry preheater 100-115 Dry pre-calciner 95-100
Shaft n.a.
Table 14: Relative investment costs for different manufacturing technologies [69] [EUR20769, 2003]
The breakdown of all fixed costs for the NRP is shown in Table 15.
Annual fixed cost M€ 2008/y ΣΣΣΣ M€ 2008/y
Capital costs (CCref) 29.1
Maintenance 9.4 Operating labour 3.2 Other fixed costs (RFCref) Supervision 0.6 Administration and general
overheads 1.2 Local rates 2.4 Insurance 2.4 19.2
Total 48.3
Table 15: Breakdown of the annual fixed costs for the NRP
To obtain the annual fixed cost of any plant i, the capital cost and the other fixed costs of the reference plant can be weighted by the relative capacity of plant i. (CoefSize and CoefTech will also influence the capital costs). Therefore, the capital costs of plant i can be expressed by: If facility age < expected lifetime:

46
ref
ref
in
k
kiTechkisize
ref
ki
refi RFCKp
KpCoefCoef
Kp
KpCCFixedCost +
= ∑ ,,
,
(2)
Otherwise (if facility age > expected lifetime):
ref
ref
ii RFC
Kp
KpFixedCost =
(3)
where:
n is the total number of kilns at plant i Kpref is the capacity of the reference plant (Mt/y) Kip is the total capacity of plant i (Mt/y) Kpi,k is the capacity of kiln k at plant i (Mt/y) RFCref is the other fixed costs of the reference plant in M€/y (costs
not related to the capital, see Table 15)
• Variable costs The variable costs of a facility include the costs for fuels, electricity, water, raw materials and miscellaneous materials. Table 16 shows the breakdown of these costs for the NRP. The values given for the reference plant correspond to a load factor of 0.9 and the proportions of fuels used by the reference plant are the shares in EU27 in 2008. The model adjusts these values over time in line with movements in the different prices.
Annual variable costs € 2008/t t/y M€ 2008/y ΣΣΣΣ M€ 2008/y
Limestone 3 1 245 973 3.74
Shale 1.5 283 974 0.43
Sand 50 7 473 0.37
Iron oxide 50 7 473 0.37
Gypsum 10 40 000 0.40 5.31
Alternative fuels 6.5 35 138 0.23
Fuel oil 425 985 0.42
Natural gas 583.7 635 0.37
Coal 65 25 032 1.63
Heavy fuel oil 425 985 0.42
Petroleum coke 80 24 524 1.96 5.03
Miscellaneous materials 0.8 0.8
Process water 0.1 240 000 0.02 0.02
(€ 2008/kWh) (kWh/y)
Electricity 0.08 61 987 500 4.96 4.96
TOTAL COST 16.12 16.12
Table 16: Breakdown of the variable costs for the new reference plant
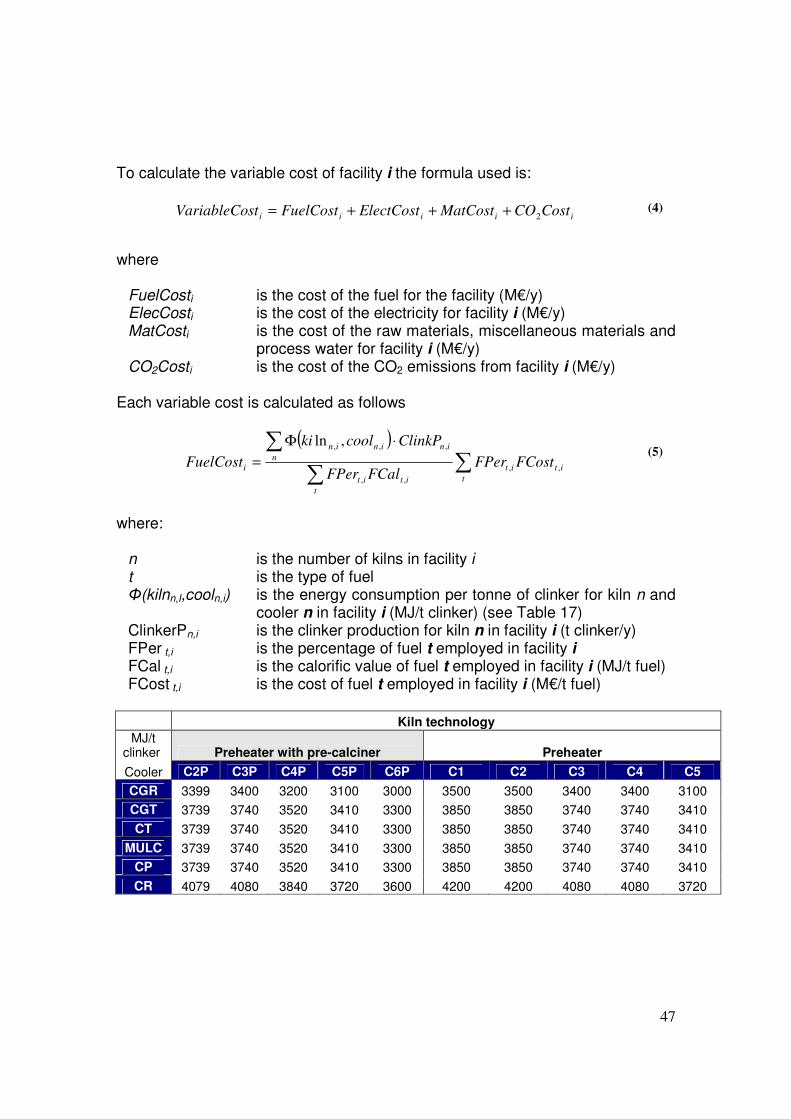
47
To calculate the variable cost of facility i the formula used is:
iiiii CostCOMatCostElectCostFuelCoststVariableCo 2+++= (4)
where
FuelCosti is the cost of the fuel for the facility (M€/y) ElecCosti is the cost of the electricity for facility i (M€/y) MatCosti is the cost of the raw materials, miscellaneous materials and
process water for facility i (M€/y) CO2Costi is the cost of the CO2 emissions from facility i (M€/y)
Each variable cost is calculated as follows
( )
∑∑
∑ ⋅Φ
=t
itit
t
itit
n
ininin
i FCostFPerFCalFPer
ClinkPcoolki
FuelCost ,,
,,
,,, ,ln
(5)
where:
n is the number of kilns in facility i t is the type of fuel Φ(kilnn,I,cooln,i) is the energy consumption per tonne of clinker for kiln n and
cooler n in facility i (MJ/t clinker) (see Table 17) ClinkerPn,i is the clinker production for kiln n in facility i (t clinker/y) FPer t,i is the percentage of fuel t employed in facility i FCal t,i is the calorific value of fuel t employed in facility i (MJ/t fuel) FCost t,i is the cost of fuel t employed in facility i (M€/t fuel)
Kiln technology
MJ/t clinker Preheater with pre-calciner Preheater
Cooler C2P C3P C4P C5P C6P C1 C2 C3 C4 C5
CGR 3399 3400 3200 3100 3000 3500 3500 3400 3400 3100
CGT 3739 3740 3520 3410 3300 3850 3850 3740 3740 3410
CT 3739 3740 3520 3410 3300 3850 3850 3740 3740 3410
MULC 3739 3740 3520 3410 3300 3850 3850 3740 3740 3410
CP 3739 3740 3520 3410 3300 3850 3850 3740 3740 3410
CR 4079 4080 3840 3720 3600 4200 4200 4080 4080 3720

48
Kiln technology
MJ/t clinker Dry long Semi-dry Semi-wet
Cooler NC C5P NC G G C1 C2 C3P C5P
CGR 4150 4150 3300 3750 3750 3600 3500 3400 3300
CGT 4565 4565 3630 4125 4125 3960 3850 3740 3630
CT 4565 4565 3630 4125 4125 3960 3850 3740 3630
MULC 4565 4565 3630 4125 4125 3960 3850 3740 3630
CP 4565 4565 3630 4125 4125 3960 3850 3740 3630
CR 4980 4980 3960 4500 4500 4320 4200 4080 3960
Kiln technology
MJ/t clinker Wet Shaft
Cooler NC C3 C5 C2P C5P
CGR 6300 5100 5000 5100 5000 3100
CGT 6930 5610 5500 5610 5500 3410
CT 6930 5610 5500 5610 5500 3410
MULC 6930 5610 5500 5610 5500 3410
CP 6930 5610 5500 5610 5500 3410
CR 7560 6120 6000 6120 6000 3720
Table 17: Energy consumption by the technologies of each clinker cooler (CGR: Reciprocating grate cooler; CGT: Travelling grate cooler; CT: Tube cooler; MULC: Multicyclone cooler; CP: Planetary cooler; CR: Rotary cooler; C(*): Kiln with preheater where (*) is the number of cyclones; C(*)P: Kiln with preheater and pre-calciner where (*) is the number of cyclones; G: Travelling grate preheater; NC: kiln without preheater) [3] [BREF 2010], [47] [CEMBUREAU 2006b], [48] [CSI/ECRA 2009], [70] [Braig 2009]
⋅⋅+⋅⋅= ∑
k
ikikmilliisizei MillCemPCoefECCemMillECNCemMillCemPFElecCoefElecCost ,,,,
(6)
where:
Coefsize,i is the size coefficient of facility i FElec is the electricity cost (M€/kWh) CemPi is the cement production of facility i (t cement/y) ECNCemMill is the electricity consumption of the facility without the
electricity consumption of the cement mills per tonne of cement. This value is 71 kWh/t cement throughout the simulation [48] [CSI/ECRA 2009]
ECCemMill is the electricity consumption of the cement mills per tonne of cement. This value is 43.5 kWh/t cement throughout the simulation [48] [CSI/ECRA 2009]
MillCemPk,i is the cement production of mill k at facility i (t cement/y)

49
Coefmill,k,i is the electricity consumption coefficient of mill k at facility i. The values per technology are shown in Table 18
Cement mill technology Coefmill Roller press 80 %
Horizontal roller mill 80 %
Vertical roller 70 %
Tube mill (closed circuit) 100 %
Tube mill (open circuit) 100 %
Mill unspecified 100 %
Table 18: Relative electricity consumption for different cement mill technologies [48] [CSI/ECRA 2009], [64] [LBNL-72E, 2008]
( )iii
ref
ii PWMMRM
Kp
KpMatCost ++=
(7)
Kpi is the clinker capacity of facility i (t clinker/y) Kpref is the clinker capacity of the NRP (t clinker/y) RMi is the cost of the raw materials for facility i (M€/y)) MMi is the cost of the miscellaneous materials for facility i (M€/y)) PWi is the cost of the process water for facility i (M€/y))
( )iii FuelCOCalCOiceCOCostCO 2222 Pr +=
(8)
CO2Price is the price per tonne of the CO2 emitted from facility i (M€/t
CO2) CO2Cali is the CO2 emissions due to calcination in facility i (t CO2/y) CO2Fueli is the CO2 emissions due to fuel consumption in facility i
(tCO2/y)
• Total costs The total annual cost is the sum of the variable and fixed costs. The values for the NRP are given in Table 19.
Annual costs (NRP) M€ 2008 Fixed costs Capital costs 29.1 Other fixed costs 19.2 Variable costs 16.1 Total annual cost 64.4
Table 19: Annual costs for the NRP

50
For the other plants in the database (including the ORP), their specific costs are obtained applying formulas (1), (2), (3) and (5).

51
6. Methodology The methodology used to analyse how progress in the technology can improve energy efficiency and reduce CO2 emissions up to 2030 in a cost-effective way is presented in this section. To this end, a spreadsheet model has been developed with all EU27 facilities in 2002 with their corresponding technology, capacity and age. (This information is taken from the ‘World Cement Directory’ [56] [CEMBUREAU 2002]). Trends in the sector are calculated by means of a yearly cost-benefit analysis at facility level. The cost-benefit analysis considers all possible improvements to the technologies used in each facility, plus their age, consumption and associated costs. For each facility, the final decision whether to go ahead with an investment or not depends on whether the payback period is lower than a specific value. For each country, production will be allocated to match the demand in order of production cost, i.e. the production of the cheapest facility will be allocated first and then the rest of the capacity will be added in ascending order of production costs until the demand is satisfied. New greenfield facilities will be added when needed to satisfy any uncovered demand. Facilities whose production is not allocated for a given number of consecutive years are phased out. Assumed simplifications:
• The future fuel mix is kept constant at current ratios or follows current trends.
• Cement is considered a homogeneous product, that is all facilities produce the same average cement with an average clinker-to-cement ratio.
• The model does not deal with international trade in cement.
• All investment costs are in constant euros at 2008 values.
• Facilities are not decommissioned on the basis of age. They are either retrofitted or phased out when they are no longer competitive.
The estimates of the thermal and electricity consumption of each facility are adjusted to bring the overall consumption into line with the consumption indicated by the ‘Getting the Numbers Right’ (GNR) project of the World Business Council for Sustainable Development — Cement Sustainable Initiative (WBCSD-CSI) [51] [WBCSD 2009b].
6.1 Demand
Although worldwide production has increased by a factor of 4.4 since 1970 (mainly due to China), at European level has remained very stable.

52
Figure 12: Cement production in EU27 and the world since 1950 [3] [BREF 2010]
Nevertheless, the movements in the European cement industry have been stronger than suggested by Figure 12. To observe the actual trend in the European industry, a detailed country-by-country analysis is needed. While a strong increase in demand was registered in some countries (Spain, Italy, Greece, Portugal and Ireland) in the middle of the last decade, in others the opposite trend was seen (France, Germany, the United Kingdom and the Czech Republic). Some countries have commissioned more plants than the overall trend in demand in EU27 might suggest and, to offset this, others have phased out old facilities. Figure 14 shows the large differences in cement consumption per capita between the different EU countries.

53
Consumption per capita - kg per capita
6 9 2
5 6 2 5 5 4
5 0 0
3 4 2
4 9 1
3 8 7 3 9 1
3 3 2
9 8 8
3 9 7
7 8 4
3 9 2
3 10
12 4 1
8 8 0
3 6 0
4 4 0
7 3 8
4 5 3
12 4 5
2 9 9
12 5 9
2 5 8 2 3 8
7 14
5 6 5
6 3 2
5 0 3
3 103 3 9
3 6 1 3 7 73 3 3
9 8 4
3 9 9
9 2 8
7 0 1
2 5 82 9 5
12 2 8
9 19
3 8 4
4 4 8
6 9 0
5 0 9
13 4 8
2 9 1
9 4 3
2 7 3
2 0 3
1114
0
200
400
600
800
1000
1200
1400
Austria
Belgiu
mBulgaria
Cyp
rusC
zech R
epu
blic
Denm
ark
Estonia
Finla
ndFra
nce
Germ
anyG
reece
Hung
aryIrelan
dItalyLatviaLithu
aniaLu
xembourg
Malta
Neth
erlands
Poland
Portu
gal
Rom
ania
Slova
k Rep
ublic
Slove
nia
Spa
inSw
eden
United
Kingdom
2007 2008
Figure 13: Cement consumption per capita [42] [CEMBUREAU 2009c]
The demand for cement in a country generally follows the growth in income per capita, which generally correlates with the country’s industrialisation. As countries become more and more industrialised, cement consumption tends to grow rapidly as expenditure on public works and housing increases. After a threshold value of GDP per capita, cement consumption per capita begins to wane until it eventually stabilises and cement consumption per capita flattens out. This effect can be observed in the curve in Figure 15 [71] [LAFARGE 2008].
Figure 14: Commodity intensity of cement [71] [LAFARGE 2008]
This curve is similar in shape to the ones used in [72] [Szabo 2006] to estimate the demand for cement. In the model developed for this study, unlike [72] [Szabo 2006] neither the

54
cement price nor the price elasticity of demand are included to estimate cement consumption. Cement consumption is derived from a curve fitted to the data for EU27 countries on cement consumption per capita v. GDP per capita in 2002. The fitted expression is considered constant with time. The demand will vary for each country, as its population and GDP evolve over time. Specific behaviour patterns (not considered in the model) can deviate from this curve. In a national context, when demand grows above the curve it creates a local need that is met by imports. In these cases, as happened in the recent past in Spain and, to a lesser extent, in Italy, local manufacturers do not respond to the surge in demand by making new investments. Instead, they opt for importing clinker from other countries [29] [Climate Strategies 2007]. In the same way, when the real position of a country (with high GDP) continuously falls below the curve the industry will have overcapacity and will tend to export part of its production and to decommission the least competitive facilities. Information about prospective GDP growth, population and energy prices has been taken from [46] [European Commission 2007]. The EU economy is projected to grow steadily at an average rate of 2.2 % per year until 2030, accompanied by a slight increase in population up to 2020 but no further increase thereafter. The energy projections are based on oil prices of 47.4 €2008/bbl in 2005 rising to 53.9 €2008/bbl in 2030. The baseline price assumptions for the EU are the result of world energy modelling which produces price trajectories for oil, gas and coal based on conventional wisdom about development of the world energy system. In this scenario fossil fuel prices develop as follows:
Figure 15: Prices of hydrocarbon imports into Europe
The EU27 population is projected to remain fairly stable, peaking in 2020 at 496.4 million. However, the population in the new Member States (NM-12) is projected to decline by 7.5 million or 7.2 % between 2005 and 2030. By 2030 the NM-12 will account for 19.4 % of the EU27 population, down from 21.2 % in 2005. Therefore, the absolute demand for cement peaks in 2020 in EU27 and then declines by 2030 due to the combination of the higher GDP per capita generated and the expected decrease in population.

55
6.2 Construction of the model
As a basis for the modelling, production at national level matches the demand. When the demand exceeds the capacity new facilities are built. Facilities with the lower production price are the first to allocate their production before the other facilities are considered. The production is allocated progressively to meet the demand. The price of cement production at each facility is the production cost plus an amount equal to the profitability of the industry. The mark-up of the industry is around 10 % of turnover (based on pre-tax profits before interest repayments) [3] [BREF 2010]. Idle facilities (that do not allocate their production for a certain number of consecutive years) are decommissioned. In the final cement price, the energy costs will weigh heavily, creating incentives for measures to improve energy efficiency in individual plants. Together with retrofitting of existing facilities (which is easier in old plants since their capital costs have already depreciated), fuel prices drive development of the sector. As stated earlier, the model is driven by demand, but in the model this demand is not affected by the cement price or the external market. Countries suffering from under-capacity in the cement industry make no improvements to their facilities, all of which allocate all their production. The model adds new facilities to match the demand (improving overall efficiency). On the other hand, in countries with over-capacity some facilities carry out retrofitting when this is cost-competitive and the facilities that do not allocate their production are phased out progressively. As mentioned earlier, the model operates at facility level based on information about cement mill type, capacity, kiln type, cooler type and fuels. Differences in plant characteristics and best available techniques for each of the manufacturing processes create potential room for improvement in energy efficiency and for reducing CO2 emissions. The retrofitting processes to improve electricity consumption are modelled as substitutions of old cement mills, mainly ball mills, by vertical roller mills. Vertical roller mills are considered to be the best available technology on the market (they allow electricity savings of about 30 % compared with the previous technology). Regarding thermal energy consumption, the model checks the feasibility of retrofitting kilns and clinker coolers at the same time and, later, separately. In the first check the number of kilns can be decreased (keeping their total capacity). This new kiln uses the most efficient technology based on the economic criterion that the length of time taken to recover the cost of the investment — the payback period — has to be lower than a given number of years (three years in the model). The economic advantage of retrofitting stems from the lower fuel consumption of the retrofit, which reduces the variable costs. These savings make up for the increase in the fixed costs (which include the cost of the retrofitting). Thus, each retrofit carried out improves the energy efficiency of that specific plant. In cases where several retrofittings in the same facility comply with the payback period criterion, the one that offers the biggest energy savings is selected. This selection criterion aims to maximise the savings, while avoiding complete rebuilding of the plant. Figure 17 illustrates the decision criteria applied for each facility. In this case, three of all the possible retrofitting options meet the payback period criterion. Here, the second criterion is the one that determines the retrofitting.
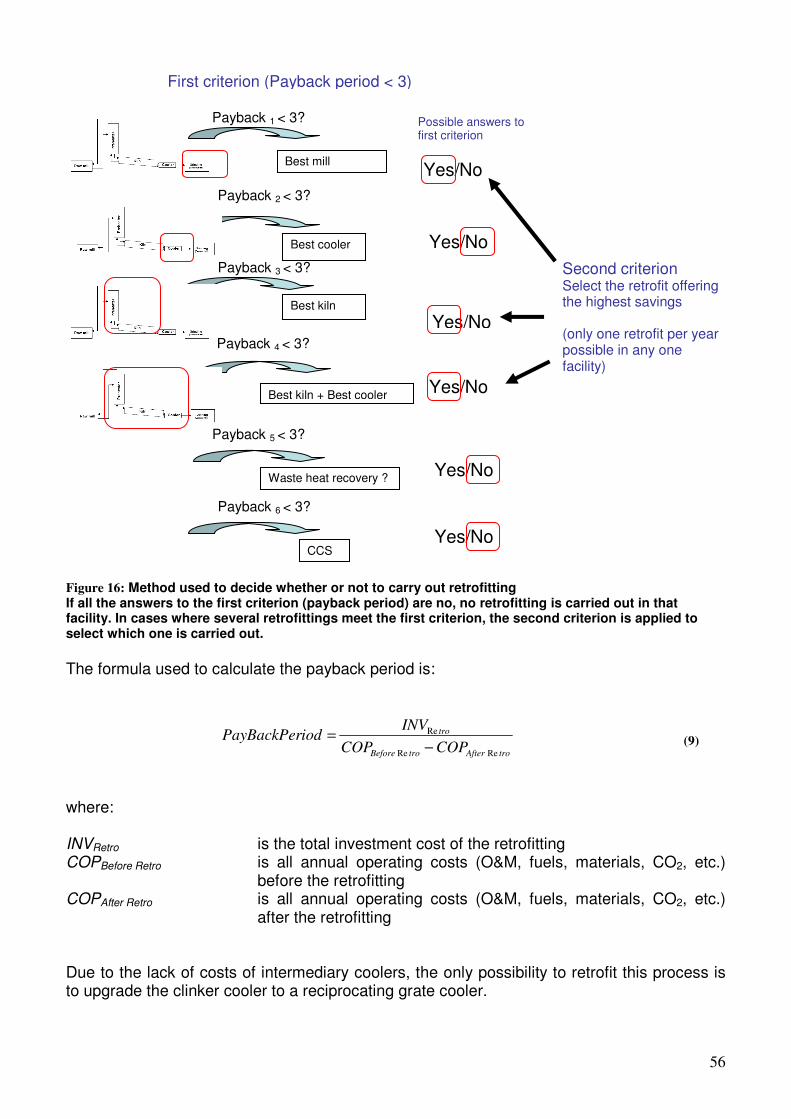
56
Figure 16: Method used to decide whether or not to carry out retrofitting If all the answers to the first criterion (payback period) are no, no retrofitting is carried out in that facility. In cases where several retrofittings meet the first criterion, the second criterion is applied to select which one is carried out.
The formula used to calculate the payback period is:
troAftertroBefore
tro
COPCOP
INViodPayBackPer
ReRe
Re
−=
(9)
where: INVRetro is the total investment cost of the retrofitting COPBefore Retro is all annual operating costs (O&M, fuels, materials, CO2, etc.)
before the retrofitting COPAfter Retro is all annual operating costs (O&M, fuels, materials, CO2, etc.)
after the retrofitting Due to the lack of costs of intermediary coolers, the only possibility to retrofit this process is to upgrade the clinker cooler to a reciprocating grate cooler.
Best mill
Best cooler
Best kiln
Best kiln + Best cooler
Waste heat recovery ?
CCS
Payback 1 < 3?
Payback 2 < 3?
Payback 3 < 3?
Payback 4 < 3?
Payback 5 < 3?
Payback 6 < 3?
First criterion (Payback period < 3)
Yes/No
Yes/No
Yes/No
Yes/No
Yes/No
Yes/No
Possible answers to first criterion
Second criterion Select the retrofit offering the highest savings (only one retrofit per year possible in any one facility)

57
The simplified steps followed are shown in Figure 18.
Figure 17: Algorithm of the cement plant model
In order to reflect a realistic rate of take-up of new technologies in the industry, two constraints have been added to the model. The first limits the number of simultaneous commitments in which a company can be involved. The second sets a limit (five) on the maximum number of simultaneous retrofittings per year. It reflects the annual capability to supply equipment for simultaneous retrofitting.
No
Yes
No
No
For each country
End
For each year
Demand satisfied?
Add new facility
For each facility
Retrofitting cost-effective?
Update facility
Facility idle n years in a row?
Remove facility
Yes
Rank facilities in order of production costs
Match demand with production
Yes

58
The first criterion implies that if a company is carrying out retrofitting, it will not be allowed to retrofit another facility (no matter if it is profitable) until a time equal to the payback period for the previous retrofit. The value imposed on the maximum number of simultaneous retrofittings has been calibrated from historical records. The only time that this number was exceeded was during the oil crisis in the 1970s (see Figure 18).
Number of Retrofitting vs. Year
0
1
2
3
4
5
6
7
8
9
10
1956
1958
1960
1962
1964
1966
1968
1970
1972
1974
1976
1978
1980
1982
1984
1986
1988
1990
1992
1994
1996
1998
2000
2002
Year
Number of Retrofittings
Figure 18: Historical number of plants commissioned or major retrofittings
6.3 Energy efficiency measures and reductions in CO2 emissions
As a mature industry, no breakthrough technologies are foreseen in cement manufacturing that could significantly reduce thermal energy consumption. However, in the last 20 years the European industry has increased its efficiency thanks to economies of scale (plants with higher capacity) and mass adoption of the dry process. Therefore, the scope for further efficiency gains from switching to the dry process is becoming increasingly limited (more than 90 % of the current European production already uses the dry process).
Figure 19: Past trends in energy efficiency in the non-metallic minerals industry [46] [European Commission 2007] and trend in energy efficiency in industry [60] [ODYSSEE 2008]

59
Currently, the main development to improve the energy and environmental performance in this sector is to make greater use of clinker substitutes in cement and of alternative fuels such as waste and biomass and to deploy more energy efficiency measures [48] [CSI/ECRA 2009]. The possible shifts to clinker substitutes and alternative fuels are not conditioned by the take-up of new technological developments. Their effect will therefore be included following a pre-established trend. In this study, their importance in energy demand and CO2 emissions is taken into account directly in the definition of the different scenarios. The measures described in the bibliography to improve energy efficiency are quite site-specific and depend to a large extent on the peculiarities of each facility [73] [LBNL-54036 Rev 2008], [64] [LBNL-72E, 2008], [74] [LBNL-1989E 2008], [75] [Batra 2005], [3] [BREF 2010], [76] [USDoE 2003], [40] [ECOFYS 2008] and [48] [CSI/ECRA 2009]. The measures discussed in the following sections are those applicable taking into account the degree of detail available for each facility in the database source ([56] [CEMBUREAU 2002]). For example, as the database lacks details about the humidity of the raw materials used, one possible cost-effective energy-saving measure ─ installation of an additional cyclone preheater ─ is not analysed, since its design depends on the moisture content of the raw materials [23] [Bauer 2009]. The different retrofitting options considered in this study are:
• Retrofitting of rotary kilns
The service life of cement facilities is usually 30 to 50 years. However, their equipment is continuously modernised, with the result that after 20 or 30 years most of the original equipment will have been replaced [48] [CSI/ECRA 2009]. This is one explanation for the current efficiency of the European cement industry, which already has a long history [48] [CSI/ECRA 2009]. To model the retrofitting of rotary kilns, a check of the cost-effectiveness of these technological changes in each cement facility is made every year. In Table 20 the data on the investment cost of retrofitting rotary kilns are expressed as a percentage of the average cost of a similar greenfield investment. These data have been taken from [69] [EUR20769, 2003]. The values show the high incentive to retrofit old capacity instead of investing in new facilities. 100 % of the cost equals the cost of a plant with the same technology as the new reference plant.
From/to Semi-wet Semi-dry Dry
preheater Dry
pre-calciner Wet 3 % 5 % 37 % 55 %
Semi-wet 5 % 37 % 55 %
Semi-dry 10 % 15 %
Dry long 10 % 15 %
Dry preheater 14 %
Table 20: Relative costs of the feasible retrofitting options as a percentage of an average greenfield investment [69] [EUR20769, 2003], [1] [CEMBUREAU 1999a]
• Conversion to a reciprocating grate cooler

60
Due to the decisive influence of the clinker cooler on the performance and economics of the plant, retrofitting of clinker coolers is common in the cement industry. Nowadays half of the installed clinker cooling capacity no longer corresponds to the best available technology. Hence, there is still room for improvement in energy consumption. This information, together with the relatively old age of the cement plants, confirms that such retrofitting is not uncommon. Consequently, in the model this specific retrofitting is considered as an alternative to overall retrofitting of the plant.
The estimated savings in energy consumption can be up to 8 % of the overall consumption [73] [LBNL-54036 Rev 2008], [48] [CSI/ECRA 2009], [70] [Braig 2009]. The model estimates the payback period of the investment for each facility. This value determines the cost-effectiveness of the measure. The costs associated with this substitution vary widely, depending on site-specific conditions. Retrofitting of an old grate cooler can entail an investment of 1-3 M€, whereas conversion of a planetary cooler to the latest technology for a plant with a capacity of 2 Mt/year is estimated at 15-20 M€ [48] [CSI/ECRA 2009]. The total cost for the retrofitting of this kind of clinker cooler for the NRP is estimated to be 31.9 M€. This cost includes the cost of the equipment (14.5) M€ and other costs such as the construction and engineering [45] [IEA 2008].
• Final grinding
Electricity costs make up about one third of the variable costs of the reference plant. The other two thirds are attributable in equal parts to the raw materials and fuel costs. 38 % of the electricity consumption is for cement grinding and 24 % for raw material grinding [48] [CSI/ECRA 2009].
The technical information on grinding technologies in each facility in the EU27 industry [56] [CEMBUREAU 2002] boils down to the technology, age and capacity of the final grinding mills. Therefore, the simulation describes only the effect of technology improvements in energy efficiency in the final milling. The consumption of the most common mills (ball mills) and of the most advanced mills (vertical roller mills) can be extracted from the cumulative distribution of the electricity consumption as a function of production provided in [49] [WBCSD/CSI 2009]. In practice, the electricity consumption values obtained in the final milling with best practices can vary, depending on the kind of cement and the degree of fineness (from 25-31 kWh/t of cement to the 58 to 72 kWh/t range for cement with 65 % blast furnace slag [65] [LBNL-62806 rev2 2008]. This initial approach, without the actual values for the proportion of each kind of cement or its fineness in each facility, assumes that all facilities produce the same average EU27 cement. In order to adjust the initial electricity consumption of the model to the actual consumption of the European industry (given in [49] [WBCSD/CSI 2009]), the individual consumption of each facility is penalised inversely to the facility size and calibrated to ensure that the total electricity consumption of the model equals the data on total electricity consumption.
• Heat recovery for power generation
Waste heat from various parts of clinker production can be harnessed to generate electricity that can be used in the manufacturing processes. In this way significant energy savings can be achieved: about 30 % of the electricity requirements of the plant and an improvement of up to 10 % in primary energy efficiency [77] [Khurana 2002], [81] [Engin 2005].

61
Any such measure to use waste heat must take into account that most of the heat produced from cement clinker is already used for drying. The excess heat remaining depends on seasonal rainfall and geology [3] [BREF 2010]. One reason for the low take-up of such measures is that the industry is able to obtain low-cost energy. Not many experts give much weight to this measure [78] [USEPA 2007]. Unreliable access to energy (as in Asia) or high energy prices can change the picture. The first plant of this kind working in Europe is operating in Germany. It recovers unused grate cooler heat, with capacity to generate 1.5 MW of electricity, avoiding 7000 tonnes of CO2 per year [79] [Bronicki]. By contrast, in 2007 China already has 120 cement plants equipped with waste heat recovery (WHR) systems, with a total capacity of 730 MW [16] [Nobis 2009]. Several cycles (such as the single-flash steam cycle, dual-pressure steam cycle, ORC and the Kalina cycle) and several possible working fluids (benzene, toluene, p-xylene, benzene, ammonia, etc.) can be used [80] [Wang 2009]. The model analyses the electricity savings that can be obtained, ranging from 8 to 22 kWh/t clinker [48] [CSI/ECRA 2009], in comparison with the investment cost to determine the threshold value of the electricity price at which this investment begins to be profitable. The investment cost for WHR in the reference plant is estimated at 10 M€, with an increase in the operating cost of 0.084 €/t clinker [81] [Engin 2005].
• Carbon capture and storage (CCS)
Carbon capture and storage is one potential measure to achieve the global CO2 emission reduction target in the long run. Cement manufacturing offers the advantage that its emissions are concentrated in few locations and at the same time the CO2 concentration in the flue gases is twice the concentration found in coal-fired plants (about 14-33 % compared with 12-14 %) [82] [IPCC 2005]. In addition, over 60 % of the total CO2 emissions from a modern cement plant come from mineral decomposition, which can now be avoided by using alternative energy sources. Thus, the cement industry offers a good opportunity to implement CCS. Several technologies are available to capture CO2: � Pre-combustion, which consists of obtaining a fuel which is more or less carbon-free (by
reforming or gasification/partial oxidation of different fossil fuels) for subsequent use in cement production. This technique can be ruled out from the start for the cement industry, as it would not be able to capture the CO2 produced during the calcination process.
� Post-combustion, in which the CO2 is separated from the flue gases. This technology
offers the advantage that few changes would be required to the current kilns. Post-combustion capture by amine scrubbing is a commercially mature technology commonly used in the chemical industry to separate CO2. The main challenge is to scale up the process, avoiding degradation of the scrubbing unit by the number of contaminants contained in the fumes. Another issue is the supply of low-pressure steam for CO2 capture solvent regeneration. This need can be met by a dedicated combined heat and power (CHP) plant that, at the same time, can deliver the electricity required by the cement plant, at the expense of adding to the capital cost [55] [ECRA, 2007], [88] [ECRA, 2009].
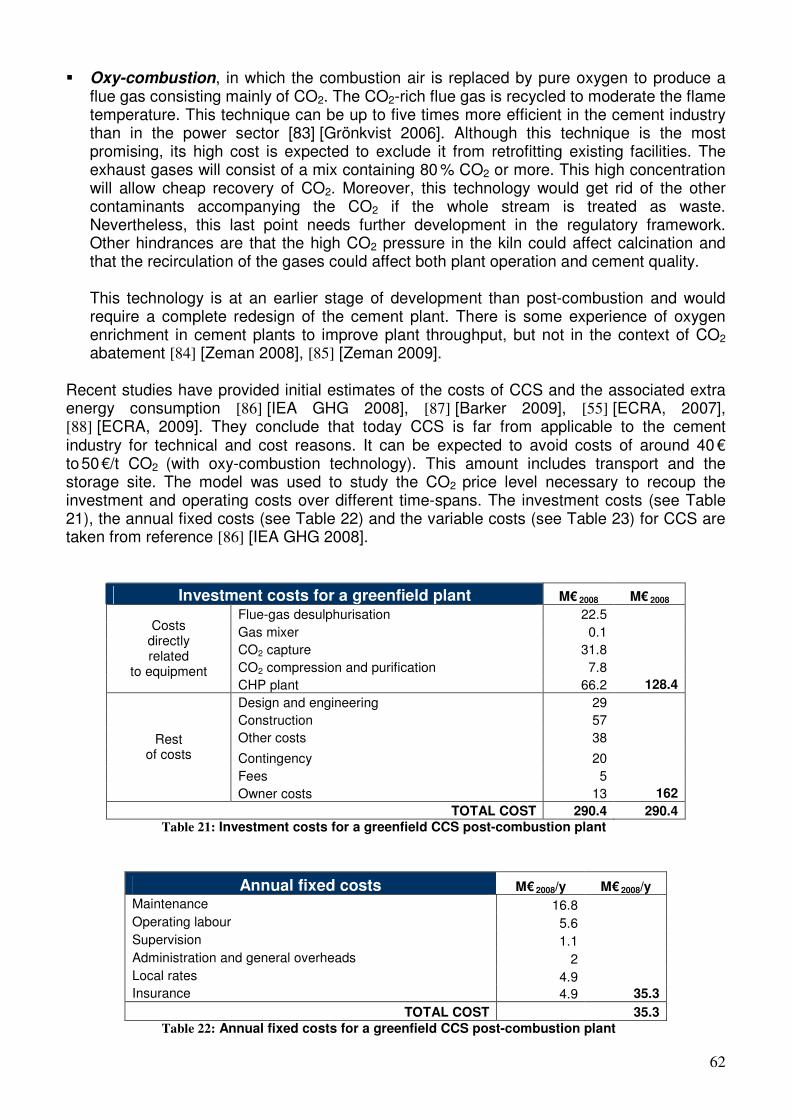
62
� Oxy-combustion, in which the combustion air is replaced by pure oxygen to produce a flue gas consisting mainly of CO2. The CO2-rich flue gas is recycled to moderate the flame temperature. This technique can be up to five times more efficient in the cement industry than in the power sector [83] [Grönkvist 2006]. Although this technique is the most promising, its high cost is expected to exclude it from retrofitting existing facilities. The exhaust gases will consist of a mix containing 80 % CO2 or more. This high concentration will allow cheap recovery of CO2. Moreover, this technology would get rid of the other contaminants accompanying the CO2 if the whole stream is treated as waste. Nevertheless, this last point needs further development in the regulatory framework. Other hindrances are that the high CO2 pressure in the kiln could affect calcination and that the recirculation of the gases could affect both plant operation and cement quality. This technology is at an earlier stage of development than post-combustion and would require a complete redesign of the cement plant. There is some experience of oxygen enrichment in cement plants to improve plant throughput, but not in the context of CO2 abatement [84] [Zeman 2008], [85] [Zeman 2009].
Recent studies have provided initial estimates of the costs of CCS and the associated extra energy consumption [86] [IEA GHG 2008], [87] [Barker 2009], [55] [ECRA, 2007], [88] [ECRA, 2009]. They conclude that today CCS is far from applicable to the cement industry for technical and cost reasons. It can be expected to avoid costs of around 40 € to 50 €/t CO2 (with oxy-combustion technology). This amount includes transport and the storage site. The model was used to study the CO2 price level necessary to recoup the investment and operating costs over different time-spans. The investment costs (see Table 21), the annual fixed costs (see Table 22) and the variable costs (see Table 23) for CCS are taken from reference [86] [IEA GHG 2008].
Investment costs for a greenfield plant M€ 2008 M€ 2008
Flue-gas desulphurisation 22.5
Gas mixer 0.1
CO2 capture 31.8
CO2 compression and purification 7.8
Costs directly related
to equipment CHP plant 66.2 128.4
Design and engineering 29
Construction 57
Other costs 38
Contingency 20
Fees 5
Rest of costs
Owner costs 13 162
TOTAL COST 290.4 290.4
Table 21: Investment costs for a greenfield CCS post-combustion plant
Annual fixed costs M€ 2008/y M€ 2008/y
Maintenance 16.8
Operating labour 5.6
Supervision 1.1
Administration and general overheads 2
Local rates 4.9
Insurance 4.9 35.3
TOTAL COST 35.3
Table 22: Annual fixed costs for a greenfield CCS post-combustion plant

63
Variable costs € 2008/t t/y M€ 2008/y M€ 2008/y
Limestone for FGD 3 12 830 0.04
Ammonia 200 1 853 0.37
MEA 1100 2 242 2.47
Additive inhibitor 0.49
Catalyst for SCR 1.19 4.56
Coal for CHP 65 228 300 14.84 14.84
Process water — Post-combustion plant 0.1 150 000 0.02
Cooling water — Post-combustion plant 0.02 4 380 000 0.09 0.10
€ 2008/kWh kWh/y
Electricity — Post-combustion plant 0.05 252 857 000 12.64
Electricity generated in the CHP plant 0.05 356 400 000 -17.82 -5.18
TOTAL COST 14.32 14.32
Table 23: Variable costs for a greenfield CCS post-combustion plant
6.4 Other potential energy efficiency and GHG emission measures not considered in the model
• New cements and other technologies at the research stage
As a mature industry, no breakthrough technologies are foreseen in cement manufacturing that could significantly reduce thermal energy consumption. Some new potential low-carbon cements, such as Novacem, Calera, Calix or Geopolymer, have the potential to reduce GHG emissions. However, they have neither been proven economically viable nor been tested on a commercial scale yet. Therefore, the model developed in this study adopts the same approach as proposed in the WBCSD/IEA roadmap for the cement industry [89] [WBCSD/IEA 2009] and does not take them into consideration. Another alternative technology on which research is currently being conducted is fluidised bed technology. However, although improvements can be expected, this technology is not expected to cover high-capacity kilns [48] [CSI/ECRA 2009].

64
7. Modelling The prospective scenarios for the cement industry follow the ‘European energy and transport trends to 2030’ [46] [European Commission 2007]. The baseline scenario consists of business as usual reflecting economic factors and the current measures in place. This agrees with the baseline scenario in [46] [European Commission 2007]. The energy efficiency improvements and CO2 emission reductions in the sector are driven by the economic value of the savings compared with the economic cost of the energy efficiency measures, retrofitting the facilities and replacing old facilities by new more efficient ones. The various scenarios proposed are based on different prices for fossil fuels and CO2 allowances. They assume that the additional cost of the allowances is completely passed on to the cement price, fostering more aggressive CO2 emission reduction measures. The cost of cement production per facility includes the carbon expenditure. This cost is calculated assuming the difference in emissions between the facility in question and a facility using BAT. CO2 prices in the ETS increase from 21.5 €2008/t CO2 in 2010 to 23.7 € 2008/t CO2 in 2020 and 25.8 € 2008/t CO2 in 2030. All the scenarios studied assume that the current trends in the clinker-to-cement ratio and in use of alternative fuels remain constant (this means a clinker-to-cement ratio of 0.7 and a share of 50 % for alternative fuels in 2030).
7.1 Adjustment to energy consumption data for the scenarios
To calibrate the model for the starting years, the global cumulative frequency distribution (CFD) curves given by [51] [WBCSD 2009b] were used. These curves show the percentage of production (along the horizontal axis) with thermal energy consumption per tonne of clinker lower than or equal to the corresponding value on the vertical axis (see Figure 20). In Figure 20, the left-hand side indicates the trend in thermal energy consumption from 1990 to 2007 in the European industry [49] [WBCSD/CSI 2009] and the right-hand side the trend in thermal energy consumption calculated by the model from 2002 (base year) to 2007.
Thermal energy per tonne of clinker
2000
2500
3000
3500
4000
4500
5000
5500
6000
6500
7000
0% 10% 20% 30% 40% 50% 60% 70% 80% 90% 100%
Percentage of clinker production, %
MJ/
ton
ne
of
cli
nke
r
2002 2005 2006 2007 Figure 20: CFD of European thermal energy per tonne of clinker from 1990 to 2007 (left-hand figure) and results of the model from 2002 to 2007 (right-hand figure)
The left-hand side of Figure 21 shows the trend in electricity consumption from 1990 to 2007 in the European industry [49] [WBCSD/CSI 2009] and the right-hand side the trend in

65
electricity consumption calculated by the model for the first years of simulation (2002 to 2007).
Figure 21: CFD of electricity consumption in Europe per tonne of cement from 1990 to 2007 (left-hand figure) and results of the model from 2002 to 2007 (right-hand figure)
7.2 Scenarios
In this section three different scenarios are introduced. These reflect the energy consumption and CO2 emission trends in the industry under different conditions up to 2030. The baseline scenario (in Section 7.2.1) reflects the situation in the cement industry when current trends in demand for cement, energy prices, CO2 emission prices, consumption of alternative fuels and the clinker-to-cement ratio are maintained. The first of the alternative scenarios (in Section 7.2.2) studies the effect of different prices of fossil fuels and the second (in Section 7.2.3) the effect of different prices for CO2 emissions. 7.2.1 Baseline scenario The baseline scenario reflects the situation in the cement industry when current trends in demand for cement, energy consumption, energy prices, CO2 emission prices, consumption of alternative fuels and the clinker-to-cement ratio are maintained. Thermal energy consumption, electricity consumption and CO2 emissions are analysed. This scenario is also used to test the influence of the restrictions imposed on the total number of retrofittings per year (reflecting the limited capacity to supply a high number of systems to the cement sector at the same time) and on the number of simultaneous retrofittings in each company (simulating the limited financial resources of the companies). Figure 22 shows the weighted average of the thermal consumption modelled up to 2030 for the cement industry in EU27. The results are expressed in MJ/t clinker for three cases:
• BS — Baseline case. In this scenario the capacity of ancillary industries to supply equipment to the cement industry is limited to five systems, with the additional restriction that a company which is already carrying out one retrofitting will not invest in other projects during the payback period of the previous one.
• Case BSInf — In this scenario no restrictions are placed on the supply chain from the ancillary industries to the cement sector. But the number of simultaneous retrofittings allowed by any one company is still restricted, as in the BS case.
• Case BSInfNrc — No constraints are imposed, neither on the total number of annual retrofittings nor on the number of simultaneous retrofittings.

66
Figure 22 shows the reference range for thermal energy consumption in the cement industry. This reference range recognises that there is a realistic difference between short-term and annual average values of 160 to 320 MJ/t clinker, depending on kiln operation and reliability (e.g. number of kiln stops) [23] [Bauer 2009]. At the same time, two equally efficient facilities can have very different requirements for raw material drying (about 0.2 to 1 GJ/t clinker based on a moisture content of 3 to 15 %) [48] [CSI/ECRA 2009]. Therefore, the benchmark is not a single value. The reference range in this chapter considers the annual variability of the operations and a low humidity content (approximately 3 %). For other humidity contents this range should be increased accordingly. Since the real humidity of the raw materials is not publicly known for each facility, it has been assumed that the number of cyclone stages of preheaters (which depends on the humidity of the raw materials) cannot be altered during the simulation. This is equivalent to assuming that the current number of cyclones is already optimum (which will not always be the case). Each value within the reference range corresponds to a possible annual average for a single facility with a low humidity content. The dotted lines correspond to the annual average value calculated for the cement manufacturing capacity in EU27.
Figure 22: Weighted average thermal consumption over the simulation period for cases BS, BSInf and BSInfNrc and reference range
The results in Figure 22 show that the constraints reduce the rate at which energy consumption decreases. However, in all cases the final specific consumption is the same, at around 3350 MJ/t clinker. These constraints prevent implementation of all the possible retrofittings in the early years of the simulations. These conditions therefore avoid an unrealistically high rate of change at the beginning. The BS case offers the lowest rate of improvement. In the early years of the simulation a big decrease in thermal energy consumption is obtained. One reason for this is that the first retrofittings carried out are the ones that offer the highest possible savings. Another could be due to the simplification of the international market in the model. In the first step of the model, some countries are not able to satisfy their internal demand and, since the model does not allow imports, new cement facilities are therefore built in these countries. Those new facilities improve the energy consumption

67
artificially. The thermal energy saving due to this effect is around 100 MJ per tonne of clinker. This internal aspect will be looked into in follow-up studies. Figure 23 shows the trend in total thermal energy consumption. To highlight the importance of technical change, the consumption of the sector without changing the existing capacity is plotted (upper curve) against the consumption in a scenario that allows retrofittings (lower curve). Without retrofittings the energy consumption starts to decrease around 2020 due to the expected decline in the demand. The difference between the two curves shows the efficiency gains produced by the model as a result of retrofittings, addition of new facilities and phasing-out of uncompetitive ones. The energy savings between the two cases in 2030 is around 10 %. Both curves are almost parallel from 2015 on, meaning that the influence of the last retrofittings is smaller than those carried out in the first years of the simulation.
Figure 23: Total thermal energy consumption up to 2030 in a scenario with and without changes in the technology used
Figure 24 shows the weighted average electricity consumption over the simulation period for the cement industry in EU27. The results are presented in kWh/t of cement for the three cases studied: BS, BSInf and BSInfNrc. The reference value used for electricity consumption in the cement industry corresponds to the electricity consumption of the new reference plant. The electricity consumption is expressed per tonne of cement to take account of the energy consumption during the final grinding in the cement mills.

68
Figure 24: Weighted average electricity consumption over the simulation period for cases BS, BSInf, BSInfNrc and BM
The electricity consumption is the same for all three cases studied and the values are approximately constant over the simulation period. This is because the electricity price is never high enough to compensate for the investment costs of upgrading cement mills or incorporating waste heat recovery (WHR) systems. Therefore, as a result of the electricity prices used in the model, the mills are not retrofitted. The only way they can contribute to improving the overall electrical efficiency is when they are phased out with the whole plant (which only happens when the facility is no longer competitive). The lower consumption of the mills of new facilities does not weigh enough to be felt in the overall consumption. The first drop of around 3 kWh/t cement in 2003 is a consequence of the simplification of the international cement market. Therefore, at the price assumed for electricity, the model shows no improvement in electricity consumption Figure 25 shows the weighted average gross CO2 emissions over the simulation period for the cement industry in EU27. The results are expressed in kg CO2/t clinker for the three cases studied: BS, BSInf and BSInfNrc. The reference range for CO2 emissions from the cement industry each year is also added. This reference range reflects the operational variability in thermal consumption and in the average emissions of the fuels used in the simulation.

69
Figure 25: Weighted average CO2 emissions for cases BS, BSInf and BSInfNrc and reference range for gross CO2 emissions
The effect of the decrease in thermal energy inputs on CO2 emissions by the end of the simulation is 4.7 %, lower than the energy improvements (10 %) due to the fact that only one third of the emissions come from fossil fuels. The other two thirds are due to the calcination process and are therefore unaffected by the change in fuel requirements. Finally, Figure 26 shows the trend in the share of the individual technologies used over the simulation: the semi-wet, wet and shaft technologies become more and more marginal but without disappearing completely.
0%
10%
20%
30%
40%
50%
60%
70%
80%
90%
100%
2002
2004
2006
2008
2010
2012
2014
2016
2018
2020
2022
2024
2026
2028
2030
Years
% o
f P
rod
ucti
on
by t
ech
no
log
y
PHPC PH DL SD SW WET SHAFT
Figure 26: Trends in the technologies used over time in the baseline scenario

70
� Retrofittings not considered in the model at any time; effect of using a decision
criterion other than the payback period Applying the payback period criterion, the electricity price for which retrofitting of cement mills begins to be cost-effective is around three times higher than the estimated electricity price in 2008 for the baseline scenario of 0.068 €/kWh. This value has also been calculated for waste heat recovery (WHR). Even in the most favourable conditions, when the electricity recovered totals 22 kWh/t clinker, using the payback period criterion to decide when the investment is carried out, the final power price to make the investment profitable also needs to be tripled. Another criterion applied to decide if the investment can be carried out is when the net present value (NPV) is positive. The NPV is the present value of the cash flow RTi discounted at rate r for a specific number of years n:
∑= +
=n
ii
i
r
RTNPV
0 )1(
(10)
Discounting the cash flow during 10 years at 12 % discount rate results in WHR not being cost-effective in the electricity recovery range considered (between 8 and 22 kWh/t clinker). A discount rate of 12 % is usually applied in the industry [46] [European Commission 2007], while a 10-year span is the average timing for evaluation of an energy investment which is compatible with high discount rates [90] [Laurent 2009]. In order to check how close an investment in WHR can be to cost-competitiveness, the discount rate that nullifies the NPV can be calculated (this discount rate is the internal rate of return — IRR). Figure 27 gives the combination of values of the discount rate r and of the electricity price that nullifies expression (10) for the new reference plant. In particular, the expression solved is:
( )0
1
084.0*10
10
1
=+
−+− ∑
=
=
n
ii
elec
r
ErP
(11)
where:
-10 is the investment cost in the WHR system (€/t clinker) (estimated from [48] [CSI/ECRA 2009])
n=10 is the number of years considered [90] [Laurent 2009]. 0.084 is the increase in the operating costs due to WHR (€/t clinker) [45] [IEA
2008] Pelec is the electricity price (€/kWh) Er is the electricity recovered (8, 10, 15 or 22 kWh/t clinker) [48] [CSI/ECRA
2009]

71
Figure 27: Electricity price that makes the investment profitable as a function of the internal rate of return for four different amounts of electricity recovered
Keeping the discount rate at 12 %, the electricity price that tips the balance to make WHR cost-effective can be calculated using expression (11) or read directly from Figure 27 (values given in the third column of Table 24).
Energy recovered Payback period < 3 IRR 12 % kWh/t clinker €/kWh €/kWh
22 0.15 0.08 15 0.21 0.12 10 0.32 0.19 8 0.41 0.23
Table 24: Electricity price that makes waste heat recovery cost-effective as a function of the electricity recovered per tonne of clinker
The results from the NPV analysis are compatible with the results from the payback period method used previously. WHR recovery is not cost-competitive for the range of electricity recovery considered. However, when the amount of electricity recovered totals 22 kWh/t clinker, the electricity price needed to tip the balance (0.084 €/kWh) is quite close to the value used in the simulation (0.068 €/kWh). Under the payback period criterion, CCS with post-combustion is far from being used (independently of the fact that it is not expected to be available before 2020). The costs used for this sensitivity analysis were taken from [45] [IEA 2008] which reported an investment of 295 M€ for a plant with a capacity of 1 Mt and from [91] [Hegerland 2006] which reported 110 M€ for a similar plant to reflect the current understanding of the cost of CCS. In Figure 28 the values of the carbon price that nullifies the NPV have been calculated solving the expression:

72
( )0
1
4.3054.0*10
1
2 =+
−+− ∑
=
=
n
ii
CO
r
PInv
(12)
where:
-Inv is the investment cost in CCS (295 € or 110 €/t cement) [45] [IEA 2008], [91] [Hegerland 2006]
n=10 is the number of years considered [90] [Laurent 2009] 30.4 is the operating cost of CCS (€/t cement) [45] [IEA 2008] 0.54 is the tonnage of CO2 captured per t cement [45] [IEA 2008] PCO2 is the carbon price (€/kWh) r is the discount rate
Figure 28 shows the values that nullify expression (12) for two different investment costs.
Figure 28: Price of CO2 allowances that makes CCS investments profitable as a function of the discount rate for two different investment costs for post-combustion given in the literature
Finally, Table 25 gives the CO2 allowance price needed to make the investment attractive under several decision criteria. The ‘IRR (10 %, 25y)’ column gives the cost of the CO2 abated (considering a facility lifetime of 25 years and a discount rate of 10 %). The second column gives the CO2 price needed to tip the balance when the payback period is shorter than three years and the third column indicates the CO2 price needed to make the IRR equal to 12 % when the cash flows are discounted over 10 years. Comparison of the different prices given in Table 25 confirms that the payback period criterion (used as a decision criteria for cost-effectiveness throughout this document) is very demanding. It gives a price almost twice the value needed to make the investment cost-competitive when the whole lifespan (25 years) of the facility and a discount rate of 10 % are considered. The prices needed to make the investment attractive, with an IRR of 12 %, are more in line with the valued obtained considering the whole lifespan. However, as this baseline scenario shows, even with a payback period shorter than three years there are many possible retrofittings that are cost-effective for the industry.

73
Investment cost IRR (10 %, 25y) Payback IRR (12 %, 10y)
M€ €/t CO2 €/t CO2 €/t CO2 295 118.1 238.4 153.0 110 78.7 124.2 92.3
Table 25: CO2 allowance prices needed to make the investment attractive under several decision criteria
7.2.2 Alternative scenario 1 The first alternative scenario analyses the effect of different fuel prices on thermal energy consumption. The heavy impact of fuel costs on the final price of cement manufacturing can be considered one of the main drivers for the take-up of new technologies. In the model, the savings in fuel consumption are achieved by retrofitting kilns and coolers and building new facilities to replace uncompetitive plants. This section analyses four different cases:
• Case Ref 1x — Baseline case — fuel prices following current trends;
• Case 2x — final fuel price in 2030 double that in the baseline case. In this and in the other two cases the baseline prices are scaled up linearly;
• Case 5x — final fuel prices five times the baseline prices;
• Case 10x — final fuel prices ten times the baseline prices. The fossil fuel prices between 2002 and 2008 are the same for all four cases and based on [46] [European Commission 2007]. Therefore the fuel price projections are for the years 2008 up to 2030. Figure 29 shows the weighted average thermal consumption over the simulation period for the cement industry in EU27 for the four cases studied. The reference range for the thermal energy consumption corresponds to the operational variability in a facility with a humidity content of around 3 % in the raw materials.
Figure 29: Weighted average thermal consumption over the simulation period for cases Ref 1x, 2x and 5x and reference range

74
The results in Figure 29 show that the higher the fuel prices the higher the incentive for the industry to improve its energy efficiency. Case Ref 1x produces the highest thermal consumption in 2030 and case 10x the lowest. Nevertheless, the difference in thermal energy consumption between the two cases is low, at only 1.4 % in 2030 (around 47 MJ/tonne of clinker). The continuous increase in fuel prices in case Ref 1x is unable to promote lower energy consumption far beyond 2030, whereas in case 10x there is a continuous downward trend in thermal consumption that extends beyond 2030. Finally, Figure 30 presents the weighted average CO2 emissions over the simulation period from the cement industry in EU27 for the cases studied. The benchmarks for CO2 emissions from the cement industry have also been added for each year.
Figure 30: Weighted average CO2 emissions over the simulation period for cases Ref 1x, 2x and 5x and BM
7.2.3 Alternative scenario 2 The second alternative scenario studies the effect of the price of CO2 emissions. It can be expected to offer a significant incentive to decrease CO2 emissions and energy consumption simultaneously. The reference case for this scenario reflects the consumption and emission trends if fuel and CO2 prices evolve in the future as expected [46] [European Commission 2007]. The rest of the cases analyse the effect of different final prices for CO2 allowances in 2030. In these cases the baseline price is scaled up linearly to obtain the final price in 2030. Four cases are studied:
• Case Ref 25.8 eur — Baseline case, current trend in CO2 emission prices reaching 25.8 € 2008 in 2030;
• Case 50 eur — final CO2 emission price 50 € 2008 in 2030;
• Case 100 eur — final CO2 emission price 100 € 2008 in 2030;
• Case 150 eur — final CO2 emission price 150 € 2008 in 2030.

75
Figure 31: Weighted average thermal consumption over the simulation period for cases Ref 25.8, 50, 100 and 150 €/t CO2 and reference range
The difference in thermal energy consumption between the cases with the highest and the lowest CO2 prices is around 1 % in 2030 (around 30 MJ/t clinker). This difference is similar to the small variation observed in the cases in alternative scenario 1. In alternative scenario 2, when the CO2 price increased by a factor of seven, the thermal consumption decreased by 1 %. In alternative scenario 1 when the fuel prices rose tenfold, the thermal energy consumption decreased by 1.4 %. Finally, Figure 32 shows the weighted average CO2 emissions over the simulation period for the cement industry in EU27 for the cases studied. The reference range for the CO2 emissions in the cement industry is also added. The results of this figure also show that the increase in the CO2 emission prices produces a small reduction in the CO2 emissions due to the decrease in fuel consumption.
Figure 32: Weighted average CO2 emissions over the simulation period for cases Ref 25.8, 50, 100 and 150 €/t CO2 and reference range

76
The electricity trend was not studied due to the fact that in this model any possible retrofitting in kilns and coolers will not affect the electricity consumption in the cement mills. Therefore, the electricity consumption for the cases studied and the baseline scenario remains the same.
7.3 Conclusions
Three different scenarios have been analysed in this study: a baseline scenario and two alternative scenarios. In each of the alternatives, different sensitivity cases have been tested (varying the values of the main parameter that defined this scenario). In general terms, the model has shown the influence of the main drivers for early take-up of innovative technologies in the industry. Fossil fuel prices and CO2 prices are not as decisive for decreasing emissions and consumption as phasing out uncompetitive facilities (in the model facilities are phased out for economic reasons, not by age). The mechanism adopted to model trends in the industry produces an improvement per tonne of clinker of around 10 % in energy efficiency with a decrease in CO2 emissions of about 4 % from 2006 to 2030. The different costs, fuel prices and CO2 emissions used in the alternative scenarios lead to an additional improvement of about 1 to 3 %. The insensitivity of the alternative scenarios to different CO2 emissions and fuel prices proves that the expected trend leaves little room for any additional improvements in the industry after 2030. The values obtained by the model for the average thermal energy consumption in 2030 (around 3350 MJ/t clinker) are in line with the value expected in 2030 by [48] [CSI/ECRA 2009b] (3400 MJ/ t clinker) and used in the Cement Technology Roadmap 2009 [89] [WBCSD/IEA 2009]. The decrease in thermal energy consumption achieved in 2030 places the European average consumption close to the upper value of the possible benchmark values for an individual facility with low humidity content in the raw materials. In any case, the low price of electricity does not allow the model to proceed with any improvements in the mills nor in waste heat recovery (WHR) systems. The effect of using the net present value as a decision criterion has been analysed to complement the decision-making method for investments. It can be concluded that in the best case (with a high electricity price) WHR is close to being cost-effective. Apart from the fact that CCS technologies are not available yet, post-combustion is far from cost-effective in the simulation applying the payback period criterion and the CO2 prices considered. Using an internal rate of return of 12 % and considering 10 years, the prices needed to make CCS technology cost-effective are more in line with the CO2 prices given in the literature considering a lifespan of 25 years and a discount rate of 10 %. Nevertheless, the cost of the CO2 abated can result in doubling or even tripling the final price of the cement.
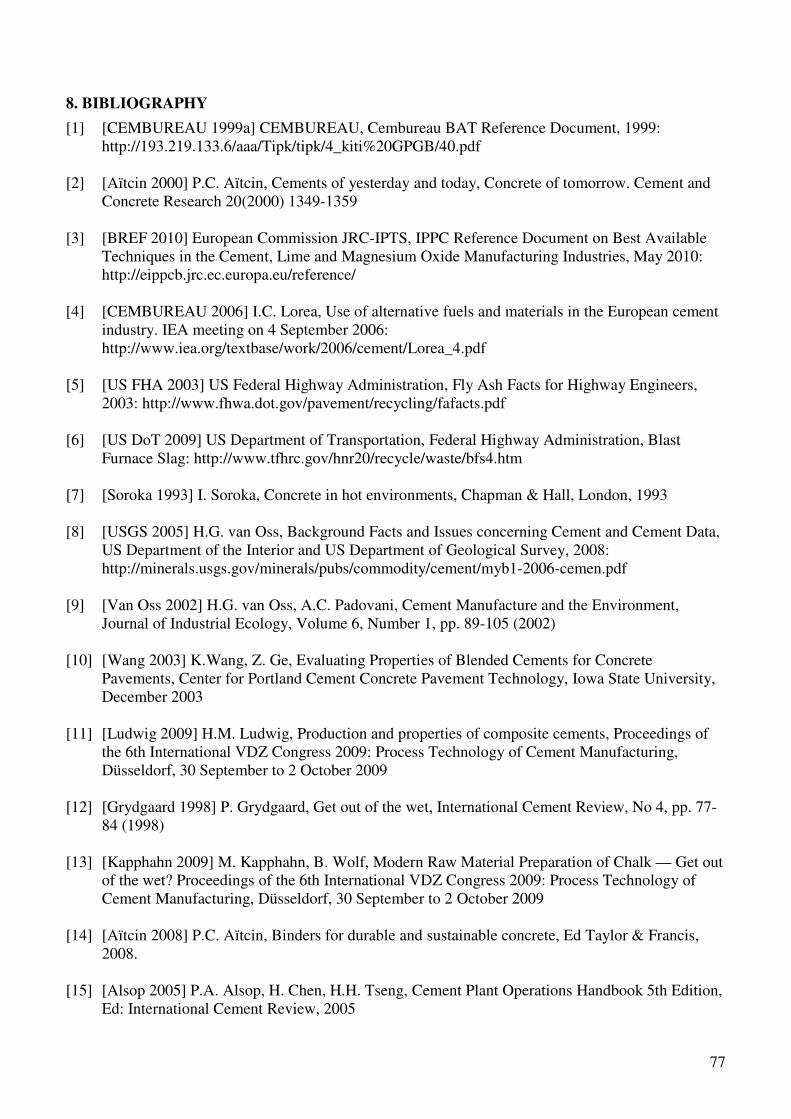
77
8. BIBLIOGRAPHY
[1] [CEMBUREAU 1999a] CEMBUREAU, Cembureau BAT Reference Document, 1999: http://193.219.133.6/aaa/Tipk/tipk/4_kiti%20GPGB/40.pdf [2] [Aïtcin 2000] P.C. Aïtcin, Cements of yesterday and today, Concrete of tomorrow. Cement and
Concrete Research 20(2000) 1349-1359 [3] [BREF 2010] European Commission JRC-IPTS, IPPC Reference Document on Best Available
Techniques in the Cement, Lime and Magnesium Oxide Manufacturing Industries, May 2010: http://eippcb.jrc.ec.europa.eu/reference/ [4] [CEMBUREAU 2006] I.C. Lorea, Use of alternative fuels and materials in the European cement
industry. IEA meeting on 4 September 2006: http://www.iea.org/textbase/work/2006/cement/Lorea_4.pdf [5] [US FHA 2003] US Federal Highway Administration, Fly Ash Facts for Highway Engineers,
2003: http://www.fhwa.dot.gov/pavement/recycling/fafacts.pdf [6] [US DoT 2009] US Department of Transportation, Federal Highway Administration, Blast
Furnace Slag: http://www.tfhrc.gov/hnr20/recycle/waste/bfs4.htm [7] [Soroka 1993] I. Soroka, Concrete in hot environments, Chapman & Hall, London, 1993 [8] [USGS 2005] H.G. van Oss, Background Facts and Issues concerning Cement and Cement Data,
US Department of the Interior and US Department of Geological Survey, 2008: http://minerals.usgs.gov/minerals/pubs/commodity/cement/myb1-2006-cemen.pdf [9] [Van Oss 2002] H.G. van Oss, A.C. Padovani, Cement Manufacture and the Environment,
Journal of Industrial Ecology, Volume 6, Number 1, pp. 89-105 (2002) [10] [Wang 2003] K.Wang, Z. Ge, Evaluating Properties of Blended Cements for Concrete
Pavements, Center for Portland Cement Concrete Pavement Technology, Iowa State University, December 2003
[11] [Ludwig 2009] H.M. Ludwig, Production and properties of composite cements, Proceedings of
the 6th International VDZ Congress 2009: Process Technology of Cement Manufacturing, Düsseldorf, 30 September to 2 October 2009
[12] [Grydgaard 1998] P. Grydgaard, Get out of the wet, International Cement Review, No 4, pp. 77-
84 (1998) [13] [Kapphahn 2009] M. Kapphahn, B. Wolf, Modern Raw Material Preparation of Chalk — Get out
of the wet? Proceedings of the 6th International VDZ Congress 2009: Process Technology of Cement Manufacturing, Düsseldorf, 30 September to 2 October 2009
[14] [Aïtcin 2008] P.C. Aïtcin, Binders for durable and sustainable concrete, Ed Taylor & Francis,
2008. [15] [Alsop 2005] P.A. Alsop, H. Chen, H.H. Tseng, Cement Plant Operations Handbook 5th Edition,
Ed: International Cement Review, 2005

78
[16] [Nobis 2009] R. Nobis, Burning technology, Proceedings of the 6th International VDZ Congress 2009: Process Technology of Cement Manufacturing, Düsseldorf, 30 September to 2 October 2009
[17] [Auxilia 2009] G.B. Auxilia, Raw Material Extraction and Grinding Technologies, Proceedings
of the 6th International VDZ Congress 2009: Process Technology of Cement Manufacturing, Düsseldorf, 30 September to 2 October 2009
[18] [Directive 2008/1/EC] Directive 2008/1/EC of the European Parliament and of the Council of
15 January 2008 concerning integrated pollution prevention and control: http://eur-lex.europa.eu/LexUriServ/LexUriServ.do?uri=OJ:L:2008:024:0008:0029:en:PDF [19] [Directive 1996/61/EC] Council Directive 96/61/EC of 24 September 1996 concerning integrated
pollution prevention and control [20] [European Commission 2009d] Summary of the integrated pollution prevention and control IPPC
Directive: http://europa.eu/legislation_summaries/environment/waste_management/l28045_en.htm [21] [BREF 2001] European Commission JRC-IPTS, IPPC Reference Document on Best Available
Techniques in the Cement and Lime Manufacturing Industries, December 2001: ftp://ftp.jrc.es/pub/eippcb/doc/clp_bref_1201.pdf [22] [Lorea, C. 2009] C. Lorea, BAT in the European cement industry: outcome of the BREF revision
— dust, NOx, abatement, energy efficiency, trace elements, alternative fuels and materials, Proceedings of the 6th International VDZ Congress 2009: Process Technology of Cement Manufacturing, Düsseldorf, 30 September to 2 October 2009
[23] [Bauer 2009] K. Bauer, V. Hoenig, Energy efficiency of cement plants, Proceedings of the 6th
International VDZ Congress 2009: Process Technology of Cement Manufacturing, Düsseldorf, 30 September to 2 October 2009
[24] [UNFCCC 2009] United Nations Framework Convention on Climate Change (UNFCCC):
http://unfccc.int/kyoto_protocol/items/2830.php [consulted on 20 October 2009] [25] [Directive 2003/87/EC] Directive 2003/87/EC of the European Parliament and of the Council of
13 October 2003 establishing a scheme for greenhouse gas emission allowance trading within the Community and amending Council Directive 96/61/EC:
http://eur-lex.europa.eu/LexUriServ/LexUriServ.do?uri=OJ:L:2003:275:0032:0046:EN:PDF [26] [Directive 2009/29/EC ] Directive 2009/29/EC of the European Parliament and of the Council of
23 April 2009 amending Directive 2003/87/EC so as to improve and extend the greenhouse gas emission allowance trading scheme of the Community:
http://eur-lex.europa.eu/LexUriServ/LexUriServ.do?uri=OJ:L:2009:140:0063:0087:EN:PDF [27] [European Parliament 2008] European Parliament, Economic and Scientific Policy Department,
Competitive distortions and leakage in a world of different carbon prices. Trade, competitiveness and employment challenges when meeting the post-2012 climate commitments in the European Union, July 2008:
http://www.europarl.europa.eu/activities/committees/studies/download.do?file=21551

79
[28] [Mohr 2009] V. Graichen, F.C. Matthes, L. Mohr, K. Schumacher, Impacts of the EU ETS on industrial competitiveness in Germany, Conference on the International Dimensions of Climate Policies, Bern, 21-23 January 2009:
http://www.nccr-climate.unibe.ch/conferences/climate_policies/working_papers/Mohr.pdf [29] [Climate Strategies 2007] Climate Strategies Report, Differentiation and Dynamics of EU ETS
Industrial Competitiveness Impacts, 2007: http://www.climatestrategies.org/component/reports/category/17/37.html [30] [European Commission 2009c] Draft Commission Decision, approved by the Member States at a
meeting of the Climate Change Committee on 18 September 2009: http://ec.europa.eu/environment/climat/emission/pdf/draft_dec_carbon_leakage_list16sep.pdf [31] [ECOFYS 2009a] Ecofys, Fraunhofer Institute for Systems and Innovation Research, Öko-
Institut, Methodology for the free allocation of emissions allowances in the EU ETS post-2012, Report on the project approach and general issues, November 2009
[32] [ECOFYS 2009b] Ecofys, Fraunhofer Institute for Systems and Innovation Research, Öko-
Institut, Methodology for the free allocation of emissions allowances in the EU ETS post-2012, Sector report for the cement industry, November 2009
[33] [Directive 2008/98/EC] Directive 2008/98/EC of the European Parliament and of the Council of
19 November 2008 on waste and repealing certain Directives [34] [Directive 2006/12/EC] Directive 2006/12/EC of the European Parliament and of the Council of
5 April 2006 on waste [35] [Directive 2000/76/EC] Directive 2000/76/EC of the European Parliament and of the Council of
4 December 2000 on the incineration of waste: http://eur-lex.europa.eu/LexUriServ/LexUriServ.do?uri=CELEX:32000L0076:EN:HTML [36] [Directive 2004/8/EC] Directive 2004/8/EC of the European Parliament and of the Council of
11 February 2004 on the promotion of cogeneration based on a useful heat demand in the internal energy market and amending Directive 92/42/EEC
[37] [Price 2006] L. Price, Global Energy Use, CO2 Emissions and the Potential for Reduction in the
Cement Industry, Cement Energy Efficiency Workshop Organised by the IEA in cooperation with WBCSD, Paris, 4-5 September 2006:
http://www.iea.org/textbase/work/2006/cement/Price_Worrell.pdf [38] [IEA 2008a] D. Gielen, IEA G8 activities and the cement industry, November 2008: http://www.wbcsdcement.org/pdf/14gielen_iea_eng.pdf [39] [WBCSD 2009a] World Business Council for Sustainable Development (WBCSD), Cement
Sustainability Initiative — Sectoral Approach Briefing Note, May 2009: http://www.wbcsdcement.org/pdf/CSI%20Sectoral%20Approach%20briefing.pdf [40] [ECOFYS 2008] N. Höhne, C. Ellermann, A sectoral approach and technology transfer for the
cement sector, ECOFYS, August 2008: http://www.bafu.admin.ch/klima/index.html?lang=en&download=NHzLpZeg7t,lnp6I0NTU042l
2Z6ln1ad1IZn4Z2qZpnO2Yuq2Z6gpJCFeYR6fGym162epYbg2c_JjKbNoKSn6A--.pdf

80
[41] [Cai 2009] W. Cai, C. Wang, W. Liu, Z. Mao, H. Yu, J. Chen, Sectoral analysis for international technology development and transfer: Cases of coal-fired power generation, cement and aluminium in China, Energy Policy 37 (2009) 2283-2291
[42] [CEMBUREAU 2009c] CEMBUREAU, Activity report 2008, May 2009: http://www.cembureau.be/Documents/Publications/Activity%20Report%202008.pdf [43] [CEMBUREAU 2000] CEMBUREAU, Best available techniques for the cement industry, March
2000: http://www.cembureau.be/Documents/Publications/CEMBUREAU_BAT_Reference_Document
_2000-03.pdf [44] [CEMBUREAU 1997] CEMBUREAU, Alternative Fuels in Cement Manufacture, 1997: http://www.cembureau.be/Documents/Publications/Alternative_Fuels_in_Cement_Manufacture_
CEMBUREAU_Brochure_EN.pdf [45] [IEA 2008] IEA Greenhouse Gas R&D programme, CO2 Capture in the Cement Industry,
Technical Study, Report Number: 2008/3, July 2008 [46] [European Commission 2007] European Commission, Directorate-General for Energy and
Transport, European Energy and Transport Trends to 2030 — Update 2007: http://ec.europa.eu/dgs/energy_transport/figures/trends_2030_update_2007/energy_transport_tre
nds_2030_update_2007_en.pdf [47] [CEMBUREAU 2006b] CEMBUREAU, Cembureau contribution to the cement & lime BREF
revision, ‘Specific energy consumption’, May 2006 [48] [CSI/ECRA 2009] WBCSD/CSI — ECRA (World Business Council for Sustainable
Development/Cement Sustainability Initiative — European Cement Research Academy), Development of State-of-the-Art-Techniques in Cement Manufacturing: Trying to look ahead, Düsseldorf, Geneva, 4 June 2009
[49] [WBCSD/CSI 2009] WBCSD/CSI (World Business Council for Sustainable
Development/Cement Sustainability Initiative), Global Cement Database on CO2 and Energy Information:
http://www.wbcsdcement.org/GNRv2/geo/GNR-Indicator_3212-geo.html http://www.wbcsdcement.org/GNRv2/geo/GNR-Indicator_338-geo_Europe-allyear.html [50] [IEA 2006] M. Taylor, C. Tam, D. Gielen, Energy Efficiency and CO2 Emissions from the
Global Cement Industry, Paper prepared for the IEA-WBCSD workshop: Energy Efficiency and CO2, Paris, 4-5 September 2006:
http://www.iea.org/Textbase/work/2006/cement/taylor_background.pdf [51] [WBCSD 2009b] World Business Council for Sustainable Development (WBCSD), The Cement
Sustainability Initiative (CSI), Cement Industry Energy and CO2 Performance: Getting the Numbers Right, June 2009:
http://www.wbcsd.org/includes/getTarget.asp?type=d&id=MzUwNTg [52] [IEA 2007] International Energy Agency, Tracking Industrial Energy Efficiency and CO2
emissions, 2007

81
[53] [IPCC 2006] 2006 Intergovernmental Panel on Climate Change (IPCC) Guidelines for National Greenhouse Gas Inventories, Volume 2, Energy: http://www.ipcc-nggip.iges.or.jp/
[54] [EIA 2009] Energy Information Administration, Official Energy Statistics from the US
Government, Voluntary Reporting of GHG Program: Fuel and Energy Source Codes and Emissions Coefficients:
http://www.eia.doe.gov/oiaf/1605/coefficients.html [55] [ECRA, 2007] European Cement Research Academy (ECRA), Carbon Capture Technology —
Options and Potential, Technical Report TR 044/2007 [56] [CEMBUREAU 2002] CEMBUREAU, World Cement Directory, 11th ed., Cembureau, 2002: http://www.cembureau.be/ [57] [CEMBUREAU 2009d] CEMBUREAU, Co-processing of alternative fuels and raw materials in
the European cement industry, February 2009: http://www.cembureau.be/Cem_warehouse/SUSTAINABLE%20CEMENT%20PRODUCTION
%20BROCHURE.PDF [58] [Vanderborght 2008] B. Banderborght, J. Ruppert, CO2 savings from alternative fuels in the
cement industry, ECRA conference, Prague, 16 May 2008: http://www.voeb.at/media/FB%202008/07_vanderborght_c02_savings_from_alternative_fuels_i
n_the_cement.pdf [59] [CEMBUREAU 2004] Cement & Lime BREF Revision, Cembureau Contribution 2003 and
2004, Statistics on the Use of Alternative Fuels: http://www.iea.org/textbase/work/2006/cement/waste_streams.pdf [60] [ODYSSEE 2008] B. Lapillonne, K. Pollier, Energy efficiency trends in industry: EU versus
other OECD countries, September 2008: http://www.odyssee-indicators.org/reports/industry/industry_eu_08.pdf [61] [Trezza 2005] M.A. Trezza, A.N. Scian, Waste fuels: their effect on Portland cement clinker,
Cement and Concrete Research 35 (2005) 438-444 [62] [Gartner 2004] E. Gartner, Industrially interesting approaches to ‘low CO2’ cements, Cement and
Concrete Research 34 (2004) 1489-1498 [63] [Huntzinger 2009] D.N. Huntzinger, T.D. Eatmon, A life-cycle assessment of Portland cement
manufacturing: comparing the traditional process with alternative technologies, Journal of Cleaner Production 17 (2009) 668-675
[64] [LBNL-72E, 2008] Lawrence Berkeley National Laboratory Report 72E, Energy efficiency
improvements for the cement industry, January 2008: http://china.lbl.gov/sites/china.lbl.gov/files/Cement%20EEMs%20Compilation.English.doc [65] [LBNL-62806 rev2 2008] Lawrence Berkeley National Laboratory - 62806. rev2, World Best
Practice Energy Intensity Values for Selected Industrial Sectors, February 2008: http://china.lbl.gov/sites/china.lbl.gov/files/LBNL62806.World_Best_Practice.Feb2008.pdf [66] [CEN 2000] Comité Européen de Normalisation (CEN), Cement — Part 1: Composition,
specifications and conformity criteria for common cements, EN 197-1:2000, Brussels, Belgium
82
[67] [CEMBUREAU 2009b] EN 197-1:2000 — The 27 products in the family of common cements: http://www.cembureau.be/Documents/KeyFacts/ENV-197-1-2000.pdf [68] [Damtoft 2009] J. S. Damtoft, D. Herfort, Fit-for-Purpose Market-oriented Cements, Proceedings
of the 6th International VDZ Congress 2009: Process Technology of Cement Manufacturing, Düsseldorf, 30 September to 2 October 2009
[69] [EUR20769, 2003] European Commission JRC-IPTS, Energy consumptions and CO2 emissions
from the world cement industry, June 2003: ftp://ftp.jrc.es/pub/EURdoc/eur20769en.pdf [70] [Braig 2009] T. Braig, U. Mrowald, H. Rosemann, M. Seglias, Experiences with retrofitting of
planetary coolers to grate coolers, Proceedings of the 6th International VDZ Congress 2009: Process Technology of Cement Manufacturing, Düsseldorf, 30 September to 2 October 2009
[71] [LAFARGE 2008] Lafarge, 2008 Annual Report, Document de Référence: http://www.lafarge.com/03162009-publications_finance-annual_report_2008-uk.pdf [72] [Szabo 2006] L. Szabo, I. Hidalgo, J.C. Ciscar, A. Soria, CO2 emission trading within the
European Union and Annex B countries: the cement industry case, Energy Policy 34 (2006) 72-87
[73] [LBNL-54036 Rev 2008] Lawrence Berkeley National Laboratory, Energy Efficiency
Improvement and Cost Saving Opportunities for Cement Making, Report 54036, Revision March 2008:
http://china.lbl.gov/sites/china.lbl.gov/files/LBNL-54036-revision.doc [74] [LBNL-1989E 2008] Lawrence Berkeley National Laboratory, Guidebook for Using the Tool
BEST Cement: Benchmarking and Energy Savings Tool for the Cement Industry, Report 1989E, July 2008:
http://china.lbl.gov/sites/china.lbl.gov/files/LBNL1989E.BEST-Cement.Handbook.English.doc [75] [Batra 2005] V.K. Batra, P.K. Mittal, K. Kumar, P.N. Chhanangani, Modern Processing
Techniques to minimise cost in cement industry, Holtec Consulting Private Limited, Gurgaon, 2005
[76] [USDoE 2003] US Department of Energy, Energy and Emission Reduction Opportunities for the
Cement Industry, December 2003: http://www1.eere.energy.gov/industry/imf/pdfs/eeroci_dec03a.pdf [77] [Khurana 2002] S. Khurana, R. Banerjee, U. Gaitonde, Energy balance and cogeneration for a
cement plant, Applied Thermal Engineering 22 (2002) 485-494 [78] [USEPA 2007] US Environmental Protection Agency, Energy Trends in Selected Manufacturing
Sectors: Opportunities and Challenges for Environmentally Preferable Energy Outcomes, March 2007:
http://www.epa.gov/ispd/pdf/energy/report.pdf [79] [Bronicki] L.Y. Bronicki, Organic Rankine Cycle Power Plant for Waste Recovery, ORMAT
International Inc.
83
[80] [Wang 2009] J. Wang, Y. Dai, L. Gao, Exergy analyses and parametric optimisations for different cogeneration power plants in cement industry, Applied Energy 86 (2009) 941-948
[81] [Engin 2005] T. Engin, V. Ari, Energy auditing and recovery for dry-type cement rotary kiln
systems — A case study, Energy Conversion and Management 46 (2005) 551-562 [82] [IPCC 2005] Intergovernmental Panel on Climate Change (IPCC) Special report on carbon
dioxide capture and storage, Cambridge University Press, 2005: http://www.ipcc.ch/ipccreports/srccs.htm [83] [Grönkvist 2006] S. Grönkvist, M. Bryngelsson, M. Westermark, Oxygen efficiency with regard
to carbon capture, Energy 31 (2006) 3220-3226 [84] [Zeman 2008] F. Zeman, K. Lackner, The Reduced Emission Oxygen Kiln, Lenfest Center for
Sustainable Energy, Columbia University in New York, Report No 2008, 1 July 2008: http://www.wbcsdcement.org/pdf/Colombia_kiln.pdf [85] [Zeman 2009] F. Zeman, Oxygen combustion in cement production, Energy Procedia 1 (2009)
187-194 [86] [IEA GHG 2008] International Energy Agency, CO2 capture in the cement industry, Report
2008/3, July 2008 [87] [Barker 2009] D.J. Barker, S.A. Turner, P.A. Napier-Moore, M. Clarck, J.E. Davison, CO2
capture in the cement industry, Energy Procedia (2009) 87-94 [88] [ECRA, 2009] European Cement Research Academy (ECRA), ECRA CCS Project — Report
about Phase II, Technical Report TR 106/2009 [89] [WBCSD/IEA 2009] World Business Council for Sustainable Development (WBCSD),
International Energy Agency, Cement Technology Roadmap 2009: Carbon emissions reductions up to 2050
[90] [Laurent 2009] M.H. Laurent, D. Osso, E. Cayre, Energy savings and costs of energy efficiency
measures: a gap from policy to reality? Proceedings of the ECEEE 2009 Summer Study, 1–6 June 2009, La Colle sur Loup, Côte d’Azur, France
[91] [Hegerland 2006] G. Hegerland, J.O. Pande, H.A. Haugen, N. Eldrup, L.A. Tokheim,
L.M. Hatlevik, Capture of CO2 from a cement plant — Technical possibilities and economic estimates, 8th International Conference on Greenhouse Gas Control Technologies, 19-22 June 2006, Trondheim, Norway

84

85
European Commission EUR 24592 EN – Joint Research Centre — Institute for Energy Title: Energy Efficiency and CO2 Emissions - Prospective Scenarios for the Cement Industry Author(s): J.A. Moya, N. Pardo, A. Mercier Luxembourg: Office for Official Publications of the European Communities 2010 – 83 pp. – 21.0 x 29.7 cm EUR — Scientific and Technical Research series — ISSN 1018-5593 ISBN 978-92-79-17644-9
doi:10.2790/25732
Abstract This document, prepared under the auspices of the SET-Plan Information System (SETIS), aims to assess the current role of technological innovation in improving energy efficiency and reducing CO2 emissions in the cement industry, the foreseeable technological developments and their market potential. The results for the baseline scenario show an improvement in the thermal energy efficiency and the CO2 emissions per tonne of clinker of around of 10% and 4% in 2030 compared to the level of 2006. However, the insensitivity of the alternative scenarios to higher CO2 and fuel prices prove that the large number of retrofits economically feasible in the base line scenario leave little room for any additional improvements in the industry.

86
How to obtain EU publications Our priced publications are available from the EU Bookshop (http://bookshop.europa.eu), where you can place an order with the sales agent of your choice. The Publications Office has a worldwide network of sales agents. You can obtain their contact details by sending a fax to (352) 29 29-42758.

The mission of the JRC is to provide customer-driven scientific and technical support for the conception, development, implementation and monitoring of EU policies. As a service of the European Commission, the JRC functions as a reference centre for science and technology for the Union. Close to the policy-making process, it serves the common interest of the Member States, while being independent of special interests, whether private or national.
L
D- N
A- 2
45
92
- EN
- C