request for proposals (rfp) - transportation agency for
TRANSCRIPT

U.S. Department of the InteriorU.S. Geological Survey
Occurrence of Organochlorine Compoundsin Whole Fish Tissue from Streamsof the Lower Susquehanna River Basin,Pennsylvania and Maryland, 1992
by Michael D. Bilger, Robin A. Brightbill, and Harry L. Campbell
Water-Resources Investigations Report 99-4065
Lemoyne, Pennsylvania1999

ii
U.S. DEPARTMENT OF THE INTERIOR
BRUCE BABBITT, Secretary
U.S. GEOLOGICAL SURVEY
Charles G. Groat, Director
For additional information Copies of this report may bewrite to: purchased from:
District Chief U.S. Geological SurveyU.S. Geological Survey Branch of Information Services840 Market Street Box 25286Lemoyne, Pennsylvania 17043-1586 Denver, Colorado 80225-0286

iii
Abstract . . . . . . . . . . . . . . . . . . . . . . . . . . . . . . . . . . . . . . . . . . . . . . . . . . . . . . . . . . . . . . . . . . . . . . . . . . . . . . . . . . . . 1
Introduction . . . . . . . . . . . . . . . . . . . . . . . . . . . . . . . . . . . . . . . . . . . . . . . . . . . . . . . . . . . . . . . . . . . . . . . . . . . . . . . . 1Description of study area. . . . . . . . . . . . . . . . . . . . . . . . . . . . . . . . . . . . . . . . . . . . . . . . . . . . . . . . . . . . . . . . 2Acknowledgments . . . . . . . . . . . . . . . . . . . . . . . . . . . . . . . . . . . . . . . . . . . . . . . . . . . . . . . . . . . . . . . . . . . . . 3
Study methods . . . . . . . . . . . . . . . . . . . . . . . . . . . . . . . . . . . . . . . . . . . . . . . . . . . . . . . . . . . . . . . . . . . . . . . . . . . . . . 3Site selection . . . . . . . . . . . . . . . . . . . . . . . . . . . . . . . . . . . . . . . . . . . . . . . . . . . . . . . . . . . . . . . . . . . . . . . . . . 3Sample collection . . . . . . . . . . . . . . . . . . . . . . . . . . . . . . . . . . . . . . . . . . . . . . . . . . . . . . . . . . . . . . . . . . . . . . 4Laboratory procedures. . . . . . . . . . . . . . . . . . . . . . . . . . . . . . . . . . . . . . . . . . . . . . . . . . . . . . . . . . . . . . . . . . 4Fish age determination . . . . . . . . . . . . . . . . . . . . . . . . . . . . . . . . . . . . . . . . . . . . . . . . . . . . . . . . . . . . . . . . . 6Data analysis . . . . . . . . . . . . . . . . . . . . . . . . . . . . . . . . . . . . . . . . . . . . . . . . . . . . . . . . . . . . . . . . . . . . . . . . . . 6
Organochlorine compounds in fish tissue . . . . . . . . . . . . . . . . . . . . . . . . . . . . . . . . . . . . . . . . . . . . . . . . . . . . . . . 7Concentrations in white sucker tissue. . . . . . . . . . . . . . . . . . . . . . . . . . . . . . . . . . . . . . . . . . . . . . . . . . . . . 7Concentrations in smallmouth bass tissue . . . . . . . . . . . . . . . . . . . . . . . . . . . . . . . . . . . . . . . . . . . . . . . . . 7Occurrence of compounds in the Lower Susquehanna River Basin . . . . . . . . . . . . . . . . . . . . . . . . . . . . 9Association of compound concentrations to land use . . . . . . . . . . . . . . . . . . . . . . . . . . . . . . . . . . . . . . 10Comparison of Lower Susquehanna River Basin results with results
of other studies and with established standards and guidelines. . . . . . . . . . . . . . . . . . . . . . . . . . . 10Comparison with previous studies in the basin . . . . . . . . . . . . . . . . . . . . . . . . . . . . . . . . . . . . . . 10Comparison of NAWQA studies in the Northeastern United States . . . . . . . . . . . . . . . . . . . . 11Comparison of NAWQA studies across the United States . . . . . . . . . . . . . . . . . . . . . . . . . . . . . 12Comparison with studies across the United States . . . . . . . . . . . . . . . . . . . . . . . . . . . . . . . . . . . 14Comparison with established standards and guidelines . . . . . . . . . . . . . . . . . . . . . . . . . . . . . . 15
Conclusions. . . . . . . . . . . . . . . . . . . . . . . . . . . . . . . . . . . . . . . . . . . . . . . . . . . . . . . . . . . . . . . . . . . . . . . . . . . . . . . . 16
References cited . . . . . . . . . . . . . . . . . . . . . . . . . . . . . . . . . . . . . . . . . . . . . . . . . . . . . . . . . . . . . . . . . . . . . . . . . . . . 16
ILLUSTRATIONS
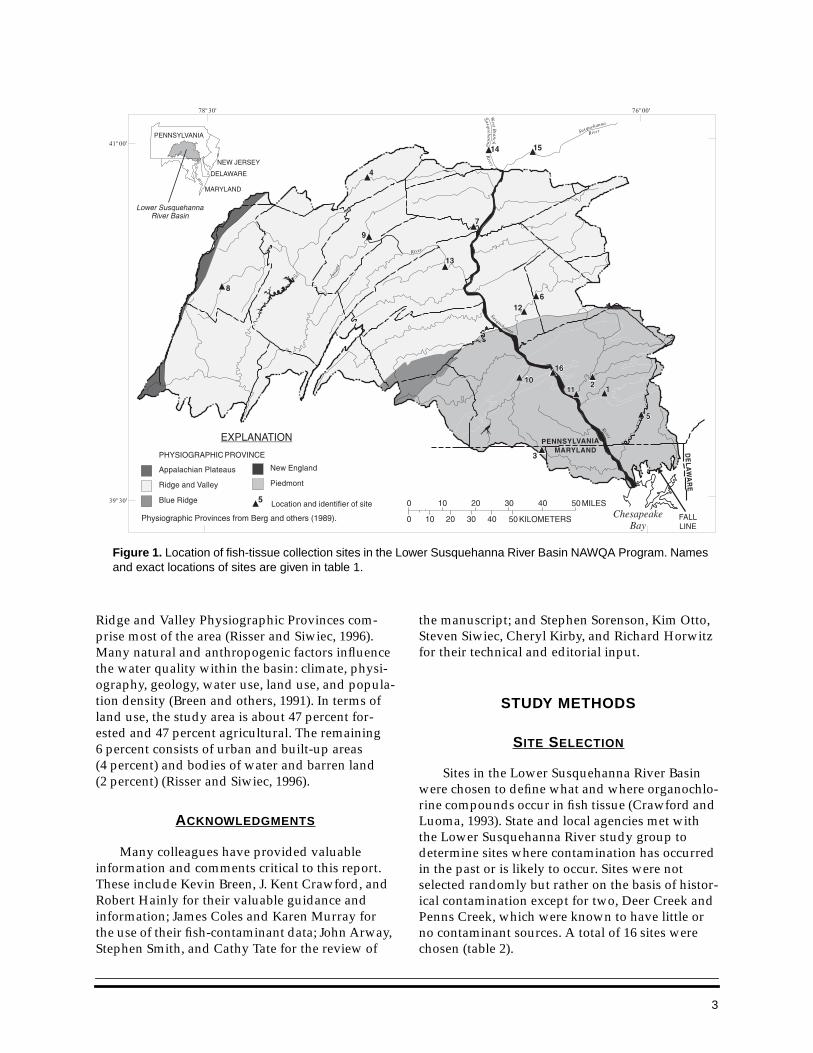
Figure 1. Map showing location of fish-tissue collection sites in the Lower SusquehannaRiver Basin NAWQA Program . . . . . . . . . . . . . . . . . . . . . . . . . . . . . . . . . . . . . . . . . . . . . 3
2-4. Graphs showing:2. Concentrations of total DDT in white sucker whole fish tissue for the Lower
Susquehanna, Hudson, and Connecticut River Basins . . . . . . . . . . . . . . . . . . . . . . 12
3. Concentrations of total PCB’s in white sucker whole fish tissue for the LowerSusquehanna, Hudson, and Connecticut River Basin . . . . . . . . . . . . . . . . . . . . . . . 13
4. Concentrations of total chlordane in white sucker whole fish tissue for theLower Susquehanna, Hudson, and Connecticut River Basin . . . . . . . . . . . . . . . . . 13
CONTENTS
Page

iv
Table 1. Compounds below method reporting limits in whole white sucker andsmallmouth bass tissue in the Lower Susquehanna River Basin, Pa. . . . . . . . . . . . . . 2
2. Characteristics of sites and basins selected for 1992 survey of contaminants infish tissue by the National Water-Quality Assessment Program, LowerSusquehanna River Basin, Pa. . . . . . . . . . . . . . . . . . . . . . . . . . . . . . . . . . . . . . . . . . . . . . . 4
3. Mean total length, weight, age, number of fish, and percent lipid content percomposite sample for survey of contaminants in fish tissue by the NationalWater-Quality Assessment Program, Lower Susquehanna River Basin, Pa. . . . . . . . 5
4. Reporting limits, spike recoveries, and surrogate recoveries for organochlorinecompounds detected in whole white sucker and smallmouth bass tissuefor samples collected in 1992-94 in the Lower Susquehanna River BasinNAWQA study . . . . . . . . . . . . . . . . . . . . . . . . . . . . . . . . . . . . . . . . . . . . . . . . . . . . . . . . . . 6
5. Concentrations of total PCB’s, total DDT and metabolites, and total chlordaneand components in white sucker samples collected in 1992 from the LowerSusquehanna River Basin, Pa. . . . . . . . . . . . . . . . . . . . . . . . . . . . . . . . . . . . . . . . . . . . . . . 8
6. Concentrations of total PCB’s, total DDT and metabolites, and total chlordaneand components in smallmouth bass samples collected in 1992 in theLower Susquehanna River Basin, Pa.. . . . . . . . . . . . . . . . . . . . . . . . . . . . . . . . . . . . . . . . 9
7. Comparison of median concentrations of total PCB’s, total DDT, and totalchlordane for the NAWQA study basins started in 1991 . . . . . . . . . . . . . . . . . . . . . . 13
8. Concentrations of total PCB’s, DDT metabolites, and chlordane components inwhole fish tissue from national surveys of contaminant concentrations . . . . . . . . . 14
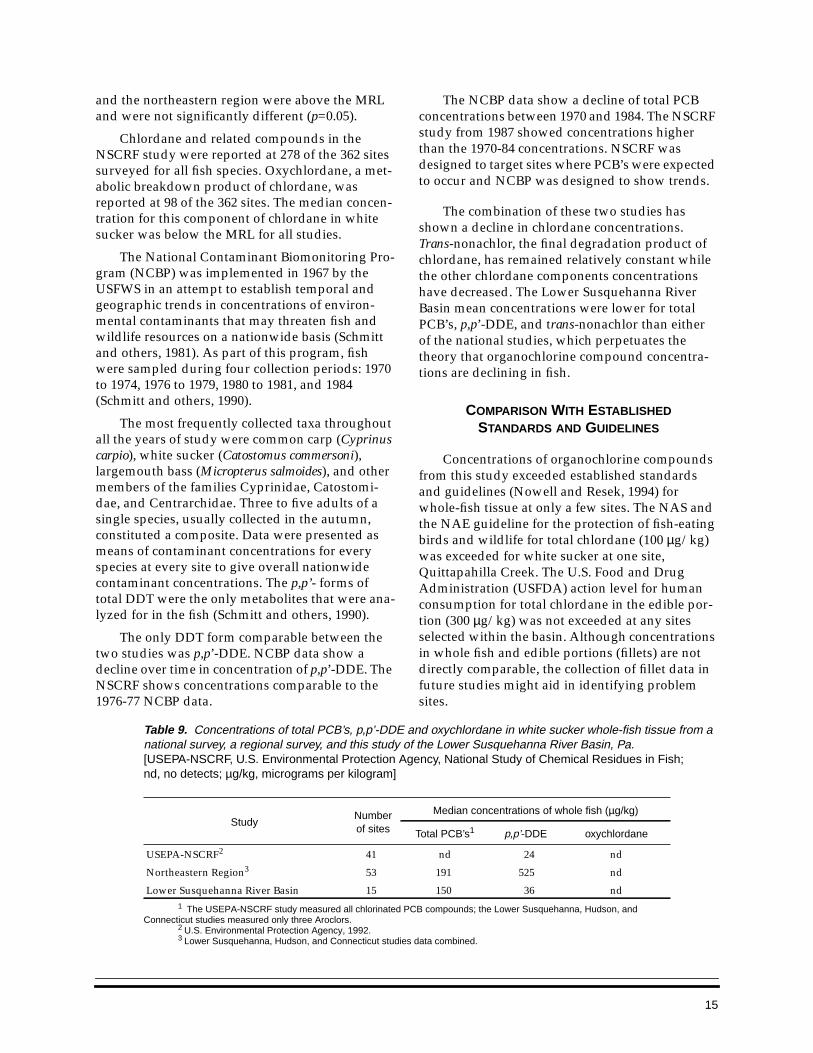
9. Concentrations of total PCB’s, p,p’-DDE and oxychlordane in white suckerwhole-fish tissue from a national survey, a regional survey, and this studyof the Lower Susquehanna River Basin, Pa. . . . . . . . . . . . . . . . . . . . . . . . . . . . . . . . . . 15
TABLES
Page

v
Length
centimeter (cm) 0.3937 inch
Area
square kilometer (km2) 0.3861 square mile
Volume
milliliter (mL) 0.03382 ounce, fluid
Mass
gram (g) 0.03527 ounce, avoirdupois
Abbreviated water-quality units used in report:
mg/kg, milligrams per kilogramµg/kg, micrograms per kilogrampg/µL, picograms per microliter
CONVERSION FACTORS AND ABBREVIATIONS
Multiply By To obtain


1
ABSTRACT
Tissue samples of whole body white sucker(Catostomus commersoni) were collected at 15 sites andsmallmouth bass (Micropterus dolomieu) were collectedat 5 sites during 1992 in the Lower Susquehanna RiverBasin to determine the occurrence and distribution of 28selected organochlorine compounds as part of the U.S.Geological Survey’s National Water-Quality Assess-ment (NAWQA) Program. Only 12 of the 28 com-pounds occurred at concentrations greater than the5 µg/kg reporting limit (total PCB’s reporting limit is<50 µg/kg and toxaphene is <200 µg/kg). The most fre-quently reported compounds were p,p’-DDE (reportedin all tissue samples), total polychlorinated biphenyls(PCB’s), and trans-nonachlor.
High concentrations of p,p’-DDE and low concen-trations of the other DDT metabolites for the LowerSusquehanna River sites indicate no recent influx ofDDT. Comparison with historical data from the LowerSusquehanna River Basin shows a decline of organo-chlorine concentrations within the basin. In 1987,Quittapahilla Creek had the highest concentrations ofp,p’-DDE in a national survey of contaminant occur-rence in fish tissue conducted by the U.S. Environmen-tal Protection Agency. This stream ranked the highestfor total DDT of the 20 NAWQA studies startednationally in 1991. Total DDT concentrations werehigher in agriculture-dominated (>50 percent) sitesthan in forest-dominated (>50 percent) sites with theexception of Deer Creek and Big Beaver Creek. Thesetwo sites are located more in grazing areas that lack asubstantial crop-land use. Concentrations of total PCB’swere highest in basins with greater than 10 percenturban land use excluding the larger river sites. Concen-trations of total chlordane were highest at sites withgreater than 70 percent agricultural and 10 percenturban land use.
Regional comparisons of total DDT, total PCB’s,and total chlordane in white sucker tissue from theLower Susquehanna, Hudson (in New York), and Con-necticut River Basins showed that median concentra-tions of total DDT were different (p=0.05), with theLower Susquehanna Basin being the lowest. Total PCB’sand total chlordane medians were similar. Comparisonof the data from national and regional studies with datafrom this local study showed concentrations ofp,p’-DDE in the Lower Susquehanna River Basin aresimilar to those nationwide and lower than the concen-trations measured in the Northeast. PCB concentrationsin the Lower Susquehanna River Basin and the North-east were higher than those nationwide.
INTRODUCTION
The U.S. Geological Survey’s (USGS) NationalWater-Quality Assessment (NAWQA) Program is along-term effort designed to evaluate the status of,and trends in, the quality of surface- and ground-water resources in the United States through anintegrated approach of physical, chemical, and bio-logical factors (Hirsch and others, 1988; Leahy andothers, 1990; Gurtz 1994; Gilliom and others, 1995).The program was designed to be conducted in 59separate river basins and aquifer systems thataccount for about two-thirds of the water use andpublic water supply in the United States (Leahyand Wilber, 1991). These basins comprise theframework for regional- and national-level assess-ments. The Lower Susquehanna River Basin study(Breen and others, 1991) was among the first 20NAWQA studies implemented.
The overall NAWQA Program includes bed-sediment and fish-tissue investigations; the objec-tives are to identify contaminant occurrence from abroad suite of compounds, determine any long-term trends in contaminant concentrations,describe spatial distribution of contaminants, and
OCCURRENCE OF ORGANOCHLORINE COMPOUNDS
IN WHOLE FISH TISSUE FROM STREAMS OF THE
LOWER SUSQUEHANNA RIVER BASIN,
PENNSYLVANIA AND MARYLAND, 1992
by Michael D. Bilger, Robin A. Brightbill, and Harry L. Campbell

2
examine the relations between contaminant con-centrations and land use (Crawford and Luoma,1993). Among these contaminants are PCB’s andorganochlorine compounds, which were in wide-spread use in the United States for nearly 40 yearsuntil banned or restricted in the 1970’s and 1980’s(Smith and others, 1988). Because of the low chem-ical reactivity, resistance to oxidation, and resis-tance to other degenerative processes of thesecompounds, residues of them have been shown tobe widely persistent in the environment (GreatLakes Basin Commission, 1975). The extent ofatmospheric deposition of long-lived, environmen-tally stable organochlorine compounds into sur-face waters is not well understood, but thesecompounds are known to accumulate in fish andmammals (including humans) at significant con-centrations (Majewski and Capel, 1995).
During 1992, concentrations of 28 organochlo-rine compounds were determined in whole-bodytissues of white sucker (Catostomus commersoni)and smallmouth bass (Micropterus dolomieu) col-lected in the Lower Susquehanna River Basin. Thisreport discusses the compounds that were presentabove the method reporting limits (MRL): totaldichlorodiphenyltrichloroethane (DDT), consistingof the sum of the o,p’- and p,p’- isomers of DDT andits metabolites dichlorodiphenyldichloroethane(DDD) and dichlorodiphenyldichloroethylene(DDE); total polychlorinated biphenyls (PCB’s),consisting of Aroclors 1242, 1254, and 1260; andtotal chlordane, reported as the sum of cis- andtrans-chlordane, cis- and trans-nonachlor, and oxy-chlordane. The organochlorine contaminants thatoccurred at concentrations below the 5 µg/kg MRLare in table 1. Toxaphene also occurred below itsMRL, which is 200 µg/kg.
The nationally consistent design of NAWQAenables results from the Lower Susquehanna RiverBasin study to be compared with results from otherriver basins across the United States. Thus, an
additional purpose of this report is to comparedata on selected organochlorine contaminant con-centrations in fish tissues of the Lower Susque-hanna River Basin with data from (1) the U.S. Fishand Wildlife Service (USFWS) study in Pennsylva-nia (Rompala and others, 1984), (2) the U.S. Envi-ronmental Protection Agency’s (USEPA) NationalStudy of Chemical Residues in Fish (NSCRF) (U.S.Environmental Protection Agency, 1992), and (3)NAWQA studies in the Hudson River and Con-necticut River Basins in the northeastern UnitedStates, (4) NAWQA studies across the UnitedStates, and (5) the USFWS National ContaminantBiomonitoring Program (NCBP) (Schmitt and oth-ers, 1990). Finally, data from the Lower Susque-hanna River Basin were compared to establishedstandards and guidelines for human consumption(Nowell and Resek, 1994) and protection of fish-eating wildlife (National Academy of Sciences andNational Academy of Engineering, 1973).
DESCRIPTION OF STUDY AREA
The Lower Susquehanna River Basin (fig. 1)consists of 24,087 km2 in Pennsylvania and Mary-land, extending from near Sunbury, Pa., in thenorth downstream to Havre de Grace, Md., in thesouth. The basin is inhabited by about 1.9 millionpeople, most of which (71 percent) reside in thesoutheastern part. For the analyses described inthis report, the study area also included two sitesnorth of Sunbury: the Susquehanna River at Dan-ville, Pa., and the West Branch Susquehanna Riverat Lewisburg, Pa. Seven major tributaries drainabout two-thirds of the Lower Susquehanna RiverBasin. The Juniata River, the largest tributary,drains about 8,800 km2 (Breen and others, 1991).
Five physiographic provinces are presentwithin the study area: the Ridge and Valley, theBlue Ridge, the Piedmont, the New England, andthe Appalachian Plateaus. The Piedmont and
Table 1. Compounds below method reporting limits in whole white sucker and smallmouth bass tissue in theLower Susquehanna River Basin, Pa.[µg/kg, micrograms per kilogram]
Compounds below reporting limit of 5 µg/kg
aldrin alpha-hexachlorocyclohexane heptachlor epoxide hexachlorobenzenedieldrin beta-hexachlorocyclohexane pentachloroanisole o,p’-methoxychlorendrin delta-hexachlorocyclohexane toxaphene1 p,p’-methoxychlorlindane heptachlor dacthal (DCPA) mirex
1 Method reporting limit of 200 µg/kg.
3
Ridge and Valley Physiographic Provinces com-prise most of the area (Risser and Siwiec, 1996).Many natural and anthropogenic factors influencethe water quality within the basin: climate, physi-ography, geology, water use, land use, and popula-tion density (Breen and others, 1991). In terms ofland use, the study area is about 47 percent for-ested and 47 percent agricultural. The remaining6 percent consists of urban and built-up areas(4 percent) and bodies of water and barren land(2 percent) (Risser and Siwiec, 1996).
ACKNOWLEDGMENTS
Many colleagues have provided valuableinformation and comments critical to this report.These include Kevin Breen, J. Kent Crawford, andRobert Hainly for their valuable guidance andinformation; James Coles and Karen Murray forthe use of their fish-contaminant data; John Arway,Stephen Smith, and Cathy Tate for the review of
the manuscript; and Stephen Sorenson, Kim Otto,Steven Siwiec, Cheryl Kirby, and Richard Horwitzfor their technical and editorial input.
STUDY METHODS
SITE SELECTION
Sites in the Lower Susquehanna River Basinwere chosen to define what and where organochlo-rine compounds occur in fish tissue (Crawford andLuoma, 1993). State and local agencies met withthe Lower Susquehanna River study group todetermine sites where contamination has occurredin the past or is likely to occur. Sites were notselected randomly but rather on the basis of histor-ical contamination except for two, Deer Creek andPenns Creek, which were known to have little orno contaminant sources. A total of 16 sites werechosen (table 2).
Figure 1. Location of fish-tissue collection sites in the Lower Susquehanna River Basin NAWQA Program. Namesand exact locations of sites are given in table 1.

4
SAMPLE COLLECTION
Fish were collected at these sites by electrofish-ing, in accordance with NAWQA guidelines. Tomaintain a national consistency in species selec-tion, the white sucker (Catostomus commersoni) (abottom feeder) was chosen as the target taxon(Crawford and Luoma, 1993). The smallmouthbass (Micropterus dolomieu) (a predator), althoughnot listed as a national target taxon, was chosenbecause of its importance as a recreational speciesthat is consumed by anglers in this study area. Anattempt was made to include both species at eachsite during the site-selection process; however, at12 sites, only one target taxon could be captured insufficient numbers to meet the minimum criterionfor sample size. Most samples were collected dur-ing the late summer and early fall to minimizeinterference with the reproductive periods of tar-get and nontarget fish species.
A sample constituted a composite of 5 to 10fish, ideally 8. Each fish was sacrificed, weighed,and measured for total and standard length. Exter-nal anomalies were recorded, and gender wasdetermined. For age determination, a scale sample
and pectoral fin-ray were removed from eachwhite sucker and scales were removed from eachsmallmouth bass. Whole fish were individuallywrapped in aluminum foil, and all individualswere placed into a polyethylene bag, frozen withdry ice, and sent to the laboratory.
White suckers were collected at 15 sites andsmallmouth bass at 5 sites. A summary of the com-posite physical characteristics of white sucker andsmallmouth bass collected for tissue analysis isgiven in table 3.
LABORATORY PROCEDURES
Analyses of organochlorine compounds andPCB’s for both fish species were done by the USGSNational Water Quality Laboratory (NWQL) inArvada, Colo. A brief summary of the methods fol-lows. A more detailed description can be found inLeiker and others (1995).
Whole fish were homogenized with a meatgrinder to form a single composite. An aliquot of10 g was extracted and homogenized with 100 g ofgranular anhydrous sodium sulfate to remove
Table 2. Characteristics of sites and basins selected for 1992 survey of contaminants in fish tissue by the NationalWater-Quality Assessment Program, Lower Susquehanna River Basin, Pa.
[km2, square kilometers]
Stream name and locationSite
identifieron figure 1
Drainagearea at
samplingsite (km2)
Numberof knownupstream
pointsources
Designateduse
Land use (percent)1
Agriculture Forest Urban
Big Beaver Creek at Refton, Pa. 1 51.3 1 Trout stocking 82.3 13.5 4.2Mill Creek near Lyndon, Pa. 2 51.3 5 Warm-water fishes 84.5 7.3 8.2Deer Creek at Gorsuch Mills, Md. 3 66.3 1 Cold-water fishes 75.2 21.8 3.0Penns Creek at Spring Mills, Pa. 4 106 1 Cold-water fishes 46.9 50.9 2.2East Branch Octoraro Creek near
Kirkwood, Pa.5 142 6 Trout stocking 79.4 17.2 3.6
Quittapahilla Creek near Palmyra, Pa. 6 200 13 Trout stocking 70.1 11.2 18.7West Mahantango Creek near Liverpool, Pa. 7 217 4 Trout stocking 43.5 56.3 .2Frankstown Branch Juniata River near
Hollidaysburg, Pa.8 350 15 Warm-water fishes 36.2 60.2 3.4
Kishacoquillas Creek at Lewistown, Pa. 9 490 6 Cold-water fishes 35.8 62.7 1.5Codorus Creek at Pleasureville, Pa. 10 627 28 Warm-water fishes 73.2 16.4 10.4Conestoga River near Safe Harbor, Pa. 11 1,235 55 Warm-water fishes 73.9 19.6 6.5Swatara Creek near Hershey, Pa. 12 1,250 38 Warm-water fishes 56.8 36.7 6.5Juniata River at Newport, Pa. 13 8,650 110 Warm-water fishes 29.5 68.2 2.3West Branch Susquehanna River at
Lewisburg, Pa.14 17,700 Many Warm-water fishes 13.9 81.0 5.1
Susquehanna River at Danville, Pa. 15 29,100 Many Warm-water fishes 26.4 59.8 13.8Susquehanna River at Columbia, Pa. 16 67,300 Many Warm-water fishes 34.9 64.7 .4
1 Mitchell and others, 1977

5
residual water. Next, two surrogates,α-hexachlorocyclohexane d6 (α-HCH d6) and 3,5-dichlorobiphenyl (3,5-DCB), were added to thesample, which was Soxhlet extracted overnight inmethylene chloride. The extract was then filteredthrough granular anhydrous sodium sulfate andconcentrated to a 5.0-mL volume. A 1.0-mL sampleof the concentrated extract was removed for deter-mination of percent lipid. A 2.0-mL sample of theextract was injected into an automated gelpermeation chromatograph to isolate the analytesfrom the lipid material that was coextracted. Theextract was then solvent exchanged into hexaneand further concentrated to a 1.0-mL volume. Theextract was fractionated into two components byuse of alumina/silica adsorption chromatography:nonpolar organics such as PCB’s and DDE,hexachlorobenzene (HCB), heptachlor, aldrin, and3,5-DCB surrogate; and polar organics such aschlordanes, toxaphene, DDT, and DDD. The frac-tions were then concentrated to a 1.0-mL volumeand analyzed by dual capillary column gas
chromatography (GC) with electron capturedetector (Leiker and others, 1995).
Identification of compounds was based on theGC retention times on both capillary columns com-pared to those obtained by use of external standardmixtures. The compound quantitation curve isbased on the calibration curves of 5, 10, 20, 50, 100,and 200 pg/µL for chlorinated pesticides,600 pg/µL for mixed Aroclor standards for PCB’s,and 800 pg/µL for toxaphene. The lower of the twoobserved concentrations from the two GC columnswas reported except where recognized compoundcoelutions or interferences resulted in single-col-umn quantification (Leiker and others, 1995).
The 12 compounds and 2 surrogates discussedin this report are listed in table 4. The MRL’s forfish tissue are 5.0 µg/kg on a wet-weight, whole-fish basis for all organochlorine compounds and50 µg/kg for PCB’s. The mean recovery for fivereagent spikes, the ranges of the reagent recover-ies, and their reagent-spike recovery ranges also
Table 3. Mean total length, weight, age, number of fish, and percent lipid content per composite sample for survey ofcontaminants in fish tissue by the National Water-Quality Assessment Program, Lower Susquehanna River Basin, Pa.
Site nameMean total
length(millimeters)
Meanweight(grams)
Meanage
(years)1
Numberof fish in
composite
Percentlipid content
by wet weight
White sucker
Big Beaver Creek 355 463 12 8 4.4Mill Creek 290 240 10 10 3.0Deer Creek 276 234 8 10 3.1Penns Creek 348 441 13 8 5.3East Branch Octararo Creek 342 406 11 8 6.4Quittapahilla Creek 400 740 14 8 6.9West Mahantango Creek 303 316 10 8 2.9Frankstown Branch Juniata River 319 354 12 8 4.4Kishacoquillas Creek 364 522 12 8 5.8Codorus Creek 366 568 12 8 6.0Conestoga River 347 453 13 6 5.0Swatara Creek 347 531 11 8 7.6Juniata River 267 235 8 8 12West Branch Susquehanna River 436 961 17 8 14Susquehanna River at Danville 391 733 14 8 8.5
Smallmouth bass
Conestoga River 273 224 2.+ 5 1.3Juniata River 208 116 1.+ 8 3.9West Branch Susquehanna River 368 669 3.+ 8 5.1Susquehanna River at Danville 377 681 4.+ 8 1.6Susquehanna River at Columbia 311 371 3.+ 8 3.2
1 Data from Cooperative Fish and Wildlife Research Unit, Pennsylvania State University, University Park, Pa.

6
are listed in table 4. Detailed information on MRL’sand quality-assurance procedures is given byLeiker and others (1995).
One duplicate sample was collected for whitesucker. The duplicate sample had concentrations ofo,p’-DDD, o,p’-DDE, o,p’-DDT, p,p’-DDT, cis-chlor-dane, trans-chlordane, cis-nonachlor, trans-non-achlor, and oxychlordane below the MRL. Thepercentage differences between the reported com-pound and the duplicate was 30 percent for PCB’s,232 percent for p,p’-DDD, and 16 percent forp,p’-DDE. The percentage difference for p,p’-DDDmay be exaggerated because the first sample wasbelow the MRL of 5 µg/kg and the duplicate was8.3 µg/kg.
FISH AGE DETERMINATION
The ages of white suckers were determined byanalysis of pectoral fin-ray samples (scale sampleswere not reliable) by the Cooperative Fish andWildlife Research Unit, Pennsylvania State Univer-sity, University Park, Pa., using a modification ofthe method described in Deelder and Willemse
(1973). The ages of smallmouth bass were deter-mined by reading annual rings from a sample ofabout 20 scales taken from below the lateral line,near the tip of the oppressed pectoral fin (Craw-ford and Luoma, 1993).
DATA ANALYSIS
For the Lower Susquehanna River Basin analy-sis, ranges of concentrations for individual com-pounds were reported. For concentrations belowthe MRL, a value of one-half the MRL was used incomputing concentrations of total DDT and totalchlordane (Harrison and Klaverkamp, 1990; Tateand Heiny, 1996).
Comparisons of regional data from the Hud-son (Firda and others, 1993), Connecticut (Coles,1996), and Lower Susquehanna River Basins werebased on median concentrations. Concentrationswere computed in the same manner as those forthe Lower Susquehanna River Basin. A mediantest (Zar, 1984), which is used to test for differencesbetween median values, was used to compare
Table 4. Reporting limits, spike recoveries, and surrogate recoveries for organochlorine compounds detected inwhole white sucker and smallmouth bass tissue for samples collected in 1992-94 in the Lower Susquehanna RiverBasin NAWQA study[Analyses by U.S. Geological Survey National Water Quality Laboratory (NWQL); µg/kg, micrograms per kilogram; n,sample size; <, less than; —, not applicable]
CompoundChemicalAbstractsnumber
Methodreportinglimit for
fish tissue(µg/kg)
Mean recoveryof five reagent
spikes forsamples from
this study(percent)
Range ofrecoveriesof reagentspikes for
samples fromthis study(percent)
NWQL rangefor reagent
spikes(percent), n
Total PCB’s — <50 — — —
o,p’-DDT 789-02-6 <5.0 89 76-107 76-102,33
p,p’-DDT 50-29-3 <5.0 96 82-110 73-99,34
o,p’-DDD 53-19-0 <5.0 94 86-107 76-100,34
p,p’-DDD 72-54-8 <5.0 102 88-111 69-115,22
o,p’-DDE 3424-82-6 <5.0 79 66-108 67-95,34
p,p’-DDE 72-55-9 <5.0 88 74-105 76-104,34
cis-chlordane 5103-71-9 <5.0 86 78-103 71-93,34
trans-chlordane 5103-74-2 <5.0 90 76-100 74-98,34
cis-nonachlor 5103-73-1 <5.0 83 62-100 67-97,34
trans-nonachlor 39765-80-5 <5.0 90 80-101 74-96,34
oxychlordane 27304-13-8 <5.0 86 75-100 73-101,34
α-d6-HCH surrogate — — 60 35-109 51-77,33
3,5-dichlorobiphenyl surrogate 34883-41-5 — 61 30-83 42-68,33

7
medians from the Lower Susquehanna (n=15),Hudson (n=7), and Connecticut River Basins(n=31). The procedure for this test is to 1) deter-mine the grand median for all data in two samplesand 2) set up a 2 X 2 contingency table. This tablecan be analyzed using chi-square.
For comparisons of national to regional andlocal results, the same method of using half theMRL to compute median values was used. Aregional median for PCB’s, total DDT, and totalchlordane was computed by combining the 1992data from the Connecticut, Hudson, and LowerSusquehanna River Basin studies. A median test(Zar, 1984) was used to compare medians betweenthe local, regional, and national studies.
ORGANOCHLORINE COMPOUNDSIN FISH TISSUE
Organochlorine compounds were detected inwhite suckers and smallmouth bass tissue. Thecompounds most frequently detected in both spe-cies were total PCB’s, p,p’-DDT, and trans-non-achlor.
CONCENTRATIONS INWHITE SUCKER TISSUE
White suckers were sampled at 15 sites. Themean total length of fish from the composited sam-ples was 34.3 cm (range = 27.6-43.6 cm), meanweight was 480 g (range = 234-961 g), and meanpercent lipid was 6.4 (range = 2.9-14). Mean agewas 12 years (range = 8-17 years). The most fre-quently reported compounds from the 15 samplesof whole fish were p,p’-DDE (15 samples), totalPCB’s (12 samples), trans-nonachlor (10 samples),p,p’-DDT (9 samples), cis-chlordane (8 samples),and p,p’-DDD (6 samples). Compounds alsoreported were cis-nonachlor (5 samples), oxychlor-dane (3 samples), trans-chlordane (3 samples),o,p’-DDD (3 samples), o,p’-DDE (2 samples), ando,p’-DDT (1 sample). Results are listed in table 5.
Reported DDT metabolite concentrations var-ied widely among the sites. All DDT metaboliteswere reported at Quittapahilla Creek, and the few-est at Penns Creek, Deer Creek, Big Beaver Creek,Frankstown Branch Juniata River, and the JuniataRiver (table 5). A metabolite of total DDT,p,p’-DDE, was reported in all 15 samples.
Concentrations of total DDT in white suckertissue ranged from 18 µg/kg at Juniata River to3,400 µg/kg at Quittapahilla Creek. The highest
single metabolite concentration, also recorded atQuittapahilla Creek, was 1,600 µg/kg for p,p’-DDE(table 5). The percentage of total DDT measured asp,p’-DDE ranged from 27 percent to 81 percent; themean percentage for the basin was 57 percent.
Data collected in this study indicate a wide-spread occurrence of PCB’s, in that they werereported in 80 percent of the white sucker samplescollected (table 5). The concentrations of totalPCB’s ranged from <50 µg/kg at Penns Creek,Deer Creek, and West Mahantango Creek to1,500 µg/kg at Codorus Creek.
Chlordane and its related components (U.S.Environmental Protection Agency, 1993) werereported in tissues collected from 67 percent of thesites (table 5). All five components of total chlor-dane were reported in tissues collected from Quit-tapahilla Creek and Codorus Creek. No chlordanecomponents were above the MRL in samples fromPenns Creek, Deer Creek, West Mahantango Creek,Frankstown Branch of the Juniata River, or themainstem Juniata River.
Concentrations of total chlordane ranged from13 µg/kg (calculated using 1/2 MRL) at the fivesites listed above to 120 µg/kg at QuittapahillaCreek. The highest single-component concentra-tion was at Quittapahilla Creek, where the concen-tration of cis-chlordane was 38 µg/kg. The finaldegradation product of chlordane, trans-nonachlor,ranged from 19 percent to 48 percent of the total;the mean for the basin was 32 percent.
CONCENTRATIONS INSMALLMOUTH BASS TISSUE
Smallmouth bass were sampled at five sites,four of which coincided with white suckercollections. The mean total length of fish from thecomposited samples was 30.7 cm (range =20.8-37.7 cm), mean weight was 412 g (range =116-681 g), and mean percent lipid was 3.0 (range =1.3-5.1). Mean age of each composite ranged from1+ to 4+ years. The most frequently reportedorganochlorine contaminants were total PCB’s(5 samples), p,p’-DDE (5 samples), and trans-non-achlor (5 samples) (table 6).
DDT metabolites were reported at the threeSusquehanna River mainstem sites (table 6). Sam-ples from all sites contained p,p’-DDE at levelsabove the MRL. Concentrations of total DDTranged from 30 µg/kg at the Juniata River to77 µg/kg at the Susquehanna River at Columbia.The highest concentration of a metabolite,
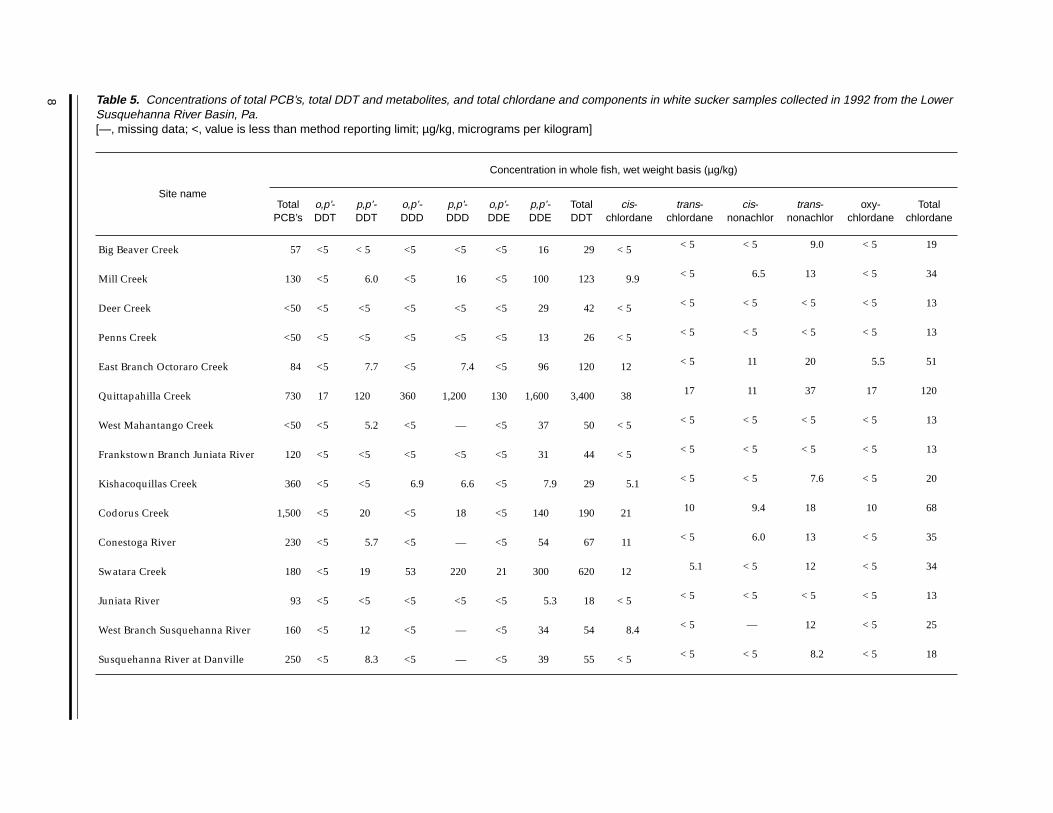
8 Table 5. Concentrations of total PCB’s, total DDT and metabolites, and total chlordane and components in white sucker samples collected in 1992 from the LowerSusquehanna River Basin, Pa.[—, missing data; <, value is less than method reporting limit; µg/kg, micrograms per kilogram]
Site name
Concentration in whole fish, wet weight basis (µg/kg)
TotalPCB’s
o,p’-DDT
p,p’-DDT
o,p’-DDD
p,p’-DDD
o,p’-DDE
p,p’-DDE
TotalDDT
cis-chlordane
trans-chlordane
cis-nonachlor
trans-nonachlor
oxy-chlordane
Totalchlordane
Big Beaver Creek 57 <5 < 5 <5 <5 <5 16 29 < 5 < 5 < 5 9.0 < 5 19
Mill Creek 130 <5 6.0 <5 16 <5 100 123 9.9 < 5 6.5 13 < 5 34
Deer Creek <50 <5 <5 <5 <5 <5 29 42 < 5 < 5 < 5 < 5 < 5 13
Penns Creek <50 <5 <5 <5 <5 <5 13 26 < 5 < 5 < 5 < 5 < 5 13
East Branch Octoraro Creek 84 <5 7.7 <5 7.4 <5 96 120 12 < 5 11 20 5.5 51
Quittapahilla Creek 730 17 120 360 1,200 130 1,600 3,400 38 17 11 37 17 120
West Mahantango Creek <50 <5 5.2 <5 — <5 37 50 < 5 < 5 < 5 < 5 < 5 13
Frankstown Branch Juniata River 120 <5 <5 <5 <5 <5 31 44 < 5 < 5 < 5 < 5 < 5 13
Kishacoquillas Creek 360 <5 <5 6.9 6.6 <5 7.9 29 5.1 < 5 < 5 7.6 < 5 20
Codorus Creek 1,500 <5 20 <5 18 <5 140 190 21 10 9.4 18 10 68
Conestoga River 230 <5 5.7 <5 — <5 54 67 11 < 5 6.0 13 < 5 35
Swatara Creek 180 <5 19 53 220 21 300 620 12 5.1 < 5 12 < 5 34
Juniata River 93 <5 <5 <5 <5 <5 5.3 18 < 5 < 5 < 5 < 5 < 5 13
West Branch Susquehanna River 160 <5 12 <5 — <5 34 54 8.4 < 5 — 12 < 5 25
Susquehanna River at Danville 250 <5 8.3 <5 — <5 39 55 < 5 < 5 < 5 8.2 < 5 18

9
61 µg/kg for p,p’-DDE, was at the SusquehannaRiver at Columbia (table 6). The percentage of totalDDT measured as p,p’-DDE ranged from 57 to 84percent; the mean for the basin was 74 percent.
PCB’s were reported in all samples of small-mouth bass. Concentrations ranged from180 µg/kg at the Conestoga River near Safe Harborto 650 µg/kg at the Susquehanna River nearColumbia (table 6).
Chlordane components were reported insmallmouth bass tissue from all five sites (table 6).Three of the five components were reported at theConestoga River near Safe Harbor, whereas onlyone component was reported at sites on the JuniataRiver and the Susquehanna River at Danville.Concentrations of total chlordane ranged from17 µg/kg at the Juniata River and the SusquehannaRiver at Danville to 50 µg/kg at the ConestogaRiver. The highest component concentration wasfor trans-nonachlor, 25 µg/kg, at the ConestogaRiver (table 6). Concentrations of trans-nonachlorranged from 39 to 53 percent of the total; the meanfor the basin was 46 percent.
OCCURRENCE OF COMPOUNDS IN THELOWER SUSQUEHANNA RIVER BASIN
Fish readily absorb DDT from water, so a highproportion of DDE in tissues would indicate lowDDT uptake and high DDT metabolism (Haynesand Laws, 1991). The composition of total DDT asa mean percentage of p,p’-DDE was 62 percent and74 percent in white sucker and smallmouth bass,respectively. Technical DDT is approximately77 percent p,p’-DDT, which is a parent compound
of p,p’-DDE. Moreover, o,p’- metabolites of DDTare more readily excreted than are p,p’- metabolites(Haynes and Laws, 1991). Because the greatest per-centage of total DDT is in the form of p,p’-DDE,concentrations within the study area may be in thefinal stages of degradation. This finding suggestsno recent influx of total DDT into the basin.
PCB’s comprise a class of compounds withwide variations in physical, chemical, and biologi-cal behavior. The distribution of PCB’s in the envi-ronment seems to be regulated by volatilization forthe less chlorinated congeners and adsorption ontosediments and biota for the highly chlorinated con-geners (U.S. Environmental Protection Agency,1979; McFarland and Clarke, 1989). This potentialfor more highly chlorinated congeners to accumu-late in tissues is explained by the highoctanol/water (Kow) coefficient of PCB’s (U.S.Environmental Protection Agency, 1979). Amongcongeners containing four or fewer chlorine atomsper molecule, biodegradation appears to be theprimary fate process; more highly chlorinated con-geners (five or greater chlorine atoms per mole-cule) appear to photolyze. Evidence indicates thatPCB’s with four or more chlorines are most persis-tent in the environment. Of the smaller streamssampled in the Lower Susquehanna River Basin,Codorus and Quittapahilla Creeks had the highestPCB concentrations. PCB’s are known to occur inhigh concentrations in urbanized areas. Both thesecreeks receive discharge from more than 10 permit-ted point sources, and both have greater than10 percent urban land use within their respectivebasins.
Table 6. Concentrations of total PCB’s, total DDT and metabolites, and total chlordane and components in smallmouthbass samples collected in 1992 in the Lower Susquehanna River Basin, Pa.[—, missing data; <, value is less than method reporting limit; µg/kg, micrograms per kilogram]
Sitename
Concentration in whole fish, wet weight basis (µg/kg)
TotalPCB’s
o,p’-DDT
p,p’-DDT
o,p’-DDD
p,p’-DDD
o,p’-DDE
p,p’-DDE
TotalDDT
cis-chlordane
trans-chlordane
cis-nonachlor
trans-nonachlor
oxy-chlordane
Totalchlordane
Conestoga River 180 <5 <5 <5 — <5 53 63 6.6 <5 13 25 <5 50Juniata River 270 <5 <5 <5 <5 <5 17 30 <5 <5 <5 6.7 <5 17West Branch
SusquehannaRiver
190 <5 9.6 <5 — <5 48 65 <5 <5 11 21 <5 40
SusquehannaRiver atDanville
190 <5 5.6 <5 — <5 40 53 <5 <5 <5 6.7 <5 17
SusquehannaRiver atColumbia
650 <5 6.1 <5 <5 <5 61 77 <5 <5 6.1 14 <5 28
10
Chlordane is a pesticide that was commonlyused in the United States from about 1948 until itwas banned in the 1980’s (U.S. EnvironmentalProtection Agency, 1992). Fish collected from thisstudy contained trans-chlordane concentrationsthat were roughly half that of cis-chlordane,perhaps because trans-chlordane is eliminatedfrom fish (redhorse sucker and white sucker) 1.8times faster than the cis-isomer; moreover, the half-life for the cis-isomer has been reported to be 60days as opposed to 30 days for the trans-isomer(U.S. Environmental Protection Agency, 1979).Oxychlordane, which has a low potential forbioaccumulation, was detected in fish from onlythree sites. The most frequently detected chlordanecomponent in white sucker and smallmouth basswas trans-nonachlor, an indication that chlordaneis probably approaching the final stages ofdegradation (Schmitt and others, 1990).
ASSOCIATION OF COMPOUNDCONCENTRATIONS TO LAND USE
Concentrations of organochlorine compoundsdetected in whole-body white sucker tissueshowed only weak associations with major land-use categories within the Lower SusquehannaRiver Basin. Samples from all sites had concentra-tions reported for one or more compounds in atleast one of the organochlorine groups—totalPCB’s, total DDT, and total chlordane.
Total PCB concentrations in tissue wereexpected to be comparatively high at the large-river sites near urban centers; however, samplesfrom small streams like Codorus Creek and Quit-tapahilla Creek had concentrations that exceeded500 µg/kg (table 5). Samples from the mainstemsites had slightly elevated concentrations, espe-cially at Danville. Quittapahilla Creek, CodorusCreek, and the Susquehanna River at Danvillehave the greatest percentage of urban land use(>10 percent) of the 15 sites (table 2), and theirtissue-analysis results appear to be affected bythe urban land use.
Total DDT was reported at all sites within theLower Susquehanna River Basin. The basin isknown for its agricultural land use. The five siteswith the highest concentrations of total DDT(≥120 µg/kg) were all agriculture-dominated(>50 percent) (table 2) sites (table 5). The lowestconcentrations of DDT were at agriculture-domi-nated sites on Deer Creek and Big Beaver Creek.These two sites are in areas of grazing lands and
are not dominated by crop growing as are the otheragricultural sites. Samples from the forest-domi-nated (>50 percent) sites, exclusive of the main-stem, had the lowest concentrations.
Concentration patterns of total chlordaneclosely resembled those for total DDT and totalPCB’s (table 5). Samples from Quittapahilla Creekand Codorus Creek had the highest concentrations(>700 µg/kg) (table 5). Drainage basins of thesesites have more than 70 percent agricultural landuse and more than 10 percent urban land use.Chlordane has been used as a residential and com-mercial termiticide, and its presence at these agri-culturally dominated land-use sites was notexpected. The urban land use at these sites hasappeared to influence the water quality. The pre-dominantly forested (>50 percent) sites have thelowest concentrations of chlordane in the basin.
COMPARISON OF LOWER SUSQUEHANNARIVER BASIN RESULTS WITH RESULTS
OF OTHER STUDIES AND WITH ESTABLISHEDSTANDARDS AND GUIDELINES
Two major national studies were previouslyconducted and included the Lower SusquehannaRiver Basin. The earlier findings are compared tothe results from the Lower Susquehanna RiverNAWQA in the following section. Regional com-parisons also are made to the Hudson River andConnecticut River NAWQA Programs as well asthe other NAWQA studies across the UnitedStates. Trends of organochlorine compound con-centrations are discussed as well as how the LowerSusquehanna River Basin compares to establishedstandards and guidelines as determined by theNational Academy of Science (NAS) and theNational Academy of Engineers (NAE).
COMPARISON WITH PREVIOUSSTUDIES IN THE BASIN
Two major studies of contaminants in fishwere previously done that included sampleswithin the Lower Susquehanna River Basin, theUSFWS (Rompala and others, 1984) and theNSCRF by the USEPA (1992). Results from thesestudies were compared to DDT, PCB’s, andchlordane concentrations from the Lower Susque-hanna River Basin NAWQA study, hereaftertermed “this study.” In looking at these compari-sons, one must consider the differences in fish spe-cies, tissue type (whole body or edible portion(fillets)), analytical capability and quality of the

11
laboratory, MRL’s, and the reproducibility ofresults. No lipid normalizations, fish gender, or agedetermination were done in the USFWS or NSCRFstudies.
The objective of the USFWS study was todetermine how widespread certain contaminantswere in selected fish species in Pennsylvania (Rom-pala and others, 1984). In the USFWS study, threesite locations were similar to those of this study.These sites were on Kishacoquillas Creek, WestMahantango Creek, and the Juniata River; how-ever, only the sampling from the Juniata River sitehad a potentially comparable species, the rock bass(Ambloplites rupestris).
The USFWS study did not differentiatebetween the o,p’- and p,p’- forms of DDT, DDD, orDDE and reported PCB concentrations as threeAroclors: 1242, 1254, and 1260. For samples fromthe Juniata River, DDT and DDD concentrationswere below the MRL (<50 µg/kg) in whole-bodyrock bass (USFWS) and below the MRL of5.0 µg/kg in smallmouth bass (this study). Theconcentration of DDE was recorded as 30 µg/kg inrock bass (USFWS) and 20 µg/kg in smallmouthbass (this study). PCB concentration in rock basstissue was 420 µg/kg and 270 µg/kg in small-mouth bass. Trans-nonachlor was detected at a con-centration of 20 µg/kg in rock bass (USFWS) and6.7 µg/kg in smallmouth bass (this study).
Although the differences between the studiespreclude any definitive statement concerningchanges in concentrations of DDT and its metabo-lites, PCB’s, and chlordane during the decadebetween collections, DDE, PCB’s, and trans-chlordane still persist in detectable concentrationsin Juniata River fish.
The NSCRF study was designed as a one-timescreening investigation to determine the preva-lence of selected bioaccumulative pollutants infish, to identify correlations with sources of thesepollutants, and to make estimates of human health
risks of these selected pollutants. Samples of fishtissue (whole body for bottom feeders and filletsfor predators) were collected at four sites: CodorusCreek, Frankstown Branch of the Juniata River,Susquehanna River at Columbia, and Union Canalin Lebanon, Pa., during 1984-87 (U.S. Environmen-tal Protection Agency, 1992). The Union Canal siteis upstream of the Quittapahilla Creek site of theLower Susquehanna River Basin study and had thehighest concentrations of p,p’-DDE in carp (Cypri-nus carpio) tissue nationwide in the NSCRF study.The Quittapahilla site had the highest concentra-tions of total DDT in any white sucker fish tissuefound in the 20 NAWQA studies that began in 1991(Lindsey and others, 1998).
White suckers were collected only at Frank-stown Branch of the Juniata River allowing for adirect species comparison between the two studies.The only DDT metabolite analyzed for in theNSCRF study, p,p’-DDE, was measured in whitesucker whole-fish tissue at a concentration of22.2 µg/kg at the Frankstown Branch in 1987, ascompared to 31 µg/kg during this study in 1992.The concentration of PCB was 51.5 µg/kg in 1987compared to 120 µg/kg in 1992. The trans-non-achlor concentration was 5.56 µg/kg in 1987,whereas in 1992 the concentration was below theMRL of 5 µg/kg. Oxychlordane and cis-nonachlorwere not detected in either study (< 2.5 µg/kg forNSCRF study and <5 µg/kg for this study). Thep,p’-DDE and trans-nonachlor concentrations didnot appear to change notably over a 15-yearperiod; however, the PCB concentration from thisstudy was more than twice that of the NSCRFresult at the same site.
COMPARISON OF NAWQA STUDIES IN THENORTHEASTERN UNITED STATES
Other NAWQA studies in the northeasternUnited States include the Hudson River Basin andthe Connecticut River Basin. Sampling techniquesand NWQL procedures were identical to thoseused in this study. For comparison, only sites withwhite sucker tissue data were used.
Comparison of total DDT among the threebasins shows the median concentrations are signif-icantly different at p=0.05 (fig. 2). Although themedian concentration in the Lower SusquehannaRiver Basin was lower than either the HudsonRiver Basin or the Connecticut River Basin, con-centrations at two sites in the Lower SusquehannaRiver Basin were the highest of all three study
Organochlorinecompound
USFWSwhole-bodyrock bass
(micrograms perkilogram)
LSUSwhole-body
smallmouth bass(micrograms per
kilogram)
DDT <50 <5.0DDD <50 <5.0DDE 30 20PCB’s 420 270
trans-nonachlor 20 6.7

12
units together. The data for each basin indicatesthat p,p’-DDE was the most frequently reportedform of total DDT. This finding may indicate thatno significant influx of DDT has recently occurredin these basins and that the degradation of DDThas taken similar pathways throughout these areasof the northeastern United States.
The PCB medians were not significantly differ-ent (p=0.05) among the three basins (fig. 3). Thehighest concentration in the Lower SusquehannaRiver Basin was at Codorus Creek (1,500 µg/kg).This outlier was dwarfed by concentrations atthree sites in the Connecticut River Basin. All othersamples are below 5,000 µg/kg for PCB’s. PCBoccurrence is widespread in the basins; the highestconcentrations of PCB’s center on known historicalsources and urban areas at large-river sites (K.R.Murray, U.S. Geological Survey, oral commun.1996). Some samples from the Connecticut RiverBasin had high PCB concentrations, which may berelated to the known industrial point sources in thebasin and may also include hydroelectric powergenerating facilities as a significant source(J.F. Coles, U.S. Geological Survey, oral commun.1996). The Lower Susquehanna River Basin gener-ally does not have these types of point sources.
Median values of total chlordane (consisting ofcis- and trans-chlordane, cis- and trans-nonachlor,and oxychlordane) were not significantly different(p=0.05) among the basins (fig. 4). All three basinshad outliers. The most commonly reported chlor-dane components in all three studies were cis-chlo-rdane and trans-nonachlor. Trans-nonachlorconcentrations were similar among the basins indi-cating that the concentrations of chlordane compo-nents in whole-body white sucker tissue were alsosimilar.
COMPARISON WITH NAWQA STUDIESACROSS THE UNITED STATES
The NAWQA program in 1991 began studiesof fish tissue organochlorine compounds in 18river basins. The Lower Susquehanna River Basinstudy was included in the 18 studies. Compared tothe other 17 studies, median concentrations of totalPCB’s in the Lower Susquehanna River Basin werethe third highest, and the maximum concentrationwas the fifth highest (table 7). The Lower Susque-hanna River Basin had the fifth highest medianconcentration and the highest maximum concen-tration of total DDT compared to the other studies(table 7). The median concentration of total chlor-dane in the Lower Susquehanna River Basin wasthe third highest and the maximum concentrationwas the fifth highest of the 18 studies (table 7).Concentrations of organochlorine compounds in
Swatara Creek (620 µg/kg)
Figure 2. Concentrations of total DDT in white sucker whole fish tissue for the Lower Susquehanna, Hudson, andConnecticut River Basins.
(31)
(7)
LOWER HUDSON CONNECTICUT
STUDY BASIN NAMES
0
400
0
100
200
300
EXPLANATION
25th percentile
Median75th percentile
interquartile range outside the quartileData value less than or equal to 1.5 times theinterquartile range outside the quartileand more than 1.5 times theOutlier data value less than or equal to 3interquartile range outside the quartileOutlier data value more than 3 times the
(15) Number of observations
(15)
500
3,500
500
1,500
2,500
SUSQUEHANNA
TO
TA
L D
DT
CO
NC
EN
TR
AT
ION
S,
IN M
ICR
OG
RA
MS
PE
R K
ILO
GR
AM
Quittapahilla Creek (3,400 µg/kg)

13
Table 7. Comparison of median concentrations of total PCB’s, total DDT, and total chlordane for the NAWQA studybasins started in 1991[all concentrations are in micrograms per kilogram; L.H. Nowell, written commun., 1999]
Study basin
Total PCB Total DDT Total chlordane
Medianconcentra-
tion
Maximumconcentra-
tion
Medianconcentra-
tion
Maximumconcentra-
tion
Medianconcentra-
tion
Maximumconcentra-
tion
Apalachicola-Chattahoochee-Flint River Basin 0 63 11 38 0 84Albemarle-Pamlico Drainage 0 0 21 145 0 8Central Columbia Plateau 0 820 157 2,998 0 46Central Nebraska Basins 0 160 10 78 0 43Connecticut, Housatonic, and Thames River Basins 220 72,000 80 304 23 369Hudson River Basin 120 33,000 48 458 0 189Lower Susquehanna River Basin 107 1,500 68 3,427 10 120Ozark Plateaus 0 0 0 1 0 0Potomac River Basin 83 390 0 255 0 127Red River of the North 0 320 44 207 0 86Rio Grande Valley 0 410 47 179 0 21San Joaquin-Tulare Basins 0 52 90 510 0 0South Platte River Basin 41 580 22 955 0 112Trinity River Basin 48 640 103 449 5 292Upper Snake River Basin 0 1,900 61 590 0 13White River Basin 0 0 9 9 50 50Willamette Basin 0 1,200 9 560 0 60Western Lake Michigan Drainages 0 3,000 6 116 0 51
Figure 3. Concentrations of total PCB’s in white sucker whole fish tissue for the Lower Susquehanna, Hudson,and Connecticut River Basins.
(15)
(7)
LOWER HUDSON CONNECTICUT
STUDY BASIN NAMES
0
4,000
0
1,000
2,000
3,000
EXPLANATION
25th percentileMedian75th percentileinterquartile range outside the quartileData value less than or equal to 1.5 times the
interquartile range outside the quartileand more than 1.5 times theOutlier data value less than or equal to 3interquartile range outside the quartileOutlier data value more than 3 times the
(15) Number of observations
(31)
10,000
100,000
50,000
SUSQUEHANNA
TOTA
L P
CB
CO
NC
EN
TRA
TIO
NS
,IN
MIC
RO
GR
AM
S P
ER
KIL
OG
RA
M
Mattabusset River (72,000 µg/kg)Quinnipiac River (55,000 µg/kg)
East Branch of the Housatonic River (12,000 µg/kg)
Codorus Creek(1,500 µg/kg)
Figure 4. Concentrations of total chlordane in white sucker whole fish tissue for the Lower Susquehanna, Hudson,and Connecticut River Basins.
(15)
LOWER HUDSON
STUDY BASIN NAMES
0
150
0
50
100
EXPLANATION
25th percentileMedian75th percentileinterquartile range outside the quartileData value less than or equal to 1.5 times the
interquartile range outside the quartileand more than 1.5 times theOutlier data value less than or equal to 3interquartile range outside the quartileOutlier data value more than 3 times the
(15) Number of observations
(7)
(31)
175
400
200
300
SUSQUEHANNACONNECTICUT
T0TA
L C
HLO
RD
AN
E C
ON
CE
NTR
ATI
ON
S,
IN M
ICR
OG
RA
MS
PE
R K
ILO
GR
AM
West Branch Naugatuck River (369 µg/kg)
Saw Mill River (189 µg/kg)
Codorus Creek (68 µg/kg)
Quittapahilla Creek (120 µg/kg)
(15)
LOWER HUDSON
STUDY BASIN NAMES
0
150
0
50
100
EXPLANATION
(7)
(31)
175
400
200
300
SUSQUEHANNACONNECTICUT
IN M
ICR
OG
RA
MS
PE
R K
ILO
GR
AM
West Branch Naugatuck River (369 µg/kg)
Saw Mill River (189 µg/kg)
Codorus Creek (68 µg/kg)
Quittapahilla Creek (120 µg/kg)

14
the Lower Susquehanna River Basin appear to behigher than many of the 18 basins studied by the1991 NAWQA studies.
COMPARISON WITH STUDIESACROSS THE UNITED STATES
The NSCRF reported concentrations of con-taminants in whole fish for a nationwide networkof sampling sites (U.S. Environmental ProtectionAgency, 1992). A majority of these sites were sam-pled in 1987. Protocols called for the collection ofthree to five adult fish of the same species and ofsimilar size. Fish age and gender were not deter-mined. At nearly all sites, a composite sample of abottom-feeding fish species and a game fish spe-cies was collected. Targeted sites were selected at314 locations on the basis of the expected presenceof contaminants from various point and nonpointsources. In addition, 39 sites were chosen from theUSGS National Stream Quality Accounting Net-work (NASQAN) and 35 were representative ofbackground sites. NSCRF used single-species com-posites consisting of carp, channel catfish, whitesucker, white bass, northern pike, walleye, small-mouth bass, largemouth bass, or crappie.Although the NSCRF-reported concentrations arebased on combining all these single-species com-posites (no differentiation by species) and the site-selection process was in part based on known pol-lutant sources, a general assessment of contami-nant occurrences (including national and regional
contaminant concentrations) can be attempted.White suckers were sampled at 41 sites by NSCRF.Median concentrations were calculated from these41 samples and were compared to northeasternregional and Lower Susquehanna River Basinmedian concentrations (table 8).
Total DDT was not reported by NSCRF; onlythe p,p’-DDE form was reported in measurableconcentrations at 357 of 362 sites sampled nation-wide, which included species other than whitesucker. This was the most reported contaminantfor all species at all sites. White sucker were ana-lyzed for p,p’-DDE at 41 sites. Median concentra-tions show the northeastern region and the LowerSusquehanna River Basin as having higher concen-trations of p,p’-DDE than the nation. The mediansfor the NSCRF and the Lower Susquehanna RiverBasin are not significantly different (p=0.05); themedians for the Lower Susquehanna and thenortheastern region are different (p=0.05). Themedians for the northeastern region were signifi-cantly higher than those for the nation and theLower Susquehanna River Basin (table 9).
PCB analysis by NSCRF was for all chlorinatedPCB compounds (U.S. Environmental ProtectionAgency, 1992) and not specific Aroclors as in theregional and local studies. Total PCB concentra-tions were detected at 331 of 362 sites sampled fornumerous species for the NSCRF. The whitesucker median for NSCRF was below the MRL.The medians for the Lower Susquehanna Basin
Table 8. Concentrations of total PCB’s, DDT metabolites, and chlordane components in whole fish tissue fromnational surveys of contaminant concentrations[NA, not analyzed; mixed, several game and bottom-feeding species collected to determine mean concentrations;USEPA-NSCRF, U.S. Environmental Protection Agency, National Study of Chemical Residues in Fish; NCBP, NationalContaminant Biomonitoring Program; µg/kg, micrograms per kilogram]
StudyFish
species
Totalnumberof sites
Mean concentrations in whole fish (µg/kg)
TotalPCB1
p,p’-DDT
p,p’-DDD
p,p’-DDE
cis-chlordane
trans-chlordane
cis-nonachlor
trans-nonachlor
Oxy-chlordane
NCBP:
1970-742 Mixed 113 1,200 270 340 470 NA NA NA NA NA1976-773 Mixed 112 890 50 80 260 60 20 10 30 NA1978-793 Mixed 106 840 40 80 240 70 20 30 50 101980-813 Mixed 108 530 50 70 200 30 20 20 40 1019843 Mixed 112 390 30 60 190 30 20 20 30 10
USEPA-NSCRF:
19874 Mixed 362 1,890 NA NA 295 21.0 16.7 8.77 31.2 4.75LOWER SUSQUEHANNA RIVER BASIN:
1992 Mixed 16 266 12 107 131 7.3 3.7 5.4 12 3.71 The NCBP study measured concentrations of only three Aroclors; the EPA-NSCRF study measured all chlorinated PCB compounds.2 Schmitt and others, 1981.3 Schmitt and others, 1990.4 U.S. Environmental Protection Agency, 1992.
15
and the northeastern region were above the MRLand were not significantly different (p=0.05).
Chlordane and related compounds in theNSCRF study were reported at 278 of the 362 sitessurveyed for all fish species. Oxychlordane, a met-abolic breakdown product of chlordane, wasreported at 98 of the 362 sites. The median concen-tration for this component of chlordane in whitesucker was below the MRL for all studies.
The National Contaminant Biomonitoring Pro-gram (NCBP) was implemented in 1967 by theUSFWS in an attempt to establish temporal andgeographic trends in concentrations of environ-mental contaminants that may threaten fish andwildlife resources on a nationwide basis (Schmittand others, 1981). As part of this program, fishwere sampled during four collection periods: 1970to 1974, 1976 to 1979, 1980 to 1981, and 1984(Schmitt and others, 1990).
The most frequently collected taxa throughoutall the years of study were common carp (Cyprinuscarpio), white sucker (Catostomus commersoni),largemouth bass (Micropterus salmoides), and othermembers of the families Cyprinidae, Catostomi-dae, and Centrarchidae. Three to five adults of asingle species, usually collected in the autumn,constituted a composite. Data were presented asmeans of contaminant concentrations for everyspecies at every site to give overall nationwidecontaminant concentrations. The p,p’- forms oftotal DDT were the only metabolites that were ana-lyzed for in the fish (Schmitt and others, 1990).
The only DDT form comparable between thetwo studies was p,p’-DDE. NCBP data show adecline over time in concentration of p,p’-DDE. TheNSCRF shows concentrations comparable to the1976-77 NCBP data.
The NCBP data show a decline of total PCBconcentrations between 1970 and 1984. The NSCRFstudy from 1987 showed concentrations higherthan the 1970-84 concentrations. NSCRF wasdesigned to target sites where PCB’s were expectedto occur and NCBP was designed to show trends.
The combination of these two studies hasshown a decline in chlordane concentrations.Trans-nonachlor, the final degradation product ofchlordane, has remained relatively constant whilethe other chlordane components concentrationshave decreased. The Lower Susquehanna RiverBasin mean concentrations were lower for totalPCB’s, p,p’-DDE, and trans-nonachlor than eitherof the national studies, which perpetuates thetheory that organochlorine compound concentra-tions are declining in fish.
COMPARISON WITH ESTABLISHED
STANDARDS AND GUIDELINES
Concentrations of organochlorine compoundsfrom this study exceeded established standardsand guidelines (Nowell and Resek, 1994) forwhole-fish tissue at only a few sites. The NAS andthe NAE guideline for the protection of fish-eatingbirds and wildlife for total chlordane (100 µg/kg)was exceeded for white sucker at one site,Quittapahilla Creek. The U.S. Food and DrugAdministration (USFDA) action level for humanconsumption for total chlordane in the edible por-tion (300 µg/kg) was not exceeded at any sitesselected within the basin. Although concentrationsin whole fish and edible portions (fillets) are notdirectly comparable, the collection of fillet data infuture studies might aid in identifying problemsites.
Table 9. Concentrations of total PCB’s, p,p’-DDE and oxychlordane in white sucker whole-fish tissue from anational survey, a regional survey, and this study of the Lower Susquehanna River Basin, Pa.[USEPA-NSCRF, U.S. Environmental Protection Agency, National Study of Chemical Residues in Fish;nd, no detects; µg/kg, micrograms per kilogram]
StudyNumberof sites
Median concentrations of whole fish (µg/kg)
Total PCB’s1 p,p’-DDE oxychlordane
USEPA-NSCRF2 41 nd 24 nd
Northeastern Region3 53 191 525 nd
Lower Susquehanna River Basin 15 150 36 nd1 The USEPA-NSCRF study measured all chlorinated PCB compounds; the Lower Susquehanna, Hudson, and
Connecticut studies measured only three Aroclors.2 U.S. Environmental Protection Agency, 1992.3 Lower Susquehanna, Hudson, and Connecticut studies data combined.

16
There is no guideline for total PCB’s fromNAS, NAE (1973). The USFDA action level(2,000 µg/kg) was not exceeded. Because only Aro-clors 1242, 1254, and 1260 were determined by theNWQL as the total PCB concentration, it is difficultto speculate on the toxicological significance ofthese reported values.
The total DDT guideline from NAS, NAE(1973; 1,000 µg/kg) was exceeded at only one site,Quittapahilla Creek. No exceedances werereported for the USFDA action level (5,000 µg/kg)at any of the sampling locations.
CONCLUSIONS
Most organochlorine pesticides and PCB’swere banned from use in the United States in the1970’s and 1980’s, yet, because of their inherent sta-bility, measurable concentrations still persist inwhole-body fish tissue. This paper gives the con-centrations of 12 selected organochlorine contami-nants in samples of whole-body white sucker andsmallmouth bass tissue collected from 16 sites inthe Lower Susquehanna River Basin in 1992.
The most frequently reported compounds forboth white sucker and smallmouth bass werep,p‘-DDT, p,p’-DDE (found in all tissue samples inthe study), total PCB’s, and trans-nonachlor. Simi-lar results were observed at regional and nationalscales.
Comparisons of concentrations oforganochlorine compounds detected in whole-body white sucker tissue to major land-usecategories within the Lower Susquehanna RiverBasin study show that total DDT concentrationswere highest at the agriculture-dominated(>50 percent) sites that had more than onepermitted point source. Total PCB concentrationsin tissue were higher at the small stream sites thanat the Susquehanna River main-stem sites. Thesesmall streams had the greatest area of urban landuse (> 10 percent) and thus PCB’s seemed to repre-sent an urban signature. Concentrations of totalchlordane were highest at sites with greater than70 percent agricultural land use and an urban sig-nature. Tissue samples from sites categorized asforest dominated (>50 percent) had the lowest con-centrations of organochlorine compounds overall.
Median concentrations of total DDT were sig-nificantly lower in the Lower Susquehanna RiverBasin than the Hudson and Connecticut RiverBasins (p=0.05), although the highest concentrationin any of the Basins was measured in the sample of
white suckers from the Quittapahilla Creek in theLower Susquehanna River Basin. The fact that thep,p’-DDE form of total DDT was the most preva-lent for the three studies indicates there has beenno recent significant influx of DDT to the basinsand that the degradation of DDT has taken similarpathways throughout the northeastern UnitedStates. Median concentrations of total PCB’s andtotal chlordane were not significantly differentamong the three basins. The most commonlydetected chlordane component and the most per-sistent was trans-nonachlor.
The median concentration of total PCB’s inwhite sucker reported in the NSCRF in fish byUSEPA were lower than those reported from theLower Susquehanna River Basin and the north-eastern region of the United States. The medianconcentration of p,p’-DDE in the Lower Susque-hanna River Basin was not significantly differentfrom the national median but was significantlylower than the northeastern regional median(p=0.05). The median concentrations of oxychlor-dane detected in the Lower Susquehanna RiverBasin, as well as those reported in the Northeastand in the national study were all below the MRL.
REFERENCES CITEDBerg, T.M., Barnes, J.H., Sevon, W.D., Skema, V.W.,
Wilshusen, J.P., and Yannacci, D.W., 1989,Physiographic provinces ofPennsylvania: Pennsylvania Geological Survey,4th ser., Map 13 (color), scale 1:2,000,000,8.5 x 11 inches.
Breen, K.J., Hainly, R.A., and Hoffman, S.A., 1991,National Water-Quality Assessment Program—the Lower Susquehanna River Basin: U.S.Geological Survey Open-File Report 91-168, 2 p.
Coles, J.F., 1996, Organochlorine compounds and traceelements in fish tissue and ancillary data for theConnecticut, Housatonic, and Thames RiverBasins Study Unit, 1992-94: U.S. GeologicalSurvey Open-File Report 96-358.
Crawford, J.K., and Luoma S.N., 1993, Guidelines forstudies of contaminants in biological tissues forthe National Water-Quality AssessmentProgram: U.S. Geological Survey Open-FileReport 92-494, 69 p.
Deelder, C.L., and Willemse, J.J., 1973, Agedetermination in fresh-water teleosts, based onannular structures in fin-rays: Aquaculture 1, p.365-371.
Firda, C.D., Lumis, K., Murray, P.M., and Freeman, W.O.,1993, Water Resources Data, New York, WaterYear 1993, vol. 1.: U.S. Geological Survey Water-Data Report NY-93-1, p. 377-379.

17
Gilliom, R.J., Alley, W.M., and Gurtz, M.E., 1995, Designof the National Water-Quality AssessmentProgram—Occurrence and distribution of water-quality conditions: U.S. Geological SurveyCircular 1112, 33 p.
Great Lakes Basin Commission, 1975, Great Lakes Basinframework study, Appendix 8: Ann Arbor, Mich.,Great Lakes Basin Commission, p. 47-49.
Gurtz, M.E., 1994, Design of biological components ofthe National Water-Quality Assessment(NAWQA) Program in Loeb, S.L., and Spacie, A.,eds., Biological monitoring of aquaticsystems: Boca Raton, Fla., Lewis Publishers,p. 323-354.
Harrison, S.E., and Klaverkamp, J.F., 1990, Metalcontamination in liver and muscle of northernpike (Exos lucius) and white sucker (Catostomuscommersoni) and in sediments from lakes near thesmelter at Flin Flon, Manitoba: EnvironmentalToxicology and Chemistry., vol. 9, p. 941-956.
Haynes, W.J., and Laws, E.R., 1991, Handbook ofpesticide toxicology, vols. 1 and 2: San Diego,Calif., Academic Press.
Hirsch, R.M., Alley, W.M., and Wilber, W.G., 1988,Concepts for National Water-Quality AssessmentProgram: U.S. Geological Survey Circular 1021,42 p.
Leahy, P.P., Rosenshein, J.S., and Knopman, D.S., 1990,Implementation plan for the National Water-Quality Assessment Program: U.S. GeologicalSurvey Open-File Report 90-174, 10 p.
Leahy, P.P., and Wilber, W.G., 1991, National Water-Quality Assessment Program: U.S. GeologicalSurvey Open-File Report 91-54, 2 p.
Leiker, T.J., Madsen, J.E., Deacon, J.R., and Foreman,W.T., 1995, Methods of analysis by the U.S.Geological Survey National Water QualityLaboratory—Determination of chlorinatedpesticides in aquatic tissue by capillary-columngas chromatography with electron-capturedetection: U.S. Geological Survey Open-FileReport 94-710, 42 p.
Lindsey, B.D., Breen, K.J., Bilger, M.D., and Brightbill,R.A., 1998, Water quality in the LowerSusquehanna River Basin, Pennsylvania andMaryland, 1992-95: U.S. Geological SurveyCircular 1168, 38 p.
Majewski, M.S., and Capel, P.D., 1995, Pesticides in theatmosphere—Distribution, trends, and governingfactors: Ann Arbor, Mich., Ann Arbor Press,214 p.
McFarland, V.A., and Clarke, J.U., 1989, Environmentaloccurrence, abundance, and potential toxicity ofpolychlorinated biphenyl congeners—Considerations for a congener-specific analysis:Environ Health Perspectives. 81, p. 225-239.
National Academy of Sciences & National Academy ofEngineering, 1973, Water quality criteria1972: Ecological Research Series, EPA-R3-73-033,594 p.
Nowell, L.H., and Resek, E.A., 1994, National standardsand guidelines for pesticides in water, sediment,and aquatic organisms—Application to water-quality assessments in Reviews of EnvironmentalContamination and Toxicology: New York, N.Y.,Springer-Verlang, vol. 140, 221 p.
Risser, D.W., and Siwiec, S.F., 1996, Water-qualityassessment of the Lower Susquehanna RiverBasin—Environmental setting: U.S. GeologicalSurvey Water-Resources Investigations Report 94-4245, 50 p.
Rompala, J.M., Rutkosky, F.W., Putnam, D.J., and Kulp,C.J., 1984, Concentrations of environmentalcontaminants in fish from selected waters inPennsylvania: State College, Pa., U.S. Fish andWildlife Service, p. 1-9, 13, 39-47, 65-69.
Schmitt, C.J., Ludke, J.L., and Walsh, D.F., 1981,Organochlorine residues in fish—NationalPesticide Monitoring Program 1970-74: PesticideMonitoring Journal, 14(4), p 136-206.
Schmitt, C.J., Zajicek, J.L., and Peterman, P.H., 1990,National Contaminant Biomonitoring Program:—Residues of organochlorine chemicals in U.S.freshwater fish, 1976-1984: Archives ofEnvironmental Contamination and Toxicology,vol. 19, p. 748-781.
Smith, J.A., Witkowski, P.J., and Fusillo, T.V., 1988,Manmade organic compounds in the surfacewaters of the United States—A review of currentunderstanding: U.S. Geological Survey Circular1007, 92 p.
Tate, C.M., and Heiny, J.S., 1996, Organochlorinecompounds in bed sediment and fish tissue in theSouth Platte River Basin USA, 1992-1993: Archives of Environmental Contaminationand Toxicology, vol. 30, 62-78.
U.S. Environmental Protection Agency, 1979, Water-related environmental fate of 129 prioritypollutants, vol. 1, Introduction and technicalbackground, metals and inorganics, pesticidesand PCB’s: Washington, D.C., U.S.Environmental Protection Agency, p. 22/1-25/21,36/1-36/18.
_____1992, National study of chemical residues in fish(vols. I and II): Office of Science and Technology,Standards and Applied Science Division, EPA823-R-92-008 a and b, 166 p.
_____1993, Guidance for assessing chemicalcontaminant data for use in fish advisories (vol. I),Fish sampling and analysis: Office of Water, EPA823-R-93-002, 327 p.
Zar, J.H., 1984, Biostatistical analysis (2nd ed.):Englewood Cliffs, N.J., Prentice-Hall, Inc., 718 p.