requirements for dynamic levelling devices to prevent
TRANSCRIPT

Submitted by the GRE Chair Informal document GRE-83-03 (83rd GRE, 21-24 April 2020, agenda items 4 and 6 (b))
Requirements for dynamic levelling devices to prevent headlamp glare blinding oncoming road users
Final report FE 82.0611/2014 April 2019 Kyriakos Kosmas, M. Sc., Dr.-Ing. Jonas Kobbert, Prof. Dr.-Ing. habil. Tran Quoc Khanh Technical University Darmstadt, Institute for Lighting Technology


1
Abstract
Requirements on dynamic headlamp levelling devices
Even small changes to vehicle pitch, due to an additional load, for example, can raise the headlamp light beams, causing greater glare. UN Regulation No. 48 requires an automatic levelling device (HLD) that automatically compensates the headlamp beam pitch if the headlamp has a light source emitting a luminous flux over 2000 lm. The latest development in levelling consists of dynamic HLDs that are able to compensate dynamic vehicle pitch changes as caused by acceleration, for example. Apart from the 2000 lm limit requirement for automatic HLDs, no further requirements for dynamic headlamp levelling are in place.
In order to draw up recommendations for future requirements on dynamic headlamp levelling devices, six representative vehicles fitted with tungsten-halogen, high-intensity discharge (HID) and light-emitting diode (LED) headlamps were examined. These vehicles each had a different suspension stiffness and were tested in an empty condition and with an added load of 250 kg. In addition, dynamic levelling, where installed, was deactivated and the results were compared with those obtained with an activated HLD. In order to assess and compare the different headlamps, headlamp levelling devices and load conditions, additional vehicles were used to simulate oncoming traffic. These vehicles were equipped with photometers and test occupants were asked to rate the psychological and physiological blinding effects.
The results show that vehicle pitch is influenced by numerous parameters and that only mandatory use of dynamic headlamp levelling devices reduces the glare which might blind oncoming road users.
In the second part of the study, the ability of vehicle repair shops to adjust headlamps accurately in keeping with UN-Regulation requirements was examined. For these tests, tungsten-halogen headlamps and HID headlamps were misaligned to a predefined setting in two vehicles, and these vehicles were then taken to repair shops for re-adjustment. An analysis of the data showed that the headlamps were aimed too low, the mean vertical error being – 1.25 %.

2
Table of abbreviations used AFS ..................................... Adaptive Front-lighting Systems aHLD ......................... automatic Headlamp Levelling Device BCD ............... Borderline between Comfort and Discomfort dHLD ........................... dynamic Headlamp Levelling Device HBS ................................................ Headlamp Beam Setters HLD ............................................ Headlamp Levelling Device HU ............................................................... main inspection (German: HauptUntersuchung) LED ....................................................... Light-Emitting Diode MV ................................................................. Motor Vehicle SNR ..................................................... Signal-to-Noise Ratio StVZO ..... German Road Vehicles Registration and Licensing Regulations (German: Strassenverkehrs-Zulassungs-Ordnung) TP ............................................. vehicle inspection agencies (German: Technische Prüfstellen) UN ........... United Nation Economic Commission for Europe WP ................................................................Work Packages
3
Contents 1 Introduction, description of objectives ... 4 2 Fundamentals of glare .............................. 4 2.1 Disability glare ............................................. 4 2.2 Discomfort glare .......................................... 5 3 WP 1: Field tests on headlamp levelling
systems currently available on the market ......................................................... 5
3.1 The headlamp levelling device .................... 6 3.2 Relevant literature ....................................... 6 4 WP 2: Examination of the pitch angle of
representative vehicles, taking load, suspension and vehicle dynamics into account ....................................................... 8
4.1 Measuring equipment used to determine vehicle dynamics and glare ......................... 8
4.1.1 System developed to determine the vehicle’s pitch angle ................................................... 8
4.1.2 Measuring equipment used to determine blinding due to glare .................................... 9
4.2 Selection of representative test vehicles ... 10 4.3 Test set-up and procedure ........................ 11 4.4 Test persons .............................................. 13 4.5 Results....................................................... 13 4.5.2 Analysis of data collected for vehicles
travelling at a constant speed ................... 15 4.5.3 Assessment of the acceleration phase data
................................................................... 19 4.5.4 Eye-tracking and contrast box ................... 20 4.6 Theoretical consideration of hill summits and
dips ............................................................ 21 4.6.1 Underlying statistical data ......................... 22 4.6.2 Functions of the applied analysis program 22 5 WP 3: Drafting of requirements for
dynamic headlamp levelling devices and corresponding lighting systems with regard to traffic safety ............................ 23
6 WP 4: Investigation of the adjustment process for headlamp beams, including adaptive lighting systems and daytime running lamps .......................................... 24
6.1 Basic principles ......................................... 24 6.2 Review of the adjustment processes ........ 25 6.3 Headlamp setting requirements ................ 27 7 WP 5: Reviewing the existing regulations
and, if necessary, compiling a draft amendment to international construction and operation regulations ...................... 28
7.1 Regulations and standards........................ 29 7.2 Comparison of legal require-ments with the
findings of WP 3 and WP 4 ....................... 29
8 Conclusion................................................ 30 9 Bibliography ............................................. 31 10 Annex ........................................................ 34 10.1 Statistical tests ........................................... 34 10.2 Statistics: Standardisation (z-
transformation) ........................................... 34 10.3 Comparison of DE BOER ratings of test
persons depending on their seat position .. 34 10.4 Comparison of the DE BOER ratings of
measuring vehicles ID1, ID2 and ID3 ........ 34 10.5 Comparison of the De Boer-ratings of test
persons depending on age ........................ 35 10.6 Reproducibility of the photometric
measurements ........................................... 35 10.7 Comparison of repair shop settings for
tungsten-halogen and high-intensity discharge headlamps ................................. 35
4
1 Introduction, description of objectives
The main aim of new developments in automobile headlamp technology is to increase the driver’s visual range by providing optimum illumination without blinding other road users. The development and introduction of new light sources have greatly contributed to reducing the number of accidents at night. These new light sources include high intensity discharge (HID) and light-emitting diode (LED) headlamps, for example. On the other hand, the use of light sources with a higher luminous flux increases the risk of blinding other road users, especially if the headlamps are not adjusted properly.
Apart from this, the dynamic behaviour of a motor vehicle can increase the risk of glare. Increased glare can, for example, be caused by added load, bumpy road surfaces, sharp acceleration and different suspension systems. This is because a change of the vehicle’s pitch angle entails a change of the light beam angle and can thus result in the potential blinding of other road users. Regulation No. 48 of the Economic Commission for Europe of the United Nations requires vehicles to be equipped with a headlamp levelling device (HLD). This system is supposed to compensate, either manually or automatically, the change of pitch angle caused by added loads. The regulation stipulates mandatory use of an automatic headlamp levelling device (aHLD) if the rated luminous flux of the installed light source or light source module exceeds the limit value of 2000 lm. Studies at the Institute for Lighting Technology of the Technical University of Darmstadt have shown that pitching movements of the vehicle while driving over bumps in the road surface result in impulses in the illuminance curve (KOSMAS ET AL. 2015). These illuminance impulses can reach values of up to several Lux and result in the blinding of other road users through glare.
The most recent development in the field of headlamp levelling devices has led to the dynamic headlamp levelling device (dHLD). This device can compensate dynamic changes of the pitch angle, for example during acceleration, or as caused by bumps in the road. The luminous flux limit value mentioned above is currently the only requirement placed on dynamic headlamp levelling devices.
The objective of the first part of the study presented in this document is to find out the extent to which added load and vehicle dynamics affect other road users with respect to blinding by glare. It also addresses the question of whether the luminous flux, the suspension characteristics or neither of
these parameters should be the decisive criterion for mandatory installation of a dHLD. To this end, headlamp levelling systems currently available on the market are analysed. Following this, representative vehicles are selected for the tests to be carried out. The selected vehicles are used to examine how the various parameters - added load, suspension and vehicle dynamics - affect the vehicle pitch angle. The results of these studies are used to draft requirements on dHLDs and make recommendations on potential amendments to existing regulations.
The second part of the study presented in this document deals with the headlight adjustment process. This is important because even though headlamps which are aimed too high increase the range of visibility and therefore the distance at which objects such as roadside obstacles can be detected, they also cause more glare, thus blinding other road users. The regulatory body has therefore set down a number of requirements on the correct adjustment of headlamps. The objective of this part of the study is on the one hand to investigate how accurately vehicle repair shops adjust headlamps, and on the other hand, to investigate the relevance of legal headlamp adjustment requirements and adherence to these. The results of the second part of the study are then used to develop proposals for practical improvements and for statutory adjustment requirements.
2 Fundamentals of glare Glare is defined as a “discomforting visual condition caused by unfavourable luminance distribution or strong contrasts” (DIN EN 12665). As early as 1910, PARSONS already described that the effects of glare are both disabling and discomforting (PARSONS 1910). In order to achieve a better understanding of this study and its results, the two types of glare are explained in more detail below.
2.1 Disability glare Disability glare is a visual condition in which one or more light sources in the field of vision lead to a measurable reduction of visual performance. In this visual condition, the light sources create scattered light in the eye, interfering with the actual image on the retina and thus reducing contrast sensitivity (HOLLADAY 1926). In 1926, HOLLADAY published initial results of research activities dealing with the physiological reduction of visual performance and introduced the concept of equivalent veiling luminance 𝐿𝐿säq. According to (HOLLADAY 1926), this is defined as

5
𝐿𝐿säq = 𝑘𝑘 · 𝐸𝐸B𝜃𝜃𝑛𝑛
(2.1)
where 𝐸𝐸B is the illuminance measured at the eye, 𝜃𝜃 is the angle of the glare source to the line of sight and k is an age-related factor (cf. Section 4.4). For an object to be visible in relation to its luminance, the luminance of the surroundings, i. e. the background luminance 𝐿𝐿Umfeld and the luminance of the object, i. e. the object luminance 𝐿𝐿Objekt have to differ by a certain value ∆𝐿𝐿′. If luminance in the field of view is increased by a blinding light source, the difference ∆𝐿𝐿′ also has to be increased for the object to remain visible (KHANH UND SÖLLNER 2014). This relation can be explained by the Weber contrast 𝐾𝐾W as described in 2.2.
𝐾𝐾W = 𝐿𝐿Objekt − 𝐿𝐿Umfeld
𝐿𝐿Umfeld (2.2)
The Weber contrast changes if a blinding light source appears in the field of vision, because the veiling luminance covers both the object and the background, adding to the luminance.
𝐾𝐾WB = �𝐿𝐿Objekt + 𝐿𝐿säq� − (𝐿𝐿Umfeld + 𝐿𝐿säq)
𝐿𝐿Umfeld + 𝐿𝐿säq (2.3)
Rewriting the equation produces:
𝐾𝐾WB = 𝐿𝐿Objekt − 𝐿𝐿Umfeld𝐿𝐿Umfeld + 𝐿𝐿säq
(2.4)
A comparison of equations 2.2 and 2.4 shows that the equivalent veiling luminance causes a decrease in the contrast 𝐾𝐾WB . It is therefore more difficult to perceive the object. The contrast at which an object can still be distinguished from its background with a perception probability of 𝑝𝑝 = 50 % is referred to as the visual contrast threshold 𝐾𝐾Wth and is defined by equation 2.5 as follows:
𝐾𝐾Wth = ∆𝐿𝐿′
𝐿𝐿Umfeld (2.5)
The visual contrast threshold 𝐾𝐾Wth is therefore the luminance difference threshold ∆𝐿𝐿′ divided by the background luminance. In summary, it can be said that a blinding light source reduces the contrast of an object which is barely distinguishable from its background to the point where it cannot be distinguished at all. To make the object perceptible again, the luminance difference ∆𝐿𝐿′ between object and background and, therefore also the contrast, has to be increased. The visual contrast threshold can be used as the parameter to describe disability glare (SCHMIDT-CLAUSEN UND BINDELS 1971).
2.2 Discomfort glare Discomfort glare impairs the visual comfort of the person affected by glare. One method for measuring discomfort glare as described in relevant publications is to determine the "borderline between comfort and discomfort" (BCD). The disadvantage of this method, however, is that it requires an exact and clear definition of the BCD. Moreover, the test person has to be allowed to adjust the glare stimulus himself or herself since otherwise the results would be inaccurate. (DE BOER 1967)
Because of the said disadvantages, the DE BOER scale is used instead for subjective evaluation of discomfort glare in vehicle lighting technology (DE BOER UND VAN HEEMSKERCK 1955; DE BOER 1967). This is a nine-point scale in which every second point describes a subjective perception (DE BOER 1967). Figure 1 shows the DE BOER evaluation scale applied to evaluate discomfort glare as experienced by test persons participating in this study. For the test persons’ convenience, only 3 descriptions were assigned to the 9 points on the scale.
Figure 1: DE BOER evaluation scale used in this study
The highest figure on the DE BOER scale (9) describes the lowest perceived glare, and the lowest figure (1) describes the most intensive glare. (5) represents the value “just acceptable“ and constitutes the limit value between blinded and not blinded. In its original version, the DE BOER scale also describes the figures (3) as “disturbing” and (7) as “satisfactory”.
The individual work packages (WP) of the study are explained in the following chapters.
3 WP 1: Field tests on headlamp levelling systems currently available on the market
Different loading, bumps in the road surface and vehicle acceleration processes can lead to other road users being blinded by headlamps. This is due to pitching movements which change the vertical angle of light distribution. A headlamp-levelling system can be used to prevent the glare effect and UN Regulation No. 48 requires these systems to work automatically (UN Regulation No. 48). The headlamp levelling device compensates vehicle pitch motions by adjusting the altitude of the light/dark cut-off line (“cut-off”) and therefore of the

6
total conical light beam in relation to the vehicle’s pitch angle. There are three types of HLD, all of which are explained in more detail in the following section. Pneumatic suspension can also be used to even out vehicle pitch motions, but examination of this feature was not part of the present study.
3.1 The headlamp levelling device Manual headlamp levelling devices are operated by the driver to compensate changes of the vehicle’s pitch angle caused by loads. The driver can and should adjust the headlamp pitch angle in relation to the added load (UN Regulation No. 48), and such devices allow him or her to adjust the height of the cut-off line incrementally or continuously using a setting wheel. Each increment lowers the light beam to suit the vehicle’s loading conditions. Usually, a stepper motor turns the entire lighting module inside the headlamp. The adjustment range is defined in UN Regulation 48 and is based on the maximum static load added to the vehicle. Manual headlamp levelling devices are mandatory for all vehicles first registered on or after 01/01/1990 (UN Regulation 48).
According to UN Regulation No. 48, an aHLD is required for vehicle headlamps with a light source exceeding 2000 lumen. These devices have sensors which measure the distance between the vehicle body and suspension components. Depending on the automobile manufacturer, between one and four sensors are installed, the data of which are collected and evaluated by a control device. This system calculates the vehicle’s pitch angle in relation to the road surface. On the basis of this information, the light beam is automatically adjusted to the vehicle's pitch angle. Algorithms are applied to smoothen the data to avoid undesired maladjustments, for example on uneven ground (WÖRDENWEBER 2007). The algorithms used cause a delay in the aHLD’s response to pitch changes and so an aHLD is only used to compensate the vehicle’s angle in relation to the road surface when loads are added or the load changes, for example as the fuel tank gradually becomes empty.
The third type of HLD is the dynamic headlamp levelling device (dHLD). In addition to compensating the load, as an aHLD does, the dHLD also reacts to changes in the vehicle dynamics. These include acceleration and braking as well as bumps in the road, for example. Since a dHLD is not manually controlled by the driver, the same legal requirements apply to dHDLs as to aHLDs. The dHLD ensures that the cut-off remains at the set initial height. Calculations to control the cut-off height are based on analysis of data retrieved from the tachometer, the ABS control unit and the
sensors that detect changes of the vehicle’s angle relative to the road surface. These vehicle data are transmitted in encrypted form and are not universally accessible. Moreover, the position and number of inclinometers on each vehicle are not standardised. Neither the UN Regulation nor the type-approval regulations stipulate control speed and latency of the system. These are specified individually by the automobile manufacturer.
For aforesaid reasons, no vehicle sensor data were available for the current study. Therefore a proprietary system for measuring vehicle dynamics was developed. This is based on findings and information from relevant literature.
3.2 Relevant literature HUHN carried out an analysis of vehicle dynamics as part of his university dissertation. In this, he observed the changes in light distribution in the region of the cut-off line. He analysed the pitch angles of eight vehicles from four different manufacturers. The vehicles were accelerated and then braked both in real-life traffic situations and on a test track. In order to determine the pitch angle, HUHN used two vehicle height sensors operating on the laser triangulation principle, one installed at the front and one at the rear of the vehicle. On the test track, the maximum pitch angle measure during acceleration was 𝛽𝛽max = + 1.49° and during braking 𝛽𝛽min = - 1.81°. In real-life traffic conditions, each of the eight vehicles travelled a total of 175 km, divided evenly into city traffic, country roads and motorways. These tests produced similar maximum pitch angles during acceleration as on the test track. With regard to braking, a minimum pitch angle of 𝛽𝛽min = - 0.56° was measured in city traffic and on country roads. This angle increased to 𝛽𝛽min = - 0.63° on motorways. HUHN also calculated the cumulated proportion of glare per hour, i. e. the proportion of time during which the left-hand part of the cut-off line was above the horizontal. This value differed greatly between the various vehicles and this, according to Huhn, can be attributed to the “transmission gear ratio of the lower gears and generally strained driving behaviour during measurements.” “Particularly large pitch angles and, consequently, the greatest glare proportions were detected in vehicles with powerful engines, short wheelbases and soft suspensions, the suspension characteristics having the greatest effect.” (HUHN 1999)
LEHNERT examined the effect of glare stimuli on human vision. This is important, since vertical vehicle dynamics can cause glare impulses which might affect the driver of an oncoming vehicle, for instance. LEHNERT therefore carried out a laboratory

7
study examining the effects that glare impulses with a duration of 0.3 - 10 seconds have on human vision. The study focussed on the re-adaptation time following temporary blinding. This was calculated and statistically analysed using a range of models. In addition, tests with human volunteers were carried out in order to ascertain discomfort glare and correlate this to the calculated re-adaptation time. The test persons were seated in a vehicle and dazzled by special modified headlamps which were able to execute quick vertical movements. The resulting glare impulses were compared with real dynamic vehicle movements. LEHNERT established a correlation between the duration of the glare stimulus and discomfort glare. However, this correlation depends on the maximum glare stimulus duration, since a longer glare stimulus results in a stronger feeling of discomfort. The re-adaptation time increased significantly with glare stimuli exceeding 0.3 seconds. LEHNERT also managed to establish a linear correlation between the logarithmically decreasing maximum glare illuminance and the evaluation of discomfort glare. (LEHNERT 2001b)
FLANNAGAN examined the advantages of headlamp levelling devices for a number of dipped-beam headlights currently available in the USA. This study is particularly interesting since headlamp levelling devices are not mandatory for vehicles in the USA. The American regulations favour large vision ranges and glare plays only a minor role. Nevertheless, there have been several major changes in the past few years in which glare aspects are becoming increasingly important. FLANNAGAN tested a family saloon, a minivan and a SUV. All three vehicles were tested both in fully laden state and in empty state in order to determine the dynamic effects. In these tests, two lasers were attached to the vehicle - one to the front and one to the rear end - and the distance between lasers and road surface was measured at 100 Hz. FLANNAGAN observed that loaded vehicles experience higher pitch angles than empty vehicles. He also discovered a correlation between the vehicle speed and the pitch angle. The deviations of the vehicle’s angle relative to the road surface were considerably greater at speeds below 50 km/h than at speeds above 50 km/h. (FLANNAGAN ET AL. 2007)
In his doctoral thesis, ZYDEK examined the effect of vehicle load on glare. He examined 25 different series-production vehicles with various headlamp systems and in three different states of loading (0 %, 50 % and 100 %), 0 % being the empty weight and 100 % the permitted maximum gross weight of the respective vehicle. ZYDEK examined the illuminance, luminance and discomfort glare caused by vehicles with different loads. “The results for
discomfort glare by test persons on the driver’s seat and on the front passenger seat were merged since the evaluations showed no significant difference.” ZYDEK observed a correlation between the DE BOER scale rating and the vehicle load. A DE BOER scale rating of more than 5 was determined for vehicles with a 0 % and a 50 % load, thus indicating a low degree of blinding. However, a DE BOER scale rating of 2.7 was determined for vehicles with a 100 % loading. A rate of 3 already indicates glare experienced as being disturbing. “There is a significant difference between the mean values of the DE BOER scale ratings for 0 % and 50 % and those for 50 % and 100 %”. This means that vehicle loading has a significant impact on the test persons’ assessment of glare. ZYDEK also discovered an interdependency between the DE BOER scale rating and the pitch angle of the cut-off line. The correlation has a coefficient of determination of 𝑅𝑅2 = 0.78 and indicates increasing glare at increasing pitch angles. No significant differences were discovered in a comparison of the various light sources – tungsten-halogen, high-intensity discharge and LED lamps. ZYDEK also noted the following: “While adjusting the headlamps, it was observed that the resulting cut-off line pitch angles of various vehicles with the same loads differ significantly.” This leads to the conclusion that, in addition to the added load, the suspension also has a significant effect on the way glare is subjectively experienced. After analysing the photometric data, ZYDEK concluded that the mean and maximum luminance are the most suitable parameters “for making as precise a statement as possible about blinding by headlamps.” However, calculating the mean illuminance smoothens the illuminance data and therefore these are only suitable as reference values for qualifying vehicle dynamics. In his study, ZYDEK concluded that it is not expedient to link the requirement of using headlamp levelling devices to the specific luminous flux of a lamp or to the lamp type LED. (ZYDEK 2014)
At the 11th International Symposium on Automotive Lighting ISAL 2015, Mr. KASABA of KOITO Manufacturing presented a system which measures the vehicle’s angle relative to the road surface using an acceleration sensor instead of conventional vehicle height sensors. This sensor is said to be smaller, lighter and less expensive than the vehicle height sensors currently used. The acceleration sensor enables calculation of the vehicle’s dynamic pitching motion. The vehicle axis is used as a reference and the vehicle’s angle in relation to the road surface is calculated from the sensor data by applying the law of tangents. Static pitch motions like those caused by adding loads, are determined by a gravity acceleration sensor. The sensor data

8
are compared with each other in order to detect any changes in loading. (KASABA 2015)
4 WP 2: Examination of the pitch angle of representative vehicles, taking load, suspension and vehicle dynamics into account
In the present study, two different types of vehicle are used to investigate how the vehicle’s pitch angle relative to the road surface affects glare: test vehicles and measuring vehicles. The two types of vehicle are explained in more detail below. Test vehicles are vehicles with which the parameters added load, suspension and vehicle dynamics are examined. Measuring vehicles are vehicles in which the glare characteristics of the light emitted by the test vehicle are measured.
In the following section, the measuring equipment and selection methods for test vehicles are first explained, followed by the test set-up and test procedures.
4.1 Measuring equipment used to determine vehicle dynamics and glare
The following sections describe the measuring equipment used in the present study to determine vehicle dynamics and glare.
4.1.1 System developed to determine the vehicle’s pitch angle
Based on findings presented in the references listed in Section 3.2, a proprietary system for measuring the position of the vehicle relative to the road surface was developed.
4.1.1.1 Vehicle body inclinometer Similar to the approach used by KASABA, an inclinometer is used. This sensor allows determination of the angle α of the vehicle to the horizontal plane. The UM 7 inclinometer manufactured by CH ROBOTICS permits readings with a temporal resolution of 255 Hz. In relative measurements, this sensor has an accuracy of ± 0.5°.
4.1.1.2 Vehicle body height sensors In addition, two vehicle height sensors are installed on the front and rear of the vehicle, as in the tests carried out by HUHN and FLANNAGAN. These are type GP 2 Y0A 02 YK sensors manufactured by SHARP.
They permit readings with a temporal resolution of 30 Hz. The vehicle height sensor characteristics were tested under laboratory and real-life conditions and operate with an accuracy of ± 3 mm in a range of 20 - 60 cm. Figure 2 shows the location of the measuring equipment on the vehicle.
Figure 2: Location of the sensors used on the vehicle
The choice of location for the vehicle height sensors is based on studies by (LEHNERT 2001a; HUHN 1999; FLANNAGAN ET AL. 2007) regarding methods of determining the pitch angle of a vehicle relative to the road surface.
4.1.1.3 Electronics The sensors are controlled via an Arduino Mega micro-controller, which stores the recorded data on an SD memory card. These data can then be analysed using a computer.
Figure 3: Measuring equipment for determining vehicle pitch
angles
The simultaneous use of vehicle height sensors and inclinometer allows determination of the orientation of the vehicle relative to the road surface, thus making it possible to calculate the vehicle’s dynamic characteristics. Figure 3 shows the measuring equipment, i. e. the vehicle height sensors and inclinometer used for determining the vehicle’s pitch angle relative to the road surface. The vehicle height sensors operate on the basis of triangulation and generate an analogue output signal. This signal is digitised by an analogue-to-digital converter and transmitted to the micro-controller. Additional hardware is used to smoothen the supply voltage since the signal-to-noise ratio (SNR) of the supply voltage is proportional to the SNR of the

9
measurement results. In this way it is possible to achieve a reproducible accuracy of ± 3 mm.
4.1.1.4 Inclinometer on the light source in the headlamp
To measure the dHLD control behaviour, an additional inclinometer is attached directly to the headlamp’s projection module. Due to lack of space, this is only possible in vehicles with high-intensity discharge lamps, since these have a built-in maintenance opening to allow lamp replacement. Tungsten-halogen headlamps also have a maintenance opening, but as explained in Section 3.1, the use of a dHLD is not mandatory for tungsten-halogen headlamps. Through this opening, a second inclinometer which follows every movement of the light beam is directly attached to the mounting of the high-intensity discharge lamp. Due to the high temperatures generated by high-intensity discharge lamps, the temperature of this inclinometer is monitored as well. This allows the data to be corrected in relation to the ambient and operating temperatures. The two inclinometers, one on the high-intensity discharge lamp and one on the vehicle body, allow determination of the control speed and changes in the light beam’s angle.
4.1.2 Measuring equipment used to determine blinding due to glare
This section describes the function and temporal resolution of all measuring instruments used.
4.1.2.1 Illuminance In all measuring vehicles, illuminance is measured on the inner surface of the windscreen between the driver’s seat and front passenger seat (cf. Figure 8). Pilot tests have shown this position to be most suitable, since even slight movements of the test persons create shadows, and this affects the measurement head if the sensor is positioned directly next to the driver or the front-seat passenger. The Gigahertz-Optik type X-11 illuminance photometer can operate with a temporal resolution of 50 ms within a range of 0.1 lx – 5 lx. This resolution time comprises 20 ms for recording and integrating the measured illuminance and an additional 30 ms for transmitting the illuminance value to the micro-controller. These values were determined in a laboratory test.
4.1.2.2 Blinding button In order to establish the point at which a test person feels blinded by the recorded illuminance, a so-called “blinding button” was installed for the test person in the driver’s seat. The test persons were requested to press this button as soon as they felt blinded (DE BOER rating < 5). Pressing the button interrupts the measurement process and records
the time at which this occurs, thus enabling the exact point in time to be determined in the illuminance function graph.
4.1.2.3 Contrast box As in previous tests carried out by ZYDEK, a contrast box was used to measure disability glare (cf. Section 2.1). This contrast box allows dynamic determination of the visual contrast threshold, i. e. the minimum discernible contrast. A white LED is installed behind a circular diffuser inside a black box. In the course of the test, the luminance of the LED is automatically increased by approximately 1 % at 20 ms intervals. The test person’s task was to adjust the contrast box by pressing a button as soon as he or she was able to see the LED in the box against the dark background. Pressing the button triggered a reduction of the contrast box LED’s luminance by approximately 1.5 %. The aim was to keep the brightness of the LED at the “just perceivable” threshold by repeatedly pressing the button. The test persons had to adjust the contrast continuously throughout each test run. This results in the contrast threshold increasing while a test vehicle is approaching. Accordingly, the LED had to be adjusted to increasingly brighter settings until the oncoming vehicle had completely passed the measuring vehicle in which the test person was sitting. In order to deal with possible brief glare maxima, the test person was given the option of pressing an additional button to abruptly increase the LED’s brightness by approx. 3%. The stated values were determined in several pilot tests. Figure 4 shows a schematic diagram of the test set-up used to dynamically measure the visual contrast threshold during a test run.
Figure 4: Recording the dynamic visual contrast threshold
during a test run (according to (ZYDEK 2014))
The contrast box was only used for the front-seat passenger and was positioned to simulate the test person on the front passenger seat detecting an object located on the right-hand side of the road at a distance of 50 m from the observer (cf. (ZYDEK 2014)). This distance corresponds to the overall stopping distance at 80 km/h, a typical speed on

10
country roads. The overall stopping distance takes consideration of the reaction time and the vehicle's braking deceleration.
4.1.2.4 Eye-tracking and pupillometry A further option for measuring the physiological reaction of the human eye to light stimuli is to observe the reaction of the test person’s pupil. It is common knowledge that the pupil of the human eye contracts in bright light and widens in poor lighting conditions. This phenomenon is to be exploited in order to relate quick changes of illuminance to changes of the pupil diameter. To measure this reaction, an eye-tracking system made by The Eye Tribe is attached to the steering wheel of each measuring vehicle. This system is able to record both the direction in which the test person is looking and the corresponding pupil diameter with a time resolution of 30 Hz. The system is attached directly to the steering wheel and records the pupil diameter of the test person sitting in the driver’s seat.
4.2 Selection of representative test vehicles
ZYDEK discovered that it is not the luminous flux but the suspension that is decisive for the glare and that there is a correlation between a vehicle's pitch angle and the discomfort glare (ZYDEK ET AL. 2013). Therefore, vehicle selection was mainly based on two parameters: luminous flux and suspension. The following section describes how the vehicles were chosen on the basis of these two parameters.
The luminous flux depends on the light source(s) used. For the dipped-beam headlamps examined in this study, three different types of light source are currently available on the market and are installed by car makers: tungsten-halogen bulbs, high-intensity discharge lamps and LEDs. Use of an aHLD is linked to the luminous flux and is therefore mandatory when 35 Watt high-intensity discharge lamps are used. All LED headlamps have to be equipped with an aHLD (UN Regulation 48). Headlamps with tungsten-halogen bulbs do not have to be equipped with an aHLD since the luminous flux of tungsten-halogen bulbs commonly used in headlamps does not exceed 2000 lm. By directly comparing light sources exceeding the threshold of 2000 lumen (e. g. high-intensity discharge lamps) with light sources below this threshold (e. g. tungsten-halogen bulbs), this study aims to answer the question of whether it makes sense to relate mandatory installation of an aHLD to luminous flux. To determine the relationship between luminous flux and suspension, the study was divided into two parts. In the first part, the tungsten-halogen headlamps of a vehicle were replaced by high-intensity discharge lamps. Since
the same vehicle is used in both cases, it can be assumed that the vehicle dynamics are identical, thus allowing isolated investigation of the effects of light distribution or the light source, respectively, on blinding by glare. In the second part of the study, the influence of the suspension was examined. Two vehicles with the same headlamps and therefore with identical light distribution but different suspension characteristics were examined in order determine this effect. Market research showed that the vehicles models Audi A3 and Audi S3 have different suspension characteristics but are fitted with the same type of headlamp. To classify the suspensions used in the selected vehicles, the pitch angle of the vehicles was measured in a static condition with a vehicle load of 250 kg. This angle was determined by measuring the distance between a levelled laser line and the rear wing of the vehicle when loaded and when empty, respectively. The difference between these two measurements allows a static classification of the installed springs. Table 1 shows an overview of the tested vehicles, including their light source, suspension classification and the type of headlamp levelling device installed.

11
Table 1: Overview of tested vehicles, including light sources, suspension characteristics and HLD
Vehicle Light source Suspension HLD Peugeot 208 tungsten-
halogen soft manual
Opel Insignia tungsten-halogen medium none
Opel Insignia high-intensity discharge medium dynamic
Audi A3 high-intensity discharge medium dynamic
Audi S3 high-intensity discharge hard dynamic
VW POLO LED hard dynamic
It should be noted that the Opel Insignia is listed twice since the headlamps were changed in the course of the test run. It was possible to use the same suspension (vehicle), while replacing the high-intensity discharge headlamps by tungsten-halogen headlamps. Due to the change-over to tungsten-halogen headlamps, an aHLD is no longer required. However, due to the change of headlamps it was not technically possible to use the required manual headlamp levelling device.
The five test vehicles listed in Table 1 can be classified into three groups, depending on the extent to which loading lowers the tail of the vehicle. Figure 5 shows the differences between the vehicle heights when loaded and when empty, as well as the assignment to one of the three classes mentioned above. It should be pointed out here that this measurement only characterises the vehicle’s spring stiffness, but not its shock-absorber characteristics. This measurement was chosen since the control range of the headlamp levelling devices is based on static load changes and therefore takes the spring stiffness into consideration as well.
Figure 5: Static classification of the suspension spring
stiffness
The Audi S3 (vehicle 4) has the hardest suspension of all vehicles used in this test and so this value is considered to be the upper limit. The suspension of the vehicle with the softest suspension, a Peugeot 208 (vehicle 1) with tungsten-halogen headlamps acts as the lower limit. A Volkswagen Polo was used as test vehicle with LED headlamps since it is the compact car model with the largest number of new registrations in Germany (Statista 2017).
Figure 6 shows the images obtained with the five vehicles and the six headlamp systems, respectively. The images show that the Peugeot 208 with tungsten-halogen headlamps has the narrowest light distribution and at the same time least bright illuminance on the road. The images also show that the Audi A3 and Audi S3 have the same light distribution, as assumed above. The Opel Insignia with tungsten-halogen headlamps creates a bright, wide light distribution. In direct comparison with the Insignia with gas-discharge headlamps, it is noticeable that most light is concentrated in the central region.
4.3 Test set-up and procedure The tests were carried out at the test site of the Technical University Darmstadt, i. e. the August-Euler airfield in Griesheim near Darmstadt. The test site of the airfield is divided into an approximately 1200 m long runway and a taxiway running parallel to this. The tests were carried out on the runway.
The test vehicles were tested in different load states and, where applicable and technically possible, with various headlamp levelling device settings. In order to test the effects of added load on the dynamics of the different test vehicles and enable comparison of these parameters, all test vehicles were loaded with the same weight. With an overall weight of 250 kg, the load positioned in the trunk of the test vehicles
A luminance camera of type LMK 5 Color, made by Technoteam, was set up on the roadside in order to obtain a comparison of the light distribution of the individual vehicles. This camera was used to take luminance images of the light distribution on the road. For better comparability, all vehicles were placed, one after another, in exactly the same place.
Figure 6: Luminance in the area in front of the test vehicles

12
corresponds to approximately 50% of the tested compact car’s load capacity. This roughly corresponds to a load of three occupants plus baggage.
Table 2: Examined test vehicle parameters
Test vehicle
Load 0 kg 250 kg
HLD activated deactivated
Suspension characteristics
soft medium hard
Headlamp type
tungsten-halogen high-intensity
discharge LED
Pitch angle vehicle height
sensors inclinometers
Table 2 provides an overview of the examined test vehicle parameters. A human test-subject study was carried out in order to assess the parameters listed in Table 2 in terms of glare. The following parameters were determined:
disability glare (cf. 2.1) discomfort glare (cf. 2.2) illuminance (cf. 4.1.2) pupil diameter (cf. 4.1.2).
To ensure comparable conditions, the above parameters were recorded simultaneously. To measure these parameters, a test vehicle was accelerated to 80 km/h and driven along the runway at this (constant) speed. At the same time, test persons in stationary measuring vehicles representing oncoming traffic were asked to assess the disability glare and discomfort glare caused by the approaching test vehicle. In the following descriptions, this procedure is referred to as a “test run”. The headlamp settings were checked before each test run and corrected where necessary. Figure 7 shows the test set-up.
The use of four stationary measuring vehicles made it possible for several test persons to assess the glare all at the same time. Two test persons were seated in each of the measuring vehicles ID1 to ID3, and each of them was requested to assess both the discomfort glare and the disability glare of the respective test vehicle. The driver and the front-seat passenger in measuring vehicles ID1 - ID3 were requested to perform different tasks. The test person in the driver’s seat was asked to assess discomfort glare according to the DE BOER scale. In addition, this test person was also given a blinding button (cf. Section 4.1.2) to hold and was asked to press this as soon as he or she felt blinded (DE BOER rating < 5) by the test vehicle during a test run. The pupil diameter of the test person in the driver’s seat was also measured with an eye-tracker during the test runs in order to determine the correlation between pupil reaction and glare. The test persons in the front passenger seat were asked to assess disability glare for each test run, using a contrast box (cf. Section 4.1.2). To do this, the front-seat passengers continuously adjusted the visual contrast threshold 𝐾𝐾Wth (cf. Section 2.1). After each test run, the test person in the front passenger seat was also asked to assess discomfort glare on the DE BOER scale. The test persons were asked to imagine that they were driving along a country road at night with their foveal line of sight directed at the vehicle ahead of them. In this way, the adaptation of the test persons was determined, while at the same time creating a reference to a real-life situation. Since no significant difference was found between the assessments from the driver’s and the front-seat passenger’s perspective (cf. Section 10.1), these assessments were combined in all further analyses. Measuring vehicle ID4 served as a point of orientation for the test persons in measuring vehicle ID3, so that they were also able to direct their eyes towards the tail lamps of a vehicle ahead of them, as all other test persons. This ensured that adaptation of the test persons in the individual measuring vehicles was identical. Furthermore, in ID4, the acceleration process of the approaching
Figure 7: Test set-up on the August-Euler airfield

13
test vehicles was recorded by measuring the illuminance. Figure 8 shows a picture taken from the perspective of a measuring vehicle driver. The measuring vehicles’ dashboard lighting was set to minimum brightness. The picture shows the blinding button, the eye-tracker used to measure the pupil diameter, the illuminance sensor head and the contrast box. A GPS module was installed in each vehicle for data synchronisation purposes. This GPS module also allowed measurement of the distance between test vehicle and measuring vehicles.
Figure 8: View from inside a measuring vehicle: blinding
button, eye-tracker, contrast box and the illuminance sensor head
The control units of the measuring equipment were located in a casing and placed on the back seats of the measuring vehicles. This prevented the test persons accessing the control units and served as protection against external influences. In addition, a radio module which is able to send a status report of all connected systems to the test coordinator upon request was also used. This allowed wireless monitoring of the connected control units and thus of the measuring equipment on the entire test site.
Each test run was repeated three times for each of the two loading conditions and, where applicable, for the different headlamp levelling device settings. This meant that the data entered by the test persons could be checked for consistency, i. e. “whether a person gives the same answers to a specific physical question at different times.” (BÖDEKER 2006)
In total, the number of test runs for all test vehicles and settings added up to 54 each evening, i.e. 18 different vehicle combinations were tested 3 times each (see Table 3). It should be noted that it was not possible to deactivate the dHLD in the Polo. Each test run took approximately 3 minutes, resulting in a calculated overall test time of 162 minutes. In view of the time taken, it would not have made much sense to repeat the tests more often since the test persons’ powers of concentration and motivation would have suffered from this. The test procedure itself involved short breaks, for example when the test vehicles were returning to the starting position. Further breaks were taken by test persons
as required. The tests were carried out on 8 different nights within a period of 14 days.
4.4 Test persons A total of 47 test persons participated in the study. 28 persons were younger than 30 years of age and are referred to here as the “younger test persons”. 19 test persons were over 40 years of age. Based on data by (LERMAN 1980), these are referred to here as the “older test persons”, since the eye lens tends to become increasingly yellow and cloudy after the age of 40. The youngest test person was 20 and the oldest test person 66 years old.
4.5 Results The results of the tests carried out for WP 2 are summed up in the following sections.
4.5.1.1 Discomfort glare As far as the DE BOER ratings of younger and older test persons are concerned, there is no significant difference between the two age groups (cf. Section 10.5). The same applies to the DE BOER ratings of drivers and front-seat passengers. Therefore, the assessments are analysed together. A box plot of the comparison between younger and older test persons and a further box plot comparing the DE BOER ratings of drivers and front-seat passengers are shown in the annex to this report (cf. Section 10.1).
In the following descriptions, the mean DE BOER ratings of the individual test vehicles are classified as either “blinding” or “not blinding”. All test vehicles with a mean DE BOER rating of less than five are classified as being “blinding”. Accordingly, test vehicles with a mean rating of more than five are classified as “not blinding”. Table 3 provides an overview of the vehicles in the two classes. The vehicle identification consists of three parts: the first part is the vehicle model, the second signifies whether the dHLD was activated (“On”) or deactivated (“Off”) and the third part indicates the load state.

14
Table 3: Classification of the vehicles (18 vehicle combinations) by DE BOER rating On / Off = state of the dHLD
Full / Empty = load state of the vehicle
Not blinding Blinding 208 Tungsten-halogen
Empty Insignia Off Empty
208 Tungsten-halogen Full
Insignia Off Full
A3 On Empty Insignia On Full
A3 On Full Insignia Tungsten-
halogen Empty
A3 Off Empty Insignia Tungsten-
halogen Full
A3 Off Full Polo On Full
Insignia On Empty S3 Off Empty
Polo On Empty S3 Off Full
S3 On Empty
S3 On Full
The classification shows that as a rule, test vehicles with activated dHLD (“On”) cause no discomfort glare, but that the test persons felt blinded by most vehicles with a deactivated dHLD (“Off”). The Opel Insignia with high-intensity discharge headlamps and deactivated dHLD is among the vehicles classified as “blinding”. This was to be expected since the dHLD in this vehicle was deactivated even though (UN Regulation 48) requires the use of a dHLD. However, it is noteworthy that the Opel Insignia with activated dHLD and in loaded condition (“Insignia On Full”) was also assessed as being blinding, although the dHLD should have compensated the pitch motions and thus prevented glare. Moreover, the Opel Insignia with tungsten-halogen headlamps was also assessed as being blinding in both load states (Insignia Tungsten-halogen Empty and Insignia Tungsten-halogen Full). The use of an aHLD is not mandatory for this vehicle combination since the installed H7 bulbs have a luminous flux of less than 2000 lm. However, the luminance images already showed that this tungsten-halogen headlamp has a bright light distribution concentrated on the central region (cf. Figure 6). Furthermore, the Polo with activated dHLD and maximum added load (“Polo On Full”) is also classified as being blinding. It appears that the added load changes the vehicle’s angle relative to the road surface to such an extent that the dHLD can no longer compensate the vehicle movements, as was the case with the Opel Insignia, too. All in all, four vehicle combinations are conspicuous since they were rated as being blinding in their series-production configuration. These are:
• Insignia On Full • Insignia Tungsten-halogen Empty • Insignia Tungsten-halogen Full • Polo On Full
The discomfort glare caused by these four vehicle combinations might possibly be explained by increased luminous exposure. The luminous exposure is the integral of the measured illuminance over time. Earlier studies by the lighting technology department have shown that de-blinding of the oncoming traffic (changing from high-beam to dipped-beam to prevent glare) should be carried out before the vehicles are at a distance of 400 m apart (SPRUTE 2012). In order to describe the effect of luminous exposure, the measured illuminance was integrated over the time required to travel the last 400 m before passing the respective measuring vehicle. At a constant speed of 80 km/h, it takes roughly 18 seconds for a test vehicle to cover these 400 m. Hence, the luminous exposure can be calculated with the following equation:
𝐻𝐻0 bis 400 m �80kmh� = � 𝐸𝐸v(𝑡𝑡)𝑑𝑑𝑡𝑡
18 s
0 s
(4.1)
After calculating the luminous exposure for all vehicles, it appears that all vehicles assessed as being blinding generate a greater luminous exposure. Figure 9 shows the correlation between mean DE BOER rating and mean luminous exposure H for the 18 vehicle combinations listed in Table 3.
Figure 9: DE BOER rating of the luminous exposure for all 18
vehicle combinations
The red trend line has a coefficient of determination of 𝑅𝑅2 = 0.84 so a correlation can be assumed. At a luminous exposure of around 3.5 lx·s, test person assessments with a comparably high standard deviation of up to 0.6 valuation units (see red mark in Figure 9) can be seen. This leads to the conclusion that the test persons were very uncertain about the BCD. In an analysis of the luminous exposure and the DE BOER rating, it has to be noted that optimum representation of vehicle dynamics phenomena is not possible since these consist of data integrated over the entire test run. However, vehicle dynamics phenomena such as a light impulse generated while driving over a bump in the

15
road are only short. For this reason, the following section analyses the data collected via the blinding button.
4.5.1.2 Blinding button In the test runs, test persons were requested to press a “blinding button” whenever a light impulse from the oncoming test vehicle was perceived as being blinding (cf. Section 4.1.2). Since each test person has an individual threshold at which he or she presses the blinding button, all data have to be standardised before the results can be compared (cf. Section 10.2). In this standardisation process, the data are transformed into z-values. The values resulting from this transformation are then measured in terms of multiples of the standard deviation and have a mean value of zero (LOHNINGER 2017). This z-transformation enables comparison of the data of the three measuring vehicles ID1, ID2 and ID3 and makes it possible to determine the significance of the way empty and loaded vehicles were assessed. In the case of the test vehicles Audi A3 and S3, the comparison revealed that there is a significant difference between the assessments (using the blinding button) of the loaded and the empty vehicle with activated dHLD (A3: p = 0.040, S3: p = 0.005). Contrary to expectations, both vehicles in the loaded and empty states were assessed as “not blinding” on the DE BOER scale for discomfort glare. The assessments of the Opel Insignia and the VW Polo are also notable in that they revealed significant differences between the loaded and the empty states (Insignia: p = 0.040; Polo: p = 0.025). As expected, their DE BOER ratings change from “not blinding” when empty to “blinding” when loaded. This raises the question of why glare is caused by these four vehicles when they are loaded. To answer this question, one has to take a closer look at the illuminance values captured in a period of one second before the blinding button was pressed. To do this, the following parameters are calculated: mean value, local and global maxima, number of maxima and ratio of maximum illuminance to mean illuminance within the period of one second before the blinding button is pressed. As shown in Figure 10, a correlation was only found for the last parameter of this list. The diagram shows the ratio of measured maximum illuminance to calculated mean illuminance for the 18 vehicle combinations listed in Table 3. Since the blinding button was usually pressed several times for each vehicle combination, the bars represent the mean value obtained from all maximum-to-mean value calculations for each vehicle combination.
All values are between 1.2 and 1.7 and a statistical analysis of these shows no significant differences. The vehicle combination “Polo On Full” constitutes
an exception and differs significantly from all other
vehicles (p = 0.053). Figure 10 shows that a high maximum to mean illuminance ratio (1.984) seems to be one of the reasons why the test persons pressed the blinding button.
4.5.2 Analysis of data collected for vehicles travelling at a constant speed
The data regarding the vehicle’s pitch angle relative to the road surface and the measured illuminances while travelling at constant speed (without acceleration) are explained in the following sections.
4.5.2.1 Pitch data The vehicle pitch data collected by the sensors are used to verify major influences and establish a correlation between glare and suspension. The test track can be divided up into two sections. In the first section of around 150 m, the test vehicle accelerates to 80 km/h. This is the section in which the largest vehicle pitch angles occur. In the second section, the test vehicle travels with activated cruise control at a constant speed of 80 km/h. Figure 11 shows a box plot of the pitch angles of all five tested vehicles travelling at a constant speed. A box plot visualises five points of a distribution. These are:
maximum (upper whisker) 75 % quartile (upper edge of box) median (red line in the box) 25 % quartile (lower edge of box) minimum (lower whisker)
In the middle of each box, the median is marked in red, with the 25 %-quartile 𝑞𝑞25 and the 75 %-quartile 𝑞𝑞75 forming the lower and upper edges of the surrounding box, respectively. The minimum and maximum (also referred to as whiskers) are calculated using the following formulae:
max = 𝑞𝑞75 + 𝑤𝑤(𝑞𝑞75 − 𝑞𝑞25) (4.2) min = 𝑞𝑞25 − 𝑤𝑤(𝑞𝑞75 − 𝑞𝑞25) (4.3)
where W is a constant with a value of 1.57. The length of the whiskers of the box plot depends on the collected data values. Values outside the range
Figure 10: Relationship between maximum and mean
illuminance values

16
of the whiskers are shown as red crosses and are referred to as outliers. (Mathworks 2017)
When the pitch data of vehicles travelling at constant speed are examined, it is noticeable that 50 % of all data are within a range of ± 0.1°.
If one takes all data outliers into consideration, the Audi A3 in an empty state had the smallest angle range, namely 0.9°. At the other end of the scale, the empty Opel Insignia has the largest angle range, namely 1.7°. Its maximum downward change in pitch is approx. -1° (cf. Section 4.1.1). Headlamps aimed too low result in a narrower vision range for the driver. The recorded pitch angle of -1° corresponds to a reduction of the vision range by approximately 20 m. A dHLD with low latency could compensate this change in pitch. Also, it is interesting that, due to the pitch exceeding 0.5°, the cut-off line was above the horizontal for the vehicle combinations considered to be conspicuous earlier on in this report (Peugeot 208 with added load, Opel Insignia with and without added load, and Audi S3 with added load). This might be a reason for these vehicles being rated as causing discomfort glare (cf. Table 3).
4.5.2.2 Illuminance values As far as the individual illuminance graphs are concerned, it appears that although the cut-off line of the Peugeot 208 rises above the horizontal due to the vehicle’s pitch, in their assessment according to the DE BOER rating the test persons did not feel blinded (cf. Table 3). The lower luminous flux and the light distribution of the installed tungsten-halogen headlamp might be a possible reason for this phenomenon (cf. luminance images in Figure 6). Figure 12 shows the illuminance of the Peugeot 208 plotted as a function of the distance, i. e. the distance between the Peugeot (test vehicle) and the measuring vehicle ID1 (cf. Figure 7).
Figure 12: Illuminance-distance graph of the Peugeot 208
The maximum distance between test vehicle and measuring vehicle shown in this graph is 400 m, and the minimum distance is where the two vehicles have completely passed each other (0 m). This form of diagram is used throughout the remainder of this report. Both in a loaded state (“Full”) and in an empty state (“Empty”), a maximum illuminance of 0.7 lx was measured in measuring vehicle ID1. It is interesting that the illuminance values of a loaded vehicle are significantly higher than those of the same vehicle when empty and that they have many local maxima. This increases the luminous exposure from 3.7 lx·s (without added load) to 4.4 lx·s (with added load). Nevertheless, the mean DE BOER rating for vehicles in both loading states as assessed by the test persons was 7.1 (not blinding).
Figure 13 shows the illuminance graphs of the Opel Insignia with high-intensity discharge headlamps as a function of the distance measured while the vehicle is moving towards the measuring vehicle. The diagram shows the graphs for activated (“On”) and deactivated dHLD (“Off”) as well as for loaded (“Full”) and unloaded (“Empty”) states. The illuminance of the Opel Insignia with high-intensity discharge headlamps and activated dHLD (“On”) in both a loaded and an empty state reaches a maximum value of almost 1.5 lx. This value is around twice the value achieved by the Peugeot 208 with tungsten-halogen headlamps. Compared with the Peugeot and the Insignia values in both load states, this results in higher discomfort glare according to the de Boer scale: “Insignia On Full” = 4.8 and “Insignia On Empty” = 5.5.
Figure 13: Illuminance-distance graph of the Insignia with high-intensity discharge headlamps, with dHLD on/off and
with load/without load)
Figure 11: Distribution of the vehicle pitch angles of all 5
vehicles travelling at constant speed; grid lines represent the 0° / 0.57° values.

17
A comparison of the values measured with activated dHLD and without load (Insignia On Empty) shows that the dHLD does not prevent all local maxima of the vehicle when loaded (Insignia On Full). There is reason to presume that the dHLD in this vehicle reacts slowly and is therefore not able to compensate the maxima when the vehicle is loaded. Some of the maxima occurring in the illuminance graph show a pattern similar to that of the maxima of an empty vehicle with deactivated dHLD (DE BOER = 4.4). With deactivated dHLD and maximum added load, the illuminance reaches a maximum value of around 2.4 lx. The overall curve of the graph is also significantly higher than that of the graphs of the other three vehicle combinations shown in Figure 13. The resulting discomfort glare, with a de Boer rating of 3.5, is the worst recorded value.
Figure 14 shows the Illuminance graphs of the Opel Insignia in a full and in an empty state and with both tungsten-halogen and high-intensity discharge headlamps as a function of the distance between test vehicle and measuring vehicle ID1. A direct comparison of the illuminance graphs of the vehicles “Insignia Tungsten-halogen Empty” and “Insignia Off Full” (high-intensity discharge headlamps) with deactivated dHLD shows the following: the Insignia with high-intensity discharge headlamps, maximum load and deactivated dHLD generates a luminous exposure of 10 lx·s and was given a DE BOER rating of 3.5. The Insignia with tungsten-halogen headlamps (for which the use of an aHLD is not mandatory) already generates comparable values when empty (luminous exposure H = 9.6 lx·s, DE BOER rating = 3.9).
Figure 14: Illuminance-distance graph of the Insignia in empty/loaded state with tungsten-halogen and with high-
intensity discharge headlamps
This is also the case despite the H7 tungsten-halogen lamps of the headlamps only having a nominal luminous flux of 1500 (< 2000 lm) according to UN Regulation No. 37. In comparison, pursuant to UN Regulation 99, high-intensity discharge lamps have a nominal luminous flux which, at 3200 lm (> 2000 lm), is more than double this value (UN Regulation No. 99). In view of these individual data, use of the luminous flux of the light source as a
criterion for the mandatory use of an aHLD would seem to be debatable and should possibly be discussed in more detail. The Illuminance graphs of the tungsten-halogen headlamps (without aHLD, since not required by law) have a similar maximum of approximately 2.5 lx for both loading states. High-intensity discharge headlamps only reach a comparable maximum when the dHLD is deactivated and the vehicle is fully laden. With activated dHLD and an empty vehicle, however, the high-intensity discharge headlamps achieve the lowest illuminance values of all four Insignia vehicle combinations.
Figure 15 shows the illuminance-distance graph of the Audi S3. Here it is noticeable that there is practically no difference between the illuminance graphs of the vehicle with load, without load, with activated dHLD and with deactivated dHLD. However, significant differences were discovered upon analysis of the blinding button assessments (cf. Blinding button). The mean DE BOER rating tends to be slightly lower with deactivated dHLD (DE BOER rating = 4.6) than with activated dHLD (DE BOER rating = 5.4). This may be explained by a large number of small local maxima in the illuminance graph, which were caused by the Audi S3’s vehicle dynamics and were possibly not recorded by the photometer in spite of its temporal resolution of 50 ms (20 ms integration time; cf. 4.1.2). The test persons, on the other hand, might have experienced these maxima. It might be possible to compensate/prevent these short maxima to a large extent by activating the dHLD.
Figure 15: Illuminance-distance graph of the Audi S3 with
dHLD on/off as well as loading states empty/full
A comparison of the Audi A3 and S3 pitch data tends to support this assumption. Of all tested vehicles, the pitch angle variations of the Audi A3 travelling at constant speed have the lowest scatter (cf. Figure 11). Figure 16 shows the pitch angle data of the two vehicles in direct comparison.

18
Figure 16: Comparison of the vehicle body pitch data of the Audi A3 and S3 as a function of the distance while travelling
at constant speed; resolution: 255 Hz (cf. Section 4.1.1)
The high values in the range between 1000 m and 720 m are caused by acceleration. The graph shows that between 720 m and 300 m (following conclusion of the acceleration phase) the variations in the S3’s vehicle body pitch are greater and faster than those of the A3. This can probably be attributed to the harder suspension since one assumes that the S3 has the same dHLD as the A3. This also supports the assumption that short illuminance maxima (< 20 ms; cf. Section 4.1.2) which the photometer was not able to measure but which test persons perceived as being more blinding were generated by the S3 without dHLD.
Figure 17 shows the graph of the illuminance of the VW Polo LED headlamp (with activated dHLD) for a loaded and an empty vehicle as a function of the distance between 0 and 400 m. Between 400 and 1000 m, the difference between the two curves is less than 0.04 lx. Both the maximum illuminance and the overall illuminance curve are distinctly higher for the loaded state than for the empty state.
Figure 17: Illuminance-distance graph of the VW Polo with
load/without load
The calculated luminous exposure values confirm this tendency. Whereas the luminous exposure for the empty vehicle only reaches 3.6 lx·s, it increases to 5.3 lx·s when the vehicle is loaded. Therefore, it can be concluded that the installed dHLD is not capable of aiming the headlamp of a fully-loaded vehicle correctly. As a result, the test persons clearly perceive the headlights of the loaded vehicle as being more discomforting (DE BOER rating = 3.3)
than those of the empty vehicle (DE BOER rating = 5.9). This would indicate that the vehicle dynamics, and thus the suspension properties, have a significant impact on the recorded photometric properties (illuminance, discomfort glare). Therefore, in addition to the luminous exposure generated by the dynamic case (test vehicle travelling at 80 km/h), luminous exposure was also measured in a quasi-static situation (test vehicle moving at 5 km/h). The characteristics of the effect of the vehicle dynamics can be determined in this way by comparing the values.
Figure 18 shows the ratio of the calculated luminous exposure for the dynamic case to that of the quasi-static case for all 18 tested vehicle combinations (cf. Table 3). Two separate groups can be distinguished and these are identified in the diagram by a red and a green frame. In the first group, the quasi-static luminous exposure is roughly the same as the dynamic luminous exposure. The result is a ratio of approximately 1 (red box in Figure 18). The suspensions of these vehicles are able to cushion most of the existing bumps in the road surface and so the bumps cause no significant vehicle body movements. In this group, the difference between the luminous exposure caused by a vehicle with activated and a vehicle with deactivated dHLD is only small (p = 0.563). The Peugeot 208, Audi A3 and Audi S3 belong to this group.
Figure 18: Ratio of dynamic to quasi-static luminous
exposure for all 18 vehicle combinations
In the second group, the dynamic luminous exposure is greater than the quasi-static luminous exposure (green box in Figure 18). In this group, neither the suspension nor the dHLD was able to compensate for bumps in the road surface. Group 2 includes the Opel Insignia with activated dHLD (without load), the Insignia with deactivated dHLD (with load/without load), the Insignia with tungsten-halogen headlamps (with load/without load) and the VW Polo with activated dHLD (with load). Both groups (red, green) differ significantly in a statistical context (p = 0.016).

19
4.5.3 Assessment of the acceleration phase data
The following sections address the pitch data and latency during acceleration.
4.5.3.1 Pitch data Figure 19 shows box plots of the vehicle body pitch angle of all tested vehicles in a loaded and an empty state as they accelerate. The dashed line at 0.57° indicates the horizon from the headlamp’s perspective. Acceleration tilts the front of all vehicles upward to such an extent that the headlamps shine over the horizon, at least temporarily. The Peugeot 208 stands out because its headlights are always above the horizontal due to its soft suspension. Similar observations apply to the Audi S3. Although the S3 has the hardest suspension of all vehicles tested, thanks to its powerful engine it also has the sharpest acceleration, and therefore its headlights shine above the horizontal most of the time.
Figure 19: Distribution of the vehicle pitch angles of all 5
vehicles during acceleration
4.5.3.2 Latency of the dHLD To determine the dHLD's latency, a second inclinometer was attached to the burners of the high-intensity discharge headlamps (cf. Section 4.1.1). These sensor data were compared with the data collected by the inclinometer on the vehicle body. As an example, Figure 20 shows the data measured by the two inclinometers on the Opel Insignia with high-intensity discharge headlamps while the car was accelerating in an empty state.
To make the results easier to understand, the absolute values of the data of both sensors, which were actually installed in opposing pitch directions, are plotted in the graph and Figure 20 shows only a small segment of the acceleration process. The comparison of the two sensor curves shows a constant time offset between the vehicle body pitch and the pitch of the projection module. When reacting to bumps in the road surface, the projection module, controlled by the dHLD, is always tilted later than the vehicle body. In order to obtain a more accurate visualisation of the time lag, all the maxima occurring in the sensor data were analysed for each individual test run. Figure 21 shows box plots of the latency of the dHLDs for all three vehicles, fitted with high-intensity discharge lamps and tested with activated dHLD in both loaded and in empty states. The box plots show that the maximum time delays vary considerably and depend on the vehicle load.
Figure 21: Diagram of the latency of the dHLDs of all vehicles fitted with high-intensity discharge headlamps
The loaded vehicles have a significantly higher latency, in terms of both the median and the maxima.
4.5.3.3 Latency of the dHLDs and glare In the next step, the determined latencies were examined to establish whether they had any correlation with the DE BOER ratings. Figure 22 shows a diagram of the correlation. The data correlate with a coefficient of determination of 𝑅𝑅2 = 0.91. The data for a DE BOER rating of “9”
Figure 20: Pitch data of the headlamp and of the vehicle
body of the Opel Insignia with high-intensity discharge headlamps during the acceleration phase

20
(unnoticeable glare) are particularly interesting. Most of these assessments refer to the Audi A3.
Figure 22: Correlation between latency and DE BOER rating
The correlation shown in Figure 22 indicates that a dHLD which reacts more quickly to vehicle movements results in lower discomfort glare. The diagram shows that a DE BOER rating of five, which signifies the threshold between blinding and not blinding, is achieved at a latency of 350 ms. In a more conservative approach, a latency of less than 220 ms could be selected to achieve a DE BOER rating of six and thus a glare rating between “just acceptable” and “satisfactory”. A further reduction of the latency can further improve glare conditions.
4.5.4 Eye-tracking and contrast box The following sections address eye-tracking, pupil diameter measurement and the data collected with the aid of a contrast box.
4.5.4.1 Eye-tracking, including pupil diameter measurement
Figure 23 As an example, Figure 23 shows the measurement data of the “Insignia Tungsten-halogen Empty” as a function of the distance between test vehicle and measuring vehicle. The upper graph shows the illuminance data (cf. Figure 8). The lower graph shows the inverse standardised pupil diameter as determined by the eye-tracker (cf. Figure 8) as a relative quantity.
Two different sections can be identified in each graph. For distances of more than 200 m, both the illuminance curve and the inverse pupil diameter curve are relatively flat, despite slight variations. The pupil does not always react to changes in the illuminance, presumably due to the absolute values being too low, and the curve shape looks more like that of a noise component. Therefore these data are unsuitable for verifying any correlation between the pupil diameter and discomfort glare or disability glare. In the section depicting distances of less than 200 m, both curves ascend. Nevertheless, for the illuminance values reached in this test, no correlation between pupil diameter and illuminance was established for any of the test persons.
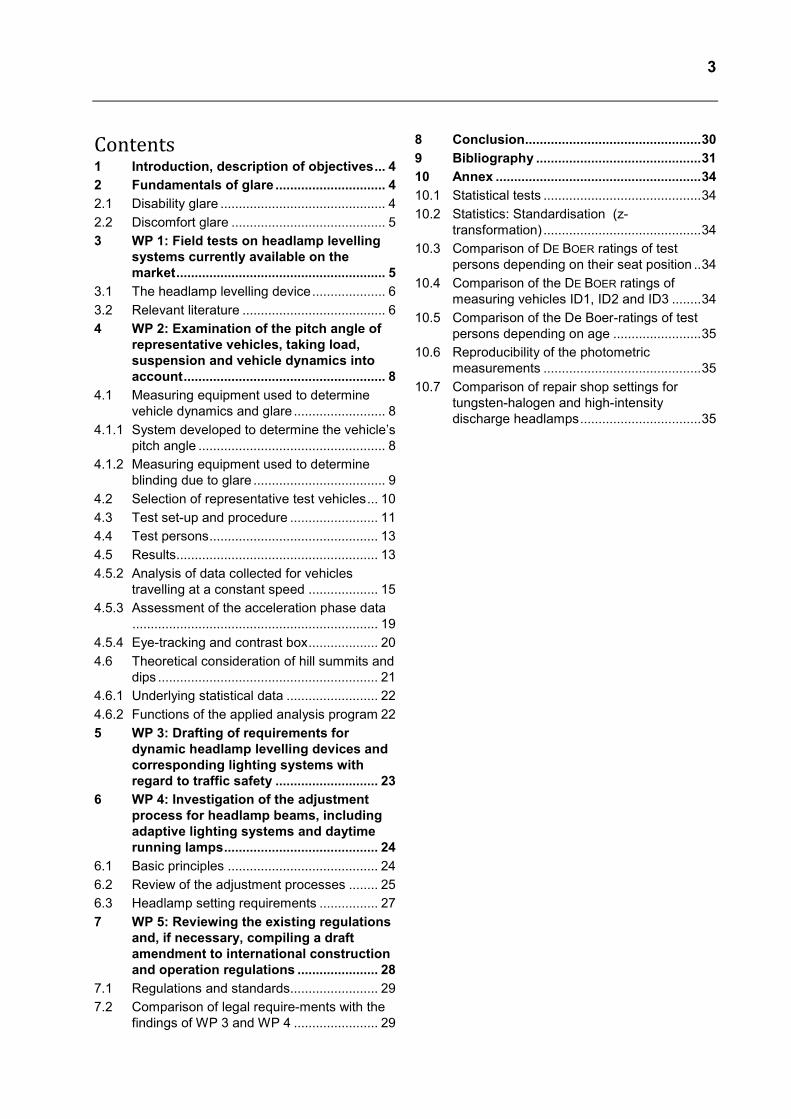
Figure 24 shows the mean inverse pupil diameters of younger and older test persons in the form of a box plot. The red box plots show the pupil diameters of younger test persons and the blue box plots those of older test persons. The diagram shows the pupil diameters of persons looking at a psychologically not-blinding vehicle (208 Tungsten-halogen Empty) and a blinding vehicle (S3 Off Full) selected from Table 3.
Figure 23: Comparison of illuminance and inverse pupil
diameter (Opel Insignia, Tungsten-halogen, Empty)
21
Figure 24: Comparison of the pupil diameters of younger and older test persons and of vehicles classed as blinding
and not-blinding
The pupil diameters in Figure 24 show no significant differences between younger and older test persons (p = 0.926) or between blinding and not-blinding vehicles (p = 0.512).
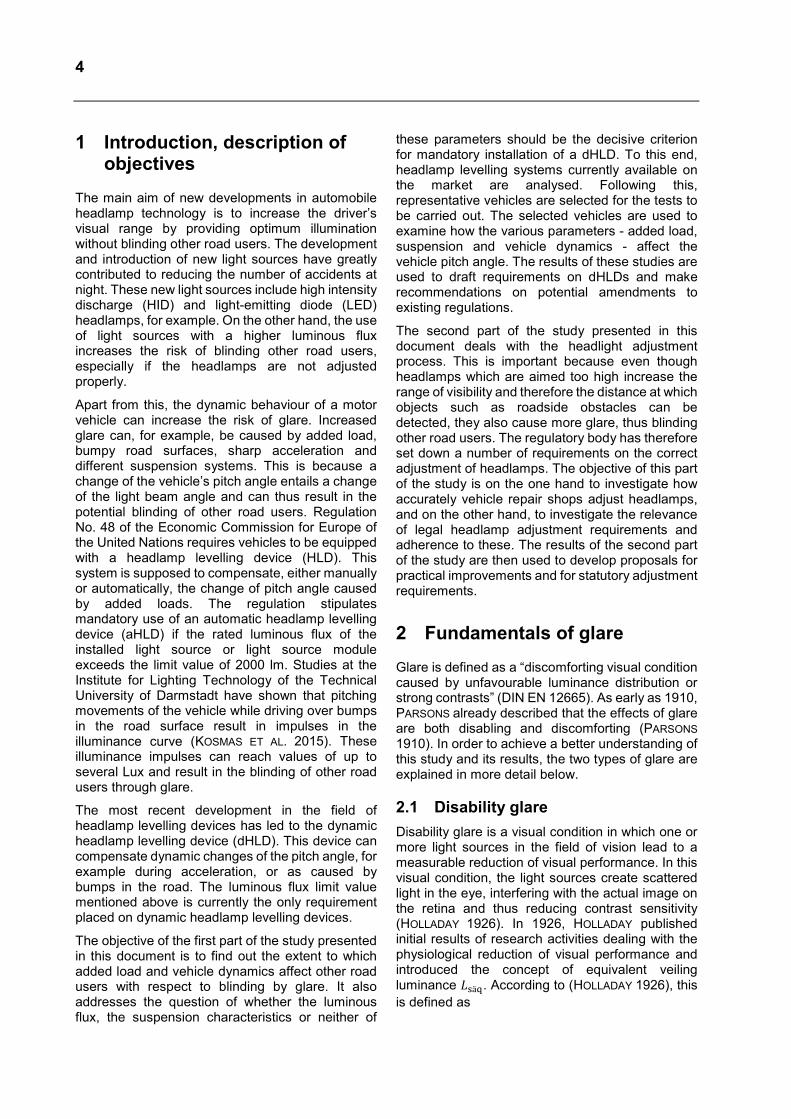
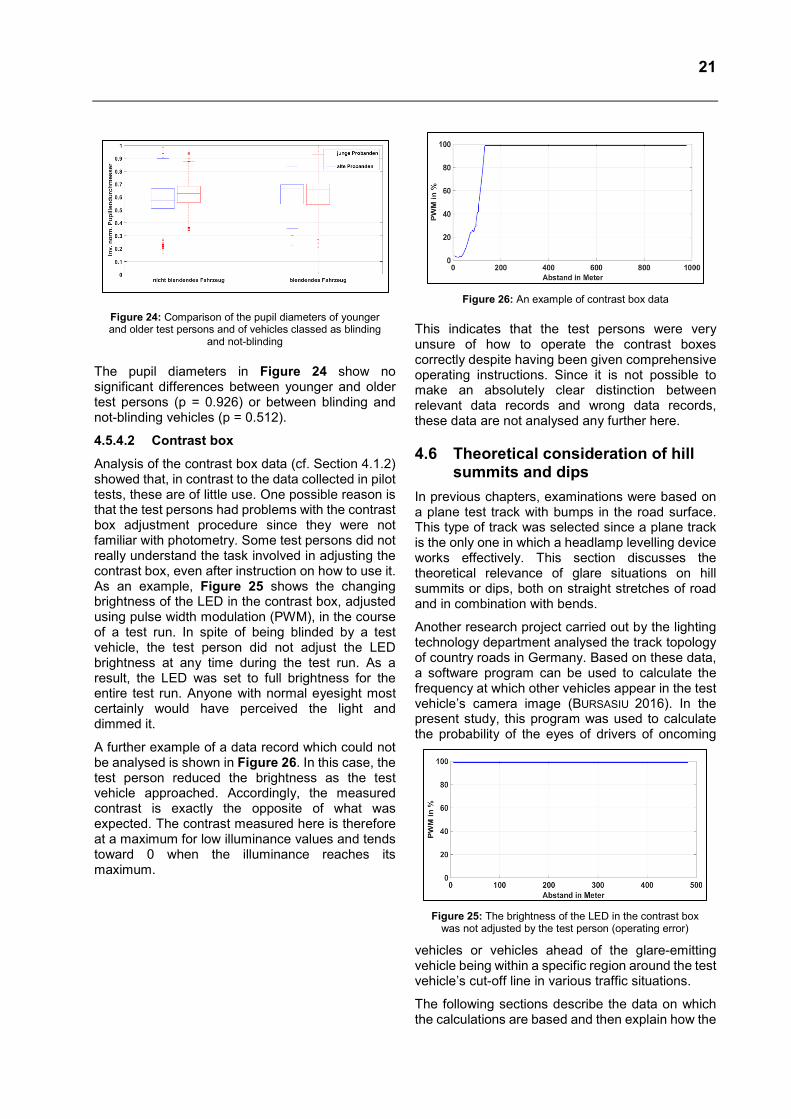
4.5.4.2 Contrast box Analysis of the contrast box data (cf. Section 4.1.2) showed that, in contrast to the data collected in pilot tests, these are of little use. One possible reason is that the test persons had problems with the contrast box adjustment procedure since they were not familiar with photometry. Some test persons did not really understand the task involved in adjusting the contrast box, even after instruction on how to use it. As an example, Figure 25 shows the changing brightness of the LED in the contrast box, adjusted using pulse width modulation (PWM), in the course of a test run. In spite of being blinded by a test vehicle, the test person did not adjust the LED brightness at any time during the test run. As a result, the LED was set to full brightness for the entire test run. Anyone with normal eyesight most certainly would have perceived the light and dimmed it.
A further example of a data record which could not be analysed is shown in Figure 26. In this case, the test person reduced the brightness as the test vehicle approached. Accordingly, the measured contrast is exactly the opposite of what was expected. The contrast measured here is therefore at a maximum for low illuminance values and tends toward 0 when the illuminance reaches its maximum.
Figure 26: An example of contrast box data
This indicates that the test persons were very unsure of how to operate the contrast boxes correctly despite having been given comprehensive operating instructions. Since it is not possible to make an absolutely clear distinction between relevant data records and wrong data records, these data are not analysed any further here.
4.6 Theoretical consideration of hill summits and dips
In previous chapters, examinations were based on a plane test track with bumps in the road surface. This type of track was selected since a plane track is the only one in which a headlamp levelling device works effectively. This section discusses the theoretical relevance of glare situations on hill summits or dips, both on straight stretches of road and in combination with bends.
Another research project carried out by the lighting technology department analysed the track topology of country roads in Germany. Based on these data, a software program can be used to calculate the frequency at which other vehicles appear in the test vehicle’s camera image (BURSASIU 2016). In the present study, this program was used to calculate the probability of the eyes of drivers of oncoming
vehicles or vehicles ahead of the glare-emitting vehicle being within a specific region around the test vehicle’s cut-off line in various traffic situations.
The following sections describe the data on which the calculations are based and then explain how the
Figure 25: The brightness of the LED in the contrast box
was not adjusted by the test person (operating error)

22
program works. Finally, the results are discussed with regard to possible benefits of dHLDs.
4.6.1 Underlying statistical data The data for the statistical assessment of the road topology of German country roads were taken from the following scientific papers:
(DAMASKY 1995) (SCHWAB 2003) (TOTZAUER 2008) (AUSTERSCHULTE ET AL. 2013) (HUMMEL 2009)
These data were used to create a model of German country roads. The model is based on single-lane roads with an average lane width of 3.42 m. Figure 27 shows the frequency of appearance of vehicles travelling ahead and of oncoming vehicles, as well as of bends, summits and dips, all calculated from this model.
Figure 27: Frequency of appearance of other vehicles in bends, on summits and in dips (excluding flat stretches) as a
percentage
The frequency on flat stretches is not included here. The high frequency in the left-hand section of the image clearly shows that right-hand traffic was being simulated. Each simulated oncoming vehicle passes the “test vehicle” on the left, irrespective of whether a left-hand bend or right-hand bend was being simulated. In this total accumulated approach, the frequency of appearance is highest at the centre of the camera image.
4.6.2 Functions of the applied analysis program
The frequency of appearance shown in Figure 27 is used as a basis for calculating the theoretical position of the eyes of the drivers of the vehicles involved in each case. As an example, the graphs of the eye positions of the drivers of oncoming vehicles in various dips with different radii of curvature are shown in Figure 27.
Figure 28: Eye positions of drivers in oncoming vehicles in
dips with different radii of curvature, expressed in degrees
This diagram also includes two horizontal lines at + 1.15° and - 2.29° (reference: - 0.57° = tilted headlamp). These indicate the area around the test vehicle’s cut-off line, corresponding to the maximum change in pitch of a test vehicle, as previously determined (Opel Insignia, cf. Section 4.5.1). The time proportion during which the eyes of other road users are exposed to this area is calculated for all cases under consideration. Table 4 shows the time proportions for all individual topology situations.
Table 4: Time proportions of the individual situations
Topology situation Time proportion, in %
Straight summits 52.7 Straight dips 80.7 Left-hand bend with summits 42.8 Left-hand bend with dips 42.8 Right-hand bend with summits 70.2 Right-hand bend with dips 70.1 All cases weighted (without flat stretches)
58.0
In overall road traffic (including flat stretches)
34.8
During the proportional time periods shown above, the eyes of other road users are within the range of ± 1.72° around the cut-off line (reference: 0° = untilted headlamp). All data shown here apply to headlamps with an installation height of 0.8 m. As shown in this table, the time proportion in which the eyes of other road users are within the respective range around the cut-off line in all situations involving dips or summits is 58 % and therefore very high. Even if all road traffic, including traffic on flat stretches, is taken into consideration, this percentage is still very high at almost 35 %. Hence, it must be concluded that in these situations, by controlling the headlamp pitch angle one could definitely prevent other road users from being blinded. Due to the dHLD’s principle of operation as described in Section 3.1, it has not been possible to verify these theoretical considerations in practical tests. Sensors measure the distance between the vehicle body and the axles, and thus between the vehicle and the road. These data are converted to

23
calculate the change in angle used to correct the headlamp’s pitch. The distance does not change if a vehicle approaches a dip or hill summit. A dHLD which is able to react in these situations would have to be camera-based. It must be able to determine the position of other road users in real-time and adjust the light distribution of the headlamps accordingly. This type of system, known as “headlamp range control”, is already being used in some vehicles. However, an analysis of such camera-based systems with the definition of requirements for an appropriate control system requires further examinations and was not included in the scope of this project.
5 WP 3: Drafting of requirements for dynamic headlamp levelling devices and corresponding lighting systems with regard to traffic safety
In this chapter, the essential results of work package 2 (cf. Section 4) are summed up as a basis for drafting requirements for dHLDs in order to prevent glare.
The results of field tests showed that very large pitch angles occur when a vehicle with a soft suspension accelerates (cf. Table 1). The illuminance values caused by these pitch angles constitute a potential risk of blinding the occupants of vehicles travelling ahead and of oncoming vehicles. Adding loads further increases the measured pitch angles (cf. Figure 19). Hard suspensions (cf. Table 1) are not able to compensate for bumps in the road surface (cf. Figure 11). Vehicles with hard suspensions show continuous quick and short pitch angle changes (cf. Figure 16), creating a great number of light maxima which could not be measured by the illuminance measurement head but which can result in increased discomfort glare (cf. Section 4.5). Medium-hard suspensions such as are fitted in the Audi A3 are capable of compensating road surface bumps. However, as in the Opel Insignia, they can also result in large pitch angles which in turn lead to glare (cf. Figure 11). With regard to the Insignia used in the test, this fact might be attributable to the age of the vehicle (manufactured in 2010) and therefore also to the age of the suspension. With activated dHLD, the test persons significantly less frequently perceived the tested vehicles’ headlamps as being blinding (cf. Table 3). However, adding loads affects vehicle dynamics (cf. Figure 19, Table 3), potentially resulting in more glare. A comparison of the DE BOER ratings assigned by test persons in
measuring vehicle ID1 (cf. Figure 7) with the data from measuring vehicle ID3 shows the following trend (measuring vehicle ID1 was furthest from the acceleration section of the test vehicle and measuring ID3 was nearest to it): the assessment of glare (median) is slightly higher in measuring vehicle ID3. However, the significance test applied to the data showed no difference (cf. Annex 10.4). To summarise, one can say that a short latency of the dHLD can compensate dynamic vehicle movements and thus decrease potential blinding of other road users due to glare (cf. Figure 22).
5.1.1.1 Requirements for dHLDs In dynamic traffic, glare is always a result of the complex interaction of several factors. These include the static stiffness of the suspension, the vehicle loads, the luminous flux of the light sources and headlamps and the light distribution. These factors are not the only decisive factors, however.
In conclusion the following can be said so far: in order to achieve the goal of reducing glare caused by vehicle's pitch motions it would be essential to introduce mandatory use of dHLD in all vehicles. With a DE BOER rating of > 6, vehicles with weak headlamps (e. g. the tested Peugeot 208) or with suitable suspensions (e. g. the Audi A3) caused almost satisfactory discomfort glare values, even without a dHLD (cf. Figure 22). However, when the data of these vehicles are compared to the remaining data (other combinations of headlamps and suspensions as well as loading states), they are found to constitute an exception. The mere introduction of mandatory dHLD is not sufficient to systematically reduce glare. The tests carried out show that the reaction time (short latency) is a decisive factor for effective dHLD operation. The study has demonstrated that the system's latency should be less than 220 ms in order to achieve a near-satisfactory glare value (DE BOER rating > 6). However, a less conservative consideration of glare at the just acceptable glare level (DE BOER rating > 5) would allow the permissible system latency to be raised to 350 ms (cf. Figure 22). It should be pointed out that this latency value should not be exceeded even when the vehicle is fully laden. However, the latency of the tested vehicles was clearly higher when laden than when empty (cf. Figure 21). In summary, the following requirements can be defined:
Mandatory use of dHLDs in all vehicles, irrespective of suspension and limit values for luminous flux
An average overall system latency of less than 220 ms for a DE BOER rating of > 6 (cf. Figure 22)

24
Testing of system latencies under near real-life conditions in order to take real suspension characteristics into account
Adherence to the latency even with maximum vehicle loads
6 WP 4: Investigation of the adjustment process for headlamp beams, including adaptive lighting systems and daytime running lamps
This work package examines the headlamp alignment process used in workshops. In this context, there are two relevant fields which have to be taken into account. Firstly, the instruments used and processes applied are important for the alignment. Secondly, the requirements placed on the alignment process and the conditions under which this takes place also have to be taken into consideration. These aspects are discussed in the following sections 6.2 and 6.3.
6.1 Basic principles Vehicle headlamps are initially set to their target position by the vehicle manufacturer at the end of the vehicle production process. Manufacturers use semi-automatic or fully-automated headlamp beam setters. “In combination with a chassis geometry test bench, the headlamps are aligned on the basis of the chassis geometry data […], whereby analysis and adjustment of the headlamp beam setting are camera-based.” (Dürr AG 2017)
Figure 29 shows a system of the type used by vehicle manufacturers to align headlamps at the end of the production process. Throughout the entire service life of a vehicle, the headlamp settings are inspected as part of periodic technical vehicle inspections carried out on average every two years. These main inspections (Haupt-untersuchung, HU) are required by § 29 of the German Road Vehicles Registration and Licensing Regulations (StVZO). Specialist workshops can also carry out the inspections during a regular servicing session or on the basis of voluntary participation in free annual campaigns such as the “Licht-Test” (light tests) (ZDK 2017).
Figure 29: Headlamp adjustment system made by Dürr for
testing and adjusting headlamps at the end of the production line (Dürr AG 2019)
Vehicle repair shops and vehichle inspection agencies which carry out main inspections both use headlamp beam setters (HBS) to test headlamp settings. A headlamp beam setter of this kind is shown in Figure 30.
Figure 30: HBS by Hella
These beam setters have a Fresnel lens which concentrates the beam of the headlamp and projects it onto either an integrated test screen (analogue HBS) or a CMOS camera (digital HBS). In the camera-based version, the setting is determined by means of appropriate image processing algorithms. Following this procedure, the beam setter indicates whether and how the headlamps have to be adjusted (cf. Figure 31). In the analogue HBS version, the projection screen has special markings which serve as reference marks for beam adjustment.
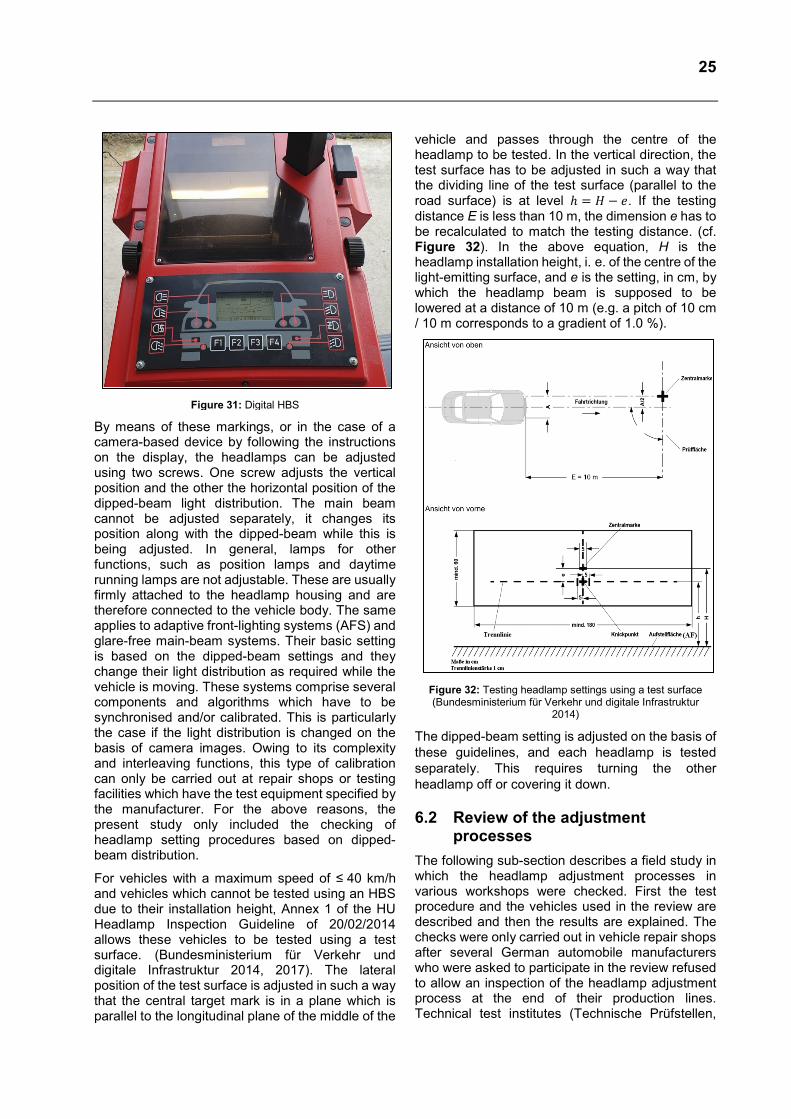
25
Figure 31: Digital HBS
By means of these markings, or in the case of a camera-based device by following the instructions on the display, the headlamps can be adjusted using two screws. One screw adjusts the vertical position and the other the horizontal position of the dipped-beam light distribution. The main beam cannot be adjusted separately, it changes its position along with the dipped-beam while this is being adjusted. In general, lamps for other functions, such as position lamps and daytime running lamps are not adjustable. These are usually firmly attached to the headlamp housing and are therefore connected to the vehicle body. The same applies to adaptive front-lighting systems (AFS) and glare-free main-beam systems. Their basic setting is based on the dipped-beam settings and they change their light distribution as required while the vehicle is moving. These systems comprise several components and algorithms which have to be synchronised and/or calibrated. This is particularly the case if the light distribution is changed on the basis of camera images. Owing to its complexity and interleaving functions, this type of calibration can only be carried out at repair shops or testing facilities which have the test equipment specified by the manufacturer. For the above reasons, the present study only included the checking of headlamp setting procedures based on dipped-beam distribution.
For vehicles with a maximum speed of ≤ 40 km/h and vehicles which cannot be tested using an HBS due to their installation height, Annex 1 of the HU Headlamp Inspection Guideline of 20/02/2014 allows these vehicles to be tested using a test surface. (Bundesministerium für Verkehr und digitale Infrastruktur 2014, 2017). The lateral position of the test surface is adjusted in such a way that the central target mark is in a plane which is parallel to the longitudinal plane of the middle of the
vehicle and passes through the centre of the headlamp to be tested. In the vertical direction, the test surface has to be adjusted in such a way that the dividing line of the test surface (parallel to the road surface) is at level ℎ = 𝐻𝐻 − 𝑒𝑒. If the testing distance E is less than 10 m, the dimension e has to be recalculated to match the testing distance. (cf. Figure 32). In the above equation, H is the headlamp installation height, i. e. of the centre of the light-emitting surface, and e is the setting, in cm, by which the headlamp beam is supposed to be lowered at a distance of 10 m (e.g. a pitch of 10 cm / 10 m corresponds to a gradient of 1.0 %).
Figure 32: Testing headlamp settings using a test surface (Bundesministerium für Verkehr und digitale Infrastruktur
2014)
The dipped-beam setting is adjusted on the basis of these guidelines, and each headlamp is tested separately. This requires turning the other headlamp off or covering it down.
6.2 Review of the adjustment processes
The following sub-section describes a field study in which the headlamp adjustment processes in various workshops were checked. First the test procedure and the vehicles used in the review are described and then the results are explained. The checks were only carried out in vehicle repair shops after several German automobile manufacturers who were asked to participate in the review refused to allow an inspection of the headlamp adjustment process at the end of their production lines. Technical test institutes (Technische Prüfstellen,

26
TP) and state-approved technical inspection bodies were deliberately excluded from the review because they merely test headlamp settings and do not adjust them.
6.2.1.1 Test procedure and vehicles used To investigate the headlamp adjustment processes, tungsten-halogen and high-intensity discharge headlamps of two production vehicles were deliberately misaligned by a defined value, both in a vertical and horizontal direction. The vertical and horizontal headlamp positions were each misaligned and adjusted separately. The two vehicles were then taken to ten selected vehicle repair shops which were requested to inspect and, if necessary, adjust the headlamps. It was assumed that the repair shops would test and adjust the headlamps in line with the tolerances specified by German law. After collecting the vehicles from the repair shop, the headlamp settings were tested a second time. In order to check the settings, the headlamps were tested using the test surface method shown in Figure 32 using a laser level so that any vehicle pitch due to irregularities in the ground surface could be taken into consideration as well. To do this, the distance between the road contact face of the tyres and the levelling laser as well as the vehicle's pitch angle relative to the horizontal were measured and taken into account when the target pitch of the headlamp was calculated. The 10m specified in Figure 32 (view from above) was the distance between headlamp and test surface.
6.2.1.2 Results Evaluation of the results showed no significant difference between tungsten halogen and high-intensity discharge headlamps, neither horizontally nor vertically. For this reason, both groups are evaluated together. The box plots of the data are shown in Annex 10.7.
The headlamp adjustments made in the various repair shops differed considerably. In the following section, first the vertical adjustments made by the workshops are analysed, followed by an analysis of the horizontal adjustments. The red solid lines in the diagrams represent the tolerances specified by the HU Headlamp Testing Standard (HU-Scheinwerferprüfrichtlinie) (Bundesministerium für Verkehr und digitale Infrastruktur 2014).
Figure 33 shows the results of the vertical headlamp adjustments made by the repair shops. The diagram shows the absolute values of the defined misalignment prior to visiting the repair shop and the adjustments made by the repair shops to both the left-hand and right-hand headlamps. The red horizontal lines represent the adjustment
tolerances, a vertical pitch of 0 % (setting gauge e = 0) being the target value. The x-coordinate represents the tested repair shops and the y-coordinate shows the vertical adjustments made by these repair shops.
Figure 33: Vertical headlamp adjustment by repair shops
Only three repair shops adjusted the headlamps within the specified tolerance of ± 0.5 %. Two repair shops failed to adjust at least one headlamp vertically and six repair shops did not set the headlamps parallel to one another. Two repair shops actually misaligned headlamps which originally were adjusted correctly. On average, the headlamps were adjusted too low by -1.25 %, resulting in a significantly reduced range of vision.
The lower the headlamp’s pitch, the lower the range of illumination and thus the narrower the driver’s range of vision. Headlamps adjusted too high increase the range of vision but also lead to much higher glare.
For an average headlamp installation height of 60 cm, the theoretical range of illumination is approximately 25 m (mean vertical adjustment of -1.25 %). This illumination range corresponds to the braking distance at a speed of around 50 km/h, and therefore poses a significant accident risk on country roads and motorways, where vehicles drive at much higher speeds.
Figure 34 shows the horizontal adjustments carried out by repair shops. These are also subdivided into left-hand and right-hand headlamps, misalignment by a defined value prior to visiting the repair shop and adjustments made by the repair shop. The red vertical lines represent the adjustment tolerances. For reasons of clarity, the horizontal angle is plotted on the x-coordinate and the tested repair shops on the y-coordinate. Three repair shops adjusted the horizontal aim of at least one headlamp within the adjustment tolerance of ± 0.5 %. However, none of the repair shops adjusted the headlamps parallel to one another.
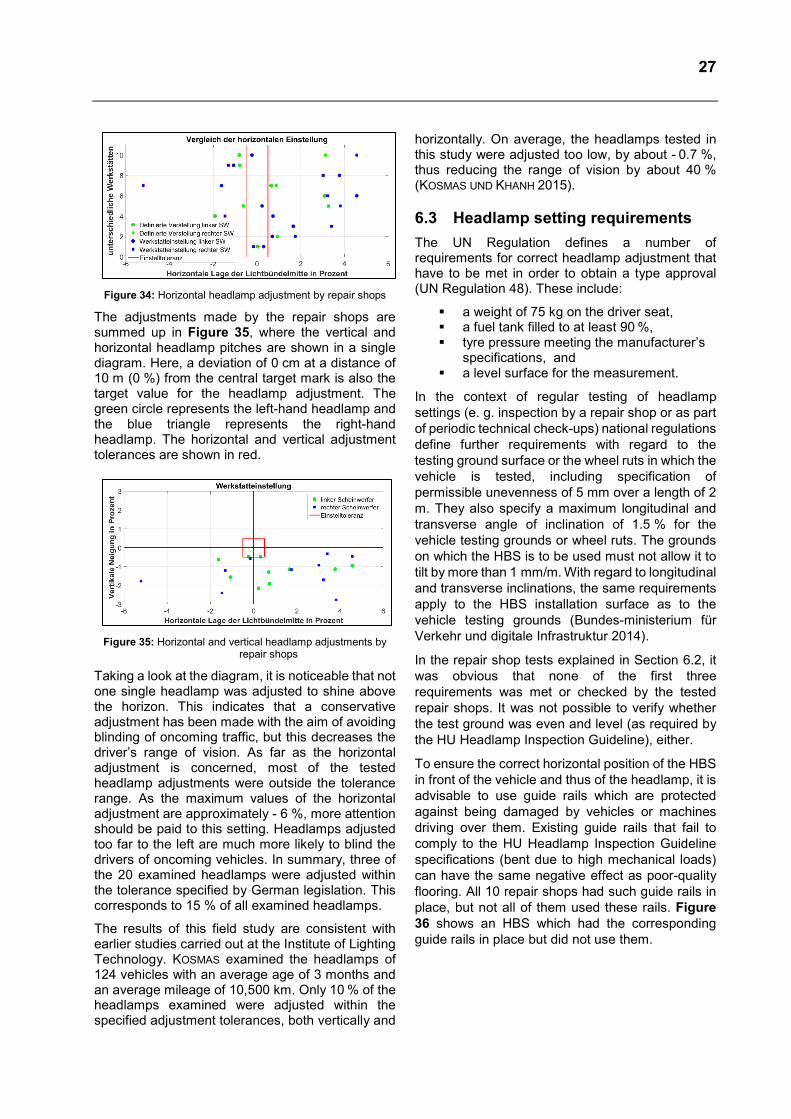
27
Figure 34: Horizontal headlamp adjustment by repair shops
The adjustments made by the repair shops are summed up in Figure 35, where the vertical and horizontal headlamp pitches are shown in a single diagram. Here, a deviation of 0 cm at a distance of 10 m (0 %) from the central target mark is also the target value for the headlamp adjustment. The green circle represents the left-hand headlamp and the blue triangle represents the right-hand headlamp. The horizontal and vertical adjustment tolerances are shown in red.
Figure 35: Horizontal and vertical headlamp adjustments by
repair shops
Taking a look at the diagram, it is noticeable that not one single headlamp was adjusted to shine above the horizon. This indicates that a conservative adjustment has been made with the aim of avoiding blinding of oncoming traffic, but this decreases the driver’s range of vision. As far as the horizontal adjustment is concerned, most of the tested headlamp adjustments were outside the tolerance range. As the maximum values of the horizontal adjustment are approximately - 6 %, more attention should be paid to this setting. Headlamps adjusted too far to the left are much more likely to blind the drivers of oncoming vehicles. In summary, three of the 20 examined headlamps were adjusted within the tolerance specified by German legislation. This corresponds to 15 % of all examined headlamps.
The results of this field study are consistent with earlier studies carried out at the Institute of Lighting Technology. KOSMAS examined the headlamps of 124 vehicles with an average age of 3 months and an average mileage of 10,500 km. Only 10 % of the headlamps examined were adjusted within the specified adjustment tolerances, both vertically and
horizontally. On average, the headlamps tested in this study were adjusted too low, by about - 0.7 %, thus reducing the range of vision by about 40 % (KOSMAS UND KHANH 2015).
6.3 Headlamp setting requirements The UN Regulation defines a number of requirements for correct headlamp adjustment that have to be met in order to obtain a type approval (UN Regulation 48). These include:
a weight of 75 kg on the driver seat, a fuel tank filled to at least 90 %, tyre pressure meeting the manufacturer’s
specifications, and a level surface for the measurement.
In the context of regular testing of headlamp settings (e. g. inspection by a repair shop or as part of periodic technical check-ups) national regulations define further requirements with regard to the testing ground surface or the wheel ruts in which the vehicle is tested, including specification of permissible unevenness of 5 mm over a length of 2 m. They also specify a maximum longitudinal and transverse angle of inclination of 1.5 % for the vehicle testing grounds or wheel ruts. The grounds on which the HBS is to be used must not allow it to tilt by more than 1 mm/m. With regard to longitudinal and transverse inclinations, the same requirements apply to the HBS installation surface as to the vehicle testing grounds (Bundes-ministerium für Verkehr und digitale Infrastruktur 2014).
In the repair shop tests explained in Section 6.2, it was obvious that none of the first three requirements was met or checked by the tested repair shops. It was not possible to verify whether the test ground was even and level (as required by the HU Headlamp Inspection Guideline), either.
To ensure the correct horizontal position of the HBS in front of the vehicle and thus of the headlamp, it is advisable to use guide rails which are protected against being damaged by vehicles or machines driving over them. Existing guide rails that fail to comply to the HU Headlamp Inspection Guideline specifications (bent due to high mechanical loads) can have the same negative effect as poor-quality flooring. All 10 repair shops had such guide rails in place, but not all of them used these rails. Figure 36 shows an HBS which had the corresponding guide rails in place but did not use them.

28
Figure 36: HBS with guide rails which are not being used
In another repair shop that was checked, the headlamp was adjusted while the vehicle was hoisted on a car lift. The car lift used was a “twin-ram lift” with four support arms which lift the vehicle by the chassis. The use of such car lifts when adjusting headlamps would require the pitch of the chassis to be exactly equal to the pitch the vehicle would have when standing on its tyres. This method is completely unsuitable for correct headlamp adjustment. Furthermore, in the course of the repair shop review, it was noted that headlamp adjustments were carried out by apprentices in most cases. This might explain why the essential requirements for correct headlamp adjustment were not fulfilled.
6.3.1.1 Effect on adjustment accuracy The following section takes a closer look at the influence of the said requirements on headlamp adjustment accuracy To do this, 15 cars of various vehicle classes were examined at a car rental company. A vehicle without additional load and the present fuel-tank filling level was defined as the reference in each case. Starting with a vehicle in this condition, the effect of the three parameters: driver’s weight, fuel-tank filling level and tyre pressure was examined. The front and rear distances between the chassis and a laser line emitted by a laser level were measured in order to identify any related pitch changes. To measure the pitch changes, this procedure was applied to both sides of the vehicle after each change of condition. Figure 37 shows a box plot of the results for driver’s weight and fuel-tank filling level.
Figure 37: Influence of the driver’s weight and the fuel tank
filling level on the vehicle's pitch
“Driver on driver seat” refers to the change of vehicle pitch that results when a driver is seated in the vehicle. “Fuel-tank filling level” refers to the difference between the pitch of a vehicle with an empty tank and the same vehicle with a full tank. This behaviour was simulated by placing an equivalent load into the vehicle. The condition “driver on driver seat” caused the vehicle to pitch by – 0.1 % on average. One vehicle showed a comparatively extreme change in pitch of – 0.6 %. This vehicle had a very soft suspension. It can be seen that the condition “fuel-tank filling level” has a significant effect on the vehicle's pitch. With a full tank, the chassis pitches on average by about 0.75 % in relation to the same vehicle with an empty tank. Therefore correct adjustment of the headlamp is not possible unless attention is paid to the correct fuel-tank filling level. This also shows why all vehicles should be equipped with an aHLD to compensate for fuel added to the tank or other loads carried in the vehicle.
With regard to the parameter “tyre pressure”, a 1% change in pitch only occurred in the extreme case that both tyres on one axle were completely flat. Admittedly, this is an extreme case in which the vehicle is no longer roadworthy.
7 WP 5: Reviewing the existing regulations and, if necessary, compiling a draft amendment to international construction and operation regulations
This work package provides an overview of the UN Regulation and the regulations set down by the German Road Vehicles Registration and Licensing Regulations (StVZO) which are relevant for HLDs. The findings of WP 3 and WP 4 are listed here to assist in drafting a proposal for a new regulation or an amendment to existing regulations.

29
7.1 Regulations and standards Technical and lighting-technology-related requirements for vehicle headlamps are laid down in the UN Regulation. Among other things, this regulation specifies rules for the lamps used in headlamps, the headlamp settings and the light distribution. The UN Regulation is currently accepted and applicable in Germany and 56 other countries (UN Regulation 2017)
UN Regulation No. 48 specifies uniform requirements for the installation of lighting and light-signalling devices necessary for the approval of specific vehicles (vehicle classes M, N and O). This regulation also governs the use of HLDs for dipped-beam headlamps. It stipulates that an HLD shall be used for all vehicles first registered after 01/01/1990. Here, care should be taken that the vertical pitch of the cut-off line is within a specified range for defined loading conditions. For example, for a headlamp installation height of less than 80 cm, a range of - 0.5 % to - 2.5 % is specified. As explained in Section 3.1, the control range of the aHLD depends on the added load and ranges from “driver on driver seat alone” to “all seats occupied and trunk loaded to maximum axle load”. Adding load to the vehicle moves the cut-off line upwards and results in a higher risk of glare. The HLD is supposed to compensate this behaviour and, as mentioned above, operates within a specified angle range, depending on the headlamp installation height. For “dipped-beam headlamps with a rated luminous flux exceeding 2000 lumen, […] a headlamp levelling device is required and the device shall be automatic”. The StVZO of 2016 demands the use of an aHLD for “vehicles with main-beam and dipped-beam headlamps fitted with high-intensity discharge bulbs.” Neither the UN Regulation nor the StVZO currently includes any additional rules regarding the use of an aHLD. dHLDs are not mentioned in any current standards.
UN Regulation No. 48 also includes requirements to be observed for the correct adjustment of vehicle headlamps. As already mentioned in Section 6.3, these are as follows:
• 75 kg on the driver seat, • fuel tank filled to at least 90 %, • tyre pressure meeting the manufacturer’s
specifications, and • flat, even surface of the measuring
grounds.
In the following section, these headlamp setting requirements and the regulations regarding HLDs are compared with the results of the present study.
7.2 Comparison of legal require-ments with the findings of WP 3 and WP 4
7.2.1.1 Criteria for the use of an aHLD/dHLD In summary, it can be established that in Germany the (mandatory) use of aHLDs is currently bound to three main criteria. No dHLDs or additional requirements regarding the use of dHLDs have been explicitly specified up to now. These three criteria for the use of an aHLD and therefore also for the use of a dHLD (pursuant to the StVZO) are:
control range (angle) of the HLD based on static maximum added load (UN Regulation No. 48),
use of high-intensity discharge lamps for main beam and dipped-beam (StVZO),
use of light sources/LED modules with a rated luminous flux of >2000 lm in the principal dipped beam (UN Regulation No. 48).
Depending on the headlamp installation height, the HLD has to be able to adjust the cut-off line within a vertical range of - 0.5 % to - 2.5 %. In degrees, this corresponds to a range between - 0.29° and -1.49°. A value of - 0.57° corresponds to a possible basic headlamp setting for a specified pitch angle of - 1 %, based on the projection of the headlamp’s optical axis.
In vehicles with a headlamp installation height greater than 1 m and vehicle class N3G vehicles (off-road vehicles with a headlamp installation height of >1.2 m), the headlamps have to be adjustable within a range of -1% to -3% (or between -1.5% and -3.5%, respectively). Since only cars with a headlamp installation height of less than 1m were examined here, reference is made to the control range for these cars. Vehicles with higher headlamp installation heights are assumed to have a different suspension and therefore a different pitch behaviour. This is why no statements can be made regarding such vehicles.
WP 3 has verified that the largest vehicle pitch angles occur during acceleration. Maximum vehicle pitches of approximately 1.6° were measured in the Peugeot 208 with added load. A dHLD would not be able to compensate this maximum vehicle pitch. However, a dHLD could adjust the position of the headlamp’s pitch so far that the pitch angle stays within the adjustment tolerance and thus reduces potential glare.
The results of the present study do not support the second and third requirement, which link the use of an aHLD to the type of lamp and luminous flux. The study has shown that a tested vehicle with tungsten

30
halogen headlamps affects the oncoming traffic with illuminances of a similar level to those of vehicles with high-intensity discharge headlamps and deactivated dHLD. A dHLD would prevent or at least significantly reduce the resulting glare. Therefore the use of a dHLD is recommended for all vehicles, irrespective of the type of lamp installed. In addition to the requirements mentioned in WP 3, the dHLD’s control range should also be based on the maximum added load.
7.2.1.2 Headlamp setting criteria A driver weighing 75 kg on the driver seat causes only slight changes in the vehicle pitch (cf. Figure 37). Therefore this does not seem to be a decisive requirement for the headlamp setting procedure.
By contrast, the correct fuel-tank filling level and the correct tyre pressure have proven to be factors which significantly affect the vehicle's pitch. Neglecting these criteria in order to simplify matters would result in incorrect headlamp settings.
The repair shop tests have shown that the technical competency of repair shop personnel is an important criterion which has not been taken into account sufficiently up to now. If the required qualifications and awareness of the legal adjustment procedure requirements are lacking here, unsatisfactory results are inevitable. Regular qualification of personnel and strict adherence to specified setting requirements appear to be indispensable. In particular the positioning and alignment of the HBS and the condition of the existing ground surfaces on which measurements are performed offer considerable scope for errors. The headlamp adjustment procedure needs to be given the necessary priority.
8 Conclusion The present study has shown that the use of a dHLD with an aim to preventing or at least reducing glare appears to be useful and advisable for all vehicle classes. In view of the data at hand, linking of the mandatory use of an aHLD to a luminous flux exceeding 2000 lm is not recommendable. Furthermore, the results of the present study show that the following fundamental requirements should be introduced in order to minimise glare caused by vehicle headlamps:
• dHLDs for all headlamp systems • linking of the control range (angles) of the
dHLDs to the pitch of vehicles with maximum added load
• a mean overall system latency of less than 220 ms, with and without added load, for a
DE BOER rating of 6, and of less than 350 ms for a DE BOER rating of 6 (just acceptable glare - cf. Section 4.5.2)
The present results show that glare can only be completely and comprehensively prevented if dHLDs are used without exception. Furthermore, it was shown that in each tested vehicle, changing the load status had a direct effect both on the vehicle dynamics and on the control efficiency of the dHLD. Therefore, in practice, the dHLDs of all vehicles, both without loads as well as when fully laden, should achieve the specified latencies.
The headlamp adjustment process is already governed by statutory requirements (Bundes-ministerium für Verkehr und digitale Infrastruktur 2014). However, the existing provisions are rarely implemented in practice due to the frequent and obvious lack of qualification of repair shop personnel. The basic requirements for correct adjustment of headlamps are:
• 75 kg on the driver seat, • a fuel tank filling level of at least 90 %, • a tyre pressure meeting the manufacturer’s
specifications, • a flat, level measuring ground surface,
both for the HBS and for the vehicle, • HBS aligned parallel to the vehicle.
The present study shows that only the driver’s weight can be neglected without significantly reducing the quality of headlamp adjustment in order to facilitate tests. All other requirements have to met in order to adjust headlamps within the statutory tolerance limits.

31
9 Bibliography AUSTERSCHULTE, ARMIN; DREIER, BERND;
ROSENHAHN, ERNST-OLAF (2013): Analysis of Safety Aspects for LED Matrix High Beam Functions. In: Tran Quoc Khanh (Hg.): Proceedings of the 10th International Symposium on Automotive Lighting (ISAL). International Symposium on Automotive Lighting (ISAL). Darmstadt, 23 -25 September 2013. Technical University Darmstadt. Munich: Herbert Utz Verlag GmbH (Darmstädter Lichttechnik, 15), 330–339.
BÖDEKER, KATJA (2006): Die Entwicklung intuitiven physikalischen Denkens im Kulturvergleich. Münster, Munich [et.al.]: Waxmann (Internationale Hochschulschriften, 464).
BORTZ, JÜRGEN (2005): Statistik für Human- und Sozialwissenschaftler. With 242 tables. 6th fully revised and edition. Berlin, Heidelberg, New York: Springer, last reviewed on 15/08/2014.
BORTZ, JÜRGEN; SCHUSTER, CHRISTOF (2010): Statistik für Human- und Sozialwissenschaftler. With … 163 tables. 7th edition Berlin [et.al.]: Springer.
Bundesministerium für Verkehr und digitale Infrastruktur (2014): Verkehrsblatt - Amtsblatt des Bundesministeriums für Verkehr und digitale Infrastruktur der Bundesrepublik Deutschland. Richtlinie für die Überprüfung der Einstellung der Scheinwerfer von Kraftfahrzeugen bei der Hauptuntersuchung nach § 29 StVZO (HU-Scheinwerfer-Prüfrichtlinie) (5) (LA 20/7345.2/80-4), 174–183. Available online at https://www.werkstattspezi.de/mediafiles/Sonstiges/Sherpa/SEP/05-Verkehrsblatt-05-2014.pdf.
Bundesministerium für Verkehr und digitale Infrastruktur (2017): Verkehrsblatt - Amtsblatt des Bundesministeriums für Verkehr und digitale Infrastruktur der Bundesrepublik Deutschland. Bekanntmachung der Änderung der Richtlinie für die Überprüfung der Einstellung der Scheinwerfer von Kraftfahrzeugen bei der Hauptuntersuchung nach § 29 StVZO
(HU-Scheinwerfer-Prüfrichtlinie) (2) (LA 20/7345.2/80-4), 52–73. Available online at https://www.happy-trikes.de/fileadmin/user_upload/Verkehrsblatt_02-2017.pdf.
BURSASIU, DAN (2016): Optimierung von Pixelscheinwerfergrenzen auf Basis aktueller Verkehrs- und Straßendaten. Masterarbeit. Technical University Darmstadt, Darmstadt. Institute for Lighting Technology.
DAMASKY, JOACHIM (1995): Lichttechnische Entwicklung von Anforderungen an Kraftfahrzeugscheinwerfer. Dissertation. Technische Hochschule Darmstadt, Darmstadt. Institute for Lighting Technology.
DE BOER, J. B. (1967): Visual perception in road traffic and the field of vision of the motorist. In: J. B. de Boer (Hg.): Public Lighting. London: Cleaver-Hume (Philips Technical Library), 11–96.
DE BOER, J. B.; VAN HEEMSKERCK, VEECKENS J. F. T. (1955): Observations on discomfort glare in street lighting; influence of the colour of the light. CIE. Zurich.
Dürr AG (2017): Dürr Assembly Products. Vehicle Assembly and Testing. Available online at http://www.durr-ap.com/index.php?id=58&L=4%27, last updated on 09/01/2017.
FAHRMEIR, LUDWIG (2004): Statistik. Der Weg zur Datenanalyse. Berlin [et.al.]: Springer (Springer-Lehrbuch). Available online at http://download.springer.com/static/pdf/314/bok%253A978-3-540-69739-8.pdf?auth66=1423337866_c63bc066ee4ad7531e6ad73b05ab3e14&ext=.pdf.
FLANNAGAN, MICHAEL J.; SIVAK, MICHAEL; SCHOETTLE, BRANDON (2007): Benefits of headlamp leveling and cleaning for current U.S. low beams. Publ. by Transportation Research Institute (UMTRI) (UMTRI-2007-46). Available online at http://deepblue.lib.umich.edu/bitstream/handle/2027.42/58733/100247.pdf, last revised 10/06/2016.
HOLLADAY, L. L. (1926): The fundamentals of glare and visibility. In: J. Opt. Soc. Am. A. 12, 271–319.

32
HUHN, WOLFGANG (1999): Anforderungen an eine adaptive Lichtverteilung für Kraftfahrzeugscheinwerfer im Rahmen der ECE-Regelungen. Dissertation. Technical University Darmstadt, Darmstadt. Institute for Lighting Technology.
HUMMEL, BENJAMIN (2009): Matrix-Beam – an Adaptive Driving Beam System (ADB). In: Tran Quoc Khanh (Hg.): Proceedings of the 8th International Symposium on Automotive Lighting (ISAL). International Symposium on Automotive Lighting (ISAL). Darmstadt, 29 -30 September 2009. Technical University Darmstadt. Munich: Herbert Utz Verlag GmbH (Darmstädter Lichttechnik, 13), 297–306.
KASABA, YUSUKE (2015): An auto-leveling system using an acceleration sensor. In: Tran Quoc Khanh (publ.): Proceedings of the 11th International Symposium on Automotive Lighting (ISAL). International Symposium on Automotive Lighting (ISAL). Darmstadt, 28 -30 September 2015. Technical University Darmstadt. Munich: Herbert Utz Verlag GmbH (Darmstädter Lichttechnik, 16), 29–37.
KHANH, TRAN QUOC; SÖLLNER, STEFAN (2014): Lichttechnik I. Skript. TU Darmstadt, Darmstadt. Institute for Lighting Technology, last revised 01/12/2014.
KOSMAS, KYRIAKOS; KHANH, TRAN QUOC (2015): Field study of headlamp alignment for avoiding glare and reaching a maximal detection distance. In: CIES (Hg.): Proceedings of the 3rd International Forum on Automotive Lighting (IFAL). International Forum on Automotive Lighting (IFAL). Kunshan, 17-19 June 2015. China Illuminating Engineering Society (CIES).
KOSMAS, KYRIAKOS; POLIN, DMITRIJ; SCHILLER, CHRISTOPH; KOBBERT, JONAS; KHANH, TRAN QUOC (2015): Comparing the glare load of low beam, high beam andglare-free high beam under different traffic conditionson the road. In: Tran Quoc Khanh (publ.): Proceedings of the 11th International Symposium on Automotive Lighting (ISAL). International Symposium on Automotive Lighting (ISAL). Darmstadt, 28 -30 September 2015. Technical University Darmstadt.
Munich: Herbert Utz Verlag GmbH (Darmstädter Lichttechnik, 16), 229–237.
LEHNERT, PETER (2001a): Auswirkungen der Fahrzeugdynamik auf die Lichtverteilung von Scheinwerfern. Dissertation. Technical University Darmstadt, Darmstadt. Institute for Lighting Technology. Available online at https://books.google.de/books?id=sqUH39igX5YC.
LEHNERT, PETER (2001b): Disability and Discomfort Glare under dynamic Conditions. The Effect of Glare Stimuli on the Human Vision. In: Hans-Joachim Schmidt-Clausen (publ.): Proceedings of the Symposium Progress in Automobile Lighting. International Symposium on Progress in Automobile Lighting (PAL). Darmstadt, 25 -26 September 2001. Technical University Darmstadt. Munich: Utz Verlag GmbH (Darmstädter Lichttechnik, 8 & 9), 582–592.
LERMAN, SIDNEY (1980): Radiant energy and the eye. New York: Macmillan (Functional ophthamology).
DIN EN 12665, 2011: Light and lighting - Basic terms and criteria for specifying lighting requirements; German version EN 12665:2011
LOHNINGER, HANS (2017): Grundlagen der Statistik. z-Transformation. Available online at http://www.statistics4u.info/fundstat_germ/ee_ztransform.html, last revised 09/01/2017.
Mathworks (2017): Boxplot. Available online at https://de.mathworks.com/help/stats/boxplot.html?, last revised 09/01/2017.
PARSONS, J. HERBERT (1910): Glare, its causes and effects. In: The Lancet 175 (4508), 234–236. DOI: 10.1016/S0140-6736(01)14325-4.
PERSIKE, MALTE (2012): Mathematische und statistische Methoden II. Psychologisches Institut Johannes Gutenberg Universität Mainz. Available online at http://psymet03.sowi.uni-mainz.de/download/Lehre/SS2012/StatistikII/2012_05_29_VL.pdf, last revised 03/08/2017.
SCHENDERA, CHRISTIAN F. G (2007): Datenqualität mit SPSS. Ausreisser – Erkennen,

33
Interpretieren und Umgehen. Munich [et.al.]: Oldenbourg.
SCHMIDT-CLAUSEN, HANS-JOACHIM; BINDELS, JOHANNES TH. H. (1971): Die Schwellenleuchtdichteerhöhung als Blendungsbewertungskriterium. I. Untersuchungen über den Einfluß der Blendbeleuchtungsstärke und des Blendwinkels auf die Schwellenleuchtdichte. In: Lichttechnik 23 (10), 547–552.
SCHWAB, GABRIEL (2003): Untersuchungen zur Ansteuerung adaptiver Kraftfahrzeugscheinwerfer. Zugl.: Ilmenau, Techn. Univ., Diss., 2003. Osnabrück: Der Andere Verl. (Publication series of the Institute for lighting technology in Ilmenau, 5).
SPRUTE, JAN HOLGER (2012): Entwicklung lichttechnischer Kriterien zur Blendungsminimierung von adaptiven Fernlichtsystemen. Dissertation. Technical University Darmstadt, Darmstadt. Institute for Lighting Technology.
Statista (2017): Automodelle mit den meisten Neuzulassungen in Deutschland im Jahr 2016. Available online at https://de.statista.com/statistik/daten/studie/3149/umfrage/automodelle-mit-den-meisten-neuzulassungen-in-deutschland/, last revised 09/01/2017.
TOTZAUER, ALEXANDER (2008): Erarbeitung einer effizienten Fernlichtunterteilung. Studienarbeit. Technical University Darmstadt, Darmstadt. Institute for Lighting Technology.
UN Regulation No. 37, 10/06/2014: Uniform provisions concerning the approval of filament lamps for use in approved lamp units of power-driven vehicles and of their trailers.
UN Regulation No. 99, 10/06/2014: Uniform provisions concerning the approval of gas-discharge light sources for use in approved gas-discharge lamp units of power-driven vehicles.
UN Regulation No. 48, 30/09/2016: Uniform provisions concerning the approval of vehicles with regard to the installation of lighting and light-signalling devices [2016/1723].
UN Regulation (2017): Mission. Available online at www.unece.org/mission.
WÖRDENWEBER, BURKARD (2007): Automotive lighting and human vision. Berlin, New York: Springer. Available online at http://www.worldcat.org/oclc/185022114.
ZDK (2017): Licht-Test 2017. Published by Zentralverband Deutsches Kraftfahrzeuggewerbe e. V. Zentralverband Deutsches Kraftfahrzeuggewerbe e. V. Available online at http://www.licht-test.de/, last revised 23/04/2018.
ZYDEK, BASTIAN WALTER (2014): Blendungsbewertung von Kraftfahrzeugscheinwerfern unter dynamischen Bedingungen. Dissertation. Technical University Darmstadt, Darmstadt. Institute for Lighting Technology, last revised 04/08/2014.
ZYDEK, BASTIAN WALTER; HAFERKEMPER, NILS; KHANH, TRAN QUOC (2013): Klettwitz Levelling Test: Analysis of Photometric Data and Comprehension. In: Tran Quoc Khanh (publ.): Proceedings of the 10th International Symposium on Automotive Lighting (ISAL). International Symposium on Automotive Lighting (ISAL). Darmstadt, 23 -25 September 2013. Technical University Darmstadt. Munich: Herbert Utz Verlag GmbH (Darmstädter Lichttechnik, 15), 110–115.

34
10 Annex
10.1 Statistical tests “A statistical test is a rule allowing a choice to be made between a null hypothesis and the alternative hypothesis for each random sample testing result” (BORTZ UND SCHUSTER 2010). The objective of such tests is to decide whether the behaviour observed for the tested random sample is also true for an entire group of objects. The research hypothesis that is of interest is formulated as the statistical alternative hypothesis (in short: alternative, H1) about the corresponding parameter. This alternative hypothesis has to be a more correct statement than the null hypothesis (in short: hypothesis, H0). Based on a test criterion, a decision is made of whether to reject the null hypothesis and accept the alternative (FAHRMEIR 2004). “The null hypothesis is a negative hypothesis claiming that the statement complementary to the alternative hypothesis is true. […]. In non-directional alternative hypotheses (the two characteristics are related), the null hypothesis is defined as follows: The two characteristics are not related. […]. Verification of the statistical alternative hypothesis then involves proving that the null hypothesis is presumably false in order to conclude, by implication, that the statistical alternative hypothesis is true. The null hypothesis may only be abandoned if the real situation cannot be practically explained by this, in which case the alternative hypothesis can be accepted.” (BORTZ 2005).
At a pre-defined significance level – usually α = 5 % – the null hypothesis is abandoned and the alternative hypothesis is accepted if the test parameter is p < 0.05.
10.2 Statistics: Standardisation (z-transformation)
“Occasionally, one is faced with the task of relating the test value of one person to the test values of others in order to assess whether this value is a “high” or a “low” value. In everyday life, the average is often used as the reference point and a value is described as being above or below average. […]. A different procedure is often used, however, in which the mean value and the standard deviation of the random sample are used to transform the test value. This procedure is called “z-transformation“. (BORTZ UND SCHUSTER 2010)
A comparison of several standard deviations must always include the mean value, but this mean value is only identical in exceptional cases and so direct comparison is not possible. A z-transformation of the data allows comparison of two identical standard deviations with different mean values
(SCHENDERA 2007). “The z-transformation enables standardisation of all normal distributions, i. e. a common standard can be applied” (BORTZ 2005). Measurement data with a random mean value and standard deviation can therefore be transformed into data with a defined mean value and standard deviation (PERSIKE 2012). “A z-transformed distribution has a mean value of 0 and a standard deviation of 1.0.” Random normal distributions are converted into standard normal distribution by z-transformation (BORTZ UND SCHUSTER 2010).
10.3 Comparison of DE BOER ratings of test persons depending on their seat position
Figure 1 shows the DE BOER ratings for the test persons on the driver seat and the front passenger seat, respectively. The box plot shows the distribution for vehicle ID1 as an example. The distribution is similar for the other two measuring vehicles (ID2 and ID3). Analysis of the significance of the assessments using a non-parametric rank-sum test shows that the assessments of the test persons on the driver seat and front passenger seat of measuring vehicles ID1 (p = 0,113), ID2 (p = 0,461) and ID3 (p = 0,217), respectively, can be pooled.
Figure 1: Box plot of all DE BOER ratings by drivers and front-
seat passengers in measuring vehicle ID1
10.4 Comparison of the DE BOER ratings of measuring vehicles ID1, ID2 and ID3
Figure 2 shows a comparison of the box plots of ID1 and ID3 as an example. No significant differences (p = 0.704) can be seen upon comparing the DE BOER ratings obtained in measuring vehicles ID1, ID2 and ID3.

35
Figure 2: Box plots of the DE BOER ratings of measuring
vehicles ID1 and ID3 for all test persons
This makes it possible to analyse all assessments together.
10.5 Comparison of the De Boer-ratings of test persons depending on age
Figure 3 shows a box plot of the DE BOER ratings of test persons from the selected age groups, both sitting on the driver and the front passenger seat (cf. Section 10.1) and for all measuring vehicles (cf. Section 10.4). Statistically, however, there are no significant differences in the blinding-glare assessment of the two groups (p = 0.100).
Figure 3: DE BOER rating of selected age groups (driver and
front-seat passenger seating position for the measuring vehicles ID1-ID3 analysed jointly)
10.6 Reproducibility of the photometric measurements
Each test run was repeated three times in the course of an evening. The settings of the test vehicle were the same throughout. The complete experiment was held on eight evenings and each test run was repeated three times, thus giving a total of 𝑛𝑛 = 3 · 8 = 24 test runs. Figure 4 shows a diagram of the illuminance as a function of the distance jointly for all 24 test runs.
In all test runs, the illuminance shows a maximum difference of 0.15 lx and a standard deviation of 0.1 lx. Therefore, it can be assumed that the test runs are comparable for each day and that the measurements are reproducible and repeatable.
Figure 4: Illuminance as a function of the distance, for all 24
test runs on 8 different test days
10.7 Comparison of repair shop settings for tungsten-halogen and high-intensity discharge headlamps
Figures 5 and 6 show the vertical and horizontal adjustment of tungsten halogen and high-intensity discharge headlamps by 10 selected vehicle repair shops.
Figure 5: Horizontal adjustment of headlamps by repair shops
Figure 6: Vertical adjustment of all headlamps by repair shops
To help illustrate the findings, the box plot of the horizontal adjustment has been turned by 90°and is shown horizontally. Despite the differences in settings of the tungsten-halogen and high-intensity discharge lamp headlamps, no significant difference between the two light sources can be found.