research and d evelopment irish e lectronics industry
TRANSCRIPT
R e se a r c h and D e v e l o pm e n t
in THE
I r ish E le c t r o n ic s I n d u st r y
DISSERTATION SUBMITTED IN FULFILMENT
OF THE REQUIREMENTS FOR THE
MASTERS OF BUSINESS ADMINISTRATION
(MBA)
DUBLIN CITY UNIVERSITY BUSINESS SCHOOL
DUBLIN CITY UNIVERSITY
AUGUST 1993
BY
JOE MADDEN
M. Eng., B. Sc. Elect. Eng.

DEDICATION
TO PATRICIA, WHOSE HELP AND SUPPORT MADE
THIS WORK POSSIBLE AND WORTHWHILE

Declaration
I hereby certify that this material, which I now submit for
assessment on the programme of study leading to the award of
MBA is entirely my own work and has not been taken from the
work of others save and to the extent that such work has been
cited and acknowledged within the text of my work.
Supervisor: Mr. Anthony Foley

TABLE OF CONTENTS
Page
Abstract................................................................................... v
Acknowledgements................................................................ vi
List of Tables........................................................................... vii
List of Figures......................................................................... viii
1 Introduction and Background
1.1 Introduction.............................................................................. 2
1.1.1 Objectives................................................................................. 5
1.2 The Development of Electronics............................................ 6
1.3 Technological Unemployment.............................................. 9j 4 Solow's Study on the Contribution of Technology to
US Growth............................................................................... 9
1.5 Marx and Schumpeter............................................................. 10
1.6 Sources of Innovation.............................................................. 13
1.7 Conclusion................................................................................ 17
2 The Irish Electronics Industry
2.1 National Policy and Innovation.............................................. 19
2.2 Japan......................................................................................... 22
2.3 The United Kingdom............................................................... 27
2.4 Korea........................................................................................ 30
2.5 European Community.............................................................. 33
2.6 Conclusion................................................................................ 36
3 The Electronics Industry in Ireland
3.1 Industry Development 1979 - 1990....................................... 39
i
3.2 Telesis Report.......................................................................... 40
3.3 Changes in Outward Looking Policies.................................. 46
3.3.1 Passive to Interventionist........................................................ 46
3.3.2 Backing Winners..................................................................... 50
3.4 Analysis of the Irish Electronics Industry using the Porter 52Diamond Model......................................................................
3.4.1 The Porter Model..................................................................... 51
3.4.2 Factor Conditions.................................................................... 54
3.4.3 Related and Supporting Industries........................................ 57
3.4.4 Demand Conditions................................................................. 61
3.4.5 Firm Strategy Structure and Rivalry..................................... 67
3.4.6 Conclusions of Porter Analysis.............................................. 69
3.5 National System of Innovation............................................... 70
3.6 Conclusion................................................................................ 79
4 Research and Development in the Irish ElectronicsIndustry (1979-91)
4.1 Methodology............................................................................ 81
4.1.1 Business Expenditure on Research and Development(BERD) in Electronics............................................................ 82
4.1.2 Electronics Sector.................................................................... 82
4.1.3 Instrument Sector.................................................................... 86
4.1.4 Electrical Machinery Sector................................................... 89
4.1.5 Total BERD in Electronics..................................................... 92
4.2 International Comparisons..................................................... 95
4.3 EC Framework Funding for R & D in Electronics............... 100
4.4 Higher Education Sector........................................................ 104
4.5 Eolas......................................................................................... 106
4.6 Technology Transfer............................................................... 107
ii
4.7 IDA R & D Grants Scheme................................................... 110
4.7.1 Development of the IDA Product and Process 110Development Grants Scheme................................................
4.7.2 Analysis of IDA R & D Data................................................. I ll
4.7.2.1 Distribution of Grants............................................................. 112
4.7.2.2 Location of R & D Activity.................................................... 114
4.7.2.3 Companies Receiving More than £50,000............................ 118
4.7.2.4 Performance of Irish Companies........................................... 118
4.7.2.5 Performance of Foreign Companies...................................... 125
4.8 Survey of Companies.............................................................. 127
4.8.1 Rationale for Survey............................................................... 127
4.8.2 Survey Findings........................................................................ 128
4.9 Science & Technology Structural Funded Programmes 133
4.9.1 Programmes in Advanced Technology................................. 133
4.9.2 Higher Education Industry Co-operation.............................. 137
4.9.3 Regional Technical Support................................................... 138
4.9.4 Grants to Industry.................................................................... 139
4.10 Conclusion................................................................................ 140
5 A National System of Innovation in Electronics
5.1 Vicious Circles........................................................................ 145
5.2 Virtuous Circles...................................................................... 146
5.3 The Electronics Design Process............................................. 148
5.4 Recommendations on the Creation of a National Systemof Innovation in Electronics.................................................. 149
6 Conclusion........................................................................... 158
Bibliography....................................................................... 161
iii
Appendix A Aggregate demand and supply model of the impact of technological change
Appenxix B Data Tables Detailing BERD in Electronics
Appendix C Eolas Science and Technology Evaluation Unit Survey of Business Expenditure on R & D
Appendix D Explanation of Marxist Concepts
Appendix E IDA R & D Grant Recipients 1979-1991
Appendix F IDA R & D Grant Recepriants as a proxy for R & DPerforming Companies
ABSTRACT
J o e M a d d e n
R e s e a r c h a n d D e v e l o p m e n t in t h e I r is h E l e c t r o n ic s In d u s t r y
The electronics industry is a rapidly changing technology driven industry. Intensive research and development activity in electronics has been partly responsible for the emergence of Japan as an economic superpower and the rapid development of the Korean economy.
Following the publication of the Telesis Review of Industrial Policy in 1982, the Irish Government undertook a gradually more interventionist policy towards the indigenous electronics industry. In the ten years since Telesis there has been significant growth in business expenditure on R & D in electronics but this growth has come exclusively from multinational companies.
Indigenous expenditure on R & D has remained static but has become concentrated in specific sectors. These sectors are industrial control, security systems and electronics for the building industry where economies of scale are not important and in the power supply sectors where economies of scale are not possible.
Factors critical to effective research and development in the Irish electronic industry have been identified as:
(1) The availability of skilled people(2) Knowledge of the market(3) Interaction with customers
A university ethos supportive of industrial development and R & D intensive multinational companies have been found to contribute to the development of R & D intensive indigenous companies.
Gorvemment intervention has lacked focus and has not been effective in improving the competitiveness of the industry.
A model of a national system of innovation, based on that proposed by Mjoset, has been developed. The policy changes required to make such a model work have been identified as focused state support for specific industries, focused state support for the development of related technologies, inclusion of the banking system into the system of innovation and the encouragement through the use of R & D grants user producer cooperation in the development of new producer cooperation in the development of new products.
It is proposed that such a national system of innovation could be used to create a self sustaining virtuous circle of economic development in electronics.
v

A c k n o w ledg em ents
I would like to thank the following people for their help and assistance:
• Ms Ann Fitzgerald and Dr Lorna Harding of the Science and Technology
Evaluation unit at Eolas for their information and advice on R & D statistics.
• Ms Edel O'Brien of the Eolas Library Service for her support in gaining access to
journal publications
• Dr Brian O'Donnell and Tom Sheedy of Eolas who provided information on the
ESPRIT programme.
• To the Irish industrialists and entrepreneurs who contributed to the survey and who
continue to make R & D effective for the Irish economy.
• I would like to express particular gratitude to Ms Jill Leonard who generously
agreed to type this thesis, for her patience, tolerance and ongoing advice.
• Finally, I would like to express my thanks to my supervisor, Mr Tony Foley without
whose valuable advice, guidance and cooperation this thesis would not have been
possible.
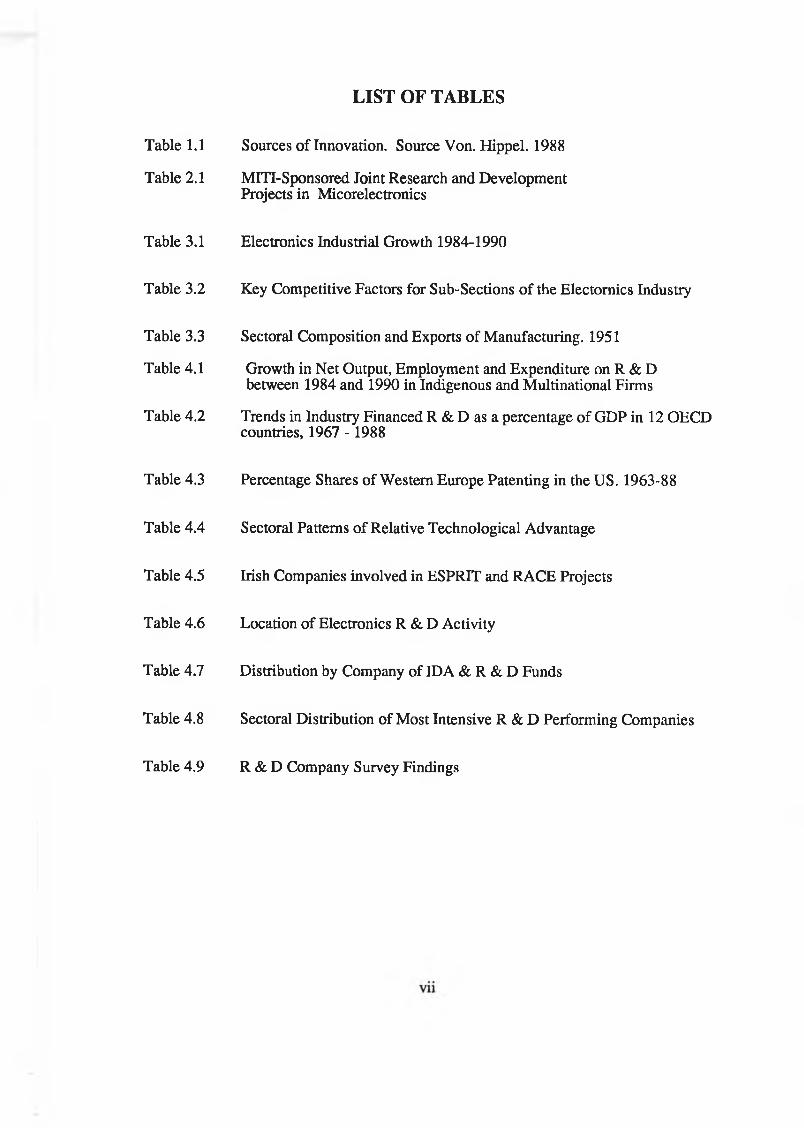
LIST OF TABLES
Table 3.1
Table 3.2
Table 3.3
Table 4.1
Table 4.2
Table 4.3
Table 4.4
Table 4.5
Table 4.6
Table 4.7
Table 4.8
Table 4.9
Table 1.1
Table 2.1 MITI-Sponsored Joint Research and Development Projects in Micorelectronics
Electronics Industrial Growth 1984-1990
Key Competitive Factors for Sub-Sections of the Electomics Industry
Sectoral Composition and Exports of Manufacturing. 1951
Growth in Net Output, Employment and Expenditure on R & D between 1984 and 1990 in Indigenous and Multinational Firms
Trends in Industry Financed R & D as a percentage of GDP in 12 OECD countries, 1967 - 1988
Percentage Shares of Western Europe Patenting in the US. 1963-88
Sectoral Patterns of Relative Technological Advantage
Irish Companies involved in ESPRIT and RACE Projects
Location of Electronics R & D Activity
Distribution by Company of IDA & R & D Funds
Sectoral Distribution of Most Intensive R & D Performing Companies
R & D Company Survey Findings
Sources of Innovation. Source Von. Hippel. 1988
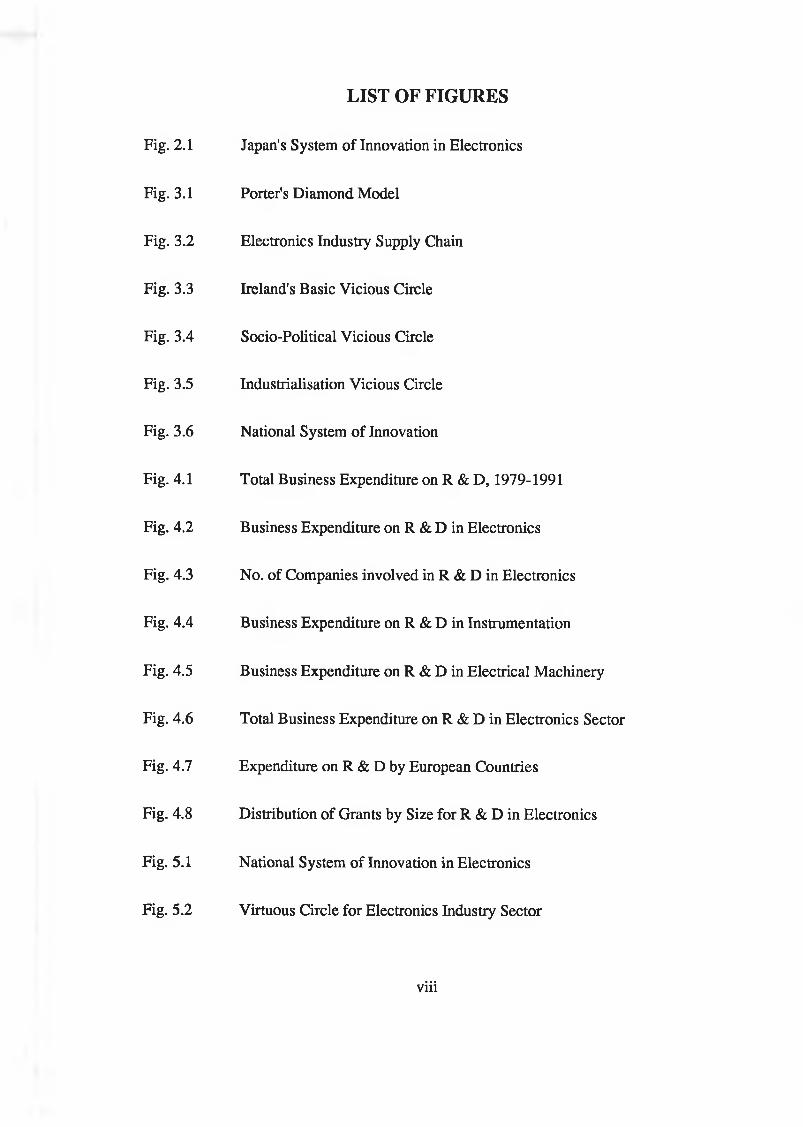
LIST OF FIGURES
Fig. 2.1 Japan's System of Innovation in Electronics
Fig. 3.1 Porter's Diamond Model
Fig. 3.2 Electronics Industry Supply Chain
Fig. 3.3 Ireland's Basic Vicious Circle
Fig. 3.4 Socio-Political Vicious Circle
Fig. 3.5 Industrialisation Vicious Circle
Fig. 3.6 National System of Innovation
Fig. 4.1 Total Business Expenditure on R & D, 1979-1991
Fig. 4.2 Business Expenditure on R & D in Electronics
Fig. 4.3 No. of Companies involved in R & D in Electronics
Fig. 4.4 Business Expenditure on R & D in Instrumentation
Fig. 4.5 Business Expenditure on R & D in Electrical Machinery
Fig. 4.6 Total Business Expenditure on R & D in Electronics Sector
Fig. 4.7 Expenditure on R & D by European Countries
Fig. 4.8 Distribution of Grants by Size for R & D in Electronics
Fig. 5.1 National System of Innovation in Electronics
Fig. 5.2 Virtuous Circle for Electronics Industry Sector
viii

1 In t r o d u c t io n a n d B a c k g r o u n d
1
1 in t r o d u c t io n a n d B a c k g r o u n d
1.1 Introduction
The electronics industry has been central to economic development in the advanced
world over the past 40 years.
It has been a technology driven industry with developments like TV receivers,
transistors, integrated circuits, microwave ovens, computers and 'walkmans' meeting
latent rather than expressed needs in the market.
Electronics has also been central to the success of the outward looking industrial policy
adopted by the Irish Government in the 1960s with the establishment of major
multinational companies like Digital and General Electric in the early 1970s up to the
recent establishment by Intel of its "586" microprocessor manufacturing facility in
Ireland.
The Telesis Report published in 1982, questioned the technology level of the electronics
industry in Ireland criticising the low level of R & D in the MNC's based here. It also
questioned the over dependence on Foreign companies to drive economic development
in Ireland.
In Ireland the electronics industry still appears to be dependent on MNC's set up
principally as manufacturing operations for products conceived and designed in other
countries. The role of MNC's in any country's system of innovation in electronics must
2

therefore be considered. Their role can only be a secondary one with the product
development capability of indigenous electronic industry being of primary importance.
This thesis will review the evolution of R & D in electronics in Ireland since the time of
the Telesis study.
For the purpose of comparison and for identification of suitable models, it will begin by
examining the relationship between innovation and economic growth and the impact of
R & D policies in electronics in Japan, United Kingdom Korea and the European
Community. The macro-economic performance of the Irish electronics industry will be
reviewed using Census of Industrial Production figures and the Porter Diamond Model
of national competitive advantage. The Porter model will be examined with particular
reference to the role of R & D in creating national competitive advantage.
The generally poor performance of Irish industry including the electronics sector will be
viewed in the context of "National systems of innovation and virtuous and vicious
circles". This will set the background for a detailed study of Irish electronics companies
undertaking R & D and of the institutions supporting them.
The performance of indigenous and multinational companies will be compared. The
effect of government policy will be investigated. The IDA data on R & D grants will be
used to examine the R & D performance at a microeconomics level. This will be
supplemented by data from a survey of a sample of Irish companies who have received
grants.
3

The review will provide an overview of the R & D performance of the Irish electronics
industry and an indication of what is necessary and possible to do to provide a national
system of innovation in electronics.
4

The objectives of the thesis are:
1.1.1 Objectives
(1) To review the R & D performance of the Irish electronics industry
(2) To review the contribution of Government policy and state institutions to
the development of R & D in the electronics industry
(3) To review the experiences of selected countries in developing a national
system of innovation in electronics
(4) To develop, based on these reviews, a national system of R & D and
innovation for the electronics industry in Ireland
5
The 1870s saw a transition from the first to the second industrialisation phase of the
industrial revolution with a shift in focus from steel coal and textiles in the UK to
electricity and chemicals in Germany and the US. (Hughes. 1983)
Pioneers in the electrical industry were inventors/entrepreneurs and included Edison,
Westinghouse and Sprague, in the US whose names live on as part of the major
electrical/electronics companies they founded. Halske and Siemens, the German
pioneers founded AEG and Siemens, the two leading German electronics companies of
today.
During the 19th century, the electrical industry relied on pneumatic controls to control
electrical output and large electrical equipment and machinery while smaller scale and
domestic equipment was controlled by on-off manual switches.
The invention of the "electron tube" by De Forrest in 1906 represents the beginning of
the electronics industry. This was a device that looked like a light bulb with five
instead of two connection points. One of the problems with early light bulbs was that
after a short period of operation the glass blackened.
De Forrest, proposed that the blackness was caused by "electrons’' coming off the
filament and to prove it he inserted extra terminals through which the release of
electrons could be controlled.
1.2 The Development of Electronics
6
By applying one signal the flow of electrons could be stopped altogether and by
applying the opposite the flow could be maximised - he therefore made the first
electronic switch.
Initially however, the signal was continuously variable (analogue) rather than on/off
(digital) and used to control the volume on radios, the speed of motors or the brightness
in lights. The first computer developed in Berkeley in 1945 used 18,000 of these
electron tubes or valves.
In 1948, the first transistor was developed by Schottky in Bell Laboratories in the US.
This reduced the size of the "electronic control" device from that of a light bulb to that
of a pea.
The invention was first commercialised by Sony with the development of the transistor
radio (Morita. 1988).
In 1959, the first integrated circuit was developed as part of a US Defence research
contract (Friedrick & Schoff. 1982). This allowed 4 switches to be placed in a single
piece of silicon or chip.
Since then progress has been incremental but dramatic.
The latest device announced by Samsung, the 64Mbit DRAM, allows 64 million
switches to be placed on the same centimeter scale chip. (International Business. 1993.
P. 30).
7
This rapid development in the "core" technology of electronics, - the electronic switch -
has resulted in:
(1) corresponding development in many of the related disciplines such as
software in order to take advantage of the developments in the hardware.
(2) The extension of electronics to many areas that were previously non
electronic - including telecommunications systems, process control
equipment, instruments (e g weighing scales) and children's toys.
A study of UK industry (Northcoff and Rogers. 1984), showed that for companies
employing more than 1,000 people 35% of them employed micro electronics in their
products and 96% employed microelectronics in their processes. The use of electronics
in all sectors across both process and product increased between 1981 and 1983 from
30% to 47%.
In 1991, the world electrical/electronic market had reached about 1,400 billion ECU
(Commission of the European Community, 1991). Through information technology it
has impacted every industry. It is recognised as the key technology in terms of national
competitiveness (Mjoset. 1992) and the electronics/information technology is now seen
as the "second industrial revolution" (Howell et al. 1988)
There has been a strong correlation between national economic development and
participation in the electronic revolution. A significant part of US Growth in the 1960s
and 70's was due to the clear lead it had established in electronic technology.
Electronics has also been a key element in the emergence of Japan as a world economic
power and in the rapid development of the Korean economy.
8
In Europe, value added in the German electronics industry in 1991 at 30 billion ECU,
was over twice that of France and almost three times that of the UK (Commission of the
European Community, 1991) again reflecting the relative strengths of the three
economies.
1.3 Technological Unemployment
One of the fears of this new technology particularly among trade unions is that it leads
to job losses. This fear is understandable when one considers the significant volume of
anecdotal and empirical evidence which supports it.
This fear is also justified by the Classical Aggregate Demand and Supply model of
economic behaviour (Lovell. 1975. P. 318). The aggregate model which represents a
refinement of the 1S-LM Model can be used to model the impact on the economy
(details included in Appendix A) of a technological change which increases aggregate
output without requiring additional labour or capital. According to this model the net
effect of technological change is increased output, lower prices with reduced
employment.
In Europe, between 1982 and 1991 electronic production output increased from 79
billion ECUs to 174 billion ECUs while employment increased from 1.4 million to 1.5
million. (Commission of the European Community. 1991)
1.4 Solow's Study on the Contribution of Technology to US growth
The Aggregate Model of Demand and Supply of the impact of technology was
countered somewhat by an empirical study carried out by Professor Robert Solow, who
9

studied the contribution to US growth between 1909 and 1949 made by capital
accumulation and improvements in the techniques of production (Solow. 1957). Solow
saw the increase in output as being a result of the impact of the increased labour, the
increase in accumulated capital plus the contribution of technological advance.
The increase in output was 216%. The increase in labour was 54% and the increase in
accumulated capital was 102%. When these numbers were plugged into a model he had
developed, it showed that technological change accounted for 146% of the 216%
increase in output over the period.
Further studies of Solow's work suggest that while the technological contribution to
economic growth is important, his results probably place an upper bound on the
magnitude of this contribution. (Lovell. 1975. P.305)
1.5 Marx and Schumpeter
The theoretical basis for the role of technology and innovation in economic
development was established by Karl Marx and J A Schumpeter (an explanation of the
relevant Marxist terms is provided in Appendix D). Marx was in the classical tradition
of economists. Marx shared an interest in the division of labour with Adam Smith. In
his analysis of the "Nature and Causes of the Wealth of Nations", Smith argued that
changes in productive technique are built around the division of labour both in
production and in Society as a whole. His definition of the division of labour was so
broad that it also included technical progress.
Marx had the benefit of the industrial revolution experiences to draw on in the
development of his economic theories relating to technology.
10

He understood the process of technological change and his model of it can be as equally
applied to the electronic revolution underway today as it was to the industrial revolution
of his time.
According to the Marxist model technological advances resulted in extended
reproduction which led to surplus profits.
These surplus profits were invested in further mechanisation. Because of the technology
diffusion the rate of profit would fall and each enterprise returned to a system of simple
reproduction.
Marx saw the accumulation and competition process as leading to continuous crises in
the capitalist system.
J A Schumpeter who began writing in the 1920s presented a similar analysis of
technical innovation to that of Marx. He developed the concept of circular flow.
Circular flow exists when the costs of running an operation equal the income derived
from it and the net profit equals zero. In this state the operation makes continuous
adaptations to small external changes.
Marx saw innovation as part of the process of capitalist disintegration while
Schumpeter saw it as the driving force of economic development. It introduced dis
equilibrium into the circular flow which then became unstable until a new
neighbourhood of equilibrium was found. He saw this innovation as having a band
wagon effect with its diffusion throughout the economic system. Dis-equilibrium
disturbance results in business cycles with a period of economic growth immediately
after the introduction of the innovation and during the period of technical diffusion but
11
with a period of recession as the new equilibrium state becomes stable The similarity
between the concepts of Schumpeter and Marx is significant. Circular flow in its stable
state is equivalent to simple reproduction, where Schumpeter treats income to the
owners as part of the costs. The concept of business cycles was not specifically
mentioned by Marx but the "phenomena stood clearly before his eyes" (Hagedoom,
1989 ). Schumpeter distinguishes between economic growth which he sees as part of
the stable circular flow and economic development which he sees as a result of
innovation. He defines innovation very broadly as:
(1) the introduction of a new good - that is one with which consumers are
not yet familiar - or a new quality of goods.
(2) the introduction of a new method of production that is not yet tested by
experience in the branch of manufacture concerned, and can also exist in
a new way of handling commodity commercially.
(3) the opening of a new market, ie a market into which a branch of
manufacture of the country in question is not previously entered whether
or not this market has existed before.
(4) the conquest of a new source of supply of raw materials or for half
manufactured goods, again irrespective of whether this source already
exists or whether it has first to be created.
(5) the carrying out of the new organisation of any industry such as the
creation of a monopoly position or the breaking up of a monopoly
position (Hagedoom. 1989).
Innovation has generated a number of business cycles in the electronics industry,such
as the replacement of valves by transistors, the displacement of radios by TV's, and the
more recent rise in the use of personal computers coupled with the decline in use of
main frame computers.
12

Because of its political ethos, Marx's economic theory has tended not to be critically
evaluated. Neo-Markist literature has tended to explain and defend "Das Kapital".
Marx himself had a complete understanding of technological development and its
implications for industry, while Neo-Markists have tended to focus on the more abstract
and ethereal issues. Few have made an attempt to go beyond or even expand the field
of research laid out by Marx himself (Hagadoom. 1989. P. 62)). Schumpeter on the
other hand being in main stream economics has been more analysed and reassessed.
Kamien and Schwartz have summarised a set of Schumpeter aspired hypotheses on
market structure and innovation as follows:
(1) Innovation is greater in monopolistic industries than in competitive ones
because:
(a) a firm with monopoly power can prevent imitation and
thereby can capture more profit from innovation
(b) a firm with monopoly profits is better able to finance
research and development
(2) large firms are more innovative than small firms because:
(a) a large firm can finance a larger research and development
staff
(b) a large diversified firm is better able to exploit unforeseen
innovations
(c) indivisibility in cost reducing innovations makes them
more profitable for large firms
(3) innovation is spurred by technical opportunity
(4) innovation is spurred by market opportunity (demand pull).
(Kamien and Schwartz. 1982. P. 47).
1.6 Sources of Innovation
13
This view that large firms are the source of major innovation is further developed by
Galbraith, who mentions six consequences of modem technology for companies.
(1) longer time span from beginning to end of innovation
(2) large capital investment required
(3) large division of tasks and means of production
(4) more specialised manpower
(5) more organisational efforts and
(6) more planning.
(Galbraith. 1985. P. 12-16).
However, the opposite position was taken by Blair, who developed his theory on the
"creative backwardness of bigness". This 'backwardness' he ascribed to:
(1) the desire to protect the investment in older technology
(2) indifference to technological advance
(3) underestimation of demand for products
(4) neglect of the inventor
(5) misdirection of research and
(6) incompatibility between organisation and creativity.
(Blair. 1972. P. 228-257).
There is no clear conclusion in the literature on this argument. There are some
industries such as aerospace, motor vehicles and pharmaceuticals where the industry
structure makes it very difficult for small firms to make any contribution to innovation.
Other attempts have been made to develop a theory in which the different roles of small
and large companies are explained. According to Sher (1980) small and medium sized
14
firms play a role in the early stages of innovation but larger firms are required to take
over the innovative process when significant investments are required and bring the
innovation to commercial success. Dosi, sees small firms predominating primarily in
new fields of technology where there is a high rate of birth and mortality of new
companies. Of particular relevance to the Irish electronics industry is a study by
(Rothwell and Zegveld. 1982. P. 45 - 54), who saw the disadvantages for small
company innovation as :
(1) their lack of qualified R & D personnel
(2) shortcomings in external communications and in particular a lack of
information on technology and markets
(3) lack of management skills
(4) constraints of financial resources
(5) problems related to economies of scale
(6) inability to take advantage of government measures
(7) problems related to growth of the firm
The summary of the functional sources of innovation is provided in table 1.1.
15
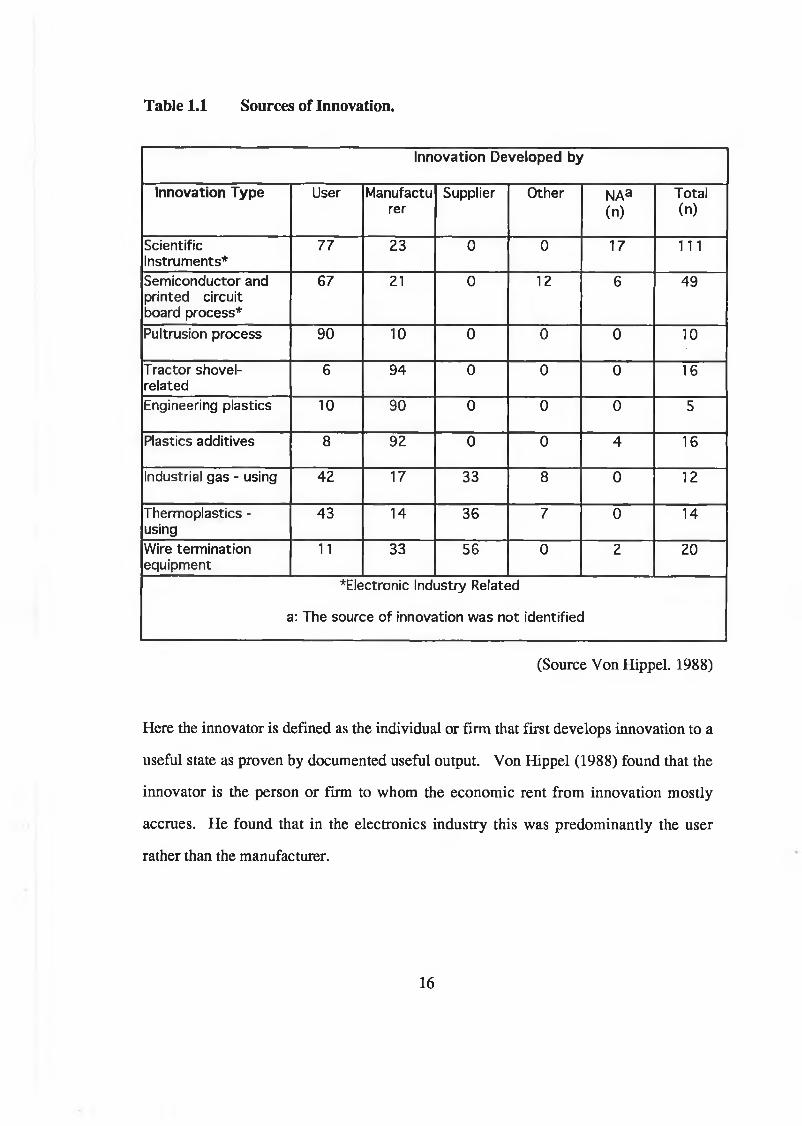
Table 1.1 Sources of Innovation.
Innovation Developed by
Innovation Type User Manufacturer
Supplier Other NAa(n)
Total(n)
ScientificInstruments*
77 23 0 0 17 111
Semiconductor and printed circuit board process*
67 21 0 12 6 49
Pultrusion process 90 10 0 0 0 10
Tractor shovel- related
6 94 0 0 0 16
Engineering plastics 10 90 0 0 0 5
Plastics additives 8 92 0 0 4 16
Industrial gas - using 42 17 33 8 0 12
Thermoplastics - using
43 14 36 7 0 14
Wire terminationequipment
11 33 56 0 2 20
♦Electronic Industry Related
a: The source of innovation was not identified
(Source Von Hippel. 1988)
Here the innovator is defined as the individual or firm that first develops innovation to a
useful state as proven by documented useful output. Von Hippel (1988) found that the
innovator is the person or firm to whom the economic rent from innovation mostly
accrues. He found that in the electronics industry this was predominantly the user
rather than the manufacturer.
16

The development of electronics has been very fast and at a national level its economic
impact does not appear to conform with the Aggergate Demand and Supply Model of
economic behavior, but the industry is subject to Schumpeterian innovation driven
business cycles.
In the electronics industry the major source of innovation is the user.
The companies in the Irish electronics industry are small and therefore have to deal with
a number of disadvantages related to small company innovation.
1.7 Conclusion
17
2 T h e Ir ish E l e c t r o n ic s In d u st r y
18
2 Th e Ir is h El e c t r o n ic s in d u s t r y
2.1 National Policy and Innovation
Product innovation in electronics is seen as crucial to economic development in all the
industrialised and newly industrialised countries. It is also recognised in these countries
that there is a formal role for Government in the support of this innovation process.
A study by Mansfield (1980), showed that the social rate of return on innovation was
56% while the private rate of return on the investment in innovation was only 25%.
This data justifies investment by states in the innovation process and support by the
state of private investment in innovation.
The optimum form of this support is not universally agreed. In their book, "Nurturing
Advanced Technology Enterprises", Allen and Levine (1986. P.15) review the three
traditional economic development approaches -
(a) regulatory
(b) fiscal/tax and
(c) expenditure
They conclude, based on a review of the literature including Campbell 1958,
Spegelmann 1964, Vaughan 1980, Bridges 1965 and Fischel 1975, that tax deductions
don't help and that expenditures on fiscal/tax incentives known previously as ’smoke
stack' chasing and more recently as 'chip chasing' have had only limited impact on
19
business developments and have had little or no impact on the long term behaviour of
firms. Mulkey and Dilliman in their work "Location and the Effects of State and Local
Development Subsidies" have found that "most subsidies to large firms are probably
wasted". (Mulkey and Dillman. 1976. P. 71-80). They conclude that expenditure
policies such as the creation of business parks are equally ineffective.
A study of multinational companies in Scotland showed that direct grants had no impact
on innovation or research and development budgets or the level of activity (Hung and
Pizzi. 1985. P. 197-206).
Allen and Levine argue that the development of advanced technology companies and
advanced technology entails integrated and private sector activities. Underlying these
activities, there are three essential prerequisites.
These are - the availability of the required technical and professional labour, this
includes the correct environment for these technical and professional workers with
favourable cultural and recreational amenities, community amenities such as favourable
climate, quality schools and a strong civic culture and a suitable tax environment. The
second prerequisite is suitable post secondary educational institutions for the training
and education of a professional and technical workforce. The third prerequisite is a
technological development infrastructure incorporating technological support
organisations that can meet a wide range of needs. Allen and Levine focused their
study on the experience of the State of Pennsylvania.
These prerequisites are broadly similar to Porter's "advanced factors" (discussed later)
but place a greater emphasis on a suitable environment for high skilled personnel.
20
They also take account of the personal tax environment which Porter tends to ignore but
which was perceived as the major obstacle to industrial development in Ireland by the
Industrial Review Group (Industrial Review Group. 1992).
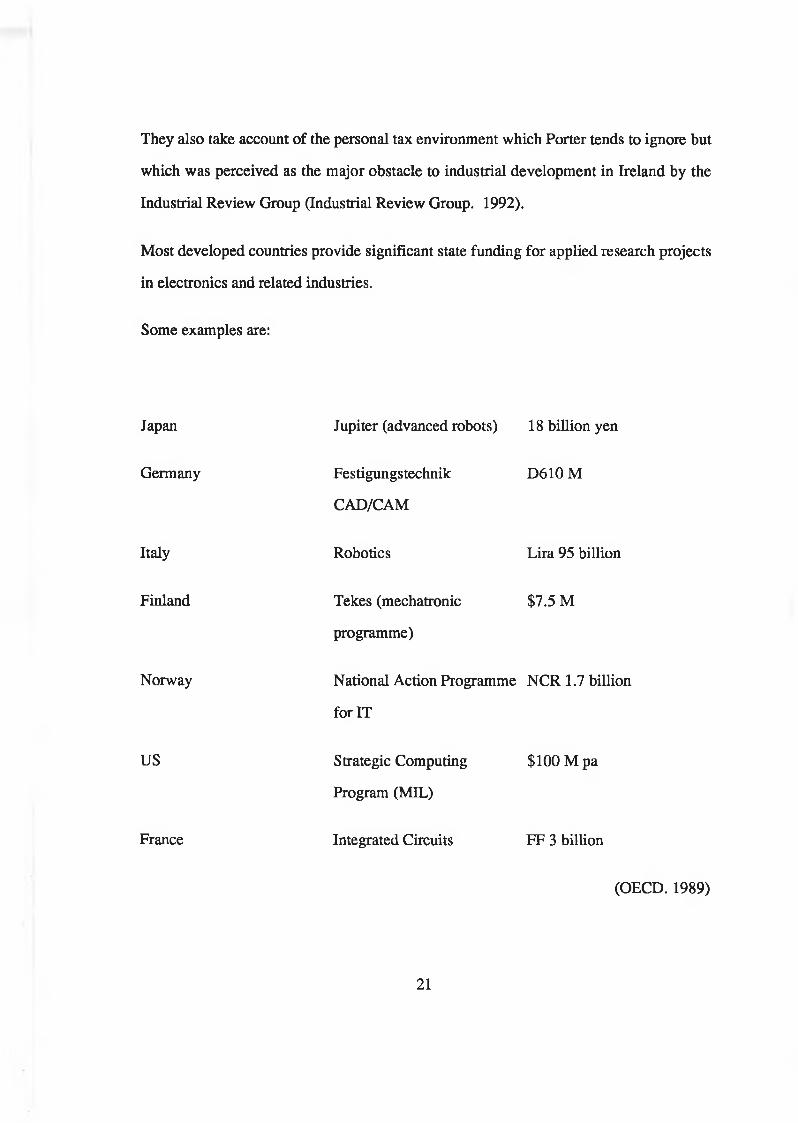
Most developed countries provide significant state funding for applied research projects
in electronics and related industries.
Some examples are:
Japan
Germany
Italy
Finland
Norway
US
Jupiter (advanced robots) 18 billion yen
Festigungstechnik
CAD/CAM
Robotics
Tekes (mechatronic
programme)
D610M
Lira 95 billion
$7.5 M
National Action Programme NCR 1.7 billion
for IT
France
Strategic Computing
Program (MIL)
Integrated Circuits
$100 M pa
FF 3 billion
(OECD. 1989)
21

These programmes all include significant industrial interaction. The optimum form this
interaction should take for maximum economic development is dependent on other
external factors. For example the military funding of research in the US has provided
significant industrial spin-off while in the UK it hasn't. Up to 1989, Ireland had no such
programmes. The experiences of three countries and the EC in operating such systems,
two, Japan and Korea very successful and one, the UK not so successful, can provide
some framework for the Irish electronics industry to assess how it should proceed.
2.2 Japan
The relationship between the Japanese government and the electronics industry is
depicted schematically in Fig.2.1.
MITI is the Ministry for International Trade and Industry and is a government agency
principally responsible for directing Japan's extraordinary post-war economic growth.
MITI provides strategic guidance and financial assistance to the industry and jointly
participates with Japanese companies in R & D for commercial applications in
industry/government joint laboratories.
The Ministry of Education and Culture funds university research and supports several
large national research facilities in electronics R & D.
22

Fig 2.1 Japanese Nationese National System of Innovationinin Information Technology ( Source :Howell et al, 1988 P45)
23

Nippon Telephone and Telegraph (NTT), is controlled by the Japanese Ministry of Post
and Telecommunications (MPT). The MPT and MITI are both influential Ministries in
Japan and they play a role in virtually every policy area affecting the information and
electronics industry. They compete with one another to woo the industry through the
provision of progressively greater promotional benefits (Johnson. 1986).
MITI have taken a very proactive role in the development of Japanese electronics
industry. They have fostered a rapid development of indigenous computer and
semiconductor industries through the provision of subsidies for Research and
Development throughhome market protection and the development of an infrastructure
that is suitable for international competition. It has sponsored a number of joint
research and development projects. These projects are listed in Table 2.1. They are
focused on specific technological areas each with a clear market objective. They are
funded entirely by MITI who select the companies which participate on joint research
programmes.
24
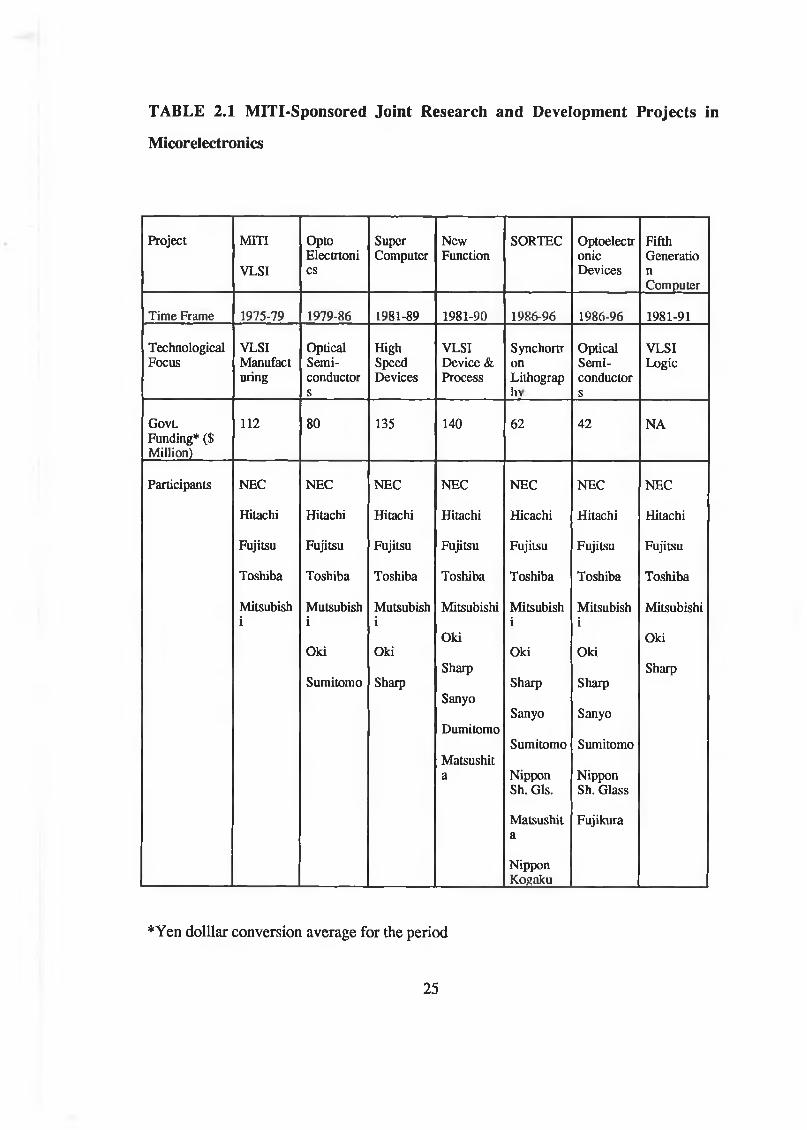
TABLE 2.1 MITI-Sponsored Joint Research and Development Projects in
Micorelectronics
Project MITI
VLSI
OptoElectrtonics
SuperComputer
NewFunction
SORTEC OptoelectronicDevices
FifthGenerationComputer
Time Frame 1975-79 1979-86 1981-89 1981-90 1986-96 1986-96 1981-91
TechnologicalFocus
VLSIManufacturing
OpticalSemiconductors
HighSpeedDevices
VLSI Device & Process
SynchortronLithograpIn
OpticalSemiconductors
VLSILogic
Govt.Funding* ($ Million)
112 80 135 140 62 42 NA
Participants NEC NEC NEC NEC NEC NEC NEC
Hitachi Hitachi Hitachi Hitachi Hicachi Hitachi Hitachi
Fujitsu Fujitsu Fujitsu Fujitsu Fujitsu Fujitsu Fujitsu
Toshiba Toshiba Toshiba Toshiba Toshiba Toshiba Toshiba
Mitsubishi
Mutsubishi
Oki
Sumitomo
Mutsubishi
Oki
Sharp
Mitsubishi
Oki
Sharp
Sanyo
Dumitomo
Matsushita
Mitsubishi
Oki
Sharp
Sanyo
Sumitomo
Nippon Sh. Gls.
Matsushita
NipponKosaku
Mitsubishi
Oki
Sharp
Sanyo
Sumitomo
Nippon Sh. Glass
Fujikura
Mitsubishi
Oki
Sharp
*Yen dolllar conversion average for the period
25
MITI's promotional efforts have been augmented by special legislation authorising the
provision of subsidies, tax benefits, low interest loans and exemptions from anti-
monopoly laws for designated priority industries. MITI focuses on technological
development while its bureaucratic rival MPT works directly with a family of
telecommunications companies including NEC, Hitachi, Fujitsu and OKI. NTT which
is controlled by MPT has developed semiconductor device technology which it has then
transferred to these firms, supplying them with significant competitive advantage. NTT
was privatised in 1985 and through the sale of shares in the company and the collection
of dividends on the remaining shares, the Government has generated a significant off-
budget fund which has been channelled back into Japan's high technology electronic
industries via NTT. Between 1978 and 1986, MITI was spending sixty billion yen per
annum on technology development and during this same period Japan's electronic
producers moved into a position of world leadership in a number of new technologies
(Howell et al. 1988).
Japan has a clearly identifiable national system of innovation in electronics focused on
technology development in a competitive environment.
26
2.3 The United Kingdom
Over the same time period, the United Kingdom has developed and implemented a wide
variety of industrial policies in support of innovation. The first post-war
encouragement for invention was the setting up of the National Research Development
Corporation in 1948. This organisation was intended to exploit inventions which had
not been taken up by private enterprise that had arisen from Government or academic
research work.
In the areas of electronics, the British Government has introduced a number of specific
programmes. In 1975, the Machine Tool Industry Scheme (MTIS) was launched with
the objective of encouraging the development of new products and processes for the
machine tool industry. The machine tool industry had moved from a stage of being
primarily a pneumatic control industry to becoming an electronic control industry and
there was valid concern in the UK that the UK industry was not keeping up with US,
Japanese and European manufacturers. The scheme involved the provision of loans and
grants to machines tool manufacturers for the development of new machines. Financial
assistance was always kept below 50% of the total costs. Despite this support in the
area of technological development and other more general financial support,
particularly to Herbert Machine Tools, the largest manufacturing company in the UK,
the UK machine tool industry continued to decline.
In a survey carried out on the MTIS scheme by Ann Daly (Daly. 1981), she found that
while the beneficiaries of the scheme commented favourably on it, this should not be
taken as a judgement of its overall success. In more detailed interviews with
respondents she found that insufficient capital was not an inhibiting factor to innovation
27

except for the smallest firms. The MTIS assumed that this would have been the main
inhibitor.
Another British initiative in the area of technology support to the electronics industry
was the Microprocessor Application Project. The scheme had four parts:
(a) a programme of seminars and publicity to generate a greater awareness of
opportunities and threats in the area of microelectronics
(b) a programme of crash courses to train more people in the necessary
special skills
(c) a grant of £2000 towards the costs of a consultants feasibility study on
new applications and
(d) a contribution of 25% of the development costs of viable new
applications.
This scheme was chosen as the subject of study a by the Policy Studies Institute (PSI).
Their report, Microprocessors and Manufacture Products was published in 1980. They
found that the consultancy element was useful to companies but that the delay in vetting
procedures by the programmes administration often resulted in product developments
happening later than they would have if there had been no support. A 25% grant was
paid on the principle of additionally, ie that without the grant, the scheme would not go
ahead. This according to the report favoured companies who knew the ropes and
maintained a 'martini man' to pull in any handouts that might be on offer and it
penalised firms that were open in their dealings. The problem was that it is seldom
28
clear-cut whether or not a project would go ahead without the grant and if the grant was
only to support projects that wouldn't go ahead, it would provide disproportionate
support towards less promising projects.
The first ambitious project undertaken in the UK in the area of electronics was the
INMOS project. This was approved by the National Enterprise Board (NEB) in 1978.
The project involved a £50 million investment of British Government funding at a start
up phase. When a Conservative Government took power in 1979, they carried out a
general review of the NEB operation. They sought to replace the Government funding
by private industry funding. However, none of the major British electronic companies
had any interest in the project. The project went ahead with Government funding and a
£25 million production plant was built in South Wales. The INMOS project was driven
by Dick Petricz, the founder of Mostec and Ian Barron, the founder of Computer
Technology, a leading UK microcomputer company. It represented a new approach in
information processing using a device called a transputer as opposed to the by then
standard microprocessor. The concept has been favourably reviewed both by industry
and academia but up to the time of the sale of INMOS to SGS Thomson in 1990 the
company had not made any profit.
Despite its reluctance to get involved in the INMOS Project, the UK government
following the recommendations of the Alvey Committee (Alvey. 1982) initiated the
Alvey Programme in 1983. This was a £376M programme with government funding of
£211M.
29
The interim evaluation report while generally positive suggested that "more emphasis
needs to be placed on the UK’s problem in exploiting research". (Georghiou et al.
1987). The problem was that while a great deal of research results had been provided,
there was very little industrial spin-off.
The Bide report (Bide. 1986) recommended greater emphasis on longer term research
and the cessation of innovation grants to industry with the exception of small firms.
Porter commented that Britain (along with Germany) has now 'correctly' moved away
from the idea of providing direct grants to industry for R & D on the basis that it
induces inefficiency. (Porter. 1990. P 634).
2.4 Korea
South Korea emerged from the Korean war with its economy destroyed and with no
capital available for the rebuilding of its infrastructure. (Porter 1990 P. 467).
During the 1960s it relied on US aid. During the 70s and 80s as Korea demonstrated its
capability to sustain progress, foreign capital poured into the country. The Korean
Government channelled this capital into areas which it had identified as sectors for
which Korea could establish national competitive advantage. They also encouraged the
establishment and the growth of "Chaebol" or large industrial conglomerates.
30

During the late 70s and early 80s, Korean companies had become world leaders in
many consumer electronics sectors. With the advent of video recording they have
established very strong positions both in the equipment and video tape markets and
similarly in microwave appliances (Mazaginer and Patinlun. 1989)
In the microelectronics sector, Korea had been a final assembly location for many of the
major US semiconductor manufacturers. In 1982, the Korean government announced a
semiconductor industry promotion plan which featured a variety of measures designed
to encourage the development of an indigenous manufacturing capability in
semiconductors (Howell et al. 1988 page 148). This was followed a year later by major
investments by three of Korea's largest Chaebol - Samsung, Gold Star and Hyundai. By
1985 Korea had established domestic wafer fabrication facilities mainly focused in the
manufacture of D-RAM chips. At the same time the Japanese D-RAM industry was in
the process of capturing the world semiconductor D-RAM market through very low
pricing. During this period, all US companies pulled out of the market, while in Korea,
the Korean government invested a further $346m in 1985, in addition to $2 billion by
the Chaebol. Part of this development effort was the establishment of the
Semiconductor Joint Research Centre in 1985. This was a research project involving 17
universities to conduct joint research in semiconductors with industrial partners and also
to train semiconductor specialist manpower. (Howell et al. 1988).
Samsung Korea's largest electronics manufacturer, has now released the world's first
64M bit D RAM. This puts the same memory capacity in a single chip as was available
on 4 hard disc drives in 1986/87 and surpasses the 1985 objective of developing 4M bit
DRAM chips by the early 1990's.
31
Porter notes that two of the determinants of national competitive advantage in his
diamond model are missing in Korea ie demand conditions and related and supporting
industries. (Porter. 1990. P. 479).
Freeman points out (1988 P. 81) that the cost advantages available to enterprises in
larger economies such as learning by interacting and the availability of infrastructures
are lacking in most developing countries and that policies directed towards the creation
of a national system of innovation form the essential foundation for a catching up
strategy in development. Park (1987) and Mody (1987) have shown that such policies
have been extremely important in Korea. (Howell et al. 1988)
32
2.5 EC
During the 1960s and 70s the electronics industry in EC countries was dominated by
national champions such as Olivetti and SGS in Italy, Siemens in Germany, Bull in
France and GEC Plessey in the UK. By the end of the 70s it became apparent that these
companies were not able to withstand the threat from US and Japanese competition in
the electronics instrument and component industries. These large national companies
while perceived to have been necessary to achieve the relevant economies of scale and
had become complacent in their protected position in home markets and had failed to
keep up with the relevant technologies (Sharp 1991. P. 63). At this time, Viscount
Davignon, the EC Commissioner for industry initiated the first European Research and
Technology Programme in electronics.
It was modelled on the Japanese approach discussed earlier and the pilot phase was
launched in 1983/84. The programme was launched formally in 1984 and became
known as ESPRIT, with ESPRIT 1 scheduled to last from 1984 - 1988 and ESPRIT II
from 1988 -1992.
Essential to the start-up of the ESPRIT programme was agreement from Europe's
leading electronics and information technology companies. These were ICL, GEC and
Plessey from the UK, AEG, Nixdorf and Siemens from Germany, Thompson, Bull and
CGE from France, Olivetti and Stet from Italy and Philips from the Netherlands. These
companies, known as the "Big 12" represented 70% of the European electronics
industry. The ESPRIT process consisted initially of a call for proposals issued by the
commission. The call specified the research areas to be studied and was issued to
33
National Agencies who then promoted the concept in their national territory. Each
proposal was required to have cross national collaboration and participation by industry.
Industrial costs were funded at a 50% level, while research institutes and universities
had direct costs funded to 100%. After the closing date for submission of proposals,
technical evaluation of the proposals took place. A small number of proposals that were
highly assessed were guaranteed funding. Others were considered of sufficient
technical merit to receive funding and the remainder were considered unsuitable for
funding. Those in the middle category became the subject of political negotiation and
selection depended more on political than technical considerations. In the pilot phase,
1983-1984, 80% of the funding went to proposals initiated within the big twelve and
this pattern was maintained during the programme.
ESPRIT 1 ended in 1988 having spent 800m ECU.
Between 1987 and 1991,5.6 billion ECU were earmarked for research and development
by the EC. The largest share of this was earmarked for the information technology,
ESPRIT programme - 37.5%. The next largest share was in energy, primarily nuclear
energy which secured 25% of the total budget.
The ESPRIT programme has been subjected to reviews at the end of each phase. The
independent review board in its evaluation of ESPRIT 2 noted that the programme had
produced good technological results in numerous projects and many new standards
from which exploitation activity can be based. However, it also noted that coupling
between R & D and product development especially in large companies needed
34
tightening and recommended that in future the programme concentrate around the more
limited number of well focused technology areas. (European Commision. 1992)
Despite its shortcomings the programme has been responsible for putting European
companies back in the forefront of information technology.
In 1991 SGS Thompson had a 29% share of the world risk processor market, the most
advanced micro processing chip. This represents the largest market share of any
company. Philips have established themselves as world leaders in multimedia
technology using ESPRIT results and Siemens Nixdorf have established themselves as
leaders in sub micron BICmos technology. (Commission of the European Community.
1992).
According to Porter, (1990. P. 637), the European consortia which in many cases
involve only one dominant and often protected firm from each nation may play a role in
catching up in areas of basic technology but have uncertain prospects in creating and
successfully commercialising new technology. His main argument against it was, that,
being a cooperative project it would dull the interfirm rivalry necessary for competitive
advantage.
The results of the programmes suggest that it has created an Esprit de l'Europe in the
European information technology industry and that the "Big 12" have significantly
sharpened their international competitive edge. On the negative side however, it has
also strengthened the European 'Rich man's club' and resulted in the limited technical
resources of the smaller countries being focused on creating European competitive
35
advantage rather than national competitive advantage (Braendgaard. 1988). This is
discussed further in section 4.2
2.6 Conclusion
The experiences of Japan and Korea, illustrated the economic impact of a focused state
policy on the promotion of R & D in the electronics industry.
The level of consultation with industry, in particular in Korea, appears to have been
minimal and despite this it would appear that from an economic growth point of view
the right decisions were made.
In both countries, the state or state institutions decided where national competitive
advantage was to be created and created it by:
(1) providing very significant infrastructural R & D support in relevant
industry sectors
(2) providing financial support to participating companies
The EC information technology (IT) programme ESPRIT has also been successful in
improving the competitive position of European IT companies in some areas. It has
provided "grants" to industry provided:
(1) They work in areas defined by the programme
(2) They have trans national cooperation
(3) They ensure third level institutions are included in the projects
It has been criticised for not being focused enough.
36

In the United Kingdom, there has been very little state direction of technology
development and the policies that have been adopted have been adopted inconsistently.
Ireland has tended to follow the UK model of support for R & D. If a strong electronics
industry is to be developed here, the lessons provided by Japan and Korea on State
involvement in R & D in electronics need to be considered seriously and the practice,
developed in ESPRIT of providing grants only to companies who work in specified
areas and use prescribed structures could also be beneficial.
37

3 T h e E l e c t r o n ic s In d u st r y inIr e l a n d
38
3 THE ELECTRONICS INDUSTRY IN IRELAND
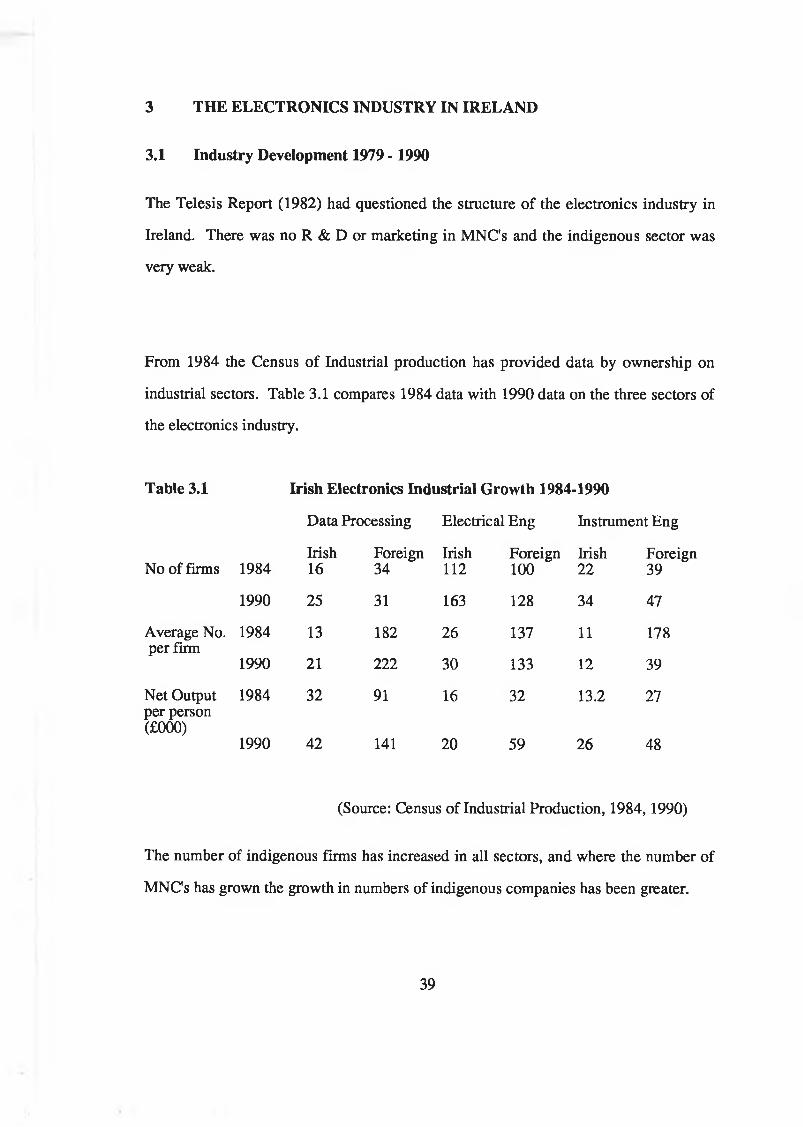
3.1 Industry Development 1979 - 1990
The Telesis Report (1982) had questioned the structure of the electronics industry in
Ireland. There was no R & D or marketing in MNC's and the indigenous sector was
very weak.
From 1984 the Census of Industrial production has provided data by ownership on
industrial sectors. Table 3.1 compares 1984 data with 1990 data on the three sectors of
the electronics industry.
Table 3.1 Irish Electronics Industrial Growth 1984-1990
Data Processing Electrical Eng Instrument Eng
No of firms 1984Irish16
Foreign34
Irish112
Foreign100
Irish22
Foreign39
1990 25 31 163 128 34 47
Average No. 1984 13 182 26 137 11 178per firm
1990 21 222 30 133 12 39
Net Output 1984 32 91 16 32 13.2 27per person (£000)
1990 42 141 20 59 26 48
(Source: Census of Industrial Production, 1984,1990)
The number of indigenous firms has increased in all sectors, and where the number of
MNC's has grown the growth in numbers of indigenous companies has been greater.
39

The trend in size of firm (measured by number employed) has also been upwards, t but
only marginally and there is still an order of magnitude difference between size of
MNC's operating in Ireland and the size of indigenous companies.
The net output per company is a reasonable estimate of the value added per company
although in the case of MNC's it may be distorted by transfer pricing to take advantage
of Irish tax law.
Even taking this factor into account, there is still a very significant gap in the growth in
value added per person in indigenous companies when compared with MNC's in both
office and data processing and electrical engineering. However in instruments
engineering the gap between MNC's and indigenous has narrowed.
The main thrust of Government policy (discussed below) was to increase the size and
improve the economies of scale of the Irish electronics industry.
Telesis (1982) reported the average size of indigenous metal and engineering firms as
18; in 1984, the average size across the electronics/electrical sector was 21 and by 1990
this had reached 26.
3.2 The Telesis Report
The 1982 Telesis Report concluded that the Irish electronics industry was a low skill,
low tech assembly operation. The report looked at different sectors of the electronics
40

industry and compared their critical success factors with the functions which were based
in Ireland, The report argued that the electronics industry consisted of a wide variety of
business sectors with different competitive economics. It took a number of examples of
business sectors and identified their key competitive factors. These sectors were
printers, process control systems, customised and standardised integrated circuits and
mainframe computer systems. The key competitive factors for each of these businesses
is illustrated in Table 3.2.
41
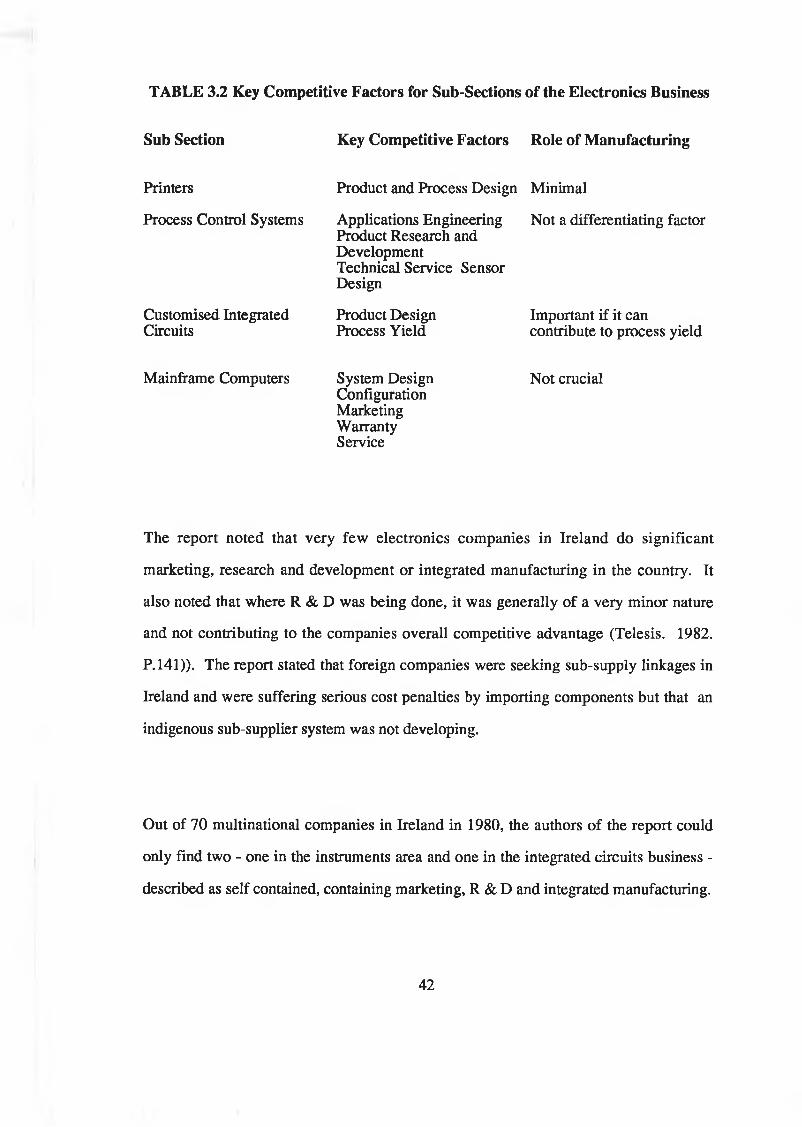
TABLE 3.2 Key Competitive Factors for Sub-Sections of the Electronics Business
Sub Section Key Competitive Factors Role of Manufacturing
Printers
Process Control Systems
Customised Integrated Circuits
Product and Process Design Minimal
Applications Engineering Not a differentiating factorProduct Research andDevelopmentTechnical Service SensorDesign
Product Design Process Yield
Important if it can contribute to process yield
Mainframe Computers System DesignConfigurationMarketingWarrantyService
Not crucial
The report noted that very few electronics companies in Ireland do significant
marketing, research and development or integrated manufacturing in the country. It
also noted that where R & D was being done, it was generally of a very minor nature
and not contributing to the companies overall competitive advantage (Telesis. 1982.
P.141)). The report stated that foreign companies were seeking sub-supply linkages in
Ireland and were suffering serious cost penalties by importing components but that an
indigenous sub-supplier system was not developing.
Out of 70 multinational companies in Ireland in 1980, the authors of the report could
only find two - one in the instruments area and one in the integrated circuits business -
described as self contained, containing marketing, R & D and integrated manufacturing.
42

The main thrust of the reports recommendation was to shift Government support from
multinational companies to indigenous companies and from capital support to areas
such as product and process technology, overseas marketing, skills development and
applications engineering. The report included 13 recommendations but in presenting
them, advised that the "philosophical approach, institutions and policies associated with
our industrial development are fundamentally sound", (Telesis. 1982. P.35), and
introduced its recommendations as a means to "improve an already excellent effort".
Between 1960 and 1980, Government policy had been a model of outward looking
policies (O'Malley. 1989. P.72). The Telesis Report supported this policy and some of
its recommendations reinforced it, such as, a sharp reduction of grants given to
indigenous companies for non traded businesses and a substantial increase in funds
devoted to the developments of indigenous export businesses. The report did not
advocate Government protection of any industry, but it did argue in some of its
recommendations for more specific Government intervention. Recommendation 4
advised the building of structurally strong Irish companies through direct intervention
and support by semi-state organisations for companies they had identified as potential
winners, while recommendation 5 suggested that the Government should encourage
existing large indigenous companies to participate more in traded and skilled sub
supply businesses in Ireland. Recommendation 10 suggested that the Government
should intervene directly with trade associations and encourage them to get involved in
the areas of product and process design and various aspects of overseas advertising,
marketing and distribution. The change of focus from support for foreign direct
investment to support for indigenous companies also represented a change towards a
more interventionist policy.
43

The changes recommended were relatively mild but the report did represent a serious
questioning of Ireland's reliance on a non-interventionist outward looking policy in the
promotion of industrial development.
The failure of this dependence was more thoroughly analysed by O'Malley (1989). He
argues that outward looking policies would fail for latecomers because of the barriers to
entry. These include economies of scale, product differentiation advantages, capital
requirements of late entrants, proprietary technology, experience curves, access to
distribution channels and customer switching costs. Foreign direct investment donesn't
provide a complete solution because, according to O'Malley it happens on a relatively
small scale and it has been concentrated in certain types of activity, usually
technologically undemanding, very often relatively labour intensive and usually
employing few highly skilled people.
In all sectors of the electronics industry product design is one of the key success factors.
Good product design results from the successful implementation of new innovation.
This innovation is usually the result of well managed and adequately funded research
and development. The Telesis Report commented on the low level of research and
development in the Irish electronics industry and recommended that Government policy
and the IDA's implementation of this policy be modified so that R & D in both
multinational and indigenous Irish companies was encouraged.
The Science Policy Research Centre at UCD carried out a study of the Irish electronics
industry in 1981 (O'Brien. 1985). This report identified the lack of R & D being carried
out in the industry as being the main obstacle to self sustained growth within the
industry. It identified three separate approaches that might employed to achieve this.
44
The first, the attraction of multinational firms, it found (as did the Telesis Report) to be
inadequate for building up the type of base required.
The second, the creation of a Silicon Valley type process it considered unlikely to
succeed because of the low level of R & D being carried on and the lack of appropriate
skills base.
The third option, which is recommended was the creation of large national champions
with their required economies of scale and their protection as infant industries until they
developed international competitiveness. However, this option was accepted as
difficult to implement because of the openness of the Irish economy.
A report prepared by the NBST on the Microelectronics industry in Ireland (ICA
Information. 1985) looked not just at the electronics industry itself but also at a
potential applications of microelectronics in different sectors. The report produced
sixteen recommendations, six of these were related to training in the areas of
microelectronics, four related to increased support and promotion of R & D activity,
two related to the development of the telecom system and one each to the creation of
increased industry awareness of microelectronics, the development of indigenous
industries, and the development of service industries in software.
The report consisting of 3 volumes represented a comprehensive guide to opportunities
in microelectronics in Ireland.
45
3.3 Changes in Outward Looking Policies
3.3.1 Passive to Interventionist
During the 1960s and 70s, the Irish Government maintained almost classic outward
looking policies in the promotion of Industry . New Grants, tax concessions and
advisory services were introduced to promote exports and legislation was changed to
encourage investment in export industries by foreign multinational firms. In the 1960's
steps were taken to dismantle protection and return to free trade (O'Malley. 1987. P.
Following the publication of the Telesis Report , Irish Government policy became
slightly more interventionist. It took active steps to promote research and development
in both multinational and Irish companies and to develop the technical and marketing
capabilities of indigenous companies. Technology development was encouraged by the
establishment of institutes such as the Microprocessor Applications Centre, The
National Microelectronics Research Centre. Coras Trachtala actively participated in the
promotion of specific Irish companies abroad.
A report published in 1985 by the Sectoral Development Committee (SDC) (Sectoral
Development Committee. 1985), recommended that the State industrial promotion and
advisory agencies should identify market opportunities within specific sub sectors and
should actively support larger firms in exploiting these opportunities and should support
new market opportunities and promising new technologies by focusing existing
technological supports and resources on them. The report also recommended that the
Confederation of Irish Industry (CII) should establish technology committees as part of
their industry federations.
46

This report also looked specifically at the electronics industry. In its conclusions it
noted that compared to the Irish level, R & D in electronics was high but low compared
to international competition. It also noted that while the overall level of Government
support for the industry R & D was 15% of total expenditure, the indigenous R & D
performing companies received 26%. This preferential treatment of indigenous
electronics R & D performing companies was maintained throughout the '80s. and
represented a more interventionist approach on the part of the Government.
The Sectoral Development Committee Report also noted the need for firms to achieve
sufficient size to support their R & D activities at an adequate level.
In his 1987 ESRI paper O'Malley (1987), focused on the need to develop companies
with adequate size in order to compete internationally. In its policy recommendation
this paper proposed that "the State could play a more active role in developing selected
target industries in a number of different ways".
The report also identified a number of industries in which it thought Ireland could
compete. The conclusions it reached on the type of industries to set up were basically
what was left after it went through a series of exclusions. These exclusions were:
(1) very large scale activities
(2) capital intensive industries
(3) industries in which low wages provide a distinct competitive advantage.
It then suggested the industry should have strong growth potential and that a group of
related industries rather than a single industry should be developed. For the electronics
47
engineering industry it reccommended instrum ent engineering but this
reccommendation was not shown to meet the growth and related industry criteria.
This report found that the number of small firms in the electronics and engineering
industry had grown rapidly "indicating considerable entrepreneurial initiative and an
ability to take increasing advantage of the more accessible opportunities". By
international standards, it found "that there is a marked lack of technology intensive
industries in indigenous engineering".
It was this type of analysis which laid the basis for the 'Strategy for Irish Owned
Electronics Industry' (Department of Industry and Commerce. 1989). This policy
document outlined a much more interventionist approach from Government. The
objectives of this strategy were:
(1) the creation of a number of companies with annual sales of £20m +
(2) the development of a large number of medium sized companies with
annual sales of £5m and
(3) maintaining the existing level of small start-ups.
The priorities however, it stated, had to be those of 1 and 2.
The new strategy included exceptional support packages "including support for
marketing initiatives in terms of new market support services and financial assistance
for marketing drives, financial and other support for increasing management capabilities
especially in the areas of international marketing and quality and infrastructural
technical support by the establishment of centres of excellence concentrated on the
identified needs of developing companies, significant levels of financial support for
48
market orientated product development, financial and other support for technology
transfer." (Dept, of Industry and Commerce. 1989)
To carry out these plans an interagency electronics team made up of IDA, CTT, Eolas
and SFADCO was put in place with participation from the Department of Industry and
Commerce.
In pursuit of this policy, a number of companies were targeted for special development
and investment capital was made available from semi state organisations.
On a national level, the most spectacular development was that of Team Aer Lingus.
In the electronics sector, Hormann Electronics in Cork received substantial investment
from the ESB and Advanced Microelectronics in Sandyford were provided with
substantial indirect support.
A joint venture between Aer Lingus and the ESB to develop and manufacture EMI
shielded plastic was established as Top Tech.
A significant investment in technology development was proposed and carried out as
part of the 1989 - 1993 Structural Programme for industrial development (Gorvemment
of Ireland. 1990). This was part of the European Regional Development Fund
expenditure.
Expenditure for the programme is classified into sub-programmes, e.g. Inward
Investment, Marketing Development.
Each sub-programmesme is further broken down into 'measures'.
49
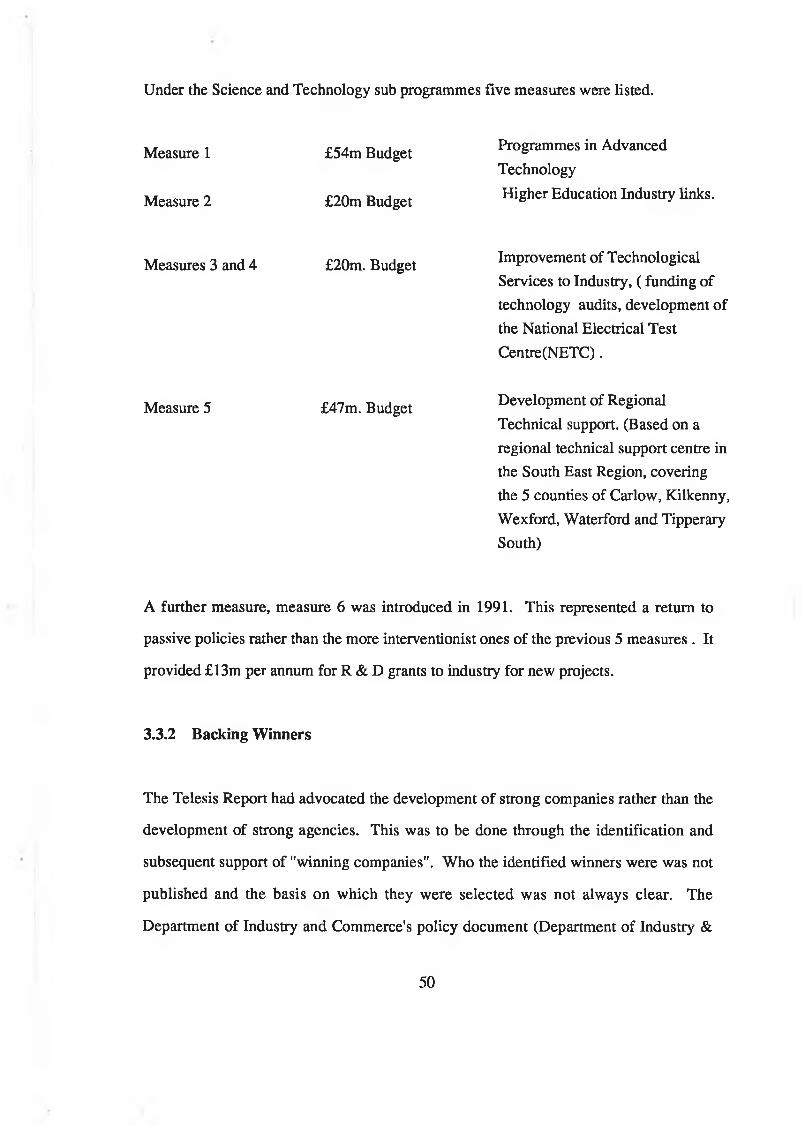
Under the Science and Technology sub programmes five measures were listed.
Measure 1
Measure 2
£54m Budget
£20m Budget
Programmes in Advanced TechnologyHigher Education Industry links.
Measures 3 and 4
Measure 5
£20m. Budget
£47m. Budget
Improvement of Technological Services to Industry, ( funding of technology audits, development of the National Electrical Test Centre(NETC).
Development of Regional Technical support. (Based on a regional technical support centre in the South East Region, covering the 5 counties of Carlow, Kilkenny, Wexford, Waterford and Tipperary South)
A further measure, measure 6 was introduced in 1991. This represented a return to
passive policies rather than the more interventionist ones of the previous 5 measures . It
provided £13m per annum for R & D grants to industry for new projects.
3.3.2 Backing Winners
The Telesis Report had advocated the development of strong companies rather than the
development of strong agencies. This was to be done through the identification and
subsequent support of "winning companies". Who the identified winners were was not
published and the basis on which they were selected was not always clear. The
Department of Industry and Commerce's policy document (Department of Industry &
50
Commerce. 1989), identified a number of product technology sectors in which it felt
considerable opportunities for development existed. These sectors covered a broad
range of the electronics industry including Optoelectronics, Sensors, Electromagnetics,
Automation and Measurement, Control and Telecommunications network interfacing
products. Each of these categories has a large number of sub categories, yet some of the
companies known to have been targeted did not come from these sectors.
IDA Executives implementing this policy are faced with a number of problems:
(1) winners must be chosen from the existing population of companies
(2) each IDA region must have its own quota of winners
(3) the choice must be based on measurable data rather than on for example
an assessment of competence of the management.
In its 1992 Annual Report, the IDA (1992) still viewed its company development
programme as a key factor in indigenous company development, "throughout the 1980s
the programme expanded in scope to become the IDA's modus operandi in its work
with Irish companies". The programme requires more intense involvement by the State
agencies in the companies activity.
3.4 Analysis of the Irish Electronics Industry using the Porter's Diamond
Model
3.4.1 The Porter Model
Michael Porter proposed that the competitive advantage of nations was determined by
four factors (Porter. 1990) each of which formed a comer of a diamond (figure 3.1).
He demonstrated the effectiveness of his model as an analytical tool in examining the
51

Fig 3.1 Porter's Diamond Model of National Competitive Advantage

competitive position of companies in ten advanced nations - Denmark, Germany, Italy,
Japan, Korea, Singapore, Sweden, Switzerland, the United Kingdom and the United
States. Porter's basic thesis is that the competitive advantage of companies is derived
from their national roots and that these advantages are determined by the four factors.
Porter, acknowledges in his work that other factors can have an influence on his
determining factors. Among these he includes chance and the role of Government. He
analyses in detail the effect that Government policy can have on these determining
factors. Porter also accepts social and political history and cultural norms can play a
role in the competitive advantage of many industries. Mjoset (1992) argues that if
determinants are determined by other more encompassing factors, the latter factors
should figure as the starting point of the explanation.
One of the reasons Porter puts forward for not including the role of Government as a
determinant is that it is not "useful". The major attraction of Porter's model, despite its
limitations is the fact that it is very useful. The four factors which determine the
competitive position of a nation in a particular industry are
(1) Factor conditions
(2) Related and supporting industries
(3) Demand conditions
(4) Firm strategy, structure and rivalry
53
The Diamond model implies there is no hierarchy among these determinants and they
interact with one another in providing competitive advantage for a nation. It provides a
framework for analysing the performance and potential of an industry sector.
3.4.2 Factor Conditions
Factor conditions would traditionally have been seen as the major source of competitive
advantage for nations, eg coal in the UK, steel in Sweden, capital in the USA and low
cost labour in Japan and the Far East. Porter classes these factors as basic factors and
argues that they provide the basis of only a limited competitive advantage. More
important are what he considers advanced factors. These would include - modem
communications networks, high standards of education, availability of highly skilled
people and research institutes.
It is only advanced factor conditions which are of relevance to the electronics industry.
These are the availability of advanced telecommunications networks, the availability of
appropriately skilled personnel and University and Research institutes working in
related disciplines. Ireland's telecommunications system is one of the most advanced
networks in Europe, (Industrial Policy Review Group. 1992. page 46). A digital
switching network was introduced in 1980 and this system has been progressively
upgraded since then through the use of optical fibre cable systems. This system can
now provide video conference links and high speed computer links using broadband
140 megabits transmission systems (Dwyer, 1987). Despite its technical progress
however, the Industrial Policy Review Group found that international charges were
54

higher than competitive countries and that Telecom revenue in Ireland as a percentage
of GDP was 2.7% compared with a maximum of 1.8% in other European community
member states. (Industrial Review Group. 1992. p 46-47).
In promoting Ireland as a centre for mobile international investment, the IDA have
emphasised its "the well educated workforce". They have produced a brochure showing
ads in The Irish Times placed by Scottish based companies like Wang and
Westinghouse entitled "The Best Hitech Personnel are Easy to Find, When You know
Where to Look" (Donohue. 1985).
The key reason for Intel's eventual decision to locate in Ireland according to Kieran
McGowan (McGowan. 1991), was the availability of educated skilled people. These
skilled people however, were not working in Ireland. According to McGowan, the
consultants interviewed 250 of them in Holland, Germany and the UK and 80% of those
interviewed said they wanted to return to Ireland if they could find appropriate
employment. According to the Industrial Policy Review Group "the perception of many
managers that there is not a skilled shortage may itself be part of the skills problem
facing Irish industry" (Industrial Policy Review Group. 1992). The group noted that 'in
particular there was a serious deficiency of intermediate production skills and an
absence of multiskilling both among technicians and crafts people and an absence of
integrated financial and technical skills at management level'.
The first Irish electronics research institute was theMicroprocessor Applications Centre
was set up in 1977. It was based in the University of Limerick campus and it had loose
links with the University. The support that could be offered by the centre was limited.
More recently however, the centre has demonstrated increased technical competence.
(McGowan. 1992).
55
The National Microelectronics Research Centre was established in UCC in July 1983 to
serve as a training centre in microelectronics for Irish industry and as University based
research centre for industry/university research and development projects. The centre
has worked closely with Analog Devices who have provided funding of £250,000 per
annum (Hanna. 1983). As it developed the centre relied more and more on European
Framework Programme Funding and by 1990 was involved with only three projects for
Irish based companies (NMRC 1990). European Framework Programmes, in particular
the ESPRIT programme has provided funding for the development of a number of
research institutes in Ireland between 1984 and 1989. These include Thin Film
Magnetics Facility in Limerick, Computer Integrated Manufacturing Centre in Galway,
Computer Vision and Microelectronics Computer Programming Centres in Trinity
College and a software development centre in DCU. From 1989 under the first
Framework Programme funded from European Community Structural Funds,
significantly increased funding was provided to the Higher Education Sector for the
development of Programmes in Advanced Technology (PATs). Six of these
Programmes have been set up - three of them Optronics, Telecommunications and
Power Electronics are directly involved in the development of the electronics industry
and two others - Advanced Manufacturing and Advanced Materials Development have
the potential to make a significant contribution to the electronics industry. The
effectiveness of these Programmes in institutions will be analysed later. However, they
do provide Ireland with a source of highly trained graduates necessary to be competitive
in the electronics industry.
56
3.4.3 Related and Supporting Industries
The national competitive advantage in one industry can be supported by related and
supporting industries in that country when they are internationally competitive.
Supporting industries can supply both components and capital goods. Related
industries will use the same supplier base thereby contributing to its growth and
competitiveness. The most important benefit that accrues to these clusters of industries
is that they participate in the process of innovation and upgrading of one anothers
products and components. When they are located in the home market, they are more
visible and communication is easier between them.
The electronics industry in Ireland includes sections of the information technology
industry, telecomms industry, industrial control, security and building related industries
(see figure 3.2). These sections are inter related and in many cases mutually supporting
as shown in the figure.
There has also developed in Ireland, a number of industries as suppliers to the
electronics industry. These include a metal working industry, plastic extrusion, wire
harnessing and printed circuit board manufacturing industries. These industries are
predominantly indigenous.
In the electronics industry supply chain, indigenous companies are concentrated in the
low tech component supply area while foreign multinational companies are dominant in
the higher tech areas.
57
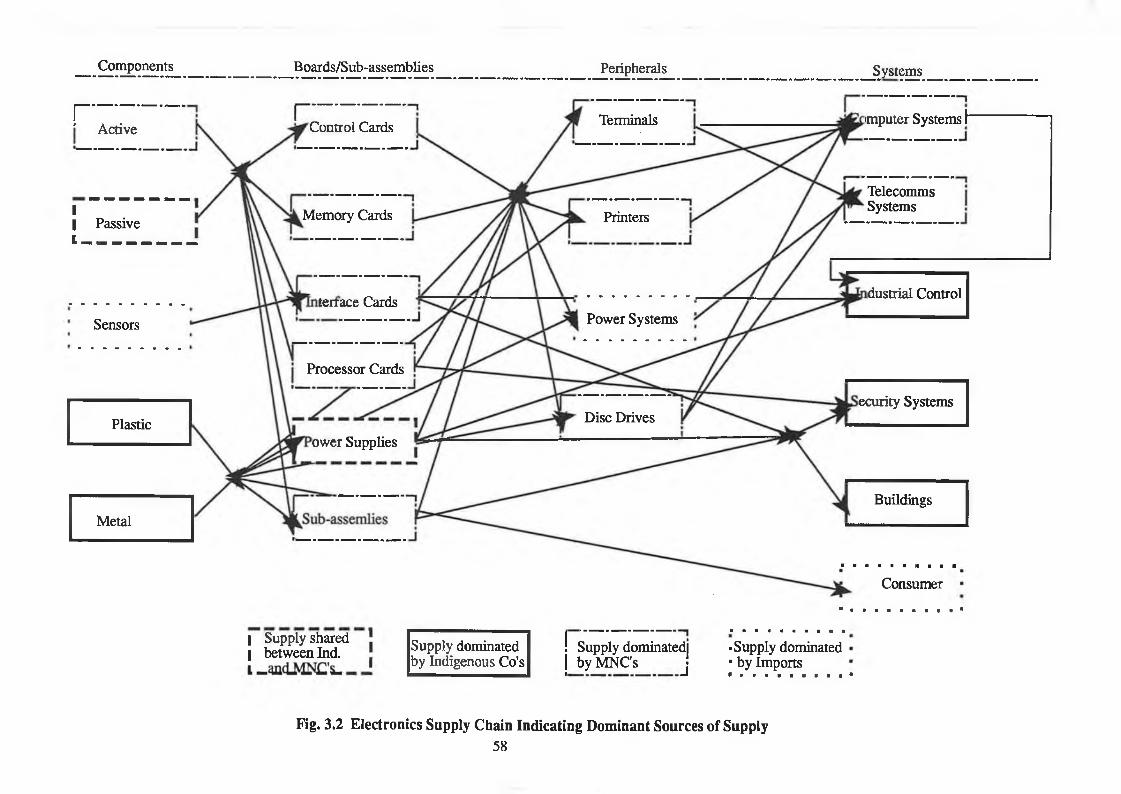
imputer Systems ïTerminais
TelecommsSystems
Printers
Power Systems
Disc DrivesPlastic
MetalBuildings
Consumer
Components Boards/Sub-assemblies
II Passive I ____
Sensors
Processor Cards
ower Supplies
dustrial Control
!----------Active
Peripherals
Memory Cards
terrace Cards
ecurity Systems
Control Cards
Systems
I Supply shared I between Ind. Supply dominated
by Indigenous Co's
I ■ - —- ■ — - - - • • ■ « * ■ ■ ■ ■ •
! Supply dominatedj -Supply dominatedj by MNC's j ■ by Imports
Fig. 3.2 Electronics Supply Chain Indicating Dominant Sources of Supply58
The sub suppliers with Irish origins will generally not be operating at world class
standards and would not be considered in Porter's terms internationally competitive,
while in almost all cases the multinational sub suppliers would be. The few that are R
& D intensive lack the economies of scale to be price competitive.
In the case of multinational sub suppliers to final equipment manufacturers, the supply
relationship is usually one that has already been established in the US or Japanese
market and has been transferred to Ireland to meet the requirements of world class
manufacturing and overcome the disadvantage that a large distance from the equipment
manufacturer would entail for the supplier. An example of this type of relationship is
that which exists between Apple Computer in Cork and many of its sub suppliers. Sub
suppliers that have relocated in Ireland include - Alps as manufacturers of keyboards,
Logitech as manufacturers of mice and Quantum as manufacturer of disc drives. The
first two companies have located close to Apple in Cork and the third is located in
Dundalk. Located next to Quantum in Dundalk is their major component supplier,
Matsuhitu of Japan. All of these companies are internationally competitive and have
technology and marketing advantages which are in not linked in to the Irish economy.
Apple has encouraged the establishment of local indigenous companies as suppliers in
low technology areas such as printing and electronic assembly and as manufacturers of
computer related add-ons.
There is very little multinational manufacturing presence in Ireland in capital equipment
supply to the electronics industry. Most of this equipment, such as wave solder
machines, automatic pick and place machines and surface mount equipment is
59

imported. It is also in this area, particularly in specialised test equipment that a number
of indigenous Irish companies have become internationally competitive. These
companies operate in industries where the same economies of scale don’t apply and
have achieved their competitive position through their R & D activity.
In the security systems, buildings, process control and sensors sectors of the electronics
industry, a cluster, linked primarily to indigenous companies exists.
Of the 96 companies listed by the Department of Industry & Commerce (Dept, of
Industry & Commerce. 1989), 21 were involved in these sectors. These sectors are
closely linked in terms of technology, markets and share similar economies of scale.
Thirteen of these companies are still trading and of these 11 received IDA R & D
grants. Of the 8 who failed only one received an R & D grant and that was less than
£5,000.
A further 2 companies (Microsol and Edpac), that were not listed have become
internationally competitive since then, both of whom have received more than £50K
IDA R & D grants.
A similar cluster is developing in the power supply/magnetic component sector (a
subsection of the boards/sub assembly sector and passive components sectors).
60
6 of the 1989 Department of Industry & Commerce list were involved in this area, 2 in
power supplies, 1 in power supply testing and 3 in transformers. All 3 power supply
companies are still trading and have received IDA R & D grants, 2 of the transformer
companies are still trading and since 1991 both have undertaken R & D projects.
The power supply industry is fragmented worldwide with no company holding more
than 4% of the $1600 million European market. It has not been possible for economies
of scale to be achieved in the manufacture of power supplies nor of transformers which
represent their principal component cost.(Frost and Sullivan. 1991)
Some MNC's have been integrated with this cluster (Computer Products and Delaire)
and one further internationally competitive indigenous company has been established
since then.
3.4.4 Demand Conditions
Porter breaks demand conditions into three segments:
(1) Home demand composition
(2) Demand size and pattern of growth
(3) Internationalisation of domestic demands
For maximum impact on international competitiveness the composition of home
demand should include segments which are bigger and more advanced than the
corresponding segment on the world market.
61

Buyers should be demanding and sophisticated requiring product and service mix not
yet available on the international market and home buyers should also be early
adopters of new products and services which will eventually come to be demanded
elsewhere.
For home demand size and patterns of growth to provide competitive advantage, the
size of the home demand needs to be adequate to justify early investment decisions
because home demand is more certain and easier to forecast than foreign demand. The
absolute size of home demand is not that important provided economies of scale can be
met by the international market.
The number of independent buyers should be high because the more buyers there are,
the greater impact different users will have on product design and final configuration.
The rate of growth of home demand should be high. This will encourage firms to invest
in new equipment and adopt the latest technology and invest in further innovation. If
the home demand saturates early, it provides an impetus to the firm both to develop
new products for the home market and to export. Early saturation also forces increased
competition between competitors on the home market thereby further sharpening them
for international competition.
62
The internationalisation of the domestic demand is presented by Porter as a particularly
American phenomena whereby US buyers world-wide seek US hotels, rent a car and
fast food companies. Equally, US companies locating plants abroad tend to seek their
US sources of supply thereby encouraging them to internationalise.
There has been no evolutionary demand in Ireland for electronic products. During the
period of protectionism, 1929-1951, industrial employment grew from 109,000 to
226,000 (O'Malley. 1989. page 59). This pattern of industrial growth according to
O'Malley, was typical of what is commonly called the easy stage of import substitution.
The greatest increase in relative size was in clothing and footwear with lesser increases
in textiles, clay, glass and cement.
63
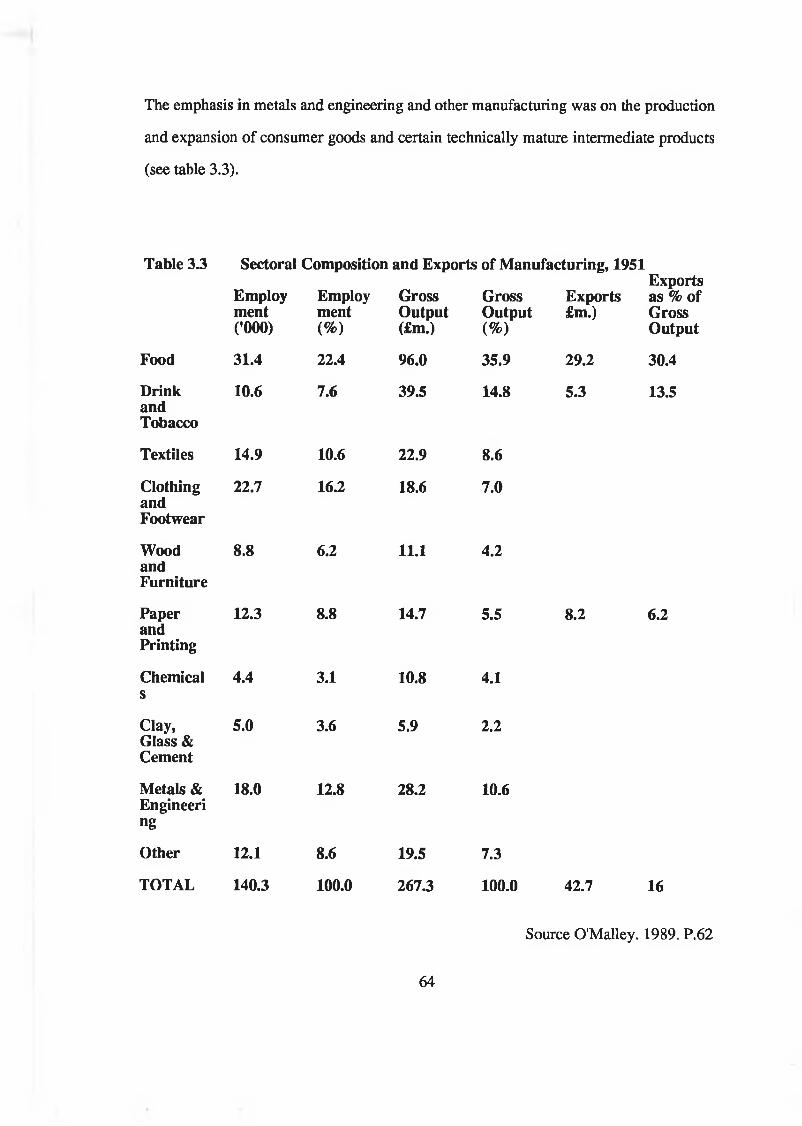
The emphasis in metals and engineering and other manufacturing was on the production
and expansion of consumer goods and certain technically mature intermediate products
(see table 3.3).
Table 3.3 Sectoral Composition and Exports of Manufacturing, 1951Exports
Employment0000)
Employment(%)
GrossOutput(£m.)
GrossOutput(%)
Exports£m.)
as % ofGrossOutput
Food 31.4 22.4 96.0 35.9 29.2 30.4
DrinkandTobacco
10.6 7.6 39.5 14.8 5.3 13.5
Textiles 14.9 10.6 22.9 8.6
ClothingandFootwear
22.7 16.2 18.6 7.0
WoodandFurniture
8.8 6.2 11.1 4.2
PaperandPrinting
12.3 8.8 14.7 5.5 8.2 6.2
Chemicals
4.4 3.1 10.8 4.1
Clay, Glass & Cement
5.0 3.6 5.9 2.2
Metals & Engineeri ng
18.0 12.8 28.2 10.6
Other 12.1 8.6 19.5 7.3
TOTAL 140.3 100.0 267.3 100.0 42.7 16
Source O'Malley. 1989. P.62
64
Even with this growth, Ireland still had only 17.9% of the economically active
population engaged in industry (O'Malley. 1989).
This industrial structure was unlikely to create the type of demand necessary to create or
encourage the development of the electronics industry. With the adoption of outward
looking policies, and the establishment of a large number of sophisticated multinational
electronics companies in Ireland, between 1960 and 1990, the demand for an Irish based
sub-supply industry has been created. The Telesis Report as already noted commented
on the lack of an indigenous sub-supply industry which was causing many of the
multinational companies to suffer serious cost penalties. (Telesis P. 140). Large
electronics companies, such as Digital and Apple spend 90% of their production costs
on materials. Meeting the required standards is generally far harder than most Irish
component suppliers realise and where suppliers cannot be found, the Industrial
Development Authority actively seeks to attract component suppliers from abroad.
(McGowan. 1992). Indigenous companies have been successful in meeting sub-supply
requirements in low tech areas such as printed circuit boards, cable harnesses, metal
enclosures and plastic enclosures.
Products requiring research and development capability such as disc drives, printers,
electronic component and monitors are supplied by Irish based multinational
companies.
Multinational companies are sophisticated and demanding and will only source their
components in Ireland if they can meet world class standards. The IDA are now
focusing on Japan as a source of new green field investment in Ireland and already Irish
65
companies are finding that Japanese standards for sub-suppliers are even higher than
those for US companies.
One of the problems of depending on multinational buyers located in Ireland is that
these buyers needs have already been met on the international market and Irish
companies hoping to develop an international market will always be coming from
behind.
The size of demand for electronics sub-supply in Ireland is significant. The IDA
estimate that there is around one billion pounds worth of purchases made each year
from non-Irish suppliers. Currently 10% of the materials requirements for large
computers are sourced in Ireland and between 20% and 25% of those of PC
manufacturers (McGowan. 1992).
Multinationals purchasing offices act independently and they represent a good cross
section of electronics industry .
The demand conditions in the Irish electronics industry are conducive to the creation of
competitive advantage but in general because of a lack of technical skills and product
development from indigenous companies this demand in the hitech areas has been met
by foreign companies locating in Ireland. Indigenous companies have been more
successful in the development and supply of capital equipment to these companies and a
66

small number of Irish companies are internationally competitive in the supply of test
systems.
3.4.5 Firm Strategy Structure and Rivalry
National advantage occurs in a particular industry if there is a good match between the
strategies and structures of firms within the industry and the other sources of
competitive advantage for that particular industry. The structure of firms relates to how
they are organised. The form of organisation can be determined by the national legal
system and by inherited cultural norms. The firms strategy and goals will be to some
extent determined by its structure, particularly its form of ownership. For example the
strategy of German firms who are owned by institutions and Banks will usually
undertake long term investment with corresponding long term payback. This strategy
has worked in the chemicals industry in Germany. On the other hand Italian firms are
usually privately owned and the shorter life cycles of the textile industry are more
appropriate for their payback requirements.
The motivations of individuals who work in and manage firms can also impact their
competitive advantage. This difference is very apparent between the UK or Ireland and
Germany or Japan, where a national preference for liberal arts and administrative skills
in the former can be contrasted with the preference for technical skills in the latter. This
national preference in the former is is not conducive to the development of national
competitive advantage in the electronics industry nor to the encouragement of electronic
R & D activities in this industry.
67

Porter found in his work that the closest association existed between the persistence of
competitive advantage in industry and vigorous domestic rivalry. Domestic rivalry
creates pressures to innovate and upgrade. It supports the establishment of supporting
and related industries. Domestic rivalry forces companies to employ national
advantages with ever increasing efficiency. Without domestic rivalry competitive
advantages tend to be relied on and employed with less efficiency.
The electronics industry serves in general a global market or at minimum a Western
European market. Electronic distribution companies and manufacturers' sales
organisations usually see the UK and Ireland as a single territory. The Irish market is
therefore very small to allow for any significant degree of inter firm rivalry between
electronic business operating out of Ireland. There has also been the belief in Irish
industry that industrial enterprises were entitled to grants (Industrial Review Group
1992). The IDA in providing grants try to ensure that it wasn't contributing to over
capacity in any industry. The result of this is that the first entrant into a particular
product area tended to be left unchallenged by competing Irish enterprises and when
competitiion does arise such as in the PCB industry, security equipment and sections of
the metal work industry, each competitor has tended to carve out an area for himself
where he remains unchallenged. The overall result is that even when the size of the
country and the market for electronic equipment and components is taken into account
inter firm rivalry in Ireland is very low.
68

3.4.6 Conclusions of Porter Analysis
Underlying the competitive advantages provided by Demand conditions, related and
supporting industries and inter-firm rivalry is the industries' capacity to innovate and it
is this capacity that is enhanced by advanced factor condition.
For companies in the electronics industry to be responsive to demand conditions, they
must have the technical capability to meet this demand: to participate in the innovation
process with supporting and related industries, they must be able to innovate.
Competitive advantage in almost all markets in electronics is provided primarily
through technology. The availability of advanced factors is both enhanced by and
enhances the national R & D capability.
While Ireland may appear to score reasonably well in 3 of the 4 factors determining
national competitive advantage in electronics, it needs a strong R & D capability to take
advantage of this and it is through this R & D capability that it can create the fourth -
strong firms with inter-firm rivalry.
It is in this context, where, having identified the problems one needs to look for a
framework of solutions, that the analysis carried out by Mjoset (1992) is most useful.
His criticism of Porter outlined above suggested that if the four determinants were
determined by more encompassing factors, then it should be these factors which are
sought.
69

3.5 National Systems of Innovation
A national system of innovation has been defined as "the institutions and economic
structures which affect the rate and direction of innovative activities in the economy"
(Edquis and Luundeval. 1992) The national system of innovation concept is a
development of Schumpeter's economic analysis which sees Schumpeter's original
heroic entrepreneur and his later large corporation being replaced by a number of
institutional features both inside and outside the enterprises. Denmark's agro industrial
complex is usually presented as the classical form of a national system of innovation
that works effectively.
There is no prescribed national system of innovation. Its key feature is interactive
learning whereby individuals and organisations increase their technical knowledge
through interacting with one another rather than by independent research. This concept
is similar to Porter's demand conditions but places the buyer supplier relationship on a
more co-operative basis than Porter's model suggests. This type of relationship between
buyer and supplier is now recommended practice in manufacturing operations
(Schoenberger 1986).
National systems of innovation also recognise the importance of advanced factors and
see a central role for Government in their creation. This analytic approach in line with
Schumpeter sees innovation as the primary engine of economic growth. It recognises
several key elements in this process. It recognises that their interdependence is related
to the nations culture, habits and institutions. Essential to this approach is that these
various elements combine to form a system. If these elements are inter-related in such a
70

way as to enhance one another such as in the Danish Agro Industrial Complex, one has
an effective national system of innovation.
In Scandinavia, these systems have contributed to economic and social development..
High levels of social justice and equality form virtuous circles where the various
elements interact with economic factors and mutually support one another within those
circles. The more elements that can be combined within a circle or interacting circles
the greater the well-being of the community.
In his study of the Irish economy, Mjoset (1992) distinguishes between economic
growth and socio economic development. The latter includes, in addition to simply the
growth of output other conditions necessary for the fulfilment of human needs, such as
the abolition of poverty and the provision of work for most of the labour force. He
characterises the Western world in general with having socio economic development
while the third world would be characterised by growth without development. He
places Ireland between these two types.
In comparing Ireland with five contrasting countries, that is five European countries of
similar size and population - Austria, Denmark, Finland, Sweden and Switzerland he
identifies Ireland's fundamental problem as a weak national system of innovation. This
weak national system of innovation is maintained by what he terms a vicious circle
illustrated in figure 3.3.
71

Fig. 3.3 Ireland's Basic Vicious Circle (Source Mjoset,1992 ,p.7)
72

The major reinforcing factor of this vicious circle is emigration, which has been a
feature of Irish life since famine times. This fundamental circle is further reinforced by
more specific circles which are linked to it. These are illustrated in figure 3.4 and 3.5.
Figure 3.5 illustrates the impact of the outward looking policies adopted in the late
1950s.
In this the basic vicious circle is reinforced by an industrialisation vicious circle.
The elements of the basic vicious circle remain - a weak system of innovation increases
the risks of unemployment and poverty, encouraging people to emigrate. Emigration
strengthens the pastoral agricultural bias, reduces the size of the home market and
weakens the drive to innovate.
This weak innovation system allows for the diffusion of only the consumer and not the
production elements of the "American way of Life" This weak indigenous industrial
structure further strengthens the existing social structure and doesn't encourage the
foreign owned companies to integrate into the economy or participate in joint
innovation projects.
Non integrated foreign owned companies which create jobs and otherwise "mind their
own business" encourages a non interventionist policy on the part of the state.
73
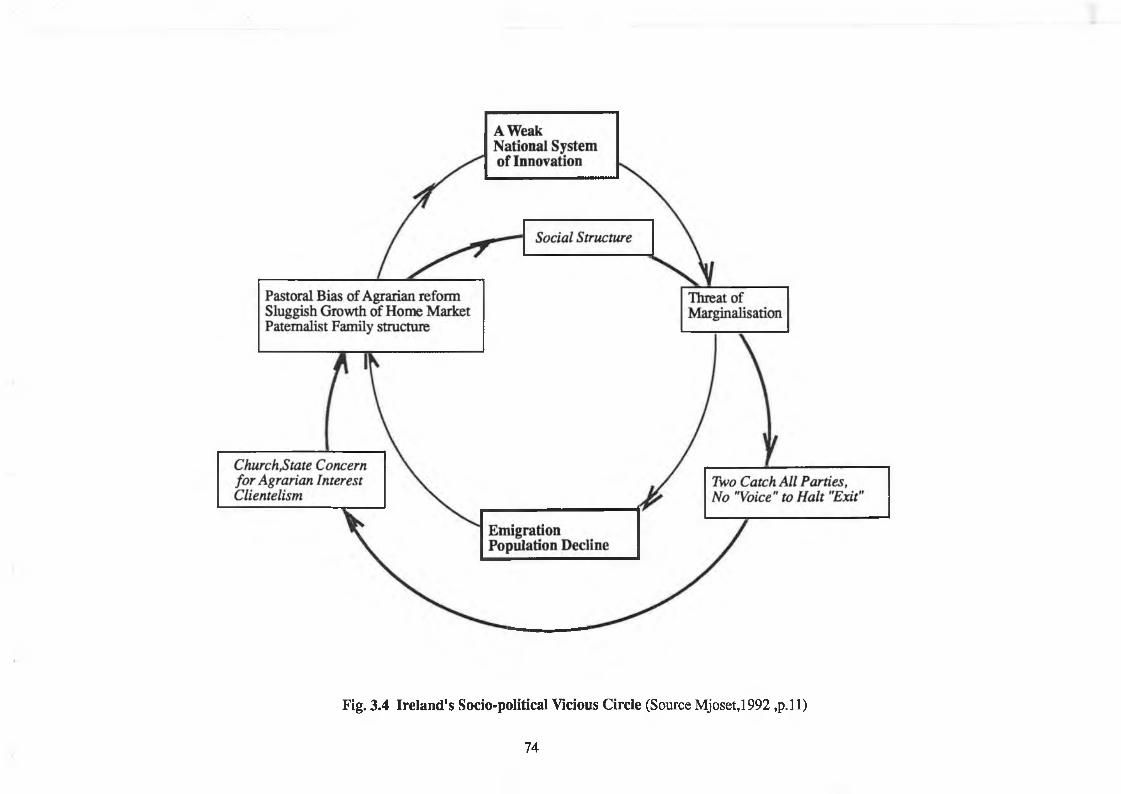
Fig. 3.4 Ireland's Socio-political Vicious Circle (Source Mjoset,1992 ,p.ll)
74
Not intervening weakens the States capacity to do so, both of which contribute to a
weak system of innovation.
The contrast countries, Mjoset argues adopted more interventionist policies and by
refusing to depend on foreign owned companies strengthened their own national
systems of innovation. The analysis carried out by Mjoset illustrates the dynamic
influence of many of the factors identified by Porter. Mjoset argues that the extent to
which these factors support national system of innovation is a key determinant of
national competitive advantage. He also illustrates a potential national innovation
system (figure 3.6). It suggests a much more pivotal role for Government in the
creation of national competitive advantage than Porter concedes and places less
emphasis on the importance of interfirm rivalry. (Mjoset. 1992 P. 120).
This figures illustrates a generic social control system that could be used to create more
innovative and effective enterprises.
It assumes the wage earners in the enterprise will be supportive of the enterprise in their
interaction with society.
This interaction will therfore result in an educational system that will generate the right
skills for the enterprise and a state policy that is itself supportive of the enterprise and
will direct the banking system to be supportive also.
75

Low State Capacity for Policy Implementation
Non-interventionist strategy of Export Industrialisation
A WeakNational System of Innovation
Non-integrated Structure of Foreign Owned firms with genorous privileges
'American Way of Life’ only partially diffused
IPastoral Bias of Agrarian reform Sluggish Growth of Home Market Paternalist Family structure
Threat of Marginalisation
Emigration Population Decline
Fig. 3.5 Industrialisation Vicious Circle (Source Mjoset. 1992. P. 13)
76

Fig. 3.6 Potential National System of Innovation (Source : Mjoset 1992 P. 120
77
The national system of innovation 'model' is a useful framework in looking at the
impact of R & D in electronics in Ireland:
(1) It has a consistent economic foundation and is not based solely on
empirical evidence and case studies.
(2) The empirical evidence which supports it is derived from small open
economies.
(3) It recognises the dynamic effect of different factors and the importance
in how they interact.
(4) It provides a framework in which a Porter analysis can be more usefully
interpreted.
(5) It recognises the central role of innovation and R & D in economic
development - ie it looks below the surface whereas a Porter analysis
can be superficial.
Thus, an analysis of the national system of innovation in electronics requires an in-
depth study of the innovation process in the Irish electronics industry.
78
3.6 Conclusion
Government policy towards the electronics industry has maintained an outward looking
approach, encouraging exports and foreign investment in the industry.
Since the Telesis Report was published this policy has varied in its level and type by
intervention.
In the early 1980s R & D was actively encouraged in the industry while since the mid
eighties it has been less so.
Support for research institutes has also been variable. During the mid 1980s almost all
electronic research activity was dependent on ESPRIT funding. Since 1989 significant
funding has been made available for electronic research programmes in university
research centres.
A Porter analysis of the industry suggests a relatively strong industry in terms of
competitive advantage but one that lacks the innovative capability to capitalise on these
competitive advantages. The analysis has identified a number of sectors in which the
industry is strong and has highlighted the correlation between R & D activity and
survival in these sectors
The national system of innovation concept is therefore developed as a more useful
model in which to view the Irish electronics industry and the role R & D can play in its
development.
79
4 R e se a r c h a nd D e v e l o pm e n t in th e Ir ish E l e c t r o n ic s In d u st r y
80
4 R e s e a r c h a n d D e v e lo p m e n t m t h e I r is h E l e c t r o n ic s
INDUSTRY
4.1 Methodology
In reviewing the performance of Irish electronics companies the following data sources
are used:
(1) Eolas Science and Technology evaluation unit surveys of business
expenditure on R & D, 1979-1991. The methodology of this survey and
its limitations are discussed in Appendix C.
(2) The "Details of Capital Expenditure" sections of the IDA Annual reports
published as Part 2 of the IDA Annual Report since 1982.
The details of expenditure on R & D in electronics by the IDA over the
period 1979 to 1991 are included in Appendix E and the rationale for
using R & D grants received as a proxy for R & D activity is discussed in
Appendix F.
(3) The companies who had received more than £50,000 in grants over the 12
year period were compiled from Appendix E and these were used as
population for a survey of R & D intensive companies. There are 86
companies on the list (Table 4.6) and of these 55 are still in existence.
(4) Kompass, Connect, ITPA and Maid databases were used to obtain further
information on individual companies
(5) All of these companies were telephoned and asked if they would
participate in a survey on R & D support factors and inhibiting factors and
of the 55, 30 agreed to participate.
81
(6) The companies surveyed the questionnaire they were sent and details of
the responses are included in Table 4.9. 20 responses were received in
time to be included in the survey, two of these could provide no
information because they were no longer doing R & D.
4.1.1 Business Expenditure on R & D (BERD) in the Electronics Sector
Statistics published on business expenditure in R & D published by EOLAS and the
OECD are compiled using ISIC (international Standard of Industrial Calssification)
codes (see Appendix C). R & D in electronics can fall under 1 of 3 sectors; each sector
is made up of related ISIC codes.
Electrical machinery
Electronics
Instruments
The information on business expenditure in R & D (BERD) in the areas is presented in
figures 4.1 to 4.5 and the detailed data supporting these figures is presented in appendix
4. All financial data in the figures are at constant 1982 prices.
4.1.2 Electronics Sector
The electronics sector includes ISIC codes 3832 (communications and office
machinery) and 3825 (semiconductors and computers)
Figure 4.1 illustrates total business expenditure on R & D between 1979 and 1991 and
the percentage of it made up by:
1 The Electronics sector
2 Govemnment Grants
82
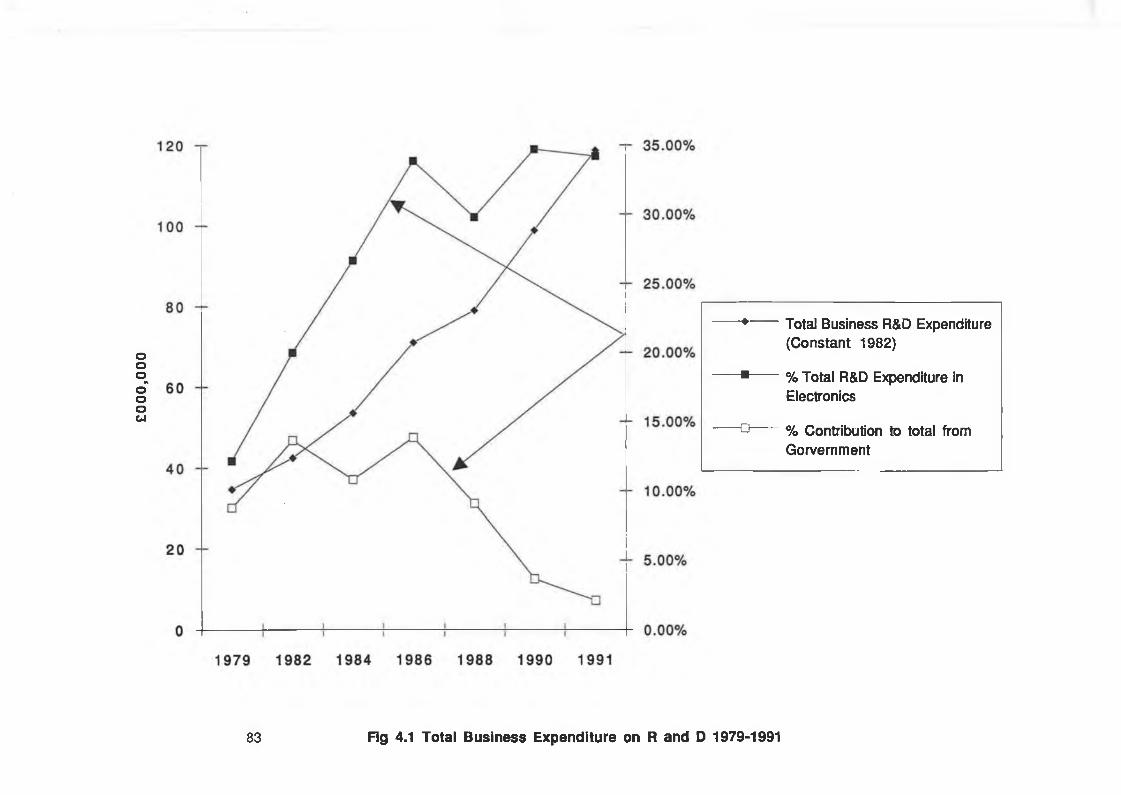
£000
,000
---- ♦— Total Business R&D Expenditure(Constant 1982)
---- ■— % Total R&D Expenditure inElectronics
---- □— % Contribution to total fromGovernment
83 Fig 4.1 Total Business Expenditure on R and D 1979-1991
Expenditure on R & D has been growing at a steady rate of 9.6% per annum over the
period in question.
Between 1979 and 1986 expenditure in the electronics sector grew from 12% of the
total to 34% by 1986.
As can be seen from Figure 4.2 this growth was entirely due to the performance of the
multinational sector.
This was the period which saw the introduction and phenomenal growth iof personal
computers and the widespread industry acceptance of the microprocessor. A number of
multinational companies set up or significantly expanded their R & D activity (Digital,
Analog Devices and Inland Motors) while others ((Prime Computer, North Star, CPT)
were set up incorporating an R & D function.
Since 1986 BERD in Electronics has grown at the same rate as the general level of
BERD. This growth both in electronics and in general has been maintained despite the
substantial decline from 15% to 1.5% in the States' contribution to the total.
Since 1979, expenditure by the indigenous sector in electronics R & D has remained
fairly steady, at between two and three million pounds per annum at constant 1982
prices.
84
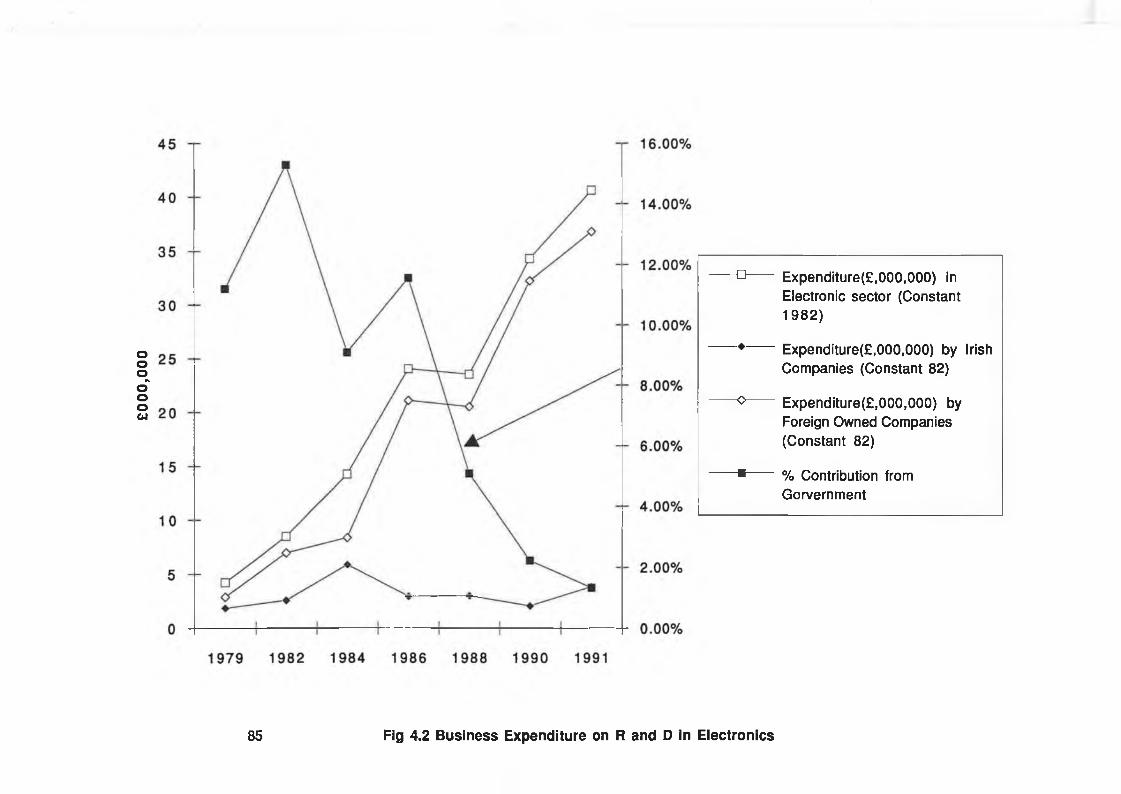
£000
,000
----- □— Expenditure^,000,000) inElectronic sector (Constant1982)
------ ♦— Expenditure^,000,000) by IrishCompanies (Constant 82)
— o — Expenditure^,000,000) byForeign Owned Companies(Constant 82)
----- ■— % Contribution fromGorvernment
85 Fig 4.2 Business Expenditure on R and D in Electronics

Fig. 4.3 illustrates the number of companies engaged in R&D work in this sector.
Here there was a sharp increase in both the indigenous and multinational sectors
between 1979 and 1984. Since then it has remained relatively stable with equal numbers
of both indigenous and multinational firms carrying out R&D work.
4.1.3 Instrument Sector
Fig. 4.4 illustrates R& D activity in the instrumentation industry.
Here, the multinational sector again predominates with the Irish indigenous R & D
effort relatively static since 1979. In this sector however, multinational spending on R
& D seems closely related to the level of Government funding provided.
A decline in spending has only occurred in 1991. This decline, while it does appear to
track Government funding with a two year log could equally be due to other once-off
factors such as the reduction in the R & D activity undertaken by Technicon or Leeds
and Northrop which occurred at this time.
8 6

No. of Formal R&D Functions (Irish)
■e No. of Formal R&D Functions(Foreign owned)
“♦ No. of firms engaged in R&D
1979 1982 1984 1986 1988 1990 1991
87 Fig. 4.3. Number of firms engaged in R and D.
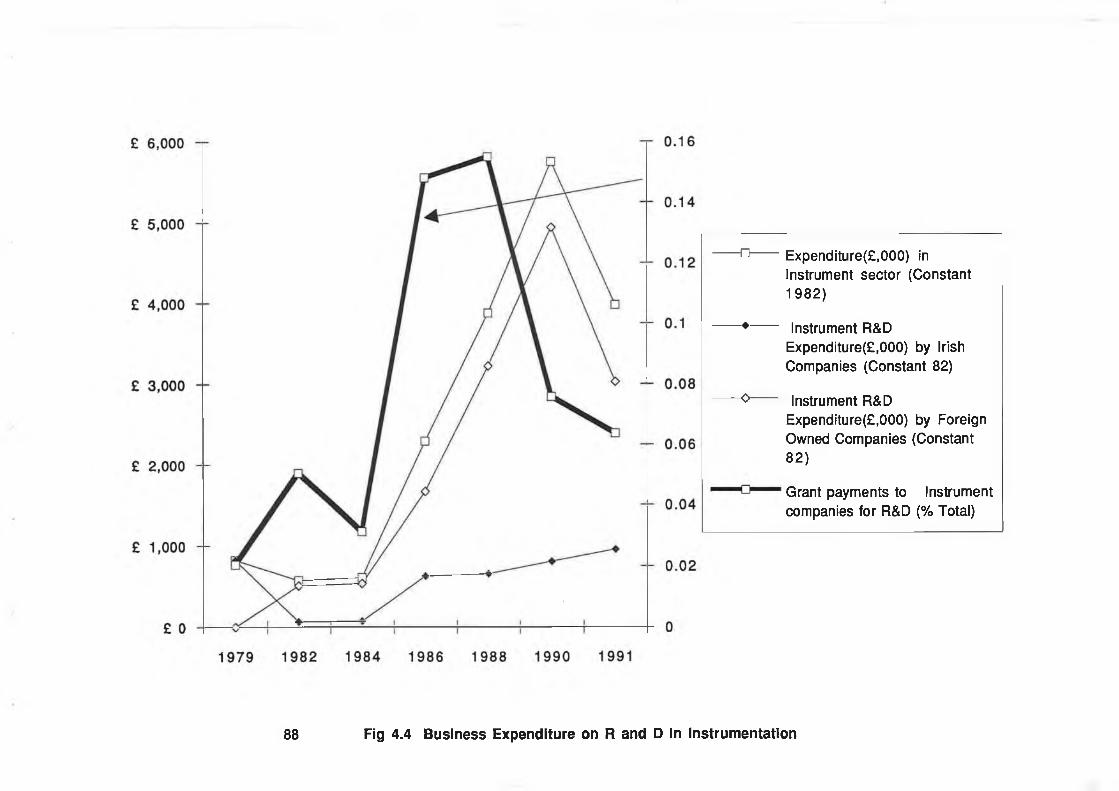
----- □— Expenditure^,000) inInstrument sector (Constant1982)
------ ♦— Instrument R&DExpenditure^,000) by IrishCompanies (Constant 82)
----- 0— Instrument R&DExpenditure^,000) by ForeignOwned Companies (Constant82)
Grant payments to Instrumentcompanies for R&D (% Total)
88 Fig 4.4 Business Expenditure on R and D in Instrumentation

4.1.4 Electrical Machinery Sector
The electrical machinery sector under ISIC 3831, includes the manufacture of electric
motors, generators and transformers and the manufacture of switch gear, switchboard
apparatus and electricity distribution equipment.
ISIC 3832 includes "manufacture of radio transformers". A company carrying out R &
D activity can only be listed under one sector and the selection is made by the R & D
evaluation unit in Eolas and not by the company.
The result is that:
(1) Much of the work in the development of motor control systems carried
out in Ireland which is essentially R & D in electronics is classified
under electrical machinery.
(2) Work in the modernisation of electrical distribution boards which again
is electronic in nature is classified under electrical machinery
(3) Transformer design work where the transformer is part of an electronic
design may be classified under electrical machinery
BERD in this area is illustrated in figure 4.5.
Indigenous companies involved in this sector are primarily involved in the transformer
and electrical switch gear areas. Of 44 companies listed in Kompass as transformer
manufacturers 42 are indigenous and 101 out of the 105 electrical switch gear listed are
indigenous.
89
Transformer manufacturers are part of the power supply cluster of companies while
manufacturers of electrical switch gear would be part of the industrial control cluster.
The growth in R & D by indigenous companies can be explained by the customised
nature of these products. There is usually not a standard product available that will
meet a particular customers' requirement and the manufacturer is obliged to have a
design capability available to customise his products. The growing level of indigenous
R & D in these areas reflects the growing strength of these industry clusters.
The design expertise required is usually not great and the materials used - copper and
steel are costly to transport.
In switch gear and control panels there has also been a move towards more
sophisticated sensing and display of electricity supply utilisation resulting in the use of
more and more electronics. Some Irish companies have been focusing their design
activity on the trend towards more sophisticated and display requirements on control
panels and electrical switch gear.
The activity of multinational companies in this area has been erratic. Major design
efforts by Inland Motors were significantly scaled down in the mid eighties while
another by Hyster Automation ended with the closure of the company in 1987.
Telemecanique have carried out no R & D while Square D and ABB have started to
undertake R & D on a small scale.
90
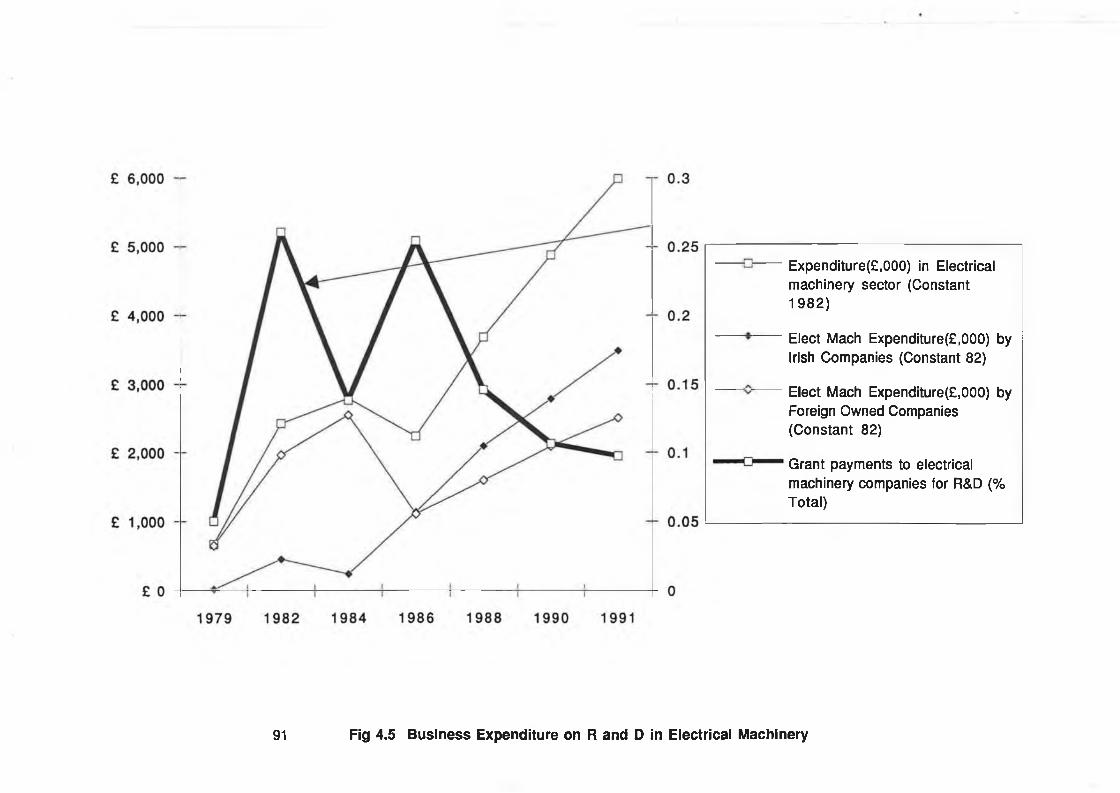
Expenditure^,000) in Electrical machinery sector (Constant 1982)
Elect Mach Expenditure^,000) by Irish Companies (Constant 82)
Elect Mach Expenditure^,000) by Foreign Owned Companies (Constant 82)
Grant payments to electrical machinery companies for R&D (% Total)
91 Fig 4.5 Business Expenditure on R and D in Electrical Machinery
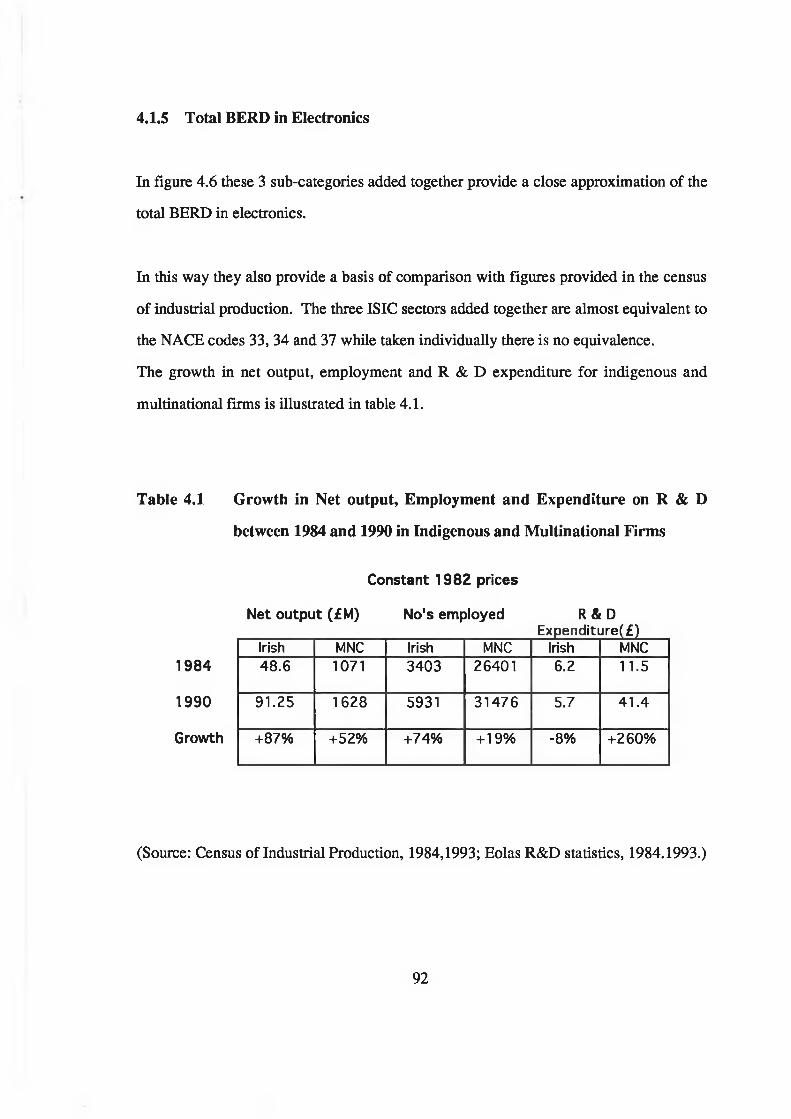
4.1.5 Total BERD in Electronics
In figure 4.6 these 3 sub-categories added together provide a close approximation of the
total BERD in electronics.
In this way they also provide a basis of comparison with figures provided in the census
of industrial production. The three ISIC sectors added together are almost equivalent to
the NACE codes 33, 34 and 37 while taken individually there is no equivalence.
The growth in net output, employment and R & D expenditure for indigenous and
multinational firms is illustrated in table 4.1.
Table 4.1 Growth in Net output, Employment and Expenditure on R & D
between 1984 and 1990 in Indigenous and Multinational Firms
1984
1990
Growth
(Source: Census of Industrial Production, 1984,1993; Eolas R&D statistics, 1984.1993.)
Constant 1982 prices
Net output (£M) No's employed R&D______________________ Expenditure(f)
Irish MNC Irish MNC Irish MNC48.6 1071 3403 26401 6.2 11.5
91.25 1628 5931 31476 5.7 41.4
+87% +52% +74% + 19% -8% +260%
92
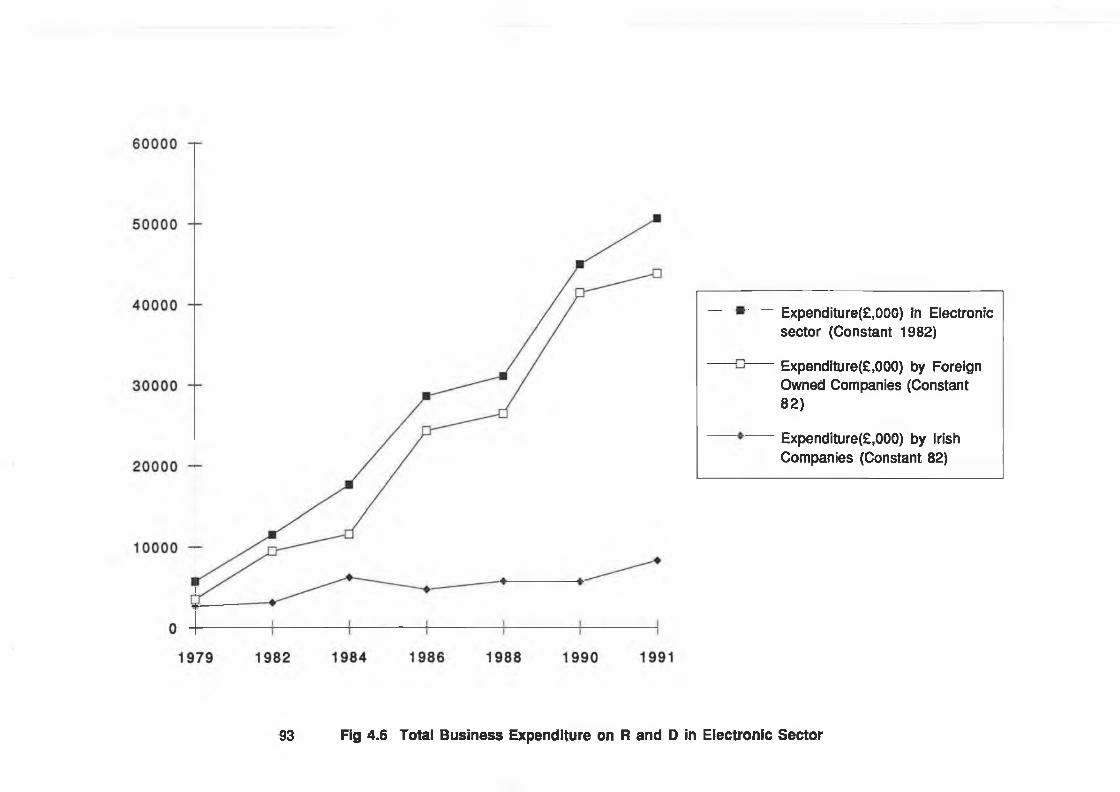
Expenditure^,000) in Electronic sector (Constant 1982)
Expenditure^,000) by Foreign Owned Companies (Constant 82)
Expenditure^,000) by Irish Companies (Constant 82)
93 Fig 4.6 Total Business Expenditure on R and D in Electronic Sector
Net output and R & D expenditure are both at constant 1982 prices with the same
annual deflators. The growth in R & D expenditure by MNC's is the most dramatic
increase since, as shown in 4.3, the number of MNC's involved in R & D has remained
fairly static. This represented a significant increase in expenditure by R & D
performing companies.
The expenditure by indigenous companies has fallen over the six year period despite
significant growth in output and employment levels. 1984 represented a peak in
expenditure by indigenous companies o n R & D (approx 6% of sales). This level of
expenditure was unsustainable particularly when the low profitability of indigenous
industry is considered, being only 2% of sales in 1985 (Kinsella. 1992). The 1990 level
of expenditure by indigenous industry of 6.5% of net output or 3% of sales is more
sustainable and this should rise in line with net output over the coming years.
The evidence then would suggest that:
1) the availability of significant grants for the setting up of R & D functions
within multinational companies has had an impact on the
decision of these companies to set up R & D centres.
2) the availability of grants has had no impact on the rate of expenditure
on R & D of these MNC's.
(3) for indigenous companies, both the number of companies carrying out R
& D and the amount of money they spend on it be related to the
availability of grants.
94
They may have spent excessively on R & D when substantial grants
were avialable in the early 1980's and may now be gearing their R & D
expenditure to their business needs, irrespective of grant availability.
The structure and average output of indigenous companies not changed significantly
over this period. There has not been the growth in £5M + and £20M + companies that
government policies had targeted. In the office and data processing machinery sector
(NACE Code 33) the average output per Irish firm was £12.7M compared to £65M for
foreign owned firms while in electrical machinery it was £1.5M compared to £13M for
foreign owned firms. However the growth in total output and in employment of
indigenous companies has been higher that of MNC's.
4.2 International Comparisons
Table 4.1 illustrates Ireland's relative performance compared with twelve other OECD
countries in terms of industry financed R & D as a percentage of GDP. The table
illustrates that Ireland's performance has improved consistently since 1967 relative to
all the other listed countries.
95
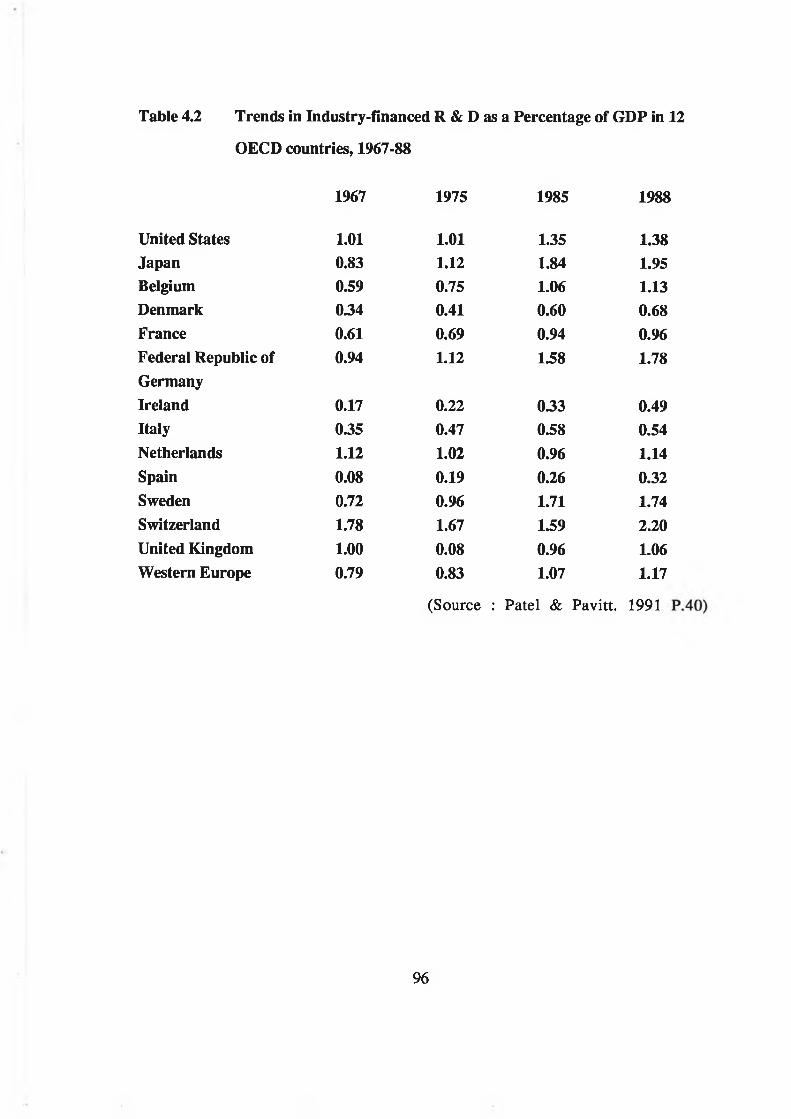
Table 4.2 Trends in Industry-financed R & D as a Percentage of GDP in 12
OECD countries, 1967-88
1967 1975 1985 1988
United States 1.01 1.01 1.35 1.38Japan 0.83 1.12 1.84 1.95Belgium 0.59 0.75 1.06 1.13Denmark 0.34 0.41 0.60 0.68France 0.61 0.69 0.94 0.96Federal Republic of 0.94 1.12 1.58 1.78GermanyIreland 0.17 0.22 0.33 0.49Italy 0.35 0.47 0.58 0.54Netherlands 1.12 1.02 0.96 1.14Spain 0.08 0.19 0.26 0.32Sweden 0.72 0.96 1.71 1.74Switzerland 1.78 1.67 1.59 2.20United Kingdom 1.00 0.08 0.96 1.06Western Europe 0.79 0.83 1.07 1.17
(Source : Patel & Pavitt. 1991
96
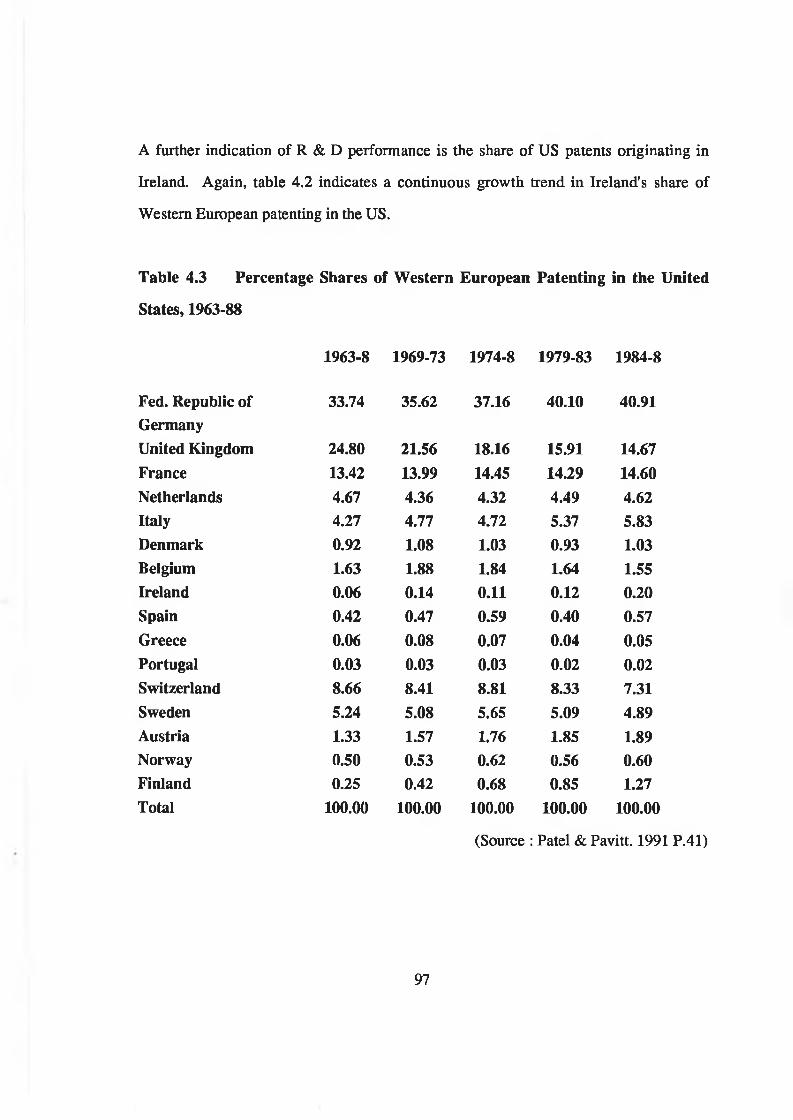
A further indication of R & D performance is the share of US patents originating in
Ireland. Again, table 4.2 indicates a continuous growth trend in Ireland's share of
Western European patenting in the US.
Table 4.3 Percentage Shares of Western European Patenting in the United
States, 1963-88
1963-8 1969-73 1974-8 1979-83 1984-8
Fed. Republic of Germany
33.74 35.62 37.16 40.10 40.91
United Kingdom 24.80 21.56 18.16 15.91 14.67France 13.42 13.99 14.45 14.29 14.60Netherlands 4.67 4.36 4.32 4.49 4.62Italy 4.27 4.77 4.72 5.37 5.83Denmark 0.92 1.08 1.03 0.93 1.03Belgium 1.63 1.88 1.84 1.64 1.55Ireland 0.06 0.14 0.11 0.12 0.20Spain 0.42 0.47 0.59 0.40 0.57Greece 0.06 0.08 0.07 0.04 0.05Portugal 0.03 0.03 0.03 0.02 0.02Switzerland 8.66 8.41 8.81 8.33 7.31Sweden 5.24 5.08 5.65 5.09 4.89Austria 1.33 1.57 1.76 1.85 1.89Norway 0.50 0.53 0.62 0.56 0.60Finland 0.25 0.42 0.68 0.85 1.27Total 100.00 100.00 100.00 100.00 100.00
(Source : Patel & Pavitt. 1991 P.41)
97
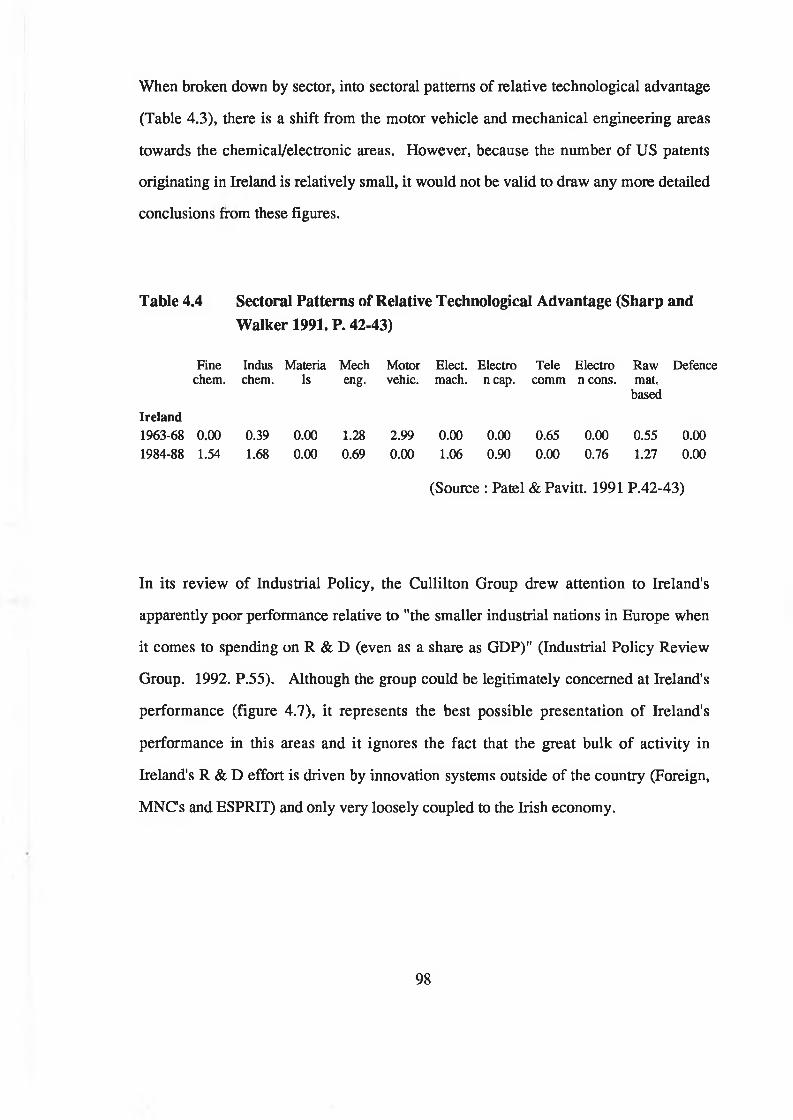
When broken down by sector, into sectoral patterns of relative technological advantage
(Table 4.3), there is a shift from the motor vehicle and mechanical engineering areas
towards the chemical/electronic areas. However, because the number of US patents
originating in Ireland is relatively small, it would not be valid to draw any more detailed
conclusions from these figures.
Table 4.4 Sectoral Patterns of Relative Technological Advantage (Sharp and Walker 1991. P. 42-43)
Fine Indus Materia Mech Motor Elect. Electro Tele Electro Raw Defencechem. chem. Is eng. vehic. mach. n cap. comm n cons. mat.
based
Ireland1963-68 0.00 0.39 0.00 1.28 2.99 0.00 0.00 0.65 0.00 0.55 0.00
1984-88 1.54 1.68 0.00 0.69 0.00 1.06 0.90 0.00 0.76 1.27 0.00
(Source : Patel & Pavitt. 1991 P.42-43)
In its review of Industrial Policy, the Cullilton Group drew attention to Ireland's
apparently poor performance relative to "the smaller industrial nations in Europe when
it comes to spending on R & D (even as a share as GDP)" (Industrial Policy Review
Group. 1992. P.55). Although the group could be legitimately concerned at Ireland's
performance (figure 4.7), it represents the best possible presentation of Ireland's
performance in this areas and it ignores the fact that the great bulk of activity in
Ireland's R & D effort is driven by innovation systems outside of the country (Foreign,
MNC's and ESPRIT) and only very loosely coupled to the Irish economy.
98
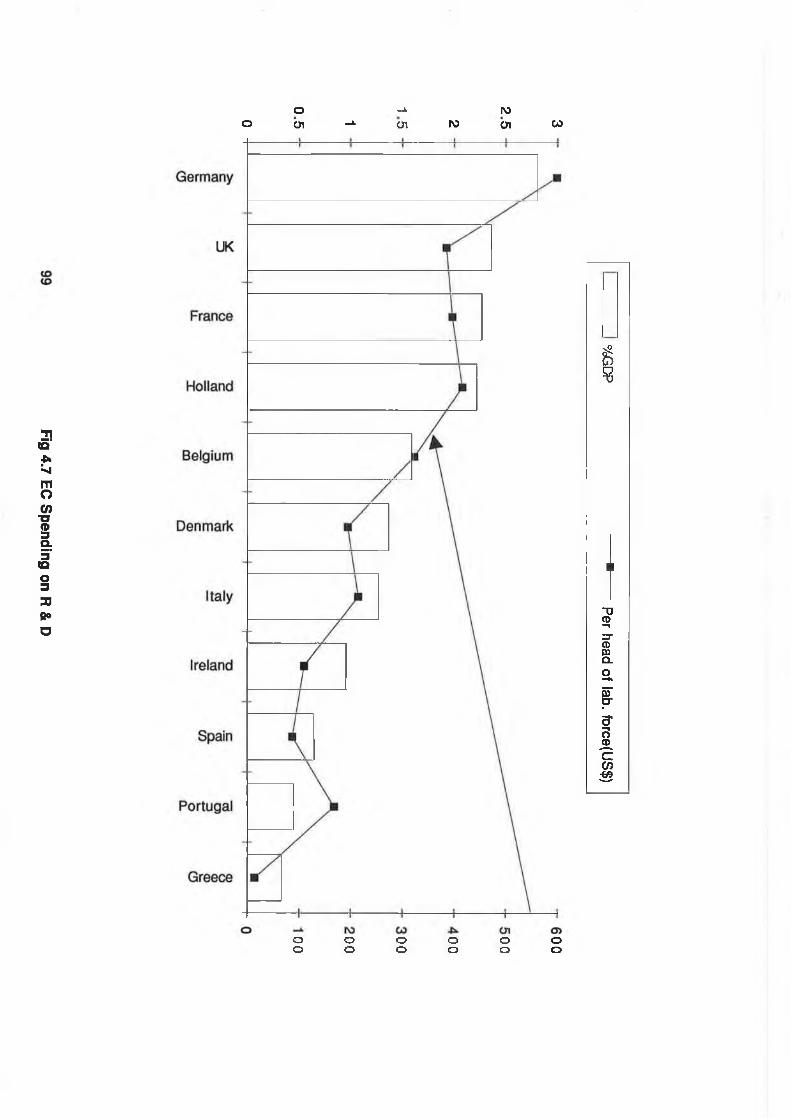
Fig 4.7
EC Spending
on R
& D
o - * IOo oí -*■ en M en co
o o o o o oo o o o o o
%GDP ■
Per head of lab. force(U
S$)
Funding for R & D in electronics in Ireland has come from the European Framework
programmes, mainly through ESPRIT. ESPRIT is the information technology
programmes (see section 2.5) and between 1984 and 1991, contracts worth £36m were
secured by Irish interests. In 1984, 5.1million ECU went to Irish industry with 5.2
million ECU going to universities and institutes ( Eolas).
Out of ten companies who received funds, four had some involvement in non software
electronic projects. These were Farran Technology, Memory Computer Ltd, Digital
Equipment Company and Mentec International Ltd. Of these only Farran Technology
and Mentec International Ltd are still in existence. Of the software companies funded,
one out of the six is still in existence.
In 1985, £3m was secured by eleven Irish companies. Four companies were not
involved exclusively in software. Analog Devices BV, Farran, Mentec and Memory
Computer.
In 1988, Farran Technologies was the only Irish company funded in the area of
microelectronics and peripherals - the non software areas.
The RACE programme was set up in 1988, modelled on the ESPRIT project and
managed in exactly the same way, with a total budget between '88 and '92 of 460
million ECUs of which 16 million went to Ireland. As with the ESPRIT programme,
4.3 EC Framework Funding of Electronics R & D in Ireland
100
the funding was split between "industry and the university sector". Again, as with
ESPRIT, the vast majority of the projects conducted in Ireland by industry have been
software intensive and the commercial credentials of the industrial participants are even
more questionable than in ESPRIT. Among them are Broadcom Eireann Research,
Irish Medical Systems Ltd, Work Research Centre Ltd, Bray Information Technology
and Letterkenny Information Technology Centre.
The framework programmes have been designed primarily to enhance European
competitiveness with respect to the US and Japan. They have worked successfully with
large European electronics and telecommunications companies. For Ireland they have
meant that the scarce technical resources available in the colleges and third level
institutions have been harnessed for the benefit of the large European companies. A
study carried out in Denmark in 1987 (Braendgaard. 1988), found similar results in the
Danish electronics industry including the establishment of a number of companies
whose only function seemed to be to absorb a national allocation for industrial partners.
The study found that:
(1) the participating Danish companies were small by European standards
and by Danish standards.
With the exception of the MNC's, Analog Devices and Digital, this is
also true of all the participating Irish companies.
(2) The participating companies had as their main activity the delivery of
"projects" for programmess such as ESA and ESPRIT.
101
The major Danish participant is described as follows: "It has great skills in landing
international research contracts, first from the ESA and now mainly from the EEC.
EUREKA is also emerging as a promising market for its products, which are 'projects'.
Its orientation is almost entirely international, with few linkages to Danish firms. It
employs about 200 people, mostly computer scientists and electronics engineers".
(Braendgaard. 1988).
The same description could equally be applied to the NMRC Ireland's major participant.
There has been no new product related spin off benefit to Irish industry from the
advanced research activities being carried out in the Irish colleges under ESPRIT and
RACE programmes, while the Irish "Industrial" partners are usually involved in "EC
consultancy work" and not industrial electronic production. (Table 4.5).
Of the companies listed only 6 are involved in product manufacture and of these only
two, Analog Devices and Mentec, employ more than 20 people. The others therefore
are not capable or big enough to exploit the research results of the European
programmes. They are involved as part of the ESPRIT industry that has grown up in
the smaller European countries to soak up the national allocation of funds.
102
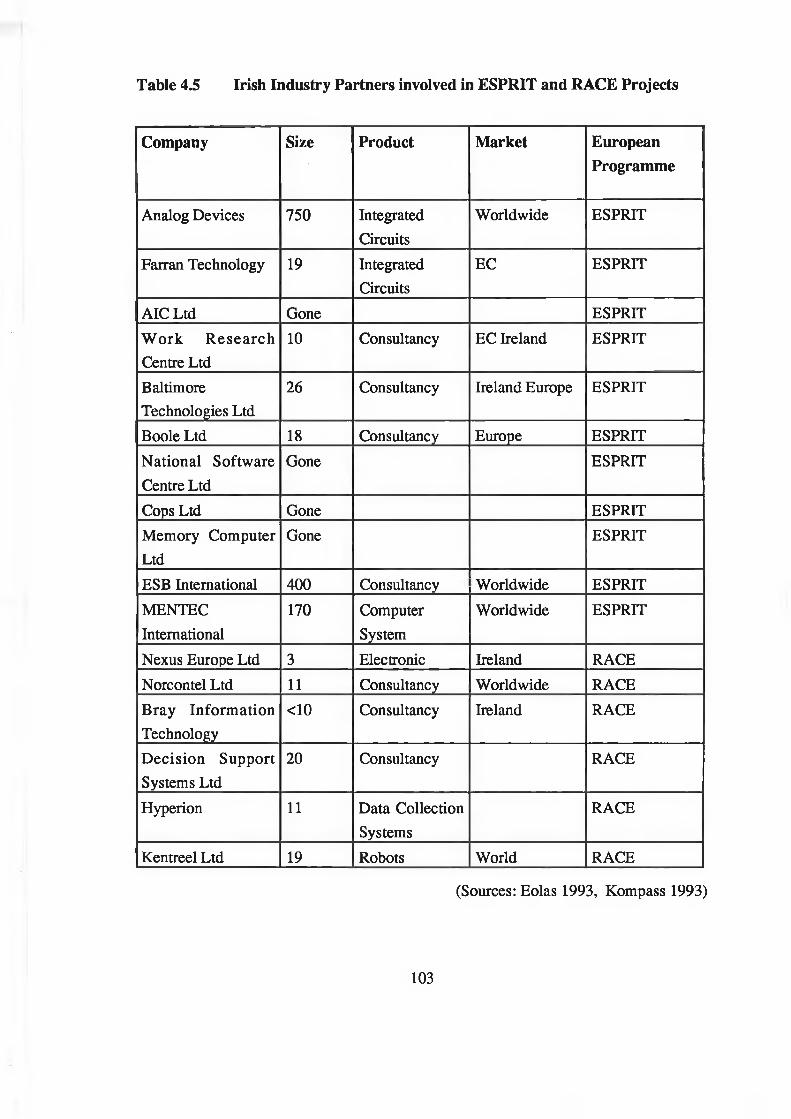
Table 4.5 Irish Industry Partners involved in ESPRIT and RACE Projects
Company Size Product Market EuropeanProgramme
Analog Devices 750 IntegratedCircuits
Worldwide ESPRIT
Farran Technology 19 IntegratedCircuits
EC ESPRIT
AIC Ltd Gone ESPRIT
W ork R esearch Centre Ltd
10 Consultancy EC Ireland ESPRIT
Baltimore Technologies Ltd
26 Consultancy Ireland Europe ESPRIT
Boole Ltd 18 Consultancy Europe ESPRIT
National Software Centre Ltd
Gone ESPRIT
Cops Ltd Gone ESPRITMemory Computer Ltd
Gone ESPRIT
ESB International 400 Consultancy Worldwide ESPRIT
MENTECInternational
170 ComputerSystem
Worldwide ESPRIT
Nexus Europe Ltd 3 Electronic Ireland RACE
Norcontel Ltd 11 Consultancy Worldwide RACE
Bray Information Technology
<10 Consultancy Ireland RACE
Decision Support Systems Ltd
20 Consultancy RACE
Hyperion 11 Data Collection Systems
RACE
Kentreel Ltd 19 Robots World RACE
(Sources: Eolas 1993, Kompass 1993)
103
As outlined in section 3.4.2 the shortage of funds for R & D in the Higher Education
Sector has forced this sector to look to Europe for funding for its research activities and
with some exceptions this research activity has had very little to do with Irish industrial
development. Where they have occurred these exceptions have taken two forms -
(1) Industry-University collaboration and
(2) The emergence of industrial enterprises out of the university
environment
The university-industry collaboration can take three forms (Terkel 1991). These are
research parks, cooperative research centres and industrial extension services.
Plassey Technological Park was the first research park established in Ireland. It was
dominated by large multinational companies such as Wang and Verbatim with little
interaction with the university, but it did contribute to a university culture and policy
which supported industrial development. Neither of the other structures existed
formally until the establishment of the Programmes in Advanced Technology in 1989.
Prior to this some colleges, in particular University College Cork, had implemented an
ad hoc form of cooperative research centre. In an effort to make their research work
more relevant to industry, they encouraged and received industrial support for a number
of research projects.
4.4 Higher Education Sector
104

A number of studies have illustrated the institutional inconsistencies between university
and industrial needs in research. Azaroff (1982) identifies these inconsistencies or
impediments as publications, patents, job performance and general attitudes.
In universities, promotion is determined by publications, while industry prefers not to
publish. Universities will struggle to hold on to 'intellectual property', despite the fact
that in their hands from the view point of industry it is usually worthless. Universities
and industries have different perceptions as to what is important, in terms of job
performance and in particular, scheduling. A study by Donald Fowler (Fowler. 1989)
also highlighted the difference between the longer term view of the university research
and the short term view of industry in terms of results.
Terkel in reviewing these studies concluded that the first and major consideration in
determining the success of the university industry collaboration was the creation of a
university culture which expresses a desire and commitment for cooperation with
industry and the business community (Terkel 1991 p 536). This university culture is
most evident in Ireland in the University of Limerick where in addition to a number of
successful university industry collaborations, there has also been a number of successful
university generated electronics enterprises.
These include Interpro test systems, the world leaders in automatic test systems for
power supplies and Ashling Microsystems who have developed international
competitiveness in small scale micro processor development systems.
105
4.5 Eolas
Eolas is the National Science & Technology Agency. It was formed in 1987 as a result
of the merger of the Institute of Industrial Research and Standards (IIRS) and the
National Board for Science & Technology (NBST). It provides technical and
consultancy services in a number of areas none of which are related to electronics.
Under its testing services in the National Electrical Test Centre, it has provided, a
national electronic testing service for Irish companies. This was limited up to 1990 to
product testing in accordance with the European low voltage directive. Since then it has
been extended to include some telecommunications equipment testing, but to date it
does not include testing for compliance with the European EMC directive.
Through its science and technology promotion section, Eolas acts as an agent for
European Framework programmes discussed above and also disperses limited funding
for third level research projects.
In an NBST industrial survey carried out in 1986, on semistate services provided to
industry there was in general a high level of satisfaction (> 70%), with services
provided by IDA, IIRS and CTT. The one exception was product development support
from the IIRS. Of the seven companies who had used the service only one rated the
service as satisfactory.
106
4.6 Technology Transfer
Technology transfer can take many forms. In its widest context, it is recommended by
the OECD for late developing or Third world countries as a means of narrowing the
technology gap between them and the advanced industrial nations. Initiatives
undertaken in this context include the establishment of steel mills in Mexico and Brazil
and installation of wafer fabrication facilities in Korea (OECD. 1992).
Included in this type of transfer is the process design, the product design, and the
product design and process improvement capability.
When discussed in Ireland »Technology transfer is normally used in its narrow context
and means the transfer of a single product technology.
Technology transfer in this narrow context is sometimes seen by policy makers in
Ireland as a shortcut to overcoming Ireland's technology gap. However, the ESRI
Report (Conniffe & Kennedy, 1984. P. 102) points out that technology transfer is not a
simple solution and quotes Stead (1976) who showed that over 90% of new product
development costs would not be provided for in a technology transfer arrangement.
A study carried out in Hong Kong by Edward Chen (1983) identified the factors which
influenced the technical progress of the receiving country as:
(1) the rate of technology diffusion
107
(2) the appropriate choice of technology and
(3) the appropriate transfer of technology
Chen was discussing primarily the impact of multinational companies on the host
countries technical progress. His conclusions that for successful transfer the choice and
the transfer must both be appropriate is valid for any technology transfer arrangements.
The technology choice is appropriate if it supports the industrial development of the
host country and there is the infrastructure within the country to use and assimilate the
technology. The transfer is appropriate if it is a full and total transfer and includes:
(1) technical documents blueprints etc
(2) permission to use various knowledge, rights, assets and patents
(3) the use of capital, intermediate and/or final goods and
(4) a full transfer of learning know how etc. (Forsner & Ballance 1990).
Technology transfer between independent companies and individuals is supported at
State level by an IDA grant scheme introduced in 1989 and by a technology brokerage
service provided thorough Eolas. In 1990 seven companies availed of the technology
acquisition grant from the IDA. ( 1990) The grant provides up to 50% of the direct cost
of negotiating and acquiring the technology to licences, patents or know how
agreements. Of the seven companies supported in 1990, one was from the electronics
sector - Top Tech Ireland Ltd, a joint venture funded by Aer Lingus and the ESB who
acquired a patented process of screening plastics to provide them with electromagnetic
shielding properties. In 1991 a total of ten companies received technology acquisition
grants, five of whom are in the electronics sector. (IDA. 1991)
Over the period 1989 to 1991, just £lm was spent on technology acquisition grants by
the IDA. £560,000 went to the electronics industry, which represented just £100,000
108
per company. Of the six companies who have received technology transfers, the
companies who have gained significantly from it have been Mentec and Top Tech. In
both cases the technology was compatible with their existing processes and
technological capability. Both companies had already a significant R & D capacity. In
the case of a third company, the technology transfer, though in the same general area in
which they already had demonstrated technological competence and carried out
significant R & D was not easily assimilated and not compatible with their existing
processes.
The Culliton Report included three specific recommendations in the area of science &
technology. The first two related to the Programmes in Advanced technology (see
paragraph 6.4) and the third was that greater emphasis should be placed on the
acquisition of technology required to upgrade product quality and competitiveness in
Irish industry. The basis of this recommendation was a report by the ESRI to the
Industrial Policy Review Group (O'Malley et al. 1992). This Report argued that "the
technology required for industry must be imported rather than generated domestically".
The report naively suggested that "the key elements are: identification of suitable
available technologies by international 'intelligence' gathering and the acquisition or
transfer of such technologies". A brief review of the limited experience in Ireland of
technology transfer would have highlighted the difficulties of this approach.
Technology transfer is an option which can be exercised to enhance existing R & D
efforts. It is not an alternative to R & D and the experiences of Japan and Korea (or
Mexico for contrast) show it is only effective when accompanied by intense R & D
activity by the companies accepting the technology.
109
4.7 IDA R & D Grants Scheme
The IDA had an R & D grant scheme in operation from April 1970. (IDA 1972). Until
1980 the maximum funding available for a project was £50K (increased from £30K in
1978). Following the publication of the Telesis Report, the IDA placed new emphasis
on the R & D grant scheme. A core unit within the IDA was given responsibility for the
administration of the scheme and the new limit of £250K per project was established.
Between 1980 and 83, this core unit promoted extensively both in multinational and
indigenous companies the concept of doing research and development and provided
generous funding to support it (see figures 4.1 to 4.3). In 1983, this core unit was
disbanded and the R & D scheme was administered by the IDAs Account Executives.
Between 1983 and 1992, the IDAs grants committee made it progressively more
difficult for companies to win approval for R & D grants. After 1988, the funding level
was reduced from an expected 50% to 20% except for projects with exceptional risk.
The IDA simultaneously began to link R & D grants to job creation and to make the
grants repayable if job creation numbers were not achieved.
The overall result has been that there was a substantial increase in the number of
international companies doing R & D in their Irish locations, since then this number has
remained fairly static.
In the early 1980s, An Foras Teoranta, the State Rescue Operation was working with
indigenous companies in financial difficullty. This body had a task of taking over
companies that were in trouble, helping them to recover and preparing them for sale as a
4.7.1 Development of the IDA Product and Process Development Grants Scheme
110
going concern. Lacking the management skills to identify the real problems facing a
company, it often came to the premature conclusion that a company needed new or
improved products. These companies would be recommended for and receive IDA
grant assistance for product development.
In 1985, there were only five Irish indigenous electronic companies with more than
three full time equivalent research workers (SDC. 1985 p 80). In 1989, out of a total of
97 indigenous firms in the electronics industry only five had more than three full time
equivalent research workers. (Department of Industry and Commerce 1989, Eolas,
1990). For companies operating on such a small scale, the costs of applying for and
managing an IDA grant often outweighed the benefits.
The IDA has provided on average a higher level of grant aid to indigenous companies.
Despite this, both the number of R & D performing companies and their level of
expenditure has remained static.
4.7.2 Analysis of the IDA R & D Grants Data
The IDA Annual Report each year includes a listing of all the companies who have
received product and process development (R & D) grants and the amount that each
company has received.
A rationale for using this data as a proxy for R & D activity is included in Appendix 4
and in the following analysis it will be used in this way. The full listing of all
companies who have received IDA R & D Grants from 1979 to 1991 is included in
Appendix 5.
I l l
Figure 4.8 illustrates the distribution of grants by the total amount allocated to a
company over the 12 year period.
Sixty two comapnies (26%) received less than £10,000.
The cost of application for administration of a grant would amount to at least £10K.
The companies falling into this category are:
(1) small Irish companies (Seagull Electronics)
(2) multinational companies who are augmenting their IDA main business
grant by undertaking some nominal R & D (Assman Electronics)
(3) companies who were starting projects in 1991
33% or 81 companies received between £10,000 and £50,000. This is the largest
segment of companies on the distribution.
It includes multinational companies such as Apple Computer, Micromotor, EG & G,
Hanimex, Square D and Siva Fuji and other multinational manufacturing companies
located in Ireland undertaking small R & D projects.
4.7.2.1 Distribution
112
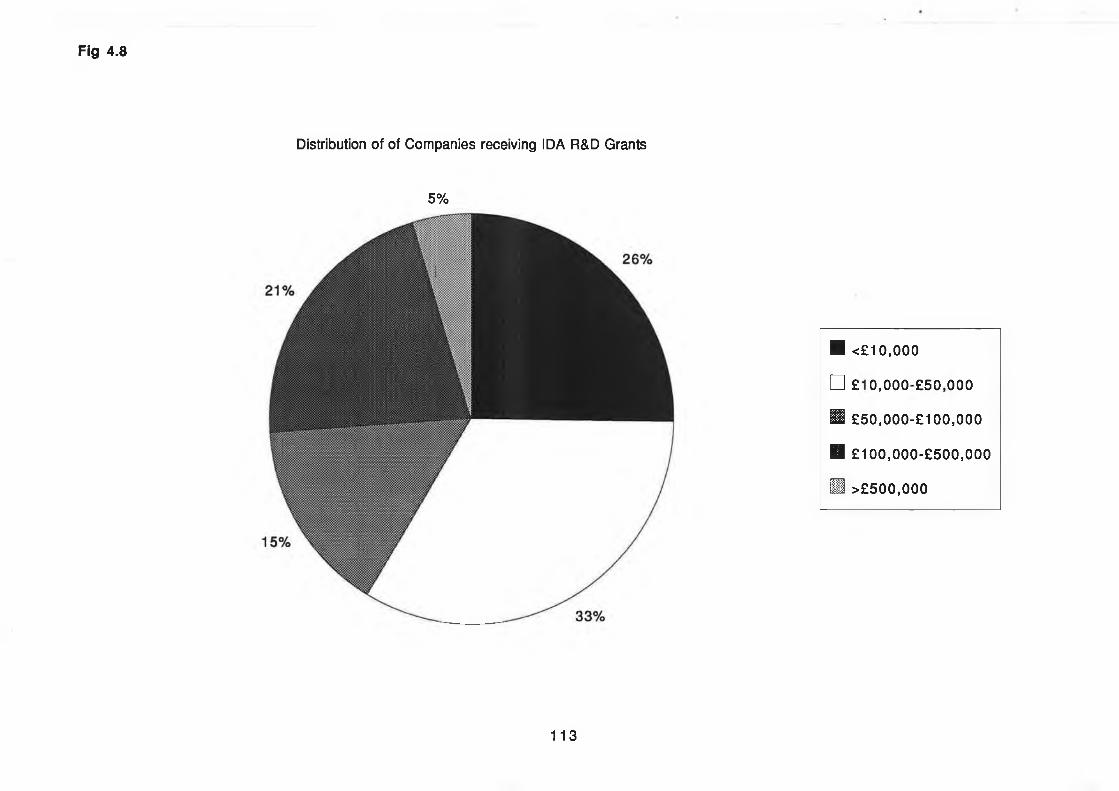
Fig 4.8
Distribution of of Companies receiving IDA R&D Grants
5%
■ <£10,000
□
ooooIOwoooo’w
n £50,000-£100,000
■ £100,000-£500,000
B >£500,000
1 1 3
It includes Irish companies set up to design and manufacture a single product such as
Alternative Energy Company, Artie Environmental, Ship Co and Millimeter Wave
Technology and Irish and MNC's with a low level of ongoing R & D such as PCAS,
Gotech, SPS and EI. R & D grants greater than £50,000 indicate a serious level of R &
D. The highest segment lies between £100,000 and £500,000. Since grant payments at
this level would be very much linked to job creation the level of grant paid does not
necessarily correlate with the amount of R & D undertaken. However the 11 companies
who have received grants above £500,000 would certainly have the most R & D
intensive operations in the country.
4.7.2.2 Location of R & D Activity
Table 4.5 illustrates the percentage of total grants paid by the IDA, to electronics
companies for each county and also the total number of different electronics companies
receiving IDA R & D grants in each county over the 12 year period.
The highest concentrations of R & D activity in electronics are in Limerick and Clare.
This can be traced historically to :
(1) the existence of R & D intensive multinational companies in the area
such and Analog Devices in Limerick, Inland Motors in Ennis and
Verbatim in Limerick and
(2) the pro industry culture and electronic R & D activity in the University
of Limerick.
114
Three other counties show above 50% concentration on electronics. These are Leitrim,
Wicklow and Tipperary South. In Tipperary South, the high concentration is due to the
existence of the Digital R & D facility in Clonmel which focused initially on power
supply development and this led to the second company, Evans Development and
Manufacturing Company, based in this area being established (also involved in the
development of power converter technology). In Wicklow, the high concentration is
due to the development work of AT & T in Bray who spend over £2m per annum on R
& D and who have received £1.25M in grant assistance over the ten year period.
Leitrim which has very little R & D activity, but includes some companies in the
electronics sector.
115
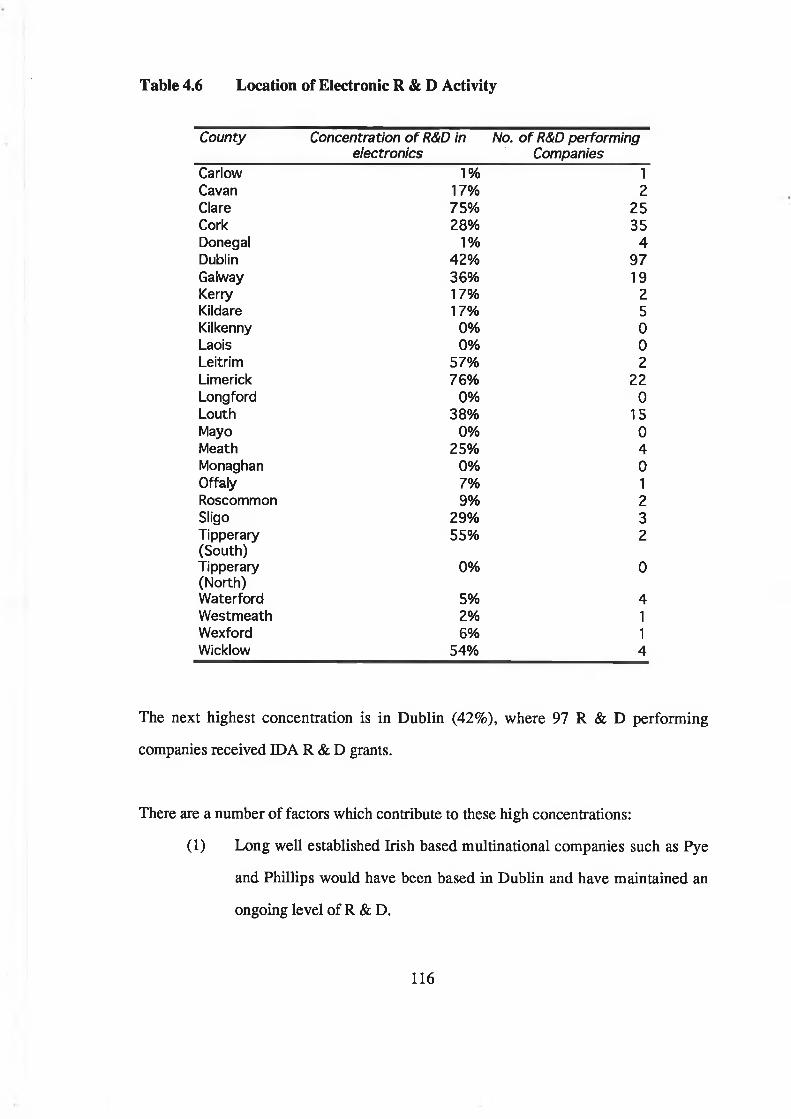
Table 4.6 Location of Electronic R & D Activity
County Concentration o f R&D in No. o f R&D performingelectronics Companies
Carlow 1% 1Cavan 17% 2Clare 75% 25Cork 28% 35Donegal 1% 4Dublin 42% 97Galway 36% 19Kerry 17% 2Kildare 17% 5Kilkenny 0% 0Laois 0% 0Leitrim 57% 2Limerick 76% 22Longford 0% 0Louth 38% 15Mayo 0% 0Meath 25% 4Monaghan 0% 0Offaly 7% 1Roscommon 9% 2Sligo 29% 3Tipperary 55% 2(South)Tipperary 0% 0(North)Waterford 5% 4Westmeath 2% 1Wexford 6% 1Wicklow 54% 4
The next highest concentration is in Dublin (42%), where 97 R & D performing
companies received IDA R & D grants.
There are a number of factors which contribute to these high concentrations:
(1) Long well established Irish based multinational companies such as Pye
and Phillips would have been based in Dublin and have maintained an
ongoing level of R & D.
116

(2) Irish indigenous suppliers to the Post Office and telephone systems
would have been based in Dublin, such as Telectron, Lake Electronics
etc. and would have had to undertake some level of R & D.
(3) R & D performing US multinationals have spun off some Irish
companies - Data Products, Power Technology Sources and AME.
(4) Because of its size, Dublin would have sufficient demand to allow for
the development of electronics based security and building products.
(5) There are five third level colleges based in Dublin with post graduate
research activity in areas of electronics though none have had the same
impact on industrial R & D as the University of Limerick.
Some company R & D activity can be traced to the College of
Technology, Kevin Street and more recently to Trinity College.
117

4.7.2.3 Companies receiving more than £50,000
Following the analysis of the distribution of companies by the total grant received over
the period those who received greater than £50,000 were extracted from the list.
The companies on this list, Table 4.7, would have spent at least £100,000 on R & D and
more than likely considerably more. This table, which contains most of the Irish based
companies who have undertaken serious R & D over the period in question is analysed
in table 4.8 by sector, ownership and survival.
Fifty five of the companies are Irish owned and 31 are Foreign owned.
4.7.2.4 Performance of Irish Companies
When one looks at the sectoral distribution no clear pattern emerges. One must look at
the size of the individual companies, their dependence on R & D and their international
competitiveness.
Three Irish companies from table 4.7 could be considered international leaders, with
this leadership position derived in all cases from their R & D activity. Three
companies manufacture test development systems. Two of them emerged from the
University of Limerick (Interpro Test Systems and Ashling Microsystems) and a third
(AME) started as a multinational spin off company.
118
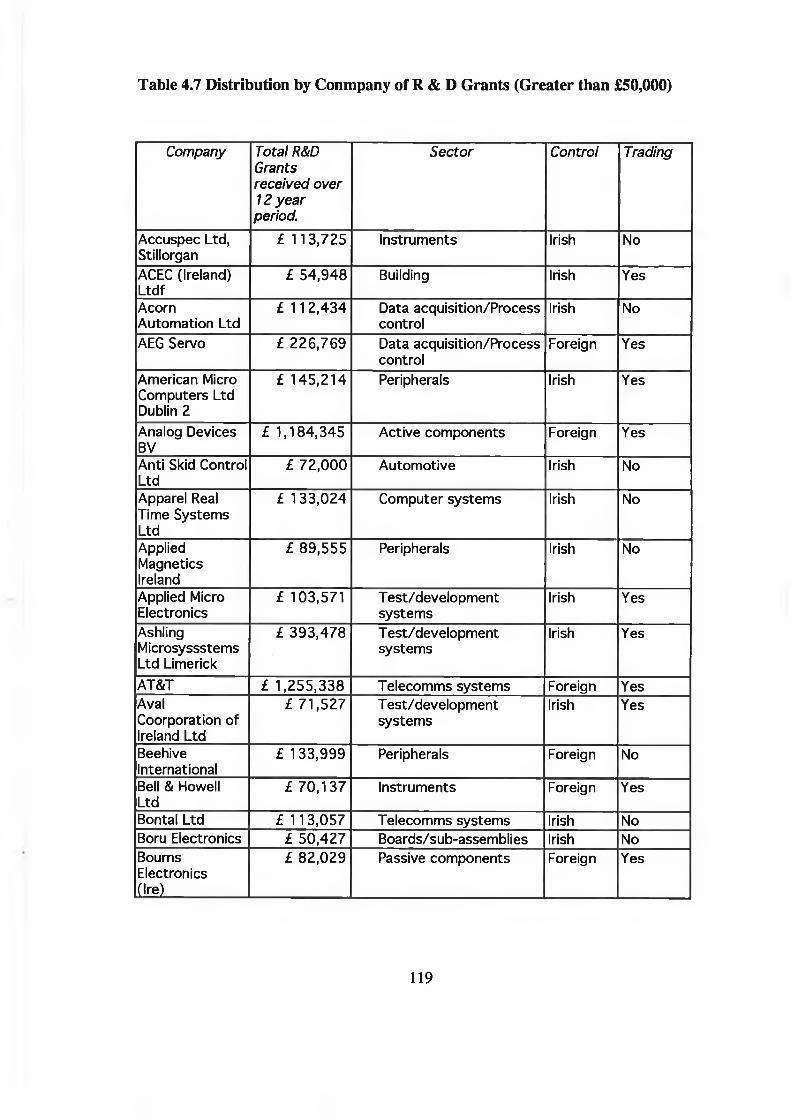
Table 4.7 Distribution by Conmpany of R & D Grants (Greater than £50,000)
Company Total R&D Grantsreceived over 12 year period.
Sector Control Trading
Accuspec Ltd, Stillorgan
£ 113,725 Instruments Irish No
ACEC (Ireland) Ltdf
£ 54,948 Building Irish Yes
AcornAutomation Ltd
£ 112,434 Data acquisition/Process control
Irish No
AEG Servo £ 226,769 Data acquisition/Process control
Foreign Yes
American Micro Computers Ltd Dublin 2
£ 145,214 Peripherals Irish Yes
Analog Devices BV
£ 1,184,345 Active components Foreign Yes
Anti Skid Control Ltd
£ 72,000 Automotive Irish No
Apparel Real Time Systems Ltd
£ 133,024 Computer systems Irish No
AppliedMagneticsIreland
£ 89,555 Peripherals Irish No
Applied Micro Electronics
£ 103,571 T est/development systems
Irish Yes
AshlingMicrosyssstems Ltd Limerick
£ 393,478 T est/development systems
Irish Yes
AT&T £ 1,255,338 Telecomms systems Foreign YesAvalCoorporatlon of Ireland Ltd
£ 71,527 T est/development systems
Irish Yes
BeehiveInternational
£ 133,999 Peripherals Foreign No
Bell & Howell Ltd
£ 70,137 Instruments Foreign Yes
Bontal Ltd £ 113,057 Telecomms systems Irish NoBoru Electronics £ 50,427 Boards/sub-assemblies Irish NoBourns Electronics Qre)_ _
£ 82,029 Passive components Foreign Yes
119
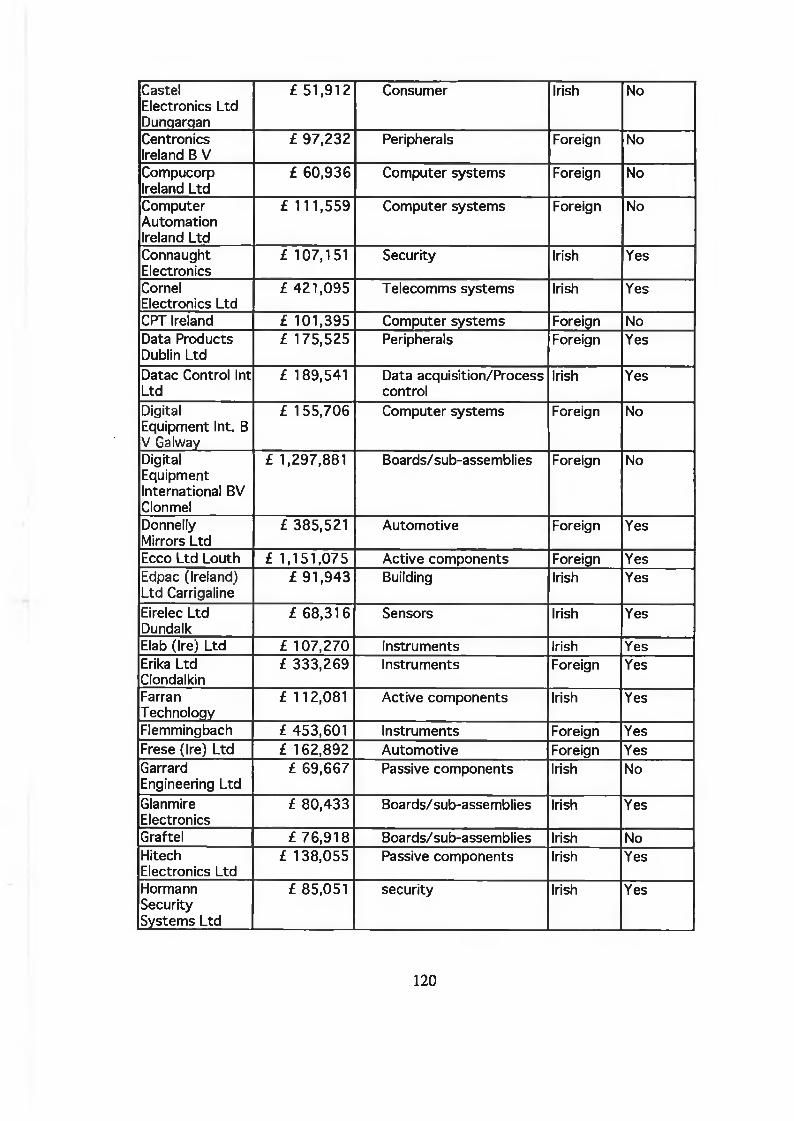
CastelElectronics LtdDunçjarqan
£ 51,912 Consumer Irish No
Centronics Ireland B V
£ 97,232 Peripherals Foreign No
Compucorp Ireland Ltd
£ 60,936 Computer systems Foreign No
Computer Automation Ireland Ltd
£ 111,559 Computer systems Foreign No
ConnaughtElectronics
£ 107,151 Security Irish Yes
CornelElectronics Ltd
£ 421,095 Telecomms systems Irish Yes
CPT Ireland £ 101,395 Computer systems Foreign NoData Products Dublin Ltd
£ 175,525 Peripherals Foreign Yes
Datac Control Int Ltd
£ 189,541 Data acquisition/Process control
Irish Yes
DigitalEquipment Int. B V Galway
£ 155,706 Computer systems Foreign No
Digital Equipment International BV Clonmel
£ 1,297,881 Boards/sub-assemblies Foreign No
Donnelly Mirrors Ltd
£ 385,521 Automotive Foreign Yes
Ecco Ltd Louth £ 1,151,075 Active components Foreign YesEdpac (Ireland) Ltd Carrigaline
£ 91,943 Building Irish Yes
Eirelec Ltd Dundalk
£ 68,316 Sensors Irish Yes
Elab (Ire) Ltd £ 107,270 Instruments Irish YesErika Ltd Clondalkin
£ 333,269 Instruments Foreign Yes
FarranTechnology
£ 112,081 Active components Irish Yes
Flemmingbach £ 453,601 Instruments Foreign YesFrese (Ire) Ltd £ 162,892 Automotive Foreign YesGarrardEngineering Ltd
£ 69,667 Passive components Irish No
GlanmireElectronics
£ 80,433 Boards/sub-assemblies Irish Yes
Graftel £ 76,918 Boards/sub-assemblies Irish NoHitechElectronics Ltd
£ 138,055 Passive components Irish Yes
Hormann Security Systems Ltd
£ 85,051 security Irish Yes
120
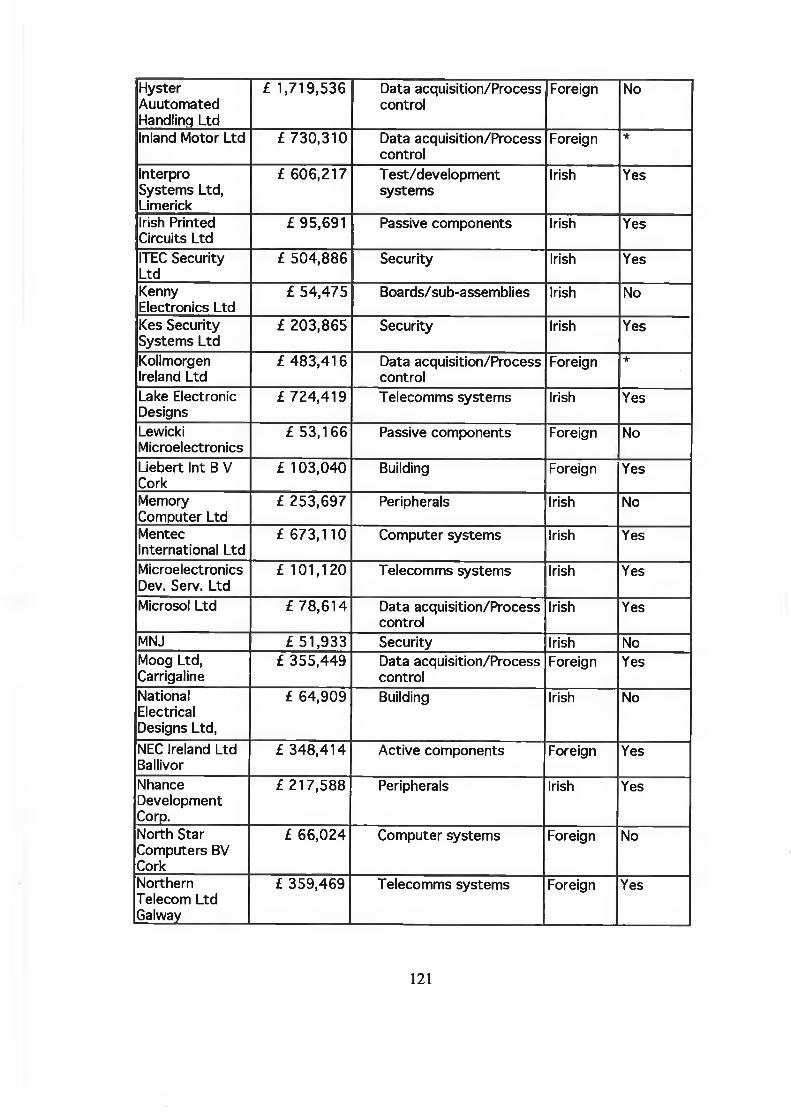
Hyster Auutomated Handling Ltd
£ 1,719,536 Data acquisition/Process control
Foreign No
Inland Motor Ltd £ 730,310 Data acquisition/Process control
Foreign *
Interpro Systems Ltd, Limerick
£ 606,217 T est/development systems
Irish Yes
Irish Printed Circuits Ltd
£ 95,691 Passive components Irish Yes
ITEC Security Ltd
£ 504,886 Security Irish Yes
KennyElectronics Ltd
£ 54,475 Boards/sub-assemblies Irish No
Kes Security Systems Ltd
£ 203,865 Security Irish Yes
Kollmorgen Ireland Ltd
£ 483,416 Data acquisition/Process control
Foreign *
Lake Electronic Designs
£ 724,419 Telecomms systems Irish Yes
LewickiMicroelectronics
£ 53,166 Passive components Foreign No
Liebert Int B V Cork
£ 103,040 Building Foreign Yes
Memory Computer Ltd
£ 253,697 Peripherals Irish No
MentecInternational Ltd
£ 673,110 Computer systems Irish Yes
Microelectronics Dev. Serv. Ltd
£ 101,120 Telecomms systems Irish Yes
Microsol Ltd £ 78,614 Data acquisition/Process control
Irish Yes
MNJ £ 51,933 Security Irish NoMoog Ltd, Carrigaline
£ 355,449 Data acquisition/Process control
Foreign Yes
National Electrical Designs Ltd,
£ 64,909 Building Irish No
NEC Ireland Ltd Ballivor
£ 348,414 Active components Foreign Yes
NhanceDevelopmentCorp.
£ 217,588 Peripherals Irish Yes
North Star Computers BV Cork
£ 66,024 Computer systems Foreign No
Northern Telecom Ltd Galway
£ 359,469 Telecomms systems Foreign Yes
121
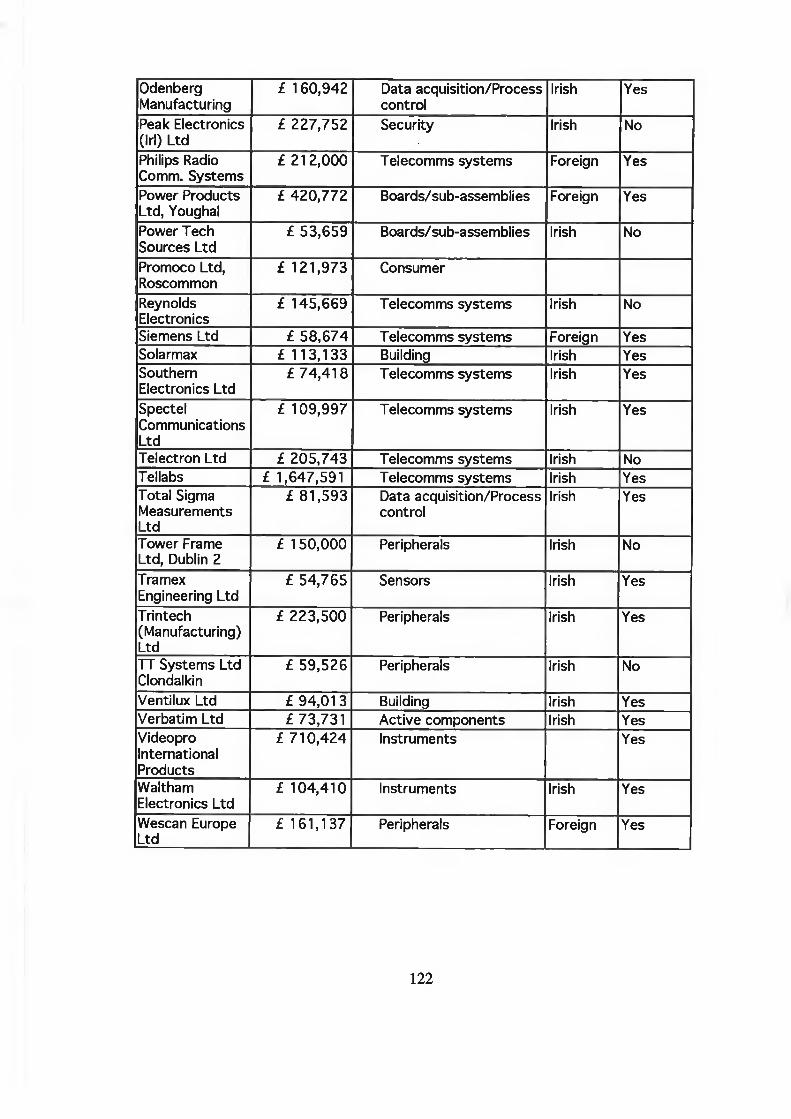
OdenbergManufacturing
£ 160,942 Data acquisition/Process control
Irish Yes
Peak Electronics (Irl) Ltd
£ 227,752 Security Irish No
Philips Radio Comm. Systems
£ 212,000 Telecomms systems Foreign Yes
Power Products Ltd, Youghal
£ 420,772 Boards/sub-assemblies Foreign Yes
Power Tech Sources Ltd
£ 53,659 Boards/sub-assemblies Irish No
Promoco Ltd, Roscommon
£ 121,973 Consumer
ReynoldsElectronics
£ 145,669 Telecomms systems Irish No
Siemens Ltd £ 58,674 Telecomms systems Foreign YesSolarmax £ 113,133 Building Irish YesSouthern Electronics Ltd
£ 74,418 Telecomms systems Irish Yes
SpectelCommunicationsLtd
£ 109,997 Telecomms systems Irish Yes
Telectron Ltd £ 205,743 Telecomms systems Irish NoTellabs £ 1,647,591 Telecomms systems Irish YesTotal SigmaMeasurementsLtd
£ 81,593 Data acquisition/Process control
Irish Yes
Tower Frame Ltd, Dublin 2
£ 150,000 Peripherals Irish No
TramexEngineering Ltd
£ 54,765 Sensors Irish Yes
Trintech(Manufacturing)Ltd
£ 223,500 Peripherals Irish Yes
TT Systems Ltd Clondalkin
£ 59,526 Peripherals Irish No
Ventilux Ltd £ 94,013 Building Irish YesVerbatim Ltd £ 73,731 Active components Irish YesVideoproInternationalProducts
£ 710,424 Instruments Yes
Waltham Electronics Ltd
£ 104,410 Instruments Irish Yes
Wescan Europe Ltd
£ 161,137 Peripherals Foreign Yes
122
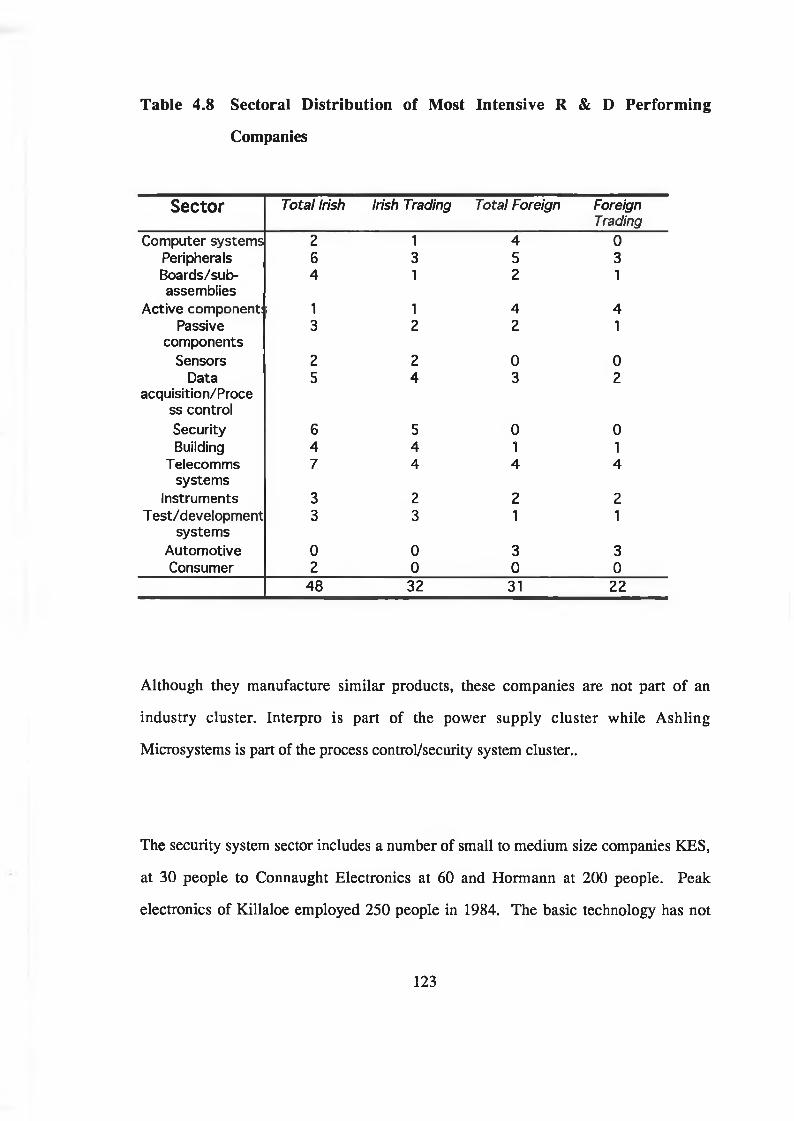
Table 4.8 Sectoral Distribution of Most Intensive R & D Performing
Companies
S ecto r Total Irish Irish Trading Total Foreign ForeignTrading
Computer systems 2 1 4 0Peripherals 6 3 5 3Boards/sub- 4 1 2 1assembiles
Active component: ! 1 1 4 4Passive 3 2 2 1
componentsSensors 2 2 0 0
Data 5 4 3 2acquisition/Proce
ss controlSecurity 6 5 0 0Building 4 4 1 1
Telecomms 7 4 4 4systems
Instruments 3 2 2 2Test/development 3 3 1 1
systemsAutomotive 0 0 3 3Consumer 2 0 0 0
48 32 31 22
Although they manufacture similar products, these companies are not part of an
industry cluster. Interpro is part of the power supply cluster while Ashling
Microsystems is part of the process control/security system cluster..
The security system sector includes a number of small to medium size companies KES,
at 30 people to Connaught Electronics at 60 and Hormann at 200 people. Peak
electronics of Killaloe employed 250 people in 1984. The basic technology has not
123
been developed in Ireland and these companies have developed enhancements to
products they originally distributed or licensed. The availability of low cost
microprocessor development systems from Ashling has facilitated this development
Computer peripherals include printers, terminal and disc drives. It is difficult for Irish
companies to get a technology lead in this market and most work undertaken by Irish
companies have been enhancements on basic engines. However, one company nHance
has made a breakthrough in high resolution terminals but to date only employs three
people. Another company, Trintech, employing thirty five people has created a
technological advantage for itself with credit card readers.
The telecomm sector developed as a supplier to the Dept of Posts and Telegraphs now
An Bord Telecom. The technology used is not new and the open market is making it
more difficult for these companies to survive.
In the data acquisition/process control sector there are tfour small but internationally
competitive companies Datac, Microsol, TSM and Odenberg Manufacturing, whose
competitiveness is due to technology developed in Ireland combined with focused
marketing.
124
4.7.2.5 Foreign Owned Companies
In general Foreign owned companies are not dependent for their success in Ireland on
Irish R & D.
The exceptions to this are:
(1) Analog Devices
(2) ATT
(3) AEG (previously Inland Motor and listed also as Kollmorgen)
(4) Computer Products
Two companies that have failed because of the failure of their Irish R & D have been
CPT and to some extent Hyster Automation.
Analog Devices designs and manufacturers CMOS chips in Limerick and the success of
the operation is dependent on the success of the design effort. However, the design
systems, development tools etc. were put in place by the US company and Irish
designers simply follow the systems and operate the tools (ie CAD systems). Some
CAD system development has taken place in Analog with support from the NMRC.
125

Inland Motor and Computer Products operate more as business entities while ATT
' competition
1 2 6
4.8 Survey of Electronics R & D Intensive Companies
4.8.1 Rationale for Survey
A survey of electonics R & D intensive (see Table 4.9) companies was undertaken to
establish:
(1) Why companies undertake R & D and at what level of complexity
(2) What they see as the supporting factors
(3) What they see as the inhibiting factors
In addition to addressing these questions the survey established the size of the company,
the size of the R &D facility, control and location of R & D and the control and location
of company.
The survey studied 30 R & D intensive companies (those having received more that
50K in R & D grants) and a spread of large and small indigenous and multinational (in
terms of R & D grant aid).
The survey was restricted to companies who were still in existence and agreed to
cooperate.
Thirty companies had agreed to participate. Twenty replies were received in time to be
included in the analysis.
127

The survey results are listed in table 4.9 (for survey details see Appendix E).
Of particular interest in the findings are:
(1) Most MNC R & D functions report into Irish operations
(2) Process development is not considered important in Irish companies
(3) R & D drivers are similar for MNC's are driven more by growth and
Irish companies
(4) Assessment of complexity was similar for both
(5) R & D support factors were very similar with both sectors rating grants
at less than 4. Access to company technology outside of Ireland is one
support which Irish companies obviously don't share
(6) In both indigenous and MNC’s only one factor rated higher than 4 with all others
rated at less than 3. This was financial constraints for indigenous companies.
4.8.2 Survey Findings
128
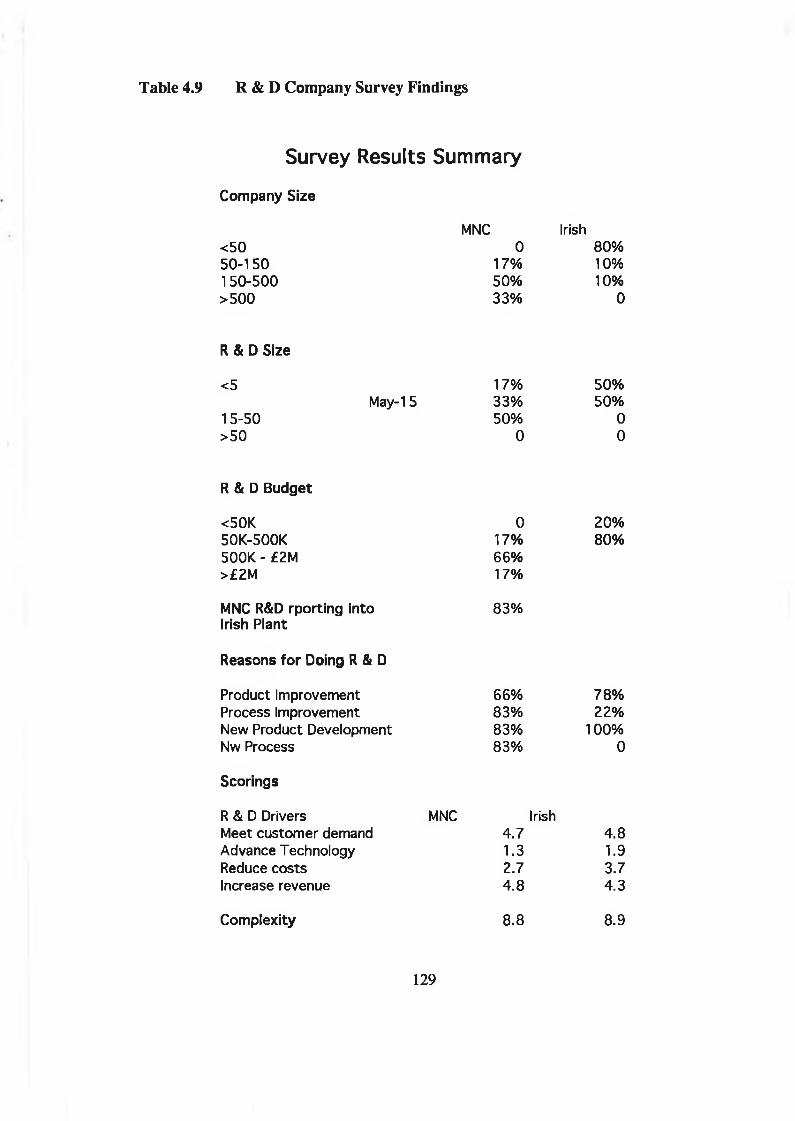
Table 4.9 R & D Company Survey Findings
Survey Results Summary
Company Size
MNC Irish<50 0 80%50-150 17% 10%150-500 50% 10%>500 33% 0
R & D Size
<5 17% 50%May-15 33% 50%
15-50 50% 0>50 0 0
R & D Budget
<50K 0 20%50K-500K 17% 80%500K- £2M 66%>£2M 17%
MNC R&D rporting into 83%Irish Plant
Reasons for Doing R&D
Product Improvement 66% 78%Process Improvement 83% 22%New Product Development 83% 100%Nw Process 83% 0
Scorings
R&D Drivers MNC IrishMeet customer demand 4.7 4.8Advance Technology 1.3 1.9Reduce costs 2.7 3.7Increase revenue 4.8 4.3
Complexity 8.8 8.9
129
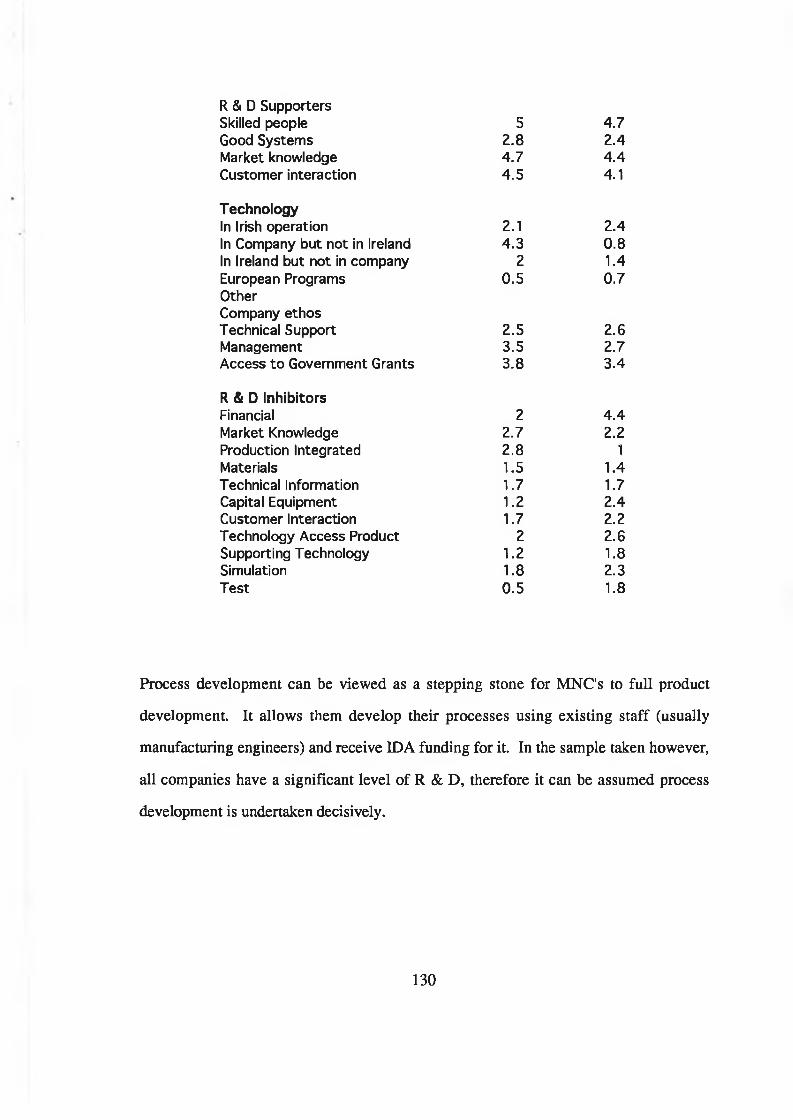
R & D SupportersSkilled people 5 4.7Good Systems 2.8 2.4Market knowledge 4.7 4.4Customer interaction 4.5 4.1
TechnologyIn Irish operation 2.1 2.4In Company but not in Ireland 4.3 0.8In Ireland but not in company 2 1.4European Programs OtherCompany ethos
0.5 0.7
Technical Support 2.5 2.6Management 3.5 2.7Access to Government Grants 3.8 3.4
R & D InhibitorsFinancial 2 4.4Market Knowledge 2.7 2.2Production Integrated 2.8 1Materials 1.5 1.4Technical Information 1.7 1.7Capital Equipment 1.2 2.4Customer Interaction 1.7 2.2Technology Access Product 2 2.6Supporting Technology 1.2 1.8Simulation 1.8 2.3Test 0.5 1.8
Process development can be viewed as a stepping stone for MNC's to full product
development. It allows them develop their processes using existing staff (usually
manufacturing engineers) and receive IDA funding for it. In the sample taken however,
all companies have a significant level of R & D, therefore it can be assumed process
development is undertaken decisively.
130

Process capability however, has become a serious competitive factor in the electronics
industry (Seliger. 1992), and the low level of process design among indigenous
companies is a factor that could reduce their long term competitiveness.
The factors supporting R & D were very similar for both indigenous and MNC's with
both groups rating market knowledge, customer interactions and skilled personnel as
more competent than R & D grants. There is a lot of frustration and ill-feeling among
indigenous companies about the dispersion of grants and the apparently arbitrary way in
which it is done. As was found in the British MC tool industry nobody who received
grants complained about them but they complained about the resources they consume
and the delays and complexities they introduce into projects.
The factors inhibiting R & D were significantly different for MNC's and indigenous
companies.
The biggest inhibitors for MNC's were lack of market knowledge and poor production
interface.
Both these factors can arise from the newness of the R & D operation in Ireland in
trying to deal with established patterns of manufacture and established markets. The "R
& D team" in the companies home base would have interacted much closer with its
market, and more than likely driven the production processes. The R & D group in
Ireland are expected to design a product that will serve a market with which they have
no familiarity using a production process they are only beginning to understand.
131

For the indigenous sector the main inhibiting factors are financial constraints and poor
access to product technology.
The overriding inhibiting factor to the indigenous sector is financial constraints
(averaging over 4 where the next highest average was under 3). This in turn limits their
access to capital equipment, markets and technology. One survey respondent described
R & D as a dirty word in the financial sector.
The survey results suggest that if a national system in innovation in electronics is to be
successful for indigenous and multinational companies it must:
(1) Maintain and develop the industry skills level
(2) Maintain and develop the level of interaction with markets and
customers
(3) Improve access to product technology
(4) Include the financial sector
132

4.9 Science & Technology Structural Funded Programmes
4.9.1 Programmes in Advanced Technology
Under the 1989 to 1993, Structural Programme for Industrial Development twelve
Programmes in Advanced Technology (PATs) were identified. There are eight PATs
operating today. One of these, the National Microelectronics Research Centre
(discussed under section 4.3), had been well established at the time of the establishment
of the other programmes and was simply re labelled for the purposes of securing
European Structural Funds.
Of the remaining seven, three of the programmes, Optronics, Power Electronics and
Telecommunications are directly involved in the electronics industry and three of the
remainder - Advanced Manufacturing Technology, Advanced Materials and Software
Development are in related areas. Taken together, these programmes represent a
significant investment in the creation of infrastructural R & D support. Their
establishment was outlined in the Department of Industry and Commerce Document -
Strategy for Irish Owned Electronics Industry which stated that 'the shortage of
experienced designers could also be addressed by the establishment of centres of
excellence in appropriate technologies Such centres may be created by drawing
together expertise and facilities that already exist in the universities and "NIHE",
Telecom Eireann and Eolas'. (Dept, of Industry & Commerce. 1989. P. 18).
The programmes in advanced technology were to allocate their resources, 20% to Irish
owned small businesses, 40% to Irish owned medium sized businesses and 40% to
overseas firms, while at the same time placing particular emphasis on creating links
133
into the EC Framework programmes for research and development.(Gorvemment of
Ireland. 1989. Para. 7.11).
The programmes in advanced technology were designed to increase the level of
infrastructural technical report in the specified areas. Each programmes is managed
centrally from Eolas to ensure maximum co-ordination is achieved. They are overseen
by a Board consisting of academic and industrial representatives. The industrial
representatives are in the majority. The programmes are intended to take advantage of
the existing level of expertise and research in the colleges to build on it and through the
employment of full time staff, to make it available to Irish industry. Central to the
success of the PATs is the concept of industry university co-operation. The issues
discussed in section 4.3.1 have not presented serious problems to the operation of the
PATs.
The first PAT to be established was Optronics Ireland which was set up in 1989
(Optronics Ireland 1991). From 1989-1992, the programme was focused on the
development of research facilities in its constituent colleges. It has commenced product
development for Aster Ireland Ltd and Telecom Eireann and is supplying Toshiba
Corporation with semiconductor wafers for optronic applications. The programme
costs for 1991 was just under £1.5m and it employed 39 people primarily on full time
research. At the same time, total optronics industry in Ireland consisted of 8 companies
employing 100 people (Optronics Ireland. 1991).
The other two programmes directly involved in electronics were not established until
late 1991. These are programmes in advanced technologies in Telecommunications and
Power Electronics. An indigenous telecommunications industry has been established
primarily as sub suppliers to Telecom Eireann. These companies are relatively large by
Irish standards and the technology is relatively advanced but by international standards
both their technology and size would not be competitive.
134
The Telecommunication PAT nevertheless undertook a research programme which was
centred on advanced telecommunications technology. This was done under the
direction of representatives of the telecoms industry and only one of its six main areas
of activity was useful to indigenous industry. The result has been that the primary work
of the Telecommunications PAT has been focused on European Framework Research
Programmes and to a lesser extent Irish based multinational companies. The
programme meets its objectives of interacting with Irish industry by providing services
to users of advanced telecommunications equipment (Teltec' 1993).
The PAT in Power Electronics, the third PAT directly involved in the electronics
industry was also established in late 1991. At this time Ireland already had a well
established R & D record for both multinational and indigenous power electronics
companies. The power electronics sector includes the power supply industry, electronic
transformer industry and motion control industry. The three multinational motion
control companies, AEG, Moog and SPS already had a significant R & D effort
underway The power supply and transformer industries are such that to be successful
the sales operation must include a significant customisation element. Both the
transformers and motion control sections in this category come under electrical
machinery OECD classification and as figure 4.3 illustrates, there has been steady
growth in R & D expenditure in both the multinational and indigenous sectors in this
sector, despite significant fall off in Government support since 1986. As discussed in
section 3.2 power supply technology is an area where indigenous companies have
proved competitive internationally. The result has been that within two years of its
startup the PAT in Power Electronics has had a significant interaction with both
indigenous and multinational companies based in Ireland and has been able to develop
135
the technology level of these companies and improve their international
competitiveness (Power Electronics Ireland 1992).
The two programmes in advanced technology partially involved in the electronics
industry are - the Advanced Manufacturing Technology Programme (AMT) and the
Advanced Materials Programme. The AMT programme was set up in 1987 as a
manufacturing consultancy service to Irish industry and has operated as such since then.
A review of this programme carried out by Technopolis Ltd in December 1992 (to be
published) found that their services were of use to industry but that the programme was
a consultancy service and not a research and development service. Its role should be to
facilitate Irish companies in adopting best practice manufacturing systems not to
develop or improve known processes. The report therefore recommended that the
programme should be managed as such.
The Materials Ireland programme which includes in its brief the investigation of
materials of particular relevance to the electronics industry such as ceramics and
insulating materials was established in late 1991. To date it has not been able to make
its technologies relevant to the electronics industry.
The software PAT has focussed its activities on applications software development and
has not had significant involvement with engineering or telecommunications
applicatons.
In general the programmes in advanced technology are viewed by the universities as
funding mechanisms for advanced research. The industry representatives have not been
able to or not been willing to redirect the research efforts towards the immediate or
medium terms needs of industry and the goals imposed on the programme by
136
Government of self financing have encouraged the programmes to look for money
where it is most readily available such as European Framework Programmes and
multinational companies often not located in Ireland.
These factors have made it difficult for these programmes to have the same impact on
the Irish economy as similar programmes have had in Japan , Korea, Germany and
Denmark.
4.9.2 Higher Education Industry Cooperation (HEIC)
The HEIC programme was designed to promote higher education links across industry.
It did not include the necessary administration infrastructure to allow this type of
interaction to take place and although the original budget allocated was £20M over the
four years expenditure to 1993 is less than £5M.
The programme pays 50% funding to a joint industry university research project. The
work is carried out in the university and university personnel would be expected to do
the marketing of their expertise followed by the processing and administration of the
grant application without any additional support.
For this reason most industry university projects in electronics have gone to the PAT
system where there is a more industry orientated interface. The HEIC scheme has been
most active in the fine chemicals and pharmaceutical sectors.
137
4.9.3 Regional Technical Support
The pilot scheme in the South East (SERTEC) was not successful in encouraging and
facilitating technological development and transfer. The scheme was attempting to
provide technological services across a wide spectrum from a relatively weak base, ie
the RTCs in Waterford and Carlow. In the electronics area it was providing computer
automation support and a CAD service.
These services were not at the same level as available commercially (from PCAS in
automation for example or from CAD system vendors), and although some industrial
interaction occurred the service did not have the anticipated impact. The service
currently runs on a budget of around £100K per annum.
In the electronics area industrial control and avionics research centres have been set up
in Dublin Institute of Technology College at Kevin Street.
Even with these additional activities, the monies allocated under Regional Technical
Support were not being spent.
The Regional Technical Support Framework did not materialise as envisaged.
138
In 1992, the government was facing a situation where a considerable amount of the
science & technology element (£13M) would remain unspent and therefore be lost.
To avoid this situation in July of 1992, the Department of Industry & Commerce
announced Measure 6 Grants for industrial R & D. These differed from IDA grants in
that:
(1) Projects had to be over £500,000
(2) There were "no strings attached", ie no jobs targets, no equity or royalty
payments
The companies to have received approvals in the electronics industry were:
AEG
Analog Devices
Apple Computer Ltd
Applied Micro Electronics Ltd
Ballyneety Manufacturing Services Ltd
Connaught Electronics
Cylon Controls
Datac Control
Digital Equipment Ltd
Donnelly Mirrors
Kestrel Security
4.9.4 Grants to Industry
The first round of structural funding from the EC is due to end in 1993.
139

Mentec
Pulse Engineering
Tellabs
Vitalograph
with a total of £8.23M approved.
The company list is divided equally between MNC's and indigenous companies.
This measure represents a partial shift back to a passive outward looking approach in
Government policy. It is driven primarily by a desire to find an effective means to
spend structural funds, at minimum cost to the exchequer and possibly by criticism by
the Industrial Review Group of the existing measures. (Industrial Review Group. 1992)
Since the money is budgeted for 1993 it is too early yet to see its impact. It is
interesting to note that four of the five indigenous Irish companies selected are in the
process control/sensing/security system cluster. This indicates the growing strength of
this sector rather than any deliberate policy implementation by the Government.
4.10 Conclusion
R & D in the electronics industry in Ireland has been reviewed under Eolas S & T
survey findings, IDA grants data, EC framework programmes, Higher education
activity and technology transfer.
The progress of R & D in electronics was discussed for each of the measured sub
sections - electronics, instruments and electrical machinery. The pattern was similar for
the first two where expenditure by MNC's on R & D grew from a situation in 1979
where it was approximately the same as that by indigenous to the situation in 1991
where for each it was almost 10 times as large.
140
In the electrical machinery sector, expenditure by indigenous companies grew from
being significantly less than that by MNC's in 1979 to being twice as much by 1991.
Indigenous companies involved in R & D in these areas are in the transformer design
(which is part of the power supply cluster) and electrical switch gear and motor control
which is part of the industrial control cluster. The performance of MNC's in this area
has been erratic.
When the three subsections are taken together there is no growth in the indigenous
sector and substantial growth in the MNC sector. The growth in MNC activity is the
result of more intensive R & D activity by the R & D performing companies. While the
lack of growth in the indigenous side is most likely due to the unsustainable high level
of R & D in the early 1980's
There was a close correlation between the establishment of R & D facilities by MNC's
and the availability of Gorvemment grants, but no correlation between the amount spent
and the availability of grants.
The use of technology transfer as an alternative to R & D as proposed by the Culliton
Industrial Review Group was reviewed and it was found that technology transfer was
effective in electronics only when accompanied by intensive R & D.
The third level sector and Government research centres were found to have a positive
influence on industrial R & D in other countries. In Ireland, it was found that up to
1989 these institutes were forced to participate in European Framework Programmes in
order to obtain research funding. This meant that the expertise that was available in
141
Ireland to support industrial R & D was being exploited by the European electronics
industry and providing little or no benefit to Ireland.
With the increasing emphasis on interventionist policies by the Dept, of Industry and
Commerce in promoting industrial development this situation was reversed in 1989 by
the establishment of a number of Programmes in advanced technology in electronics. It
was found, however, that because of their structure and funding mechanisms these
programmes are restricted in their effectiveness.
A detailed review of the R & D grants scheme was completed. It was shown that the R
& D grant recipients in electronics represented reasonably well the R & D activity of
the industry.
The distribution of R & D activity by location and by sector of the electronics industry
was presented.
The distribution by location highlighted:
(1) the impact of a "university culture and policy which supported industrial
development"
(2) The impact of foreign owned R & D intensive companies in inspiring
indigenous spin-off or related companies
The distribution by sector highlighted the high level of R& D indigenous activity in the
identified industry clusters. These clusters are developing in areas where economies of
scale are not so critical and include capital equipment, as well as product
manufacturing.
142

The results of a survey carried out on R & D intensive companies indicated a great deal
of similarity between multinational and indigenous companies with regard to R & D
support factors. The differences in inhibiting factors between the two can be explained
by their different sources of technology and finance.
Financial constraints is the major R & D inhibiting factor for indigenous electronic
companies. Companies require financial backing and support rather than grants. For this
to happen effectively the financial sector needs to take a participative role in the
electronics industry.
The availability of grants is not considered a decisive factor by either multinational or
indigenous companies undertaking R & D, both consider the availability of suitably
skilled people, knowledge of the market and customers with whom they can interact as
more important determining factors.
143

5 A N a tio n a l Sy st e m o f In n o v a t io nin E l e c t r o n ic s
144

5 A NATIONAL SYSTEM OF INNOVATION IN ELECTRONICS
5.1 Vicious Circles
In looking at Vicious circles in the electronics industry the starting point is the
industrialisation vicious circle (fig. 3.5).
In the 1980's the non-interventionist strategy in electronics became more interventionist
but was still coupled with a low state capacity for policy implementation.
The non integrated structure of MNC's was further strengthened by the arrival in Ireland
of their own multinational sub-suppliers who were also provided with generous
privileges and who had the effect of discouraging the creation of indigenous sub
suppliers. These multi-national sub-suppliers who used home based technology, and
Irish indigenous sub-suppliers who are concentrated in low tech sectors formed another
vicious circle which combined with the lack of Government support for Higher
Education Research forced the experts in these institutions into European national
systems of innovation.
Cash flow problems combined with the availability of research grants and costly grant
application and administration procedures forced indigenous companies into a grant
management rather than an innovation management role, delayed innovations and
sometimes encouraged the undertaking of otherwise non viable projects.
145
The virtuous circles in Irish electronics have been completed only on a limited scale in
specific sectors. The most complete circle is in the power supply industry.
Here there is
5.2 Virtuous Circles
(a) technology diffusion from MNC's
(b) test equipment development by indigenous companies
(c) strong magnetic component indigenous and MNC sub-supply
(d) strong support from third level sector
(e) post graduate power supply designers
(f) willingness of MNC's to accept Irish based suppliers of power supplies
(g) requirements for custom design in power supply industry
The cluster under development in the process control, security, building and sensor area
has not yet completed its circle and in addition to a strong system of innovation will
also need stronger links between suppliers and markets to ensure all elements of the
circle mutually reinforce one another.
In the multinational electronics sector there have been a number of companies with
strong Irish R & D centres.
These would include:
Analog Devices, Digital (Clonmel), Westinghouse, CPT, Zenith, Inland Motor (AEG),
Computer Products and ATT.
146
The ones that have failed in general had R & D control in the home base and had no
marketing in Ireland; the ones that have done best (in terms of delivering new
acceptable products to the market) have had marketing and R & D controlled in Ireland
- Analog Devices, Computer Products, AEG and more recently Pulse Engineering.
Among the failures are :
CPT, who had a staff of 50 engineers working in Cork on the design of their new PC.
Their marketing group was based in the US. The product was delivered on time and
launched in London. The product had failed within 6 months.
Zenith employed 20 people in Kells on power supply design between 1987 and 1990.
they had a marketing team, based in Kells which fed into a design control group in the
US which managed projects carried out by the Irish design group.
The Digital communications systems and power supply design groups based in Clonmel
report to US headquarters and would not be expected to know who their customers
were.
On the other hand MNC's with strong design groups that still exist are Analog Devices
in Limerick, who have integrated design and marketing approach to their customers as
do Computer Products and AEG and Pulse Engineering who have recently invested
significantly in their R & D effort. This user producer interaction is the essential driver
in a national system of innovation. Their resulting innovation process is further
supported by significant Higher Education interaction and Government support.
147
5.3 The Electronics Design Process
Electronic products consist of assemblies of interconnected electronic components on
one or more printed circuit board. The printed circuit boards, and other components are
usually housed in a mechanical assembly made up of plastic or sheet metal.
The assembly interfaces with the outside world through input/output devices. There can
be a CRT tube (output device), keyboard (input device), printer, microphone etc. These
input/output devices usually contain their own set of electronic sub assemblies.
The electronic design process includes:
(1) System design
(2) Board level/sub-assembly design
(3) Component design
The system is supplied to meet a particular application, chemical process control,
security system, or payroll system. It is the system user who very often knows best the
configuration and features he needs. The system designer interprets these requirements
for the board manufacturer who in turn works with the component designer.
With this process is the systems are relatively easy to design, boards and subassemblies
more difficult and components can take a long time. The "core" electronic technology
is very often the component.
148

It is in the system and board designs that the user has most influence and where user
producer interaction is most important. It is also important at component level but here
the basic technology, technology support systems and capital are also important. The
design of electronic components requires significant investment in CAD and
lithography.
The security/process control cluster where Irish indigenous industry is achieving some
success is at system and subassembly level.
Sensors which are included in this cluster are component level products and represent
the core technology around which the competitive advantage of this cluster could be
based.
Power supplies are sub-assembly level products and the component technology is
transformers.
5.4 Recommendations on the Creation of a National System of Innovation
in Electronics
A number of elements of a national system of innovation are already in place in the two
industry clusters discussed:
(1) Strong higher education sector performance in electronic R & D
(2) Groups of innovative R & D intensive multinational and indigenous
companies
(3) An interventionist state policy to support growth in indigenous
companies
149

(4) A highly skilled workforce in electronic R & D
(5) Good market and customer interaction by electronic R & D performing
multinational and indigenous companies
However the market and customer interaction activity requires strengthening, the state
interventionist policy needs to be better informed and more clearly focused and the
links between all these elements needs to be strengthened in particular the links between
the Higher Education and the Electronics industry.
In addition the financial sector needs to be brought into the innovation system. The
resulting innovation system in electronics is illustrated in fig. 5.1 and the corresponding
virtuous circle in fig. 5.2.
Policy measures discussed in Chapter 2 have been successful in promoting inter-firm
technology cooporation (EC programmes) and strengthening links between
Universities and industry (Japanese and Korean). State policy in Korea and Japan has
also been focused in specific areas of technology. The Irish state already has R & D
funding mechanisms which could be modified to meet these objectives.
The measure 6 R & D grants could be used (as ESPRIT funding is used by the EC) to
(1) Promote R & D in very narrow areas where Ireland has demonstrated
some potential for national competitive advantage (Power supplies
security systems, electric control in building and industrial control).
(2) Encourage user-producer cooperative innovations by limiting grants to
projects involving users and producers
(3) Encourage third level participation in such projects in the same way as
the EC programmes do (ie by funding it as 100% direct costs)
150
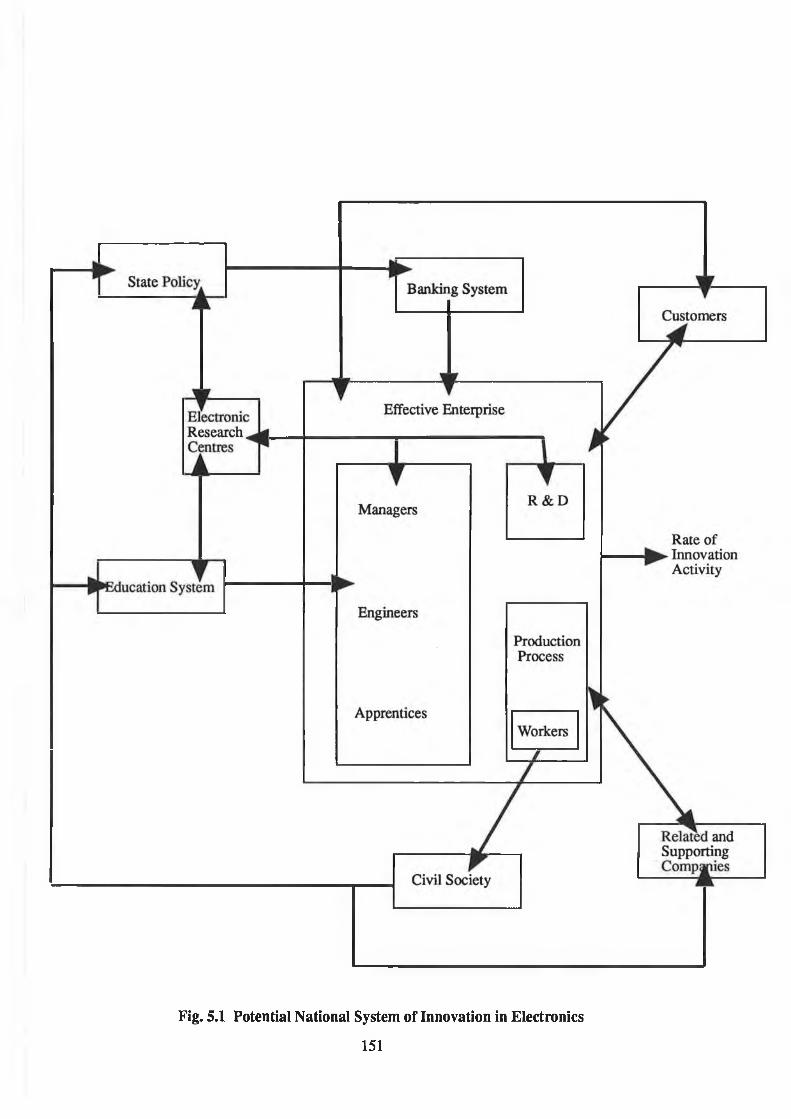
Fig. 5.1 Potential National System of Innovation in Electronics
151
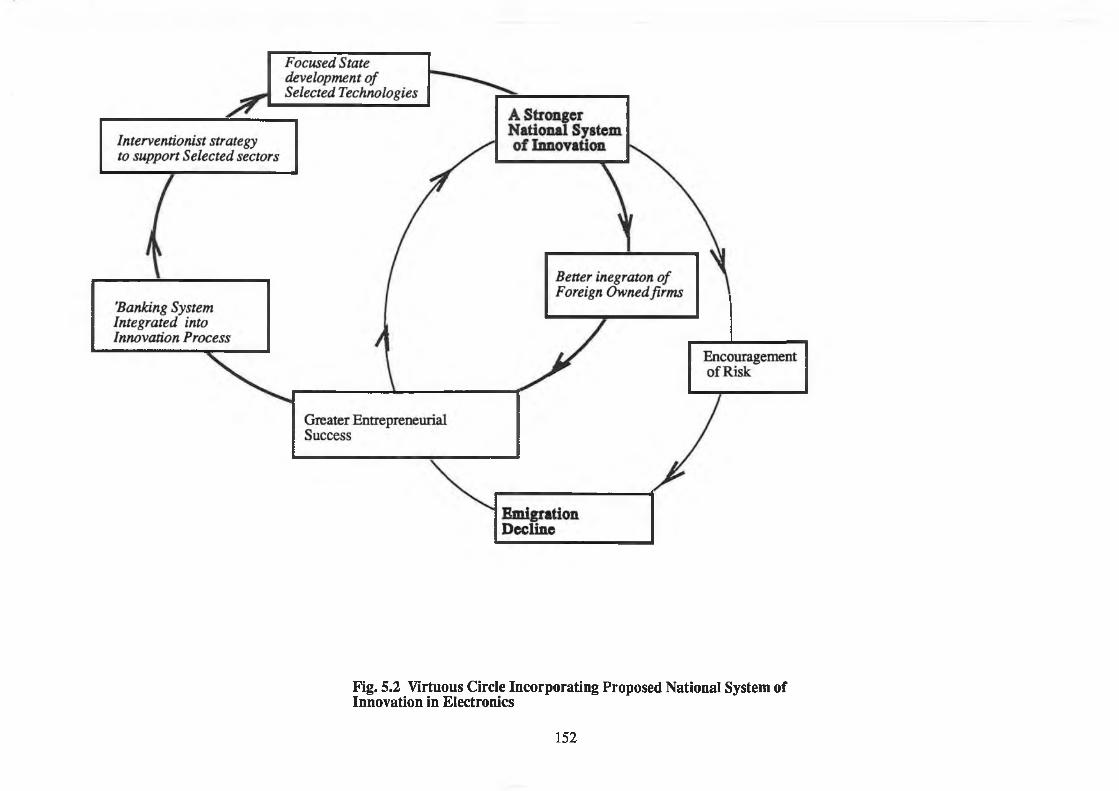
Fig. 5.2 Virtuous Circle Incorporating Proposed National System of Innovation in Electronics
152
National technical competence needs to be developed in the same way as
it was done in Japan and Korea. Programmes in advanced technology
and higher educational industry links need to be significantly more
focused.
The industry sectors they are targeted to support need to be clearly identified and
representatives of these industries vested with control of the programmes.
The requirement for self financing of these programmes while it was necessary to curb
academic excesses is not consistent with the creation of national competitive advantage
through technology. It means the most promising technological developments will be
sold to the highest bidders which are very unlikely to be indigenous electronic
companies.
The sectors of the electronics industry which should be targeted have been identified.
Technology objectives needs to be set for these sectors and funding needs to be made
available to ensure these objectives are achieved. This funding is already available
under measures 1 and 2 but it is being spent inefficiently (as described in sections 4.9.1
and 4.9.2).
Multinational companies in the power supply and industrial control sectors are already
closely involved with higher education institutes, the focusing of research in these
institutes will strengthen their industrial links and further integrate these MNC's into the
national system of innovation.
It has been apparent that grants are not the best way to foster R & D. In fact, it is not
money itself that is the problem but the loss of credibility that spending money o n R &
153

D creates for the industrialist with his banker. Irish bankers prefer fixed assets. This is
part of the vicious socio political circle of conservatism.
It is not necessary for banks to spend or risk more money but to lend credibility to the R
& D process by participating in it.
This vicious circle is being undermined by the current programme on local enterprise in
which the banks are committed to participate.
In the electronics industry R & D is the most costly and most important element of
enterprise.
The implementation of measures to promote inter firm cooperation and focused support
for sectoral technology development will see the emergence of new and bigger
electronics companies in the sectors discussed.
This will lead to a demand for finance which should integrate the banking sector as
partners in the R & D process.
Fig. 5.1 is derived from fig. 3.6 and incorporates some of the recommendations for the
electronics industry listed above.
State funded electronic research centres and their close interaction with industry have
been an important feature of successful electronic innovative economies.
The banking system needs state encouragement to become more involved in the
innovation system and in the electronics industry.
154
It is important that customers actively participate. In the system shown this
participation is encouraged by state policy.
The positive experience of wage earners in the successful enterprise is illustrated as
encouraging within society the establishment of related and supporting industries. The
mushrooming of the electronics industry in California was an example of this and in the
electronics industry in Ireland there have been some examples on a much smaller scale
(such as the cluster of indigenous printing, electronic assembly and computer add-on
companies that have grown up around the Apple plant in Cork).
Fig. 5.2 illustrates this innovation system as part of the virtuous circle of self sustaining
growth.
This stronger national system of innovation will lead to more indigenous
entrepreneurial success and greater integration of Foreign owned firms though their
participation in the innovation process. The success of indigenous companies will
encourage greater involvement by the banks and will further encourage state
involvement both in direct support of the companies and in support of related
technology research and development leading to further strengthening of the innovation
system.
The product sectors identified as having potential competitive advantage process
control/security systems and power supplies already enjoy a positive system of
innovation. This tightening up of all the supporting elements will accelerate their
development towards international competitiveness.
155

Some economists have expressed surprise or disbelief (Porter 1990) at the ability of
Government officials (in Japan or Korea), with little or no experience in the relevant
areas to be able to choose winning industries and technologies.
The virtuous circle illustrated is a positive feedback system and provided the system
remains intact it will continually amplify any industry that is introduced into it. The
rate of growth and innovation activity will depend on the investment in the system. For
the Irish electronics industry, sectors need to be chosen that will provide the greatest
growth, for the minimum investment.
The computer industry indigenous electronic sub-supply sector is particularly weak
(with the exception of power supplies) and all the supporting elements outlined above
are missing (except for (3) which itself is ambiguous). It is therefore unlikely that
existing or new Irish industries in this sector will become internationally competitive.
156

6 C o n c l u s io n
157
6 CONCLUSION
The Telesis Report (1982) described the electronics industry in Ireland as being a low
skilled industry, dominated by multinational companies. The indigenous sector was
weak. The level of R & D carried out by both MNC's and indigenous companies was
generally very low.
The theoretical background on the impact of technological change on economic
development has highlighted both the contribution of technology to growth and its
contribution to unemployment, but the empirical evidence shows a very close
relationship between electronic technology development and economic well-being.
This correlation is further supported by studies of Japan and Korea where state policies
aimed at encouraging electronic technological development have resulted in rapid
economic growth.
A set of specific problems related to small company innovation and of particular
relevance to the Irish electronics industry, were identified.
A Porter analysis of the electronics industry in Ireland suggested that Ireland had
potential competitive advantages in advanced factor conditions, demand conditions and
related and supporting industries.
The analysis highlighted the existence of an indigenous industry cluster in the area of
security systems, industrial control and electronic building technologies and a
multinational/indigenous cluster in the area of power supplies.
158
The analysis also indicated that to take advantage of its potential competitive advantage
in the areas of demand conditions and related and supporting industries the electronics
industry needed to strengthen its R & D capability.
This underlying factor of innovative capability coupled with the experience of Japan
and Korea with National Systems of Innovation in Electronics and the user as the main
source of innovation in the electronics industry, suggested that a National System of
Innovation Model might be an appropriate model for a review of R & D in the Irish
electronics industry.
A review of the general development of the electronics industry since Telesis indicates:
(a) A significant growth in the number of indigenous companies
(b) A significant growth in employment in indigenous companies
(c) A slow growth in productivity in indigenous firms
(d) A slow growth in average size of indigenous firms
A detailed review of IDA R & D activity combined with a survey of R & D companies
has demonstrated that:
(1) University R & D in electronics combined with University ethos and
culture which supports industrial development is effective in promoting
R & D
(2) Multinational company intensive activity in electronic R & D can lead to
spin off and related companies in the indigenous sector
(3) People skills in electronics, market knowledge and interaction with
customers are the most important factors in making R & D effective
159
(4) Grants although important are not considered a decisive factor by any of
the companies interviewed
(5) The Hack of interest taken by the financial community in R & D is the
biggest inhibitor of R & D by indigenous electronic companies
(6) The state policy on R & D in electronics has been inconsistent and
unfocused.
In a general review of R & D in electronics in the International context, the study has
shown that the impact of correct R & D national policies can have more dramatic
effects (as been demonstrated in Japan, Korea and on EC programmes) than even those
reported by Solow in the US. Inappropriate or unfocused policies however can
contribute to the decline of industries (as in the UK).
The results of the review of R & D activity have been used to develop a national system
of innovation in electronics based on Mjoset's proposed Model (fig. 3.2) but
incorporating specific features of importance to the electronics industry.
This model has been included as the pivotal element in a potential virtuous circle in
electronics where individual elements will continually support one another leading to
ever increasing national competitive advantage in the electronics industry.
160

Bibliography
Allen, David N and Victor Levine: Nuturing Advanced Technology Enterprises. Praaeger. New York. 1986.
Alvey: A Ivey Programme Annual Report 1987. IEE for Alvey Directorate. London. 1987.
Alvey: Report of the Alvey Committee: A Programme for Advanced Technology. HMSO. London. 1982.
Azaroff, Leonid V.,: Industry University collaborations; How to Make it Work. Research Management. May. 1982
Bide Report: Information Technology - A Plan for Concerted Action: The Report of the IT86 Committee. 1986. HMSO. London.
Blair, J.M.: Economic Concentrations. Harcourt. Brace Jovanovich. London. 1972. 1972.
Braendgaard, Asger: ESPRIT and the Danish Electronics Industry form Small Countries facing Technological Revolution. Ed: Christopher Freeman and Bergtáke Lundvall. Printer Publishers. New York. 1988
Bridges, Benjamin. State and Local Inducement for Industry. National Tax Journal. 18: 1965
Campbell, Alan K. Taxes and Industrial Location in the New York Metropolitan Region. National Tax Journal.. 1958
Chen, E.K.Y. Multinational Corporations,Technolog and Employment. St. Martin's Press. New York. 1987
Commission of the European Communities: Panorama of EC industries 1991-1992. ECSC-EEC-EAEC. Luxemburg. 1991
Commission of the European Communities: ESPRIT Results and Progress 1991/1992 ECSC-EEC-EAEC. Luxemburg. 1992
Coniffe and Kennedy. Employment and Unemployment in Ireland ESRI. Dublin. 1984.
Daly, Ann e.Government Support for Innovation of British Machine Tool Industry, A Case Study from Industrial Policy and Innovation, edited by Charles Carter. Heinemann. London. 1981
161

Department of Industry & Commerce: Strategy for the Irish Owned Electronics Industry. Government Publications. 1989
Donohoe, James: 'Scotland Battles Ireland for Foreign Investment' Mini micro Systems. January. 1985
Dwyer, Joseph: The development of the Irish telecommunications network using optical fibre cables
Edquis, Charles and Benct Luundeval: Comparing small Nordic systems of innovation from national innovation systems Editor Richard Nelson. Oxford. 1992 .
Fischel, William A. Fiscal and Environmental Considerations in the Location of Firms in Suburban Communities. In Fiscal Zoning and Land Use Controls, edited by E. S. Mills and W. E Oats. Lexington, MA: D. C. Heath. 1975
Forstner, H. & Ballance, R.. Competing in a Global Economy. Unwin. London. 1990
Fowler, Donald R.: Industry Research Relations. Research Management. Jan-Feb.1984..
Freeman, C. Technology Gaps and International Trade from form Small Countries facing Technological Revolution. Ed: Christopher Freeman and BergtSke Lundvall. Printer Publishers. New York. 1988
Friedrick. Gimter amd Aidan Schoff. Microelectronics and Society for Better or for Worse. Pergamon Press. Oxford. 1982
Frost & Sullivan The European Market for Switched Mode Power Supplies. London. 1991
Galbraith, J.K.: The New Industrial State. New American Library. New York. 1967 1985.
Georghiou, L. et. al.: Evaluation of the Alvey Progamme. Interim Report. HMSO. London. 1987
Gorvemment of Ireland. Promoting Development and Structural Adjustment in Ireland under the Community Support Framework. Govememnt Publications. Dublin 1990
Hagedoom, John: The Dynamic Analysis of Inovation and Diffusion : A study in Process Control. Pinter Limited. London. 1989.
Halm, George N .: Economic Systems; A Comparative Analysis. 3rd ed. 1968. Holt Rinehart and Winston. New York
Hung, Peter and and Pizzi, Robert E. : The Effect of UK incentives onR & D Activities in US owned electronics companies in Scotland. R & D Management 15, 3,1985
162
Hanna, David: The Electronics Industry in Ireland - Electronics Report. September. 1983.
Howell, Thomas R, William A Noellert, Janet H. MacLaughlin and Alan Wm. Wolff: The Microelectronics Race: The Impact o f Governemnt Policy on International Competition. Westview Press London. 1988
Hughes, Thomas: Networks o f Power. John Hopkins University Press. Baltimore. 1983
ICA Information. Spain. August 1985., pages 45 -66 Microelectronics and its implications for Ireland. An assessment for the 1980s
IDA. Annual Report. 1990
IDA. Annual Report. 1991
IDA. Annual Report. 1992
Industrial Review Group. A Time for Change: Industrial Policy for the 1990"s. Gorvemment Publications. Dublin. 1992.
International Business. July/August. 1993.. Samsung advertising feature. 1993
Johnson, C.: M/77, MPT and the Telecom Wars. How Japan Makes Policy for Hgh Technology. BRIE working paper no 21. Sept. 1986. University of California
Kamien, MI. and Schwartz, N.L.,Market Structure and Innovation Cambridge University Press. Cambridge. 1982
Kinsella, R.: The Medium Term Development o f Indigenous Industry: The Role of the Financial Sector. Goverment Publications Office. Dublin. 1992
Lovell, Michael C.: Macro Economics: Measurement Theory and Policy . 1975.John Wylie & Sons. New York
McGowan, Kieran: The Electronics Industry. Irish Banking Review. Winter 1991
Magaziner, Ina C. and Mark Patinlun: The Silent War. Random Houre Inc. New York 1989.
Mansfield, E. Measuring the Social and Private Rates of Return on Innovation in Economic Effects o f Space and Other Advanced Technologies. Strasbourg, Council of Europe. 1980
Mjoset, Lars: The Irish Economy in a Comparative Institutional Perspective. National Economic and Social Council. 1992
Morita, Akio. Made in Japan. Fontant/Collins. Glasgow. 1988
163

Mulkey, David and B.L. Dillman: Location and the Effects o f State and Local Development Subsidies. Growth and Change 7:71-80. 1976.
NMRC Annual Report. 1990
Nortthcoff, J. and P. Rogers: Microelectronics in British Industry - the Pattern of Change. Policy Studies Institute. 1984. London
O'Brien, Roland '.Technology in Industrial Development - The Irish Electronics Industry in the International Context, f tom Perspectives in Irish Management. Editors Jim Fitzpatrick, John H Kelly. IML Dublin. 1985
O'Malley, Eoin, Kieran A Kennedy and Rory O'Donnell: Report to the Industrial Policy Review Group on the Impact o f the Industrial Development. Government Publications. 1992
O'Malley: Eoin. The Irish Engineering Industry Strategic Analysis and Policy Recommendations.. ESRI. Dublin 1987
O'Malley, Eoin. Industry and Economic Development, the Challenge fo r the Latecomer. Gill and Macmillan. 1989. Dublin
OECD. Major R &D Programmes for Information Technology. Paris. 1989
OECD. Technology and the Economy . Paris 1992
Optronics Ireland. Annual Report. Dublin. 1991
Porter, M.E.: The Competitive Advantage of Nations. Macmillan Press Ltd. London. 1990
Power Electronics. Newsletter. Dublin. March 1993.
Rothwell, R and Zegveld, W: Innovation and the Small and Medium size Firm. Francis Porter. London. 1982
Schoenberger, Richard J.: World Class Manufacturing: The Lessons of Simplicity Applied. The Free Press. New York. 1986
Sectoral Development Committee (SDC) On the technological capacity of indigenous Irish industry . Government Publications. Dublin. 1985
Patel, P. and Pavitt, K.: Europe's Technological Performance from: Technology and the Future of Europe. Editors, Freeman, Sharp and Walker, Pinter. London. 1991
164
Seliger, G.: The Role of Design in Achieving Cost Effective Manufacture in Europe AMT Proceedings , Galway. Sept. 1992
Sharp, M.: The Single Market and European Technology Policies from: Technology and the Future of Europe. Editors, Freeman, Shaip and Walker, Pinter. London.
1991
Solow, Robert: Technical Change and the Aggregate Production Function : Review of Economics and Statistics. August. 1957
Speigelman, Robert G.: A Study o f Industry Location Using Multiple RegressionTechniques. Washington, DC. Economic Research Service. U S Department of Agriculture. 1964
Telesis : Review of Industrial Policy. NESC. Dublin. 1982
Teltec Promotional Material,. Programme Launch. Dublin. 1993
Terkal, M.: Interactive management, innovation and new venturing. Elsever Science Publications. Amsterdam. 1990. P 529
Vaughan, Roger J.: Capital Needs of the Business Sector and the Future Economy of the City, from In Cities and Firms edited by Herrington J. Boyce. Lexington Books. Lexington, MA. 1980
Von Hippel, Eric. : The Sources of Innovation.. Oxford University Press. 1988
165
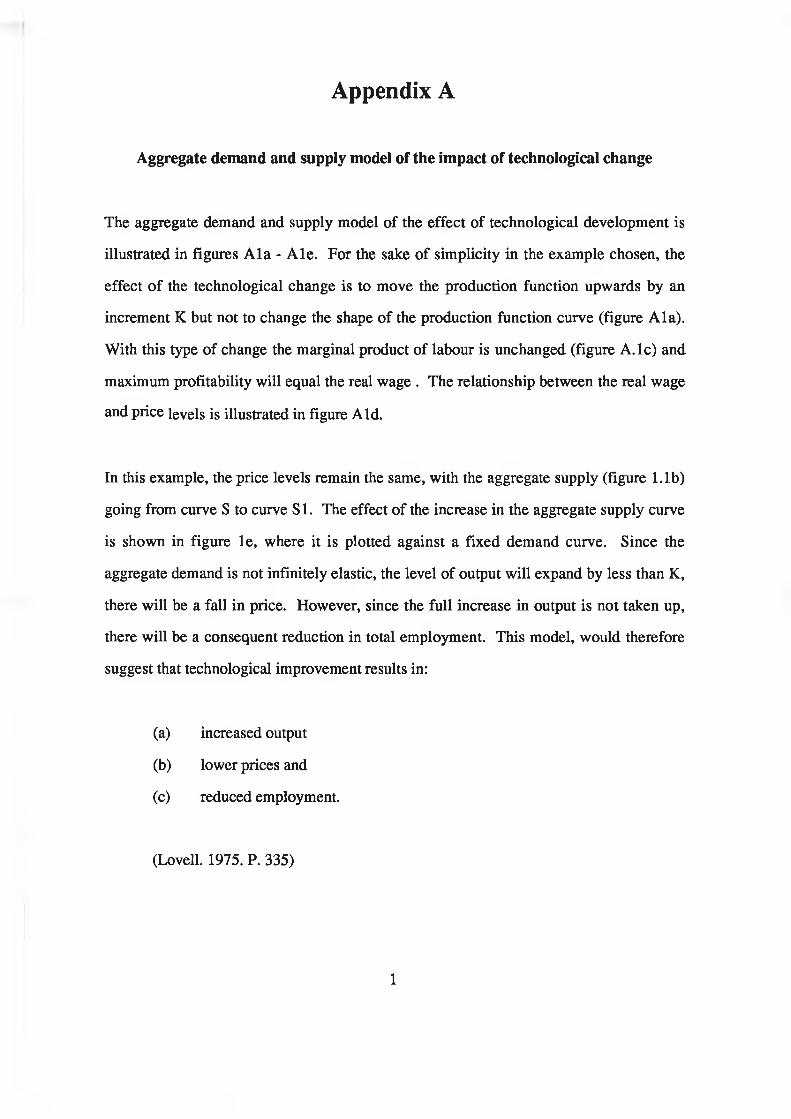
Appendix A
Aggregate demand and supply model of the impact of technological change
The aggregate demand and supply model of the effect of technological development is
illustrated in figures A la - A le. For the sake of simplicity in the example chosen, the
effect of the technological change is to move the production function upwards by an
increment K but not to change the shape of the production function curve (figure Ala).
With this type of change the marginal product of labour is unchanged (figure A .lc) and
maximum profitability will equal the real wage . The relationship between the real wage
and price levels is illustrated in figure Aid.
In this example, the price levels remain the same, with the aggregate supply (figure 1.1b)
going from curve S to curve SI. The effect of the increase in the aggregate supply curve
is shown in figure le, where it is plotted against a fixed demand curve. Since the
aggregate demand is not infinitely elastic, the level of output will expand by less than K,
there will be a fall in price. However, since the full increase in output is not taken up,
there will be a consequent reduction in total employment. This model, would therefore
suggest that technological improvement results in:
(a) increased output
(b) lower prices and
(c) reduced employment.
(Lovell. 1975. P. 335)
1
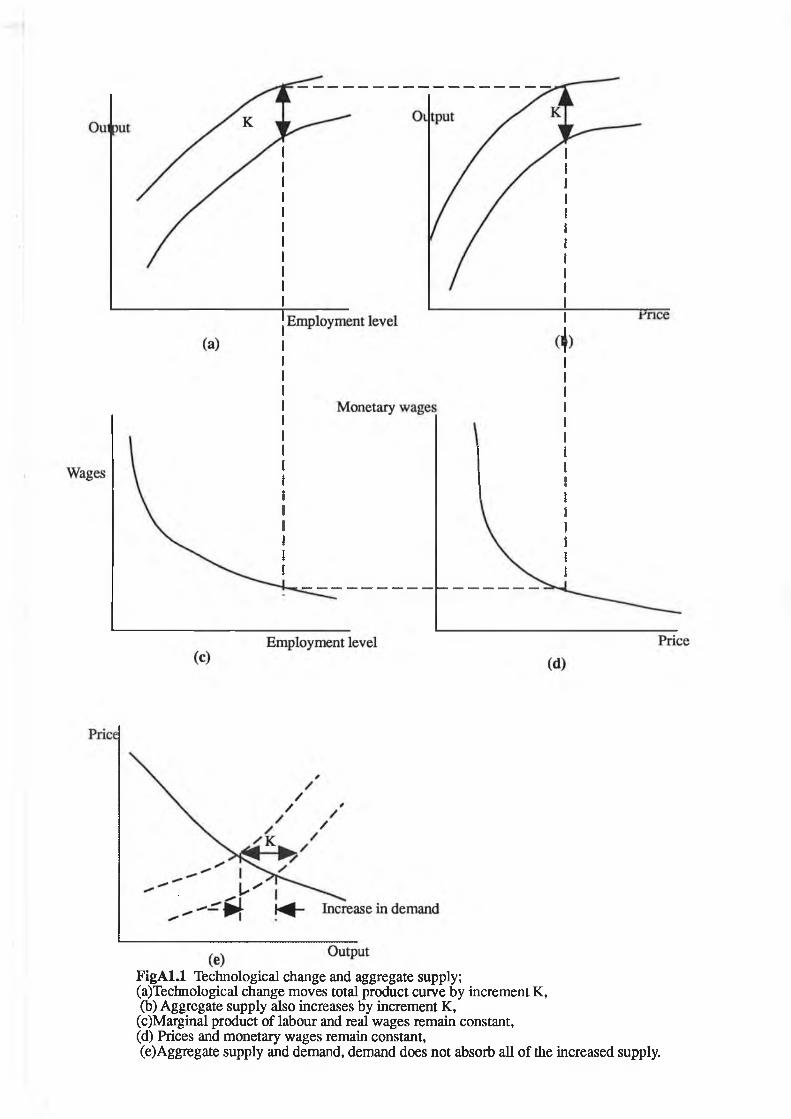
FigAl.l Technological change and aggregate supply;(a)Technological change moves total product curve by increment K,(b) Aggregate supply also increases by increment K,
(c)Marginal product of labour and real wages remain constant,(d) Prices and monetary wages remain constant,(e)Aggregate supply and demand, demand does not absorb all of the increased supply.
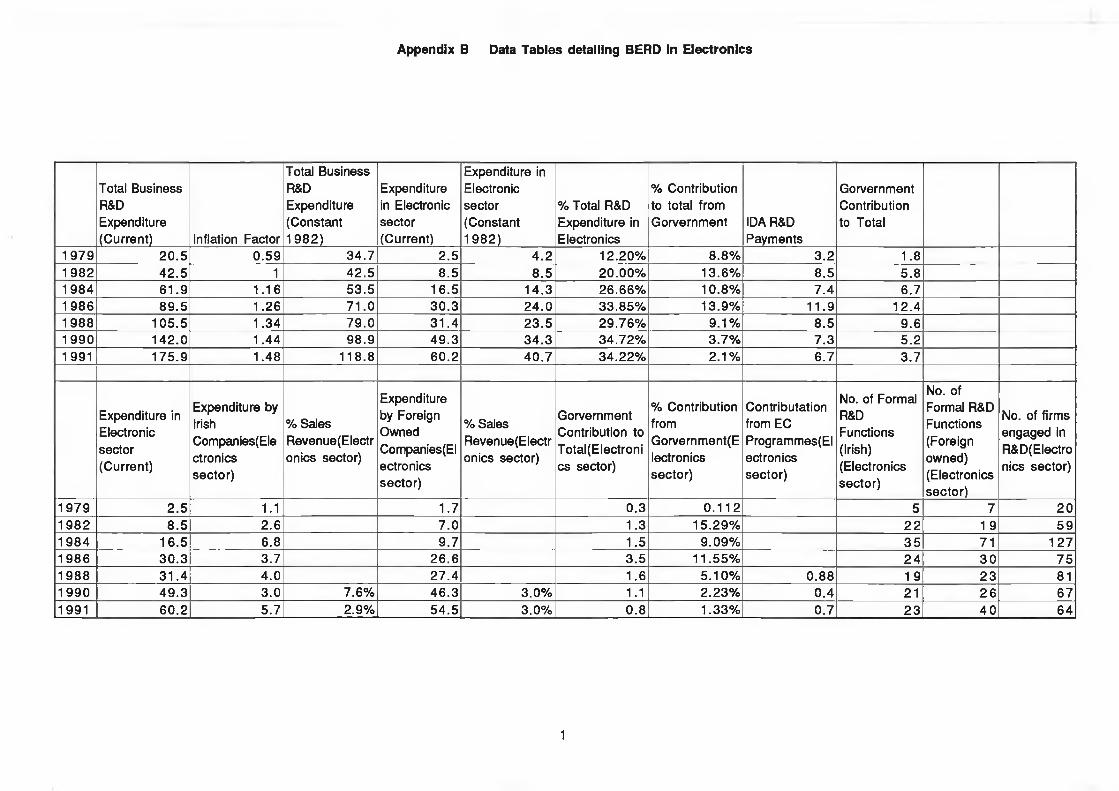
Appendix B Data Tables detailing BERD In Electronics
Total Business R&DExpenditure(C u rren t) Inflation Factor
Total Business
R&DExpenditure(Constant1 9 8 2 )
Expenditure
in Electronic
sector
(C u rren t)
Expenditure inElectronicsector(Constant1 9 8 2 )
% Total R&D
Expenditure in
Electronics
% Contribution
to total from
G orvernm ent IDA R&D
Paym ents
G orvernm ent Contribution
to Total
1 9 7 9 2 0 .5 0 .5 9 3 4 .7 2 .5 4 .2 1 2 .2 0 % 8 .8 % 3 .2 1 .81 9 8 2 4 2 .5 1 4 2 .5 8 .5 8 .5 2 0 .0 0 % 1 3 .6 % 8 .5 5 .81 9 8 4 6 1 .9 1 .1 6 5 3 .5 1 6 .5 1 4 .3 2 6 .6 6 % 1 0 .8 % 7 .4 6 .71 9 8 6 8 9 .5 1 .2 6 7 1 .0 3 0 .3 2 4 .0 3 3 .8 5 % 1 3 .9 % 1 1 .9 1 2 .41 9 8 8 1 0 5 .5 1 .3 4 7 9 .0 3 1 .4 2 3 .5 2 9 .7 6 % 9 .1 % 8 .5 9 .61 9 9 0 1 4 2 .0 1 .4 4 9 8 .9 4 9 .3 3 4 .3 3 4 .7 2 % 3 .7 % 7 .3 5 .21 9 9 1 1 7 5 .9 1 .4 8 1 1 8 .8 6 0 .2 4 0 .7 3 4 .2 2 % 2 .1 % 6 .7 3 .7
Expenditure in
Electronic
sector
(C u rren t)
Expenditure by
IrishCompanies(Electronicssecto r)
% Sales
R evenue(E lectr
onics sector)
Expenditureby ForeignOwned
Companies(EIectronicssecto r)
% Sales
R evenue(E lectr
onics sector)
G orvernm ent Contribution to
T ota l(E lectron i cs sector)
% Contribution
fromG orvernm ent(E
I ectronics
secto r)
Contributation from EC
Program m es(EI ectronics
secto r)
No. of Formal R&DFunctions
(Irish)(Electronicssecto r)
No. ofFormal R&DFunctions(Foreignowned)(Electronicss e c to r)
No. of firms
engaged in
R&D(Electro
nics sector)
1 9 7 9 2 .5 1.1 1 .7 0 .3 0 .1 1 2 5 7 2 01 9 8 2 8 .5 2 .6 7 .0 1 .3 1 5 .2 9 % 2 2 1 9 5 91 9 8 4 1 6 .5 6 .8 9 .7 1 .5 9 .0 9 % 3 5 71 1 2 71 9 8 6 3 0 .3 3 .7 2 6 .6 3 .5 1 1 .5 5 % 2 4 3 0 7 51 9 8 8 3 1 .4 4 .0 2 7 .4 1 .6 5 .1 0 % 0 .8 8 1 9 2 3 811 9 9 0 4 9 .3 3 .0 7 .6 % 4 6 .3 3 .0 % 1.1 2 .2 3 % 0 .4 21 2 6 6 71 9 9 1 6 0 .2 5 .7 2 .9 % 5 4 .5 3 .0 % 0 .8 1 .3 3 % 0 .7 2 3 4 0 6 4
1
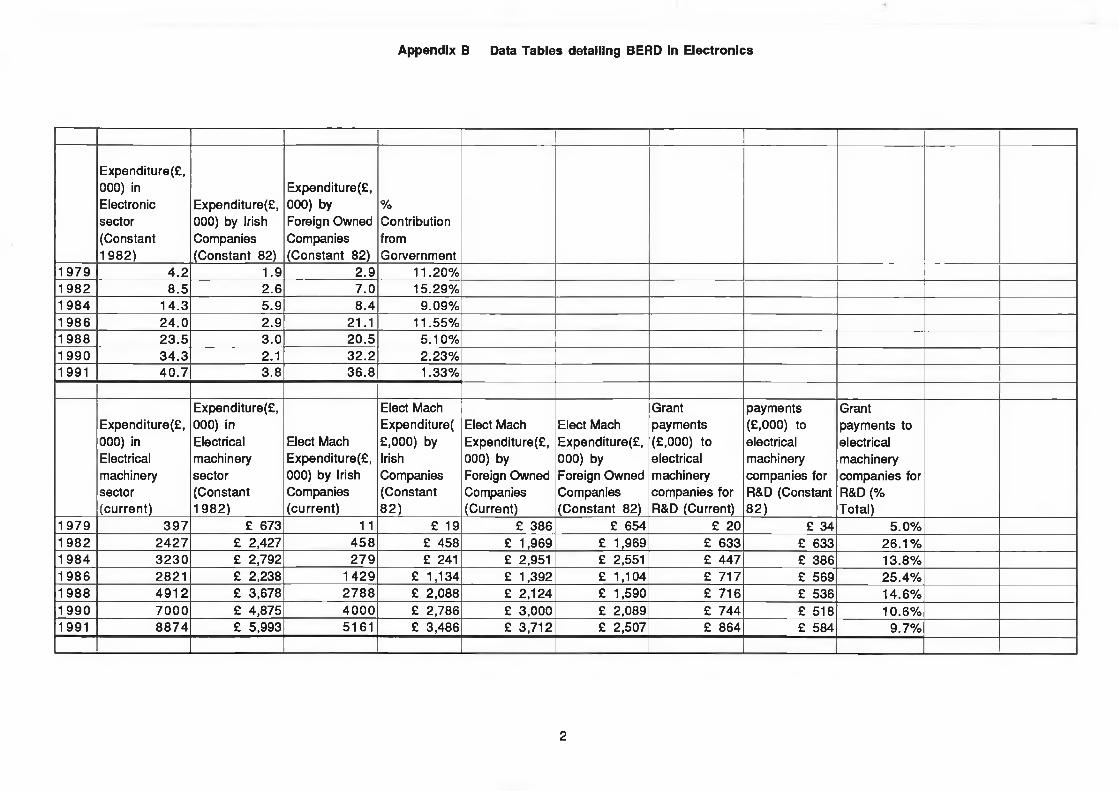
Appendix B Data Tables detailing BERD In Electronics
E x p e n d itu re ^ ,000) inElectronicsector(Constant1 9 8 2 )
E x p e n d itu re ^ , 00 0) by Irish
Com panies
(C onstan t 82 )
E x p e n d itu re ^ , 00 0) by Foreign Owned
Companies
(C onstan t 82 )
%ContributionfromG o v e rn m e n t
1 9 7 9 4 .2 1 .9 2 .9 1 1 .2 0 %1 9 8 2 8 .5 2 .6 7 .0 1 5 .2 9 %1 9 8 4 1 4 .3 5 .9 8 .4 9 .0 9 %1 9 8 6 2 4 .0 2 .9 2 1 .1 1 1 .5 5 %1 9 8 8 2 3 .5 3 .0 2 0 .5 5 .1 0 %1 9 9 0 3 4 .3 2 .1 3 2 .2 2 .2 3 %1 9 9 1 4 0 .7 3 .8 3 6 .8 1 .3 3 %
E x p e n d itu re ^ ,00 0 ) inElectricalmachinerysector(c u rre n t)
E x p e n d itu re ^ ,0 0 0 ) inElectricalm achinerysector(C onstant1 9 8 2 )
Elect Mach
E x p e n d itu re ^ , 000) by Irish
Companies (c u rre n t)
Elect Mach
Expenditure( £ ,0 0 0 ) by
IrishCom panies(C onstant8 2 )
Elect Mach
E x p e n d itu re ^ , 000) by
Foreign O wned Companies
(C u rren t)
E lect Mach
E x p e n d itu re ^ , 0 0 0 ) by
Foreign O w ned
Com panies
(C o n stan t 82 )
Grant paym ents
(£ ,0 0 0 ) to
electrical m achinery
com panies for
R&D (Current)
paym ents
(£ ,0 0 0 ) to
electrical m achinery
com panies for
R&D (Constant 8 2 )
G rantpaym ents to
electrical m achinery
com panies for R&D (%T o ta l)
1 9 7 9 3 9 7 £ 67 3 11 £ 19 £ 3 8 6 £ 65 4 £ 2 0 £ 34 5 .0 %1 9 8 2 2 4 2 7 £ 2 ,4 2 7 4 5 8 £ 4 5 8 £ 1 ,9 6 9 £ 1 ,9 6 9 £ 6 3 3 £ 633 2 6 .1 %1 9 8 4 3 2 3 0 £ 2 ,7 9 2 2 7 9 £ 241 £ 2 ,951 £ 2,551 £ 4 4 7 £ 3 8 6 1 3 .8 %1 9 8 6 2 8 2 1 £ 2 ,2 3 8 1 4 2 9 £ 1 ,1 3 4 £ 1 ,3 9 2 £ 1 ,1 0 4 £ 7 1 7 £ 5 6 9 2 5 .4 %1 9 8 8 4 9 1 2 £ 3 ,6 7 8 2 7 8 8 £ 2 ,0 8 8 £ 2 ,1 2 4 £ 1 ,5 9 0 £ 7 1 6 £ 53 6 1 4 .6 %1 9 9 0 7 0 0 0 £ 4 ,8 7 5 4 0 0 0 £ 2 ,7 8 6 £ 3 ,0 0 0 £ 2 ,0 8 9 £ 7 4 4 £ 51 8 1 0 .6 %1 9 9 1 8 8 7 4 £ 5 ,9 9 3 5 1 6 1 £ 3 ,4 8 6 £ 3 ,7 1 2 £ 2 ,5 0 7 £ 8 6 4 £ 58 4 9 .7 %
2
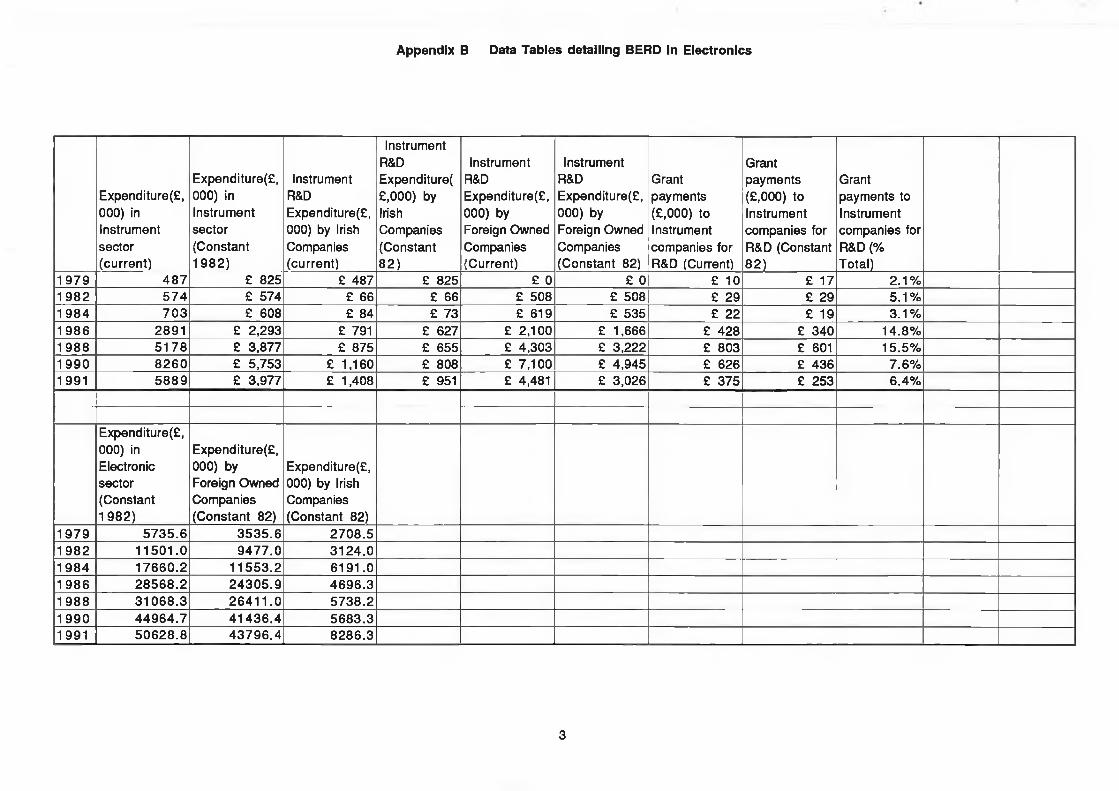
Appendix B Data Tables detailing BERD In Electronics
E x p e n d itu re ^ , 00 0) in
Instrum ent sector
(c u rre n t)
E x p e n d itu re ^ ,00 0 ) inInstrum entsector(C onstant1 9 8 2 )
InstrumentR&DE xp e n d itu re ^ , 000) by Irish
Companies
(cu rren t)
Instrum entR&DExpenditure( £ ,0 0 0 ) by
IrishCom panies(C onstant8 2 )
InstrumentR&DE x p e n d itu re ^ , 00 0 ) by
Foreign O wned
Companies
(C u rren t)
InstrumentR&DE x p e n d itu re ^ , 0 0 0 ) by
Foreign Owned
Com panies
(C o n stan t 82)
Grant paym ents
(£ ,0 0 0 ) to
Instrument com panies for
R&D (Current)
G rant paym ents
(£ ,0 0 0 ) to
Instrum ent com panies for
R&D (Constant 8 2 )
Grantpaym ents to
Instrum ent com panies for
R&D (%T o ta l)
1 9 7 9 4 8 7 £ 8 2 5 £ 4 8 7 £ 8 2 5 £ 0 £ 0 £ 10 £ 17 2 .1 %1 9 8 2 5 7 4 £ 5 7 4 £ 66 £ 66 £ 5 0 8 £ 5 0 8 £ 2 9 £ 2 9 5 .1 %1 9 8 4 7 0 3 £ 60 8 £ 84 £ 73 £ 6 1 9 £ 5 3 5 £ 2 2 £ 19 3 .1 %1 9 8 6 2 8 9 1 £ 2 ,2 9 3 £ 791 £ 62 7 £ 2 ,1 0 0 £ 1 ,6 6 6 £ 4 2 8 £ 3 4 0 1 4 .8 %1 9 8 8 5 1 7 8 £ 3 ,8 7 7 £ 8 7 5 £ 65 5 £ 4 ,3 0 3 £ 3 ,2 2 2 £ 8 0 3 £ 601 1 5 .5 %1 9 9 0 8 2 6 0 £ 5 ,7 5 3 £ 1 ,1 60 £ 8 0 8 £ 7 ,1 0 0 £ 4 ,9 4 5 £ 6 2 6 £ 4 3 6 7 .6 %1 9 9 1 5 8 8 9 £ 3 ,9 7 7 £ 1 ,4 08 £ 951 £ 4 ,481 £ 3 ,0 2 6 £ 3 7 5 £ 2 5 3 6 .4 %
E x p e n d itu re ^ ,000) inElectronicsector(Constant1 9 8 2 )
E x p e n d itu re ^ , 00 0 ) by Foreign Owned
Com panies (C o n stan t 82 )
E xp e n d itu re ^ , 000) by Irish
Companies
(C onstant 82)1 9 7 9 5 7 3 5 .6 3 5 3 5 .6 2 7 0 8 .51 9 8 2 1 1 5 0 1 .0 9 4 7 7 .0 3 1 2 4 .01 9 8 4 1 7 6 6 0 .2 1 1 5 5 3 .2 6 1 9 1 .01 9 8 6 2 8 5 6 8 .2 2 4 3 0 5 .9 4 6 9 6 .31 9 8 8 3 1 0 6 8 .3 2 6 4 1 1 .0 5 7 3 8 .21 9 9 0 4 4 9 6 4 .7 4 1 4 3 6 .4 5 6 8 3 .31 9 9 1 5 0 6 2 8 .8 4 3 7 9 6 .4 8 2 8 6 .3
3
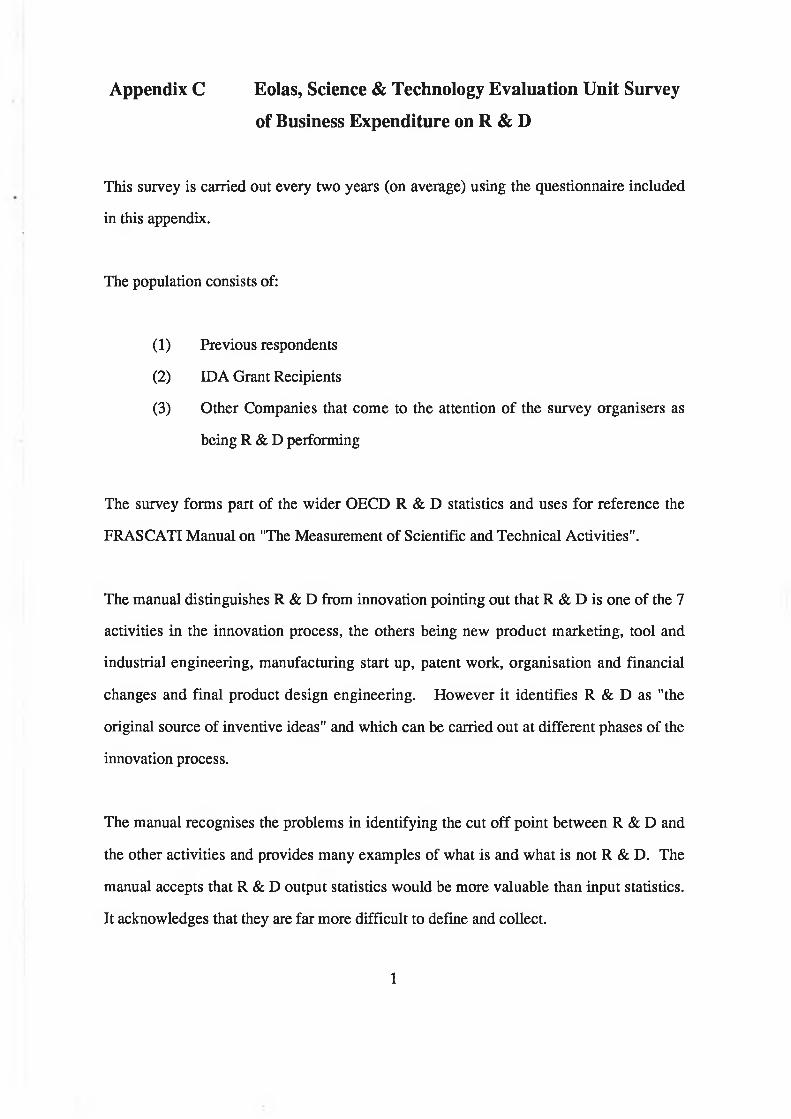
Appendix C Eolas, Science & Technology Evaluation Unit Survey
of Business Expenditure on R & D
This survey is carried out every two years (on average) using the questionnaire included
in this appendix.
The population consists of:
(1) Previous respondents
(2) IDA Grant Recipients
(3) Other Companies that come to the attention of the survey organisers as
being R & D performing
The survey forms part of the wider OECD R & D statistics and uses for reference the
FRASCATI Manual on "The Measurement of Scientific and Technical Activities".
The manual distinguishes R & D from innovation pointing out that R & D is one of the 7
activities in the innovation process, the others being new product marketing, tool and
industrial engineering, manufacturing start up, patent work, organisation and financial
changes and final product design engineering. However it identifies R & D as "the
original source of inventive ideas" and which can be carried out at different phases of the
innovation process.
The manual recognises the problems in identifying the cut off point between R & D and
the other activities and provides many examples of what is and what is not R & D. The
manual accepts that R & D output statistics would be more valuable than input statistics.
It acknowledges that they are far more difficult to define and collect.
1

The manual notes that, "at the time of writing no up-to-date detailed standard
international classifications of fields of science and technology is available and no
recommendation can be made", but nevertheless classifies research areas using ISIC
(International Standard Industrial Classification) codes. The manual recommends that R
& D be classified according to the focus of the research or the occupational area of the
research. Where there is an interdisciplinary effort it should be "prorated amongst the
fields".
In Ireland the classification is made by the survey managers and it is done on the basis of
the main activity of the company concerned.
In the 1992 Manual (DSTI/STIISTP/NESTI (92) 4), there are 269 pages.
The contents of the manual would not be well known to industrialists completing the
Eolas survey questionnaire and because "R & D" is considered "good" there will be a
tendency to overstate the level of R & D activity.
2
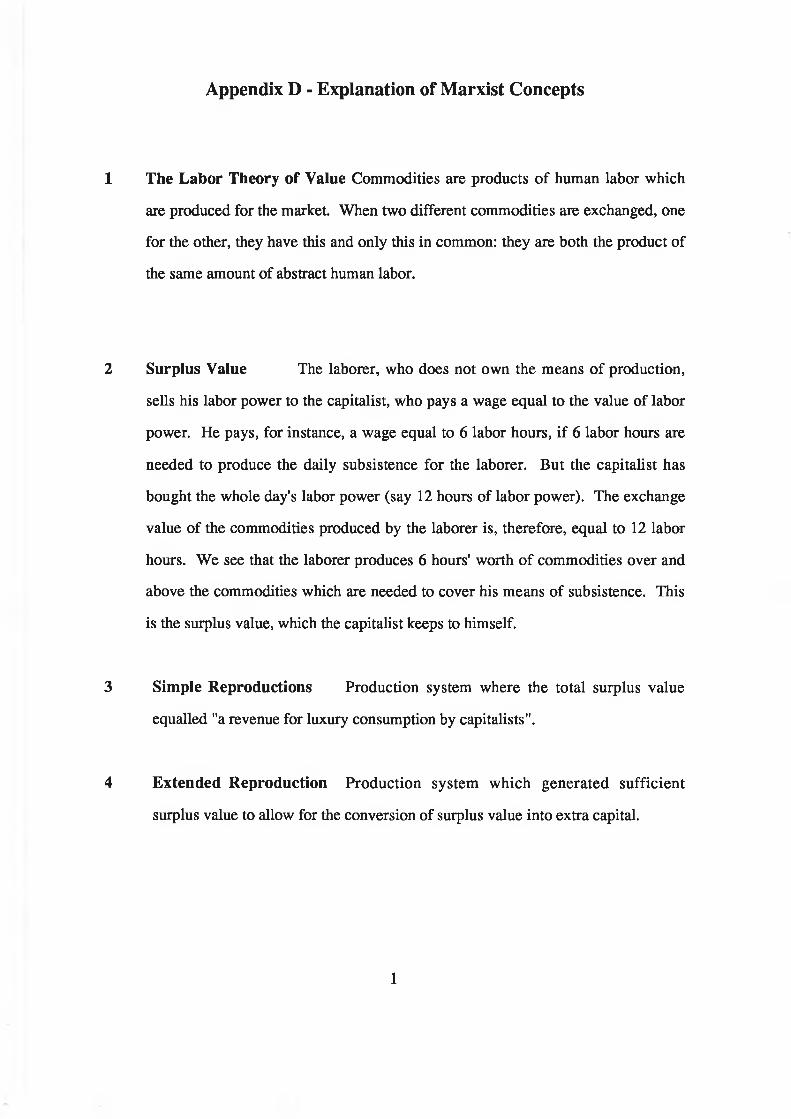
Appendix D - Explanation of Marxist Concepts
1 The Labor Theory of Value Commodities are products of human labor which
are produced for the market. When two different commodities are exchanged, one
for the other, they have this and only this in common: they are both the product of
the same amount of abstract human labor.
2 Surplus Value The laborer, who does not own the means of production,
sells his labor power to the capitalist, who pays a wage equal to the value of labor
power. He pays, for instance, a wage equal to 6 labor hours, if 6 labor hours are
needed to produce the daily subsistence for the laborer. But the capitalist has
bought the whole day's labor power (say 12 hours of labor power). The exchange
value of the commodities produced by the laborer is, therefore, equal to 12 labor
hours. We see that the laborer produces 6 hours' worth of commodities over and
above the commodities which are needed to cover his means of subsistence. This
is the surplus value, which the capitalist keeps to himself.
3 Simple Reproductions Production system where the total surplus value
equalled "a revenue for luxury consumption by capitalists".
4 Extended Reproduction Production system which generated sufficient
surplus value to allow for the conversion of surplus value into extra capital.
1

5 The Rate of Profit The rate of profit is the ratio of surplus value total capital:
s/c +v. It is determined by the rate of exploitation s/v and by the organised
composition of capital c/v.
6 The Falling Rate of Profit Since the organic composition of capital undergoes
a continuous change in favor of constant capital, the rate of profit must have the
tendency to fall, because only the variable part of total capital produces surplus
value.
7 The Effect of Machinery on the Rate of Surplus Valflbe increased use of
machinery increases the rate of exploitation, because it now takes less time to
produce a laborer's means of subsistence; besides these means can now be earned
by several members of the laborer's family, because the machine permits the use
of laborers of slight muscular strength. It also becomes possible to lengthen the
labor day or to increase the intensity of work. When the rate of surplus value
increases, the rate of profit tends to rise.
8 The Reserve Army of Labor The most important effect of machinery is to
make a portion of the labor class superfluous, to create a reserve army of
unemployed men and to exert a continuous downward pressure on wages. The
reserve army is also called the relative surplus population.
9 Periodical Crises The fall of the rate of profit and the growth of the reserve
army are periodically interrupted. A crisis eliminates the smaller capitalists,
concentrates capital in fewer hands, and lowers the value of constant capital.
Furthermore, the reserve army grows during a crisis, and the increased rate of
exploitation raises profits for the surviving capitalists. Then follows a period of
2

increased accumulation and increased demand for labor power. But rising wages
cut again into the surplus value. This explains the phenomenon that crises are
preceded by high rather than low wages.
3
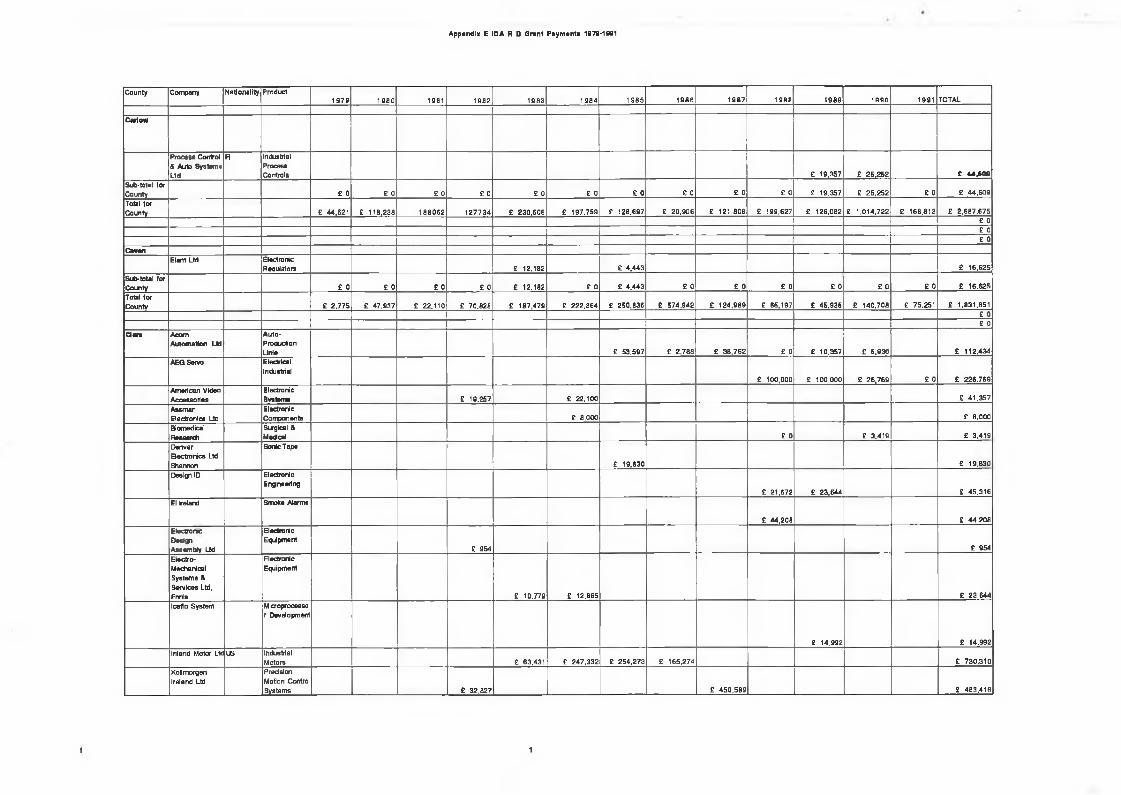
Appendix E IDA R D Grant Payments 1079-1901
County Company Nationality P roduct1 9 7 9 198 0 1981 198 2 198 3 198 4 19B5 198 6 19 8 7 1988 198 9 1 990 1991 TOTAL
Carlow
P ro cess Control & Auto System» Ltd
R IndustrialProcessControls £ 19.357 £ 25 ,252 £ 4 4 .6 0 0
Sub-total for County £ 0 £ 0 £ 0 £ 0 £ 0 £ 0 £ 0 £ 0 £ 0 £ 0 £ 19.357 £ 25 ,252 £ 0 £ 44,609
Total for County £ 44.621 £ 110.238 1 8 8 0 6 2 1 2 7 7 3 4 £ 230.606 £ 197.759 £ 128.697 £ 20 .906 £ 121.808 £ 199.627 £ 126.082 £ 1.014.722 £ 168.813 £ 2,687,675
£ 0£ 0£ 0
CavanElam Ltd Electronic
Reoulatora £ 12.182 £ 4.443 £ 16.625
Sub-total for County £ 0 £ 0 £ 0 £ 0 £ 12.182 £ 0 £ 4.443 £ 0 £ 0 £ 0 £ 0 £ 0 £ 0 £ 16.625
Total for Countv £ 2 .775 £ 47 .937 £ 22.110 £ 70.828 £ 187.479 £ 222.864 £ 250.836 £ 574,942 £ 124 ,989 £ 65.197 £ 45.935 £ 140.708 £ 75.251 £ 1,831,851
£ 0£ 0
Clare AcornA utom ation Ltd
Auto-ProducHonLinie £ 53.597 £ 2.788 £ 38 .762 £ 0 £ 10.357 £ 6.930 £ 112.434
AEG Servo ElectricalIndustrial
£ 100.000 £ 100,000 £ 26,769 £ 0 £ 226.769
American Video Accessories
ElectronicSystem s £ 19.257 £ 22.100 £ 41 ,357
Assman Electronics Ltd
ElectronicCorroonentB £ 8.000 £ 8,000
BiomedicalResearch
Surgical & Medical £ 0 £ 3,419 £ 3,419
DenverElectronics Ltd Shannon
Sonic Tape
£ 19.830 £ 19.830
D eelyi ID Electronic Eng ne eri ng
£ 21,672 £ 23,644 £ 45.316
El Ireland SmoKe Alarms
£ 44 ,208 £ 44 .206Electron«:DesignA ssem bly Ltd
ElectronicEquipment
£ 954 £ 954Electro- Mechanical System s & Services Ltd, Ennis
ElectronicEquipment
£ 10.779 £ 12.865 £ 23 .644
Iceflo System Microprocesso r Development
£ 14.992 £ 14.992
Inland Motor Ltd US industrialMotors £ 63.431 £ 247.332 £ 254.273 £ 165.274 £ 730,310
Kollmorgen Ireland Ltd
Precision Motion Control System s £ 32.827 £ 45 0 .5 8 9 £ 483.416
1 1
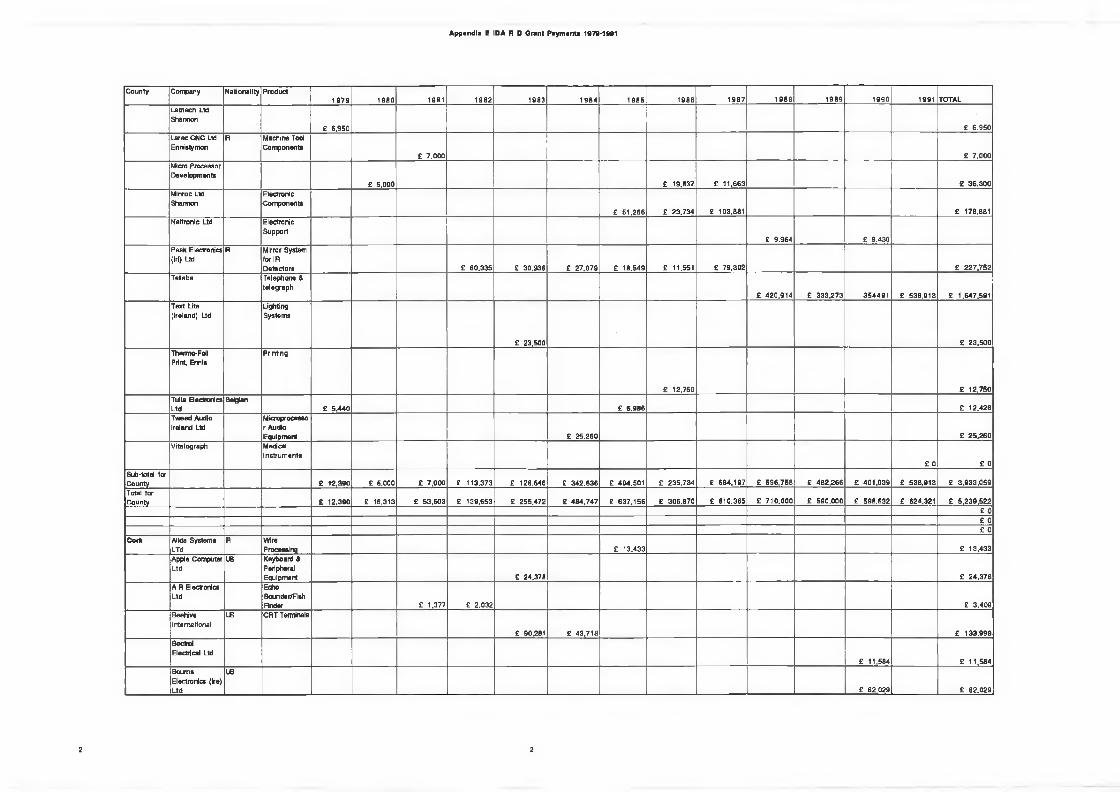
Appendix E IDA R D Grant Payments 1979-1901
County Company Nationality P roduct1 9 7 9 1 9 8 0 1981 1 9 8 2 1983 1 9 8 4 1 9 8 5 1 9 8 6 1 9 8 7 1 9 8 8 19 8 9 1990 1991 TOTAL
Labtecn Ltd Shannon
£ 6.950 £ 6 .950Larec CNC Ltd Ennietymon
R Machine Tool Com ponents
£ 7.000 £ 7 ,000Micro Processor Developm ents
£ 5,000 £ 19.637 £ 11,663 £ 36 .300Minroc Ltd Shannon
ElectronicC om ponents
£ 51 .266 £ 23,734 £ 103.881 £ 178.881Neltronlc Ltd Electronic
Support£ 9.964 £ 9.430
Peak Electronics (Irl) Ltd
R Mirror System for IR D etectors £ 60 ,335 £ 30,936 £ 27 ,079 £ 18.549 £ 11.551 £ 79,302 £ 227 .752
Telabe Telephone & te le g s p h
£ 42 0 .9 1 4 £ 333.273 3 5 4491 £ 538,913 £ 1.647.591Text Lite (Ireland) Ltd
LightingSystem s
£ 23.500 £ 23 .500Thermo-Foil Print. Ennis
Printing
£ 12.750 £ 12,750Tulla Electronics Ltd
Belgian£ 5 .440 £ 6 ,986 £ 12,426
Tweed Audio Ireland Ltd
Microproceseo r Audio E au b m en t £ 25 ,260 £ 25 ,260
Vitalograph MedicalInstrum ents
£ 0 £ 0Sub-total for County £ 12,390 £ 5,000 £ 7 .000 £ 113.373 £ 128.646 £ 342.636 £ 404.501 £ 235,734 £ 684,197 £ 596 ,758 £ 482.266 £ 401,039 £ 538,913 £ 3 ,933 .059Total Tor County £ 12,390 £ 16.313 £ 53 .603 £ 139,653 £ 255.472 £ 484 .747 £ 637.156 £ 306,870 £ 810.365 £ 710 .000 £ 590.000 £ 598.632 £ 624.321 £ 5 .239 .522
£ 0£ 0£ 0
Cor« Ailda SystemsLTd
R WireProcessing £ 13,433 £ 13.433
Apple Computer Ltd
IB Keyboard APeripheralEquipment £ 24.378 £ 24 .378
A R Electronics Ltd
EctmSounder/FishFinder £ 1.377 £ 2,032 £ 3 .409
BeehiveInternational
U5 CRT Terminals
£ 90.281 £ 43 .718 £ 133.999Bectrol Electrical Ltd
£ 11.584 £ 11.584BournsElectronic* (Ire) U d
16
£ 82.029 £ 82 ,029
2 2
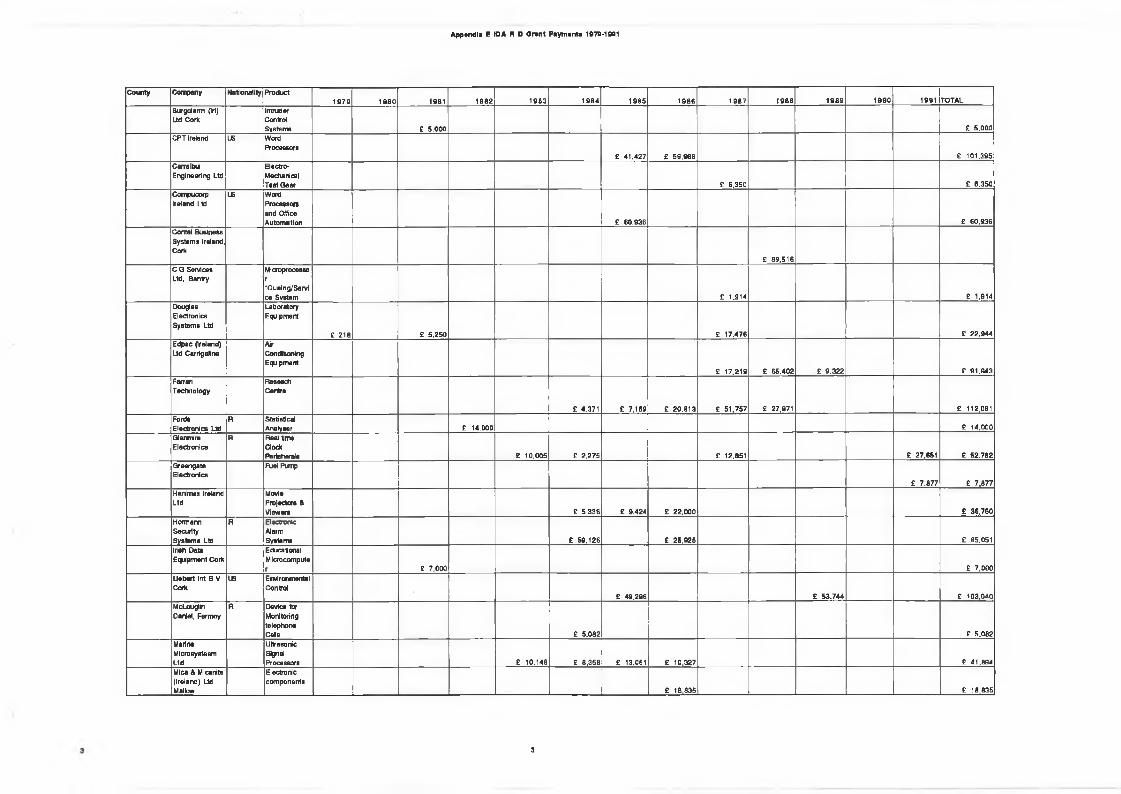
Appendix E IDA R D Grant Payments 1078-1001
County Company Nationality Product19 7 9 1 9 8 0 1981 1982 198 3 19 8 4 1 9 8 5 1 9 8 6 19 8 7 198 8 1 98 9 1 9 9 0 1991 TOTAL
Birgoiarm (lrl) Ltd Cork
intruder Conlrol Sv 6 terns £ 5.000 £ 5.000
CPT Ireland US WordProcessors
£ 41.427 £ 59 .968 £ 101.395C arralbu Engineering Ltd
Electro- Mechanical T est G ear £ 6,350 £ 6.350
Compucorp Ireland Ltd
US WordProcessors and Office A utom ation £ 60.936 £ 60.936
Contel B usiness System s Ireland, Cork
£ 89,516C G Services Ltd, Barrtry
Microprocessor"Queing/Servl ce System £ 1.914 £ 1.914
Douglas Electronics S y stem s Ltd
LaboratoryEquipment
£ 218 £ 5.250 £ 17.476 £ 22.944E dpac (Ireland) Ltd Carrlgaline
AirConditioningEquipment
£ 17.219 £ 65 .402 £ 9.322 £ 91.943FarranTechnology
ReseecfiCentre
£ 4.371 £ 7.169 £ 20 ,813 £ 51 .757 £ 27.971 £ 112,081Ford*Electronics Ltd
R StatisticalAnalyser £ 14.000 £ 14.000
G lanm reElectronics
R Real timeClockPerchera!» £ 10.005 £ 2.275 £ 12.851 £ 27,651 £ 52 .782
Or ©engateElectronics
Fuel Piít jj
£ 7.877 £ 7.877Hanlmex Ireland Ltd
*
.Isiti
£ 5,336 £ 9.424 £ 22,000 £ 36.760Hofmann Security System » Ltd
R ElectrortcAlarmSystem s £ 59.126 £ 25 ,925 £ 85,051
Irish Data Equipm ent Cork
EducationalMicrocomputer £ 7 .000 £ 7 .000
U ebert Irrt B V Cork
US EnvironmentalConlrol
£ 49.296 £ 53 .744 £ 103.040McLouglln Daniel, Fermoy
R Device for Monitoring telephone C d s £ 5.082 £ 5.082
MarineMicro systesm Ltd
UltrasonicSJyialProcessors £ 10.148 £ 8 .358 £ 13.061 £ 10.327 £ 41.894
Mica & Mlcanite (Ireland) Ltd Mallow
Electroniccom ponents
£ 18.835 £ 18.835
a
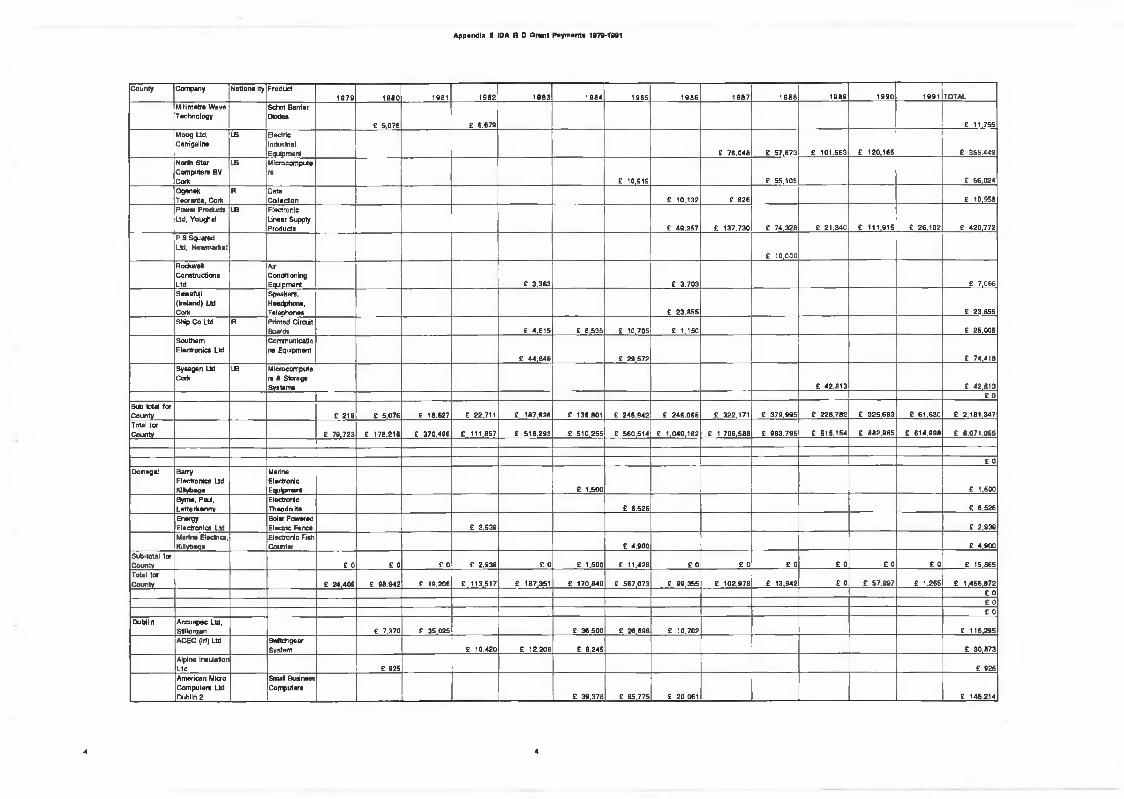
Appendix E IDA R D Grant Payment« 1979-T991
County Company Nationality P roduct1 9 7 9 1 9 8 0 1981 1982 198 3 198 4 1985 198 6 1 9 8 7 1 9 8 8 1989 199 0 1991 TOTAL
Millimetre W ave Technology
Schot Barrier Diodes
£ 5,076 £ 6,679 £ 11.755Moog Lid, Carrigaline
US ElectricIndustrialEquipment £ 76 .048 £ 57 ,673 £ 101.563 £ 120.165 £ 355.449
North S tar Com puters BV Cork
US M icrocomputers
£ 10,919 £ 55,105 £ 66,024Ogenek Teoranta, Cork
R DataCollection £ 10,132 £ 826 £ 10,958
Power Product» Ltd. Youghal
US Electronic Linear Supply Products £ 49 ,357 £ 137.730 £ 74,328 £ 21 .340 £ 111,915 £ 26 .102 £ 420.772
P S Squared Ltd, Newmarket
£ 10,000RockwellC onstructionsLtd
AirConditioningEquipment £ 3,363 £ 3.703 £ 7,066
Sawafuji (Ireland) Ltd Cork
Speakers,Headphone,Telephones £ 23 ,855 £ 23.855
Ship Co Ltd R Printed Circtft Boards £ 4 .615 £ 8.535 £ 10.705 £ 1.150 £ 25,005
Southern Electronic» Ltd
Communicatio n s Equipment
£ 44 .846 £ 29,572 £ 74.418Sysegen Ltd Cork
US Microcompute rs A Storage System s £ 42 .813 £ 42,813
£ 0Sub-total to r County E 216 £ 5,076 £ 18.627 £ 22,711 £ 187,636 £ 136.801 £ 245,942 £ 246.065 £ 322.171 £ 379.995 £ 228.782 £ 325.693 £ 61,630 £ 2.181 ,347Total 1or County £ 79 ,723 £ 178.215 £ 370,496 £ 111.857 £ 516.293 £ 510,255 £ 560,514 £ 1,040 .182 £ 1 .706 ,588 £ 9 83 .795 £ 515.154 £ 882.985 £ 614.998 £ 8 ,071 ,055
£ 0D onegal Barry
Electronics Ltd, Klllybeqe
MarineElectronicEquipment £ 1.500 £ 1.500
Byrne, P a d , L etterkenny
ElectronicTheodolite £ 6.526 £ 6.526
EnergyElectronic» Ltd
Solar Powered Elocmc Fence £ 2,939 £ 2,939
Marine Electrics, KJHyb«jB
Electronic FishC om ter £ 4,900 £ 4.900
Sub total for County £ 0 £ 0 £ 0 £ 2.939 £ 0 £ 1.500 £ 11.426 £ 0 £ 0 £ 0 £ 0 £ 0 £ 0 £ 15.865Total for County £ 24,406 £ 98,942 £ 19.206 £ 113.517 £ 187,351 £ 170.840 £ 567,073 £ 99,355 £ 102,978 £ 13,942 £ 0 £ 57 .997 £ 1.265 £ 1,456 ,872
£ 0£ 0£ 0
Dublin A ccuspec Ltd, SDIIorqan £ 7.370 £ 35.025 £ 36.500 £ 26,698 £ 10,702 £ 116.295ACEC (Irl) Ltd Switch gear
System £ 10,420 £ 12,208 £ 8,245 £ 30.873Alpine Insulation Ltd £ 925 £ 925American Micro C om puters Ltd Dublin 2
Sm al Business Com puters
£ 39.378 £ 85.775 £ 20,061 £ 145 214
4 4
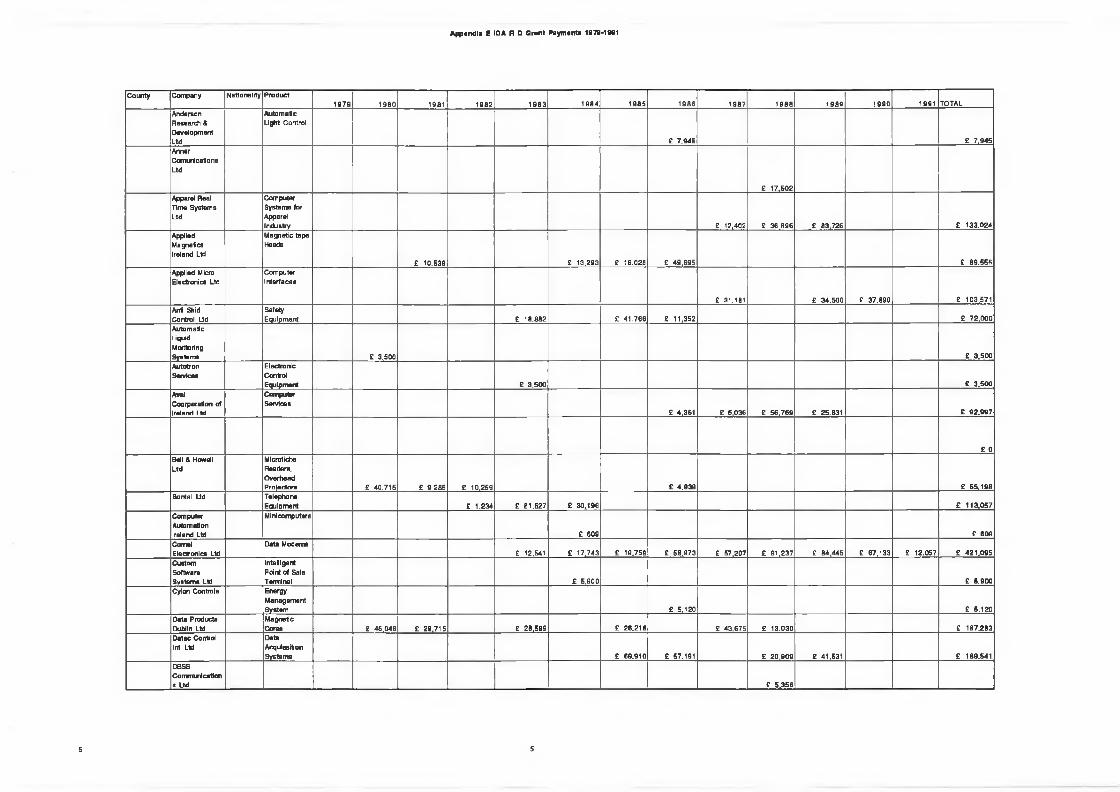
Appendix E IDA R D Grant Paymanta 1979-1001
County Company Nationality P roduct1 8 7 9 1 9 8 0 1981 188 2 1 9 8 3 1 9 8 4 1 9 8 5 198 6 190 7 1 8 0 0 1 9 8 9 1990 1981 TOTAL
Anderson Research & Development Ltd
Automatic Light Control
£ 7,945 £ 7 ,945ArmerComurtcatloneLtd
£ 17.502Apparel Real Time System s Ltd
Computer System s for Apparel Industry £ 12.402 £ 36 .096 £ 83,726 £ 133.024
Applied Magnetics Ireland Ltd
M agnetic tape Heads
£ 10,539 £ 13.293 £ 16.028 £ 49 .695 £ 89 ,555Applied Micro Electronics Ltd
ComputerInterfaces
£ 31.181 £ 34.500 £ 37,890 £ 103.571Anti Skid Control Ltd
SafetyEquipment £ 18.882 £ 41 .766 £ 11,352 £ 72 .0 0 0
Autom aticL iq u d
MoritoringSystem* £ 3,500 £ 3.500AutotronSendees
ElectronicControlEquipment £ 3 .500 £ 3,500
AvalCoo rp or all on of Ireland Ltd
ComputerServices
£ 4.361 £ 6.036 £ 56 .769 £ 25.831 £ 92 .997
£ 0Bell & Howell Ltd
MicroficheReaders,O verheadProjectors £ 40,715 £ 9.285 £ 10,259 £ 4,939 £ 65 ,198
Borrtal Ltd Telephone Eau Id merit £ 1.234 £ 81.627 £ 30,196 £ 113,057
Computer Automation Ireland Ltd
Mini compirtere
£ 609 £ 609CornelElectronics Ltd
Data Modems£ 12.541 £ 17,743 £ 19.759 £ 58 .973 £ 57.207 £ 91 ,237 £ 84 .445 £ 67,133 £ 12.057 £ 421 .095
Custom Software System s Ltd
Intelligent Point of Sale Terminal £ 5 .900 £ 5,900
Cylon Controls EnergyM anagem entSystem £ 5.120 £ 5,120
Data Products Dublin Ltd
M agneticCore* £ 46.046 £ 29.715 £ 28.599 £ 26.218 £ 43 .675 £ 13.030 £ 187.283
D atac Control Int Ltd
DataAcqiissitionS ystem s £ 69.910 £ 57.191 £ 20 .909 £ 41.531 £ 189.541
DBSSCorrm unlcatton s Ltd £ 5.356
5 5
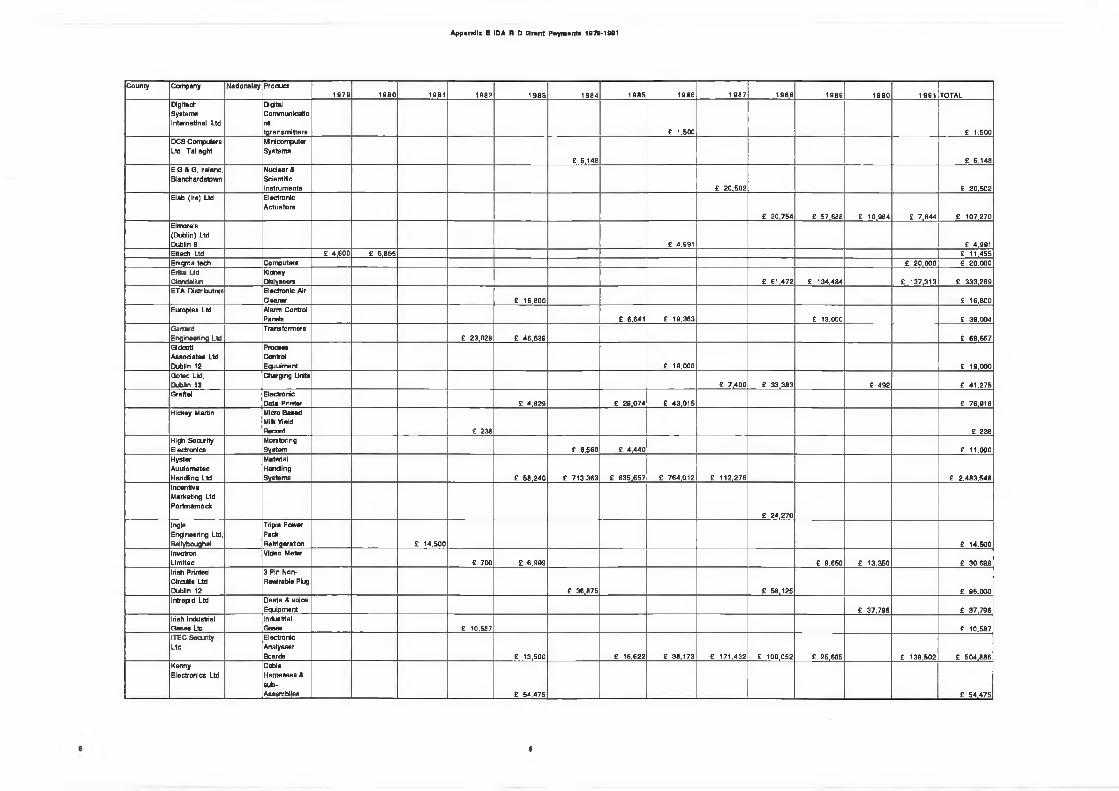
Appendix E IDA R D Grant Payment* 1B7B-1991
County Company Nationality P roduct1 97 9 1 9 8 0 1981 1982 1 9 8 3 1 984 1 9 8 5 1986 1 9 8 7 1 988 1989 199 0 1991 TOTAL
Digits ch System s Intem atlnal Ltd
DigitalCommunicationstgr an em itter s £ 1.500 £ 1.500
DCS Computers Ltd, Tallaght
MinicomputerSystem s
£ 6,148 £ 6.148E G & Q, Ireland. Blanch ardstow n
Nuclear & Scientific in strum en ts £ 20,502 £ 20.502
Elab (Ire) Ltd ElectronicA ctuators
£ 30.754 £ 57.688 £ 10,984 £ 7,844 £ 107.270Elmore's (Dublin) Ltd Dublin 8 £ 4.991 £ 4.991Eltech Ltd E 4,600 E 6,855 £ 11.455Enityna tech Com puters £ 20,000 £ 20.000Erika Ltd ClondoJkrt
KidneyDialyseers £ 61.472 £ 134,484 £ 137.313 £ 333,269
ETA Distributors Electronic Air Cleaner £ 164800 £ 16.800
Europlex Ltd Alarm Control Panels £ 6.641 £ 19.363 £ 13.000 £ 39,004
GarrardEngineering Ltd
Transform ers£ 23.02B £ 46,639 £ 69.667
GldcottA ssodatea Ltd Dublin 12
ProcessControlE qjuim ent £ 19.000 £ 19,000
G otee Lid, Dublin 13
C hargng Unit*£ 7 f400 £ 33,383 £ 492 £ 41 .275
Graft el Electronic Data Printer £ 4 .829 £ 29,074 £ 4 3 ,0 1 5 £ 76.918
Hickey Martin Micro Based Milk Yield Record £ 238 £ 238
H i0i Security Electronics
MonitoringSystem £ 6.560 £ 4 ,440 £ 11.000
Hyster Au uto m ated H and ina Ltd
MaterialH andingSystem s £ 58 ,240 £ 713.363 £ 835,657 £ 764.012 £ 112.276 £ 2.483 ,548
Incentive Marketing Ltd Portm am ock
£ 24,270IngleEngineering Ltd. Ballybouqhal
Triple Power PackRefrigeration £ 14,500 £ 14.500
InvotronLimited
Video Meter£ 700 £ 6,999 £ 9.650 £ 13.350 £ 30,699
Irish Printed C ira its Ltd Dublin 12
3 Pin Non- flewirabie Plug
£ 36,875 £ 58,125 £ 95,000Intrepid Ltd Daata & voice
Equipm ent £ 37.796 £ 37,796Irish Industrial G ases Ltd
IndustrialGesee £ 10.587 £ 10,587
ITEC Security Ltd
ElectronicAnalys&erBoards £ 13,500 £ 16.622 £ 38 ,173 £ 171.432 £ 100.052 £ 25.605 £ 139.502 £ 504.886
KennyElectronics Ltd
CableH arnesses & su b -Assemblies £ 54.475 £ 54.475
6
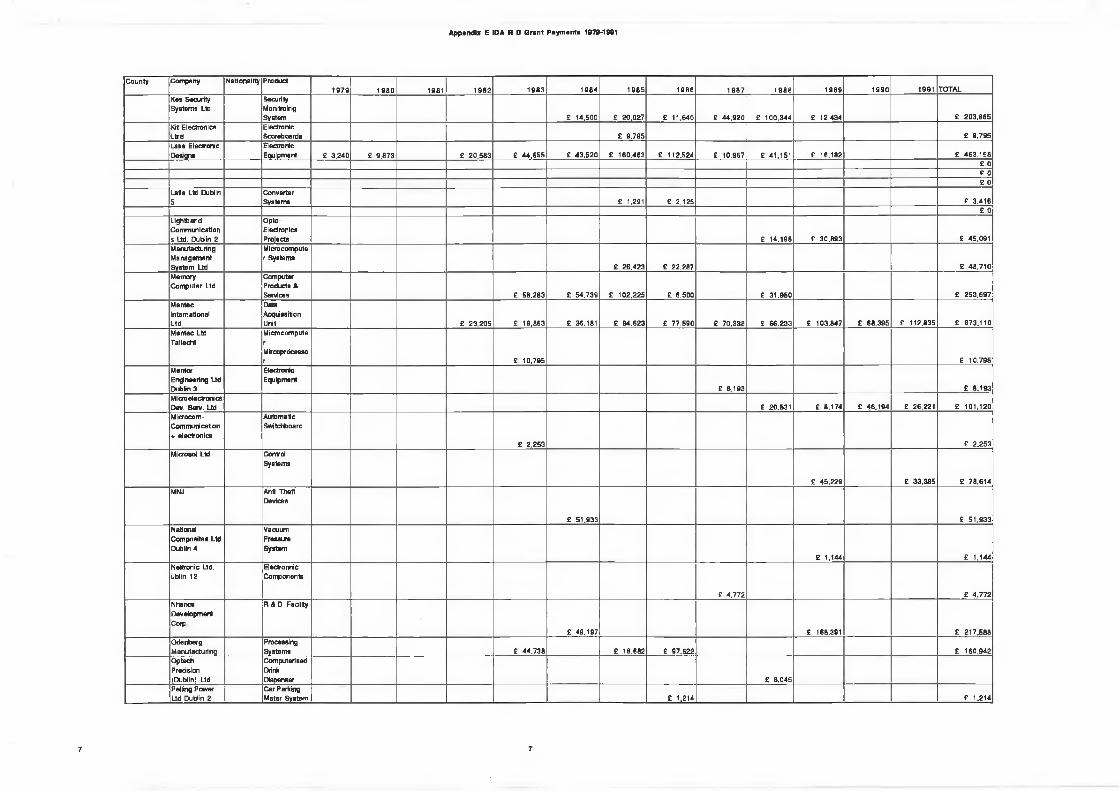
Appendix E IDA R D Grant Payments 1079-1901
County Company Nationality P roductt9 7 0 1 9 8 0 1981 1 982 1 9 8 3 1984 1 9 8 5 1986 19 8 7 1 988 198 9 1 9 9 0 1991 TOTAL
Kea Security System s Ltd
SecurityMonitroingSystem £ 14.500 £ 20.027 £ 11,640 £ 44 .920 £ 100.344 £ 12,434 £ 203.865
Kit Electronics Ltrd
ElectronicScoreboards £ 9.795 £ 9.795
Lake Electronic Deagna
ElertrorlcEquipment £ 3,240 £ 9,873 £ 20.583 £ 44 ,655 ' £ 43 ,520 £ 160,463 £ 112,524 £ 10.967 £ 41.151 £ 16.182 £ 463 .158
£ 0£ 0£ 0
Lada Ltd Dublin 5
ConverterSystem s £ 1,291 £ 2.125 £ 3.416
£ 0LightbandCommunication s Ud. Dublin 2
Opto-ElectronicsPro|ect6 £ 14,198 £ 30 .893 £ 45.091
Manufacturing M anagem ent System Ltd
Microcompute f System s
£ 26.423 £ 22.287 £ 48 .710Memory C om puter Lid
C omputer Products A Sendees £ 58.283 £ 54.739 £ 102,225 £ 6.500 £ 31 .950 £ 253.697
MerrtecInternationalLtd
DataAcquissiHonUnit £ 23,205 £ 19,863 £ 36.181 £ 94.623 £ 77.590 £ 70,338 £ 66.233 £ 103.847 £ 68.395 £ 112.835 £ 673.110
M entec Ltd Tallacht
MicrocomputerMlrcoprocessor £ 10.795 £ 10.795
MentorE n^neering Ltd DLfcHn 3
ElectronicEquipment
£ 8.193 £ 8.193Microelectronics Dev. Serv. Lid £ 20.531 £ 8,174 £ 46 .194 £ 26.221 £ 101.120Mlcrocom- Com muni cation * electronics
AutomaticSwitchboard
£ 2.253 £ 2 .253Microsol Ltd Control
System s
£ 45 .229 £ 33.385 £ 78.614MMJ Anti Theft
Devices
£ 51.933 £ 51 ,933National C om posites Ltd Dublin 4
VacuumPressureS ystem
£ 1,144 £ 1.144Neltronic Ltd, ublin 12
E lec tro n icConjJonentB
£ 4.772 £ 4 .772Nhanc*DevelopmentCofp
R A D Facility
£ 49.197 £ 168.391 £ 217 ,588OdenbergM anufacturing
ProcessingSystem s £ 44 ,738 £ 18.682 £ 97.522 £ 160.942
Optecti Precision ÍDublini Ltd
ComputerisedDrinkDispenser £ 8.045
Pelling Power U d Dublin 2
Car Parking Meter System £ 1.214 £ 1.214
7 7
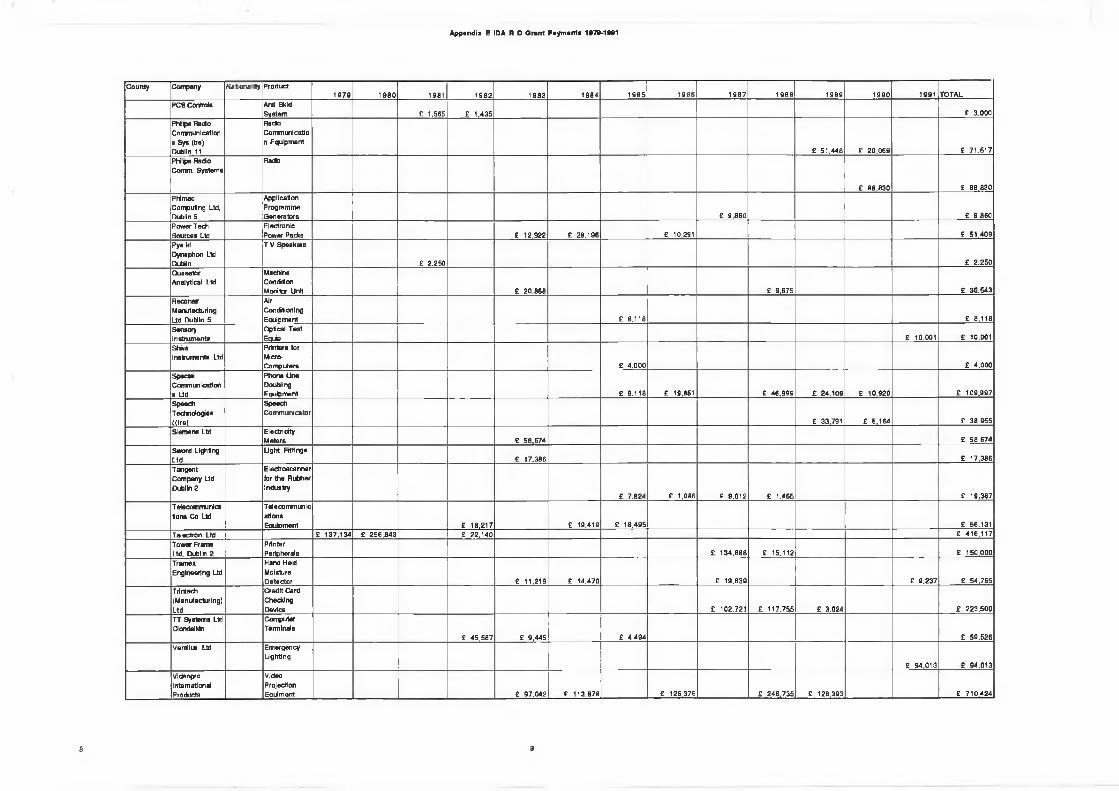
Appendix E IDA H D Orant Payment« 1079-1901
County C onpany Nationality Product1070 1 0 8 0 1981 198 2 1083 1 984 1 9 8 5 198 6 1 9 8 7 19 8 8 1989 199 0 1991 TOTAL
PCB Controls Anti Skid System E 1.565 £ 1.435 £ 3.000
Philps Radio CorTmunlcatofi s Sys (Ire) Dublin 11
RadioCommunicatio n Equipment
£ 51.448 E 20 ,069 £ 71 .517Philps Radio Comm. System«
Radio
£ 88 .830 £ 88 ,830
PhlmacCorrputlng Ltd, DublinB
Application Programme Gen era tors £ 9,860 £ 9.860
Power Tech Sources Ltd
Electronic Power Packs £ 12,922 £ 28 .196 £ 10.291 £ 51 .409
PyelrlDynaphon Ltd Dublin
T V Speakers
£ 2.250 £ 2,250Q uaestor Analytical Ltd
Machine Condition Monitor Unit £ 20.868 £ 9.675 £ 30 .543
Reconar Manufacturing Ltd Dublin 5
AirCondrtioningEouioment £ 8,118 £ 8,118
SensoryInstrum ent»
Optical Test Eqiio £ 10.001 £ 10.001
ShivaInsfrum ents Lid
Printers forMicro-Computflrs £ 4.000 £ 4,000
SpecteiCo n m uni cation « Ltd
Phone LineDoublingEquipment £ 8,118 £ 19,851 £ 46,999 £ 24.109 £ 10,920 £ 109.997
S peed iTechnologies( ( M
SpeechComm unicator
£ 33,791 £ 5.164 £ 38 .955
Siem ens Ltd ElectricityM eters £ 58.674 £ 58 .674
Sword L if t in gLtd
U ght Fitting«£ 17.386 £ 17,386
Tangent Company Lid Dublin 2
E lectroscanner for th e Rubber Industry
£ 7,824 £ 1.086 £ 9,012 E 1,465 £ 19.387Telecom mu nlca tions Co Lid
T elecom m inicatlonsEouJoment £ 18,217 £ 19.419 £ 18,495 £ 56.131
Telectron Lid £ 137.134 £ 256.843 £ 22,140 £ 416.117Tower Frame Ltd. Dublin 2
PrinterPeripherals £ 134 .888 £ 15.112 £ 150,000
TramexEngineering Ltd
Hand HeldMoistureD etector £ 11,219 £ 14.470 £ 19.839 £ 9,237 £ 54,765
Trirrtedi(Manufacturing)Ltd
Credit CardCheckingDevice £ 102.721 £ 117.755 £ 3.024 £ 223.500
TT System s Ltd Clondalhfri
ComputerTerminals
£ 45 ,587 £ 9,445 £ 4.494 £ 59.526Ventilux Ltd Emergency
Lighting£ 94,013 £ 94.013
VldeoproInternationalProducts
VideoProjectionEauim ent £ 97.042 £ 113.878 £ 126.376 £ 246,735 £ 126.393 £ 7 1 0 4 2 4
8 8
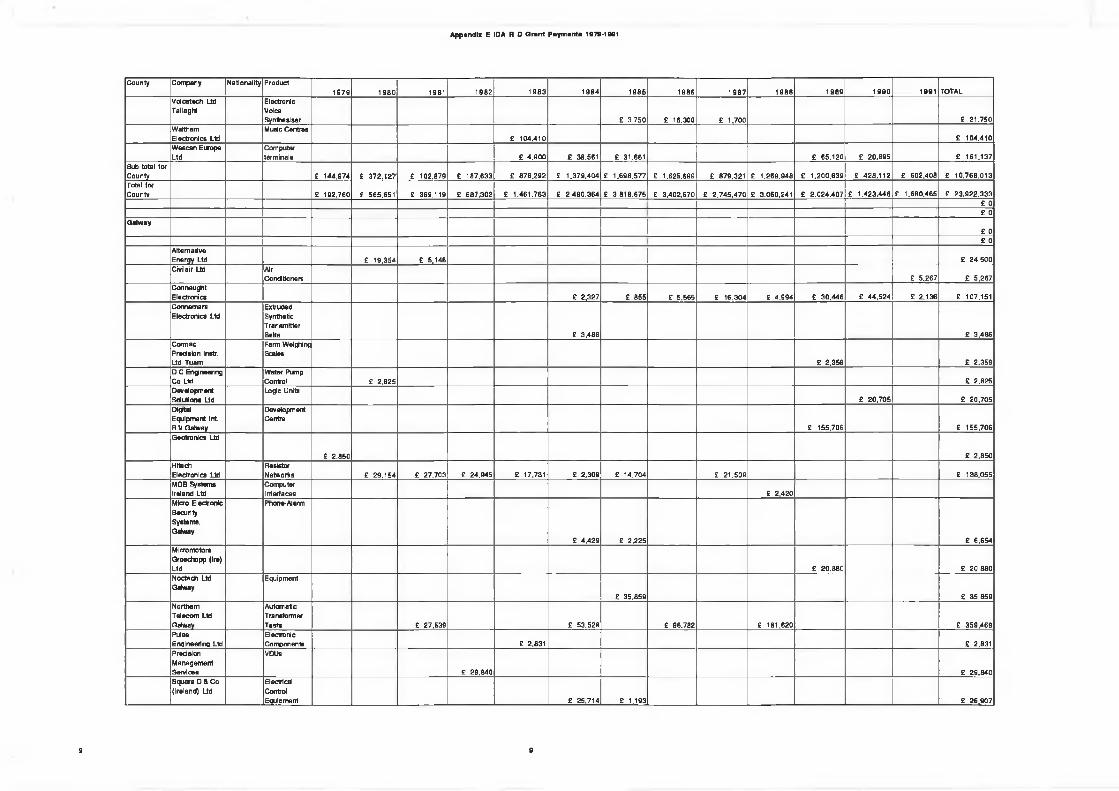
Appendi* E IDA R D Grant Payment a 1979*1001
County Company Nationality Product197 9 1 9 8 0 1981 1982 1 9 8 3 1 98 4 1 9 8 5 1986 1 9 8 7 1 9 8 8 198 9 1 9 9 0 1991 TOTAL
V olcetech Ltd Tallaght
ElectronicVoiceSynthesiser £ 3,750 £ 16.300 £ 1,700 £ 21 ,750
Waltham Electronics Ltd
Music Centres£ 104.410 £ 104.410
W escan Europe Ltd
Computerterm inals £ 4 .900 £ 38.561 £ 31,661 £ 65 .120 £ 20*895 £ 161.137
Sub-total for County £ 144,974 Ê 372 ,127 £ 102,879 £ 187,633 £ 876.292 £ t . 379 .404 £ 1,698 ,577 £ 1,625.699 £ 879.321 £ 1,269,948 £ 1.200 .639 £ 428 .112 £ 602,408 £ 10 .768 ,013Total for Countv E 192,760 E 565,651 £ 369,119 E 687.302 £ 1.461 .763 £ 2 .490 .364 £ 3 .818 .675 £ 3,402.670 £ 2 .7 4 5 .4 7 0 £ 3.060,241 £ 2 .024 .407 £ 1.423 ,446 £ 1,680,465 £ 23 .922 .333
£ 0E 0
Galw ay£ 0£ 0
Alternative Ene ray Ltd £ 19,354 £ 5,146 £ 24 ,500Civilair Ltd Air
Conditioners £ 5,267 £ 5.267ConnaughtElectronic* £ 2,327 £ 855 £ 5.565 £ 16.304 £ 4,994 £ 30 ,446 £ 44,524 £ 2.136 £ 107.151Connem ara Electronics Ltd
ExtrudedSyrrtheticTransmitterBelts £ 3.486 £ 3.486
C orm ac Predsion Instr. Lid Tuam
Farm Weighing Scales
£ 2,359 £ 2.359D C Entfneering Co Ltd
W ater Pump Confrol £ 2.825 £ 2.825
Development Solutions Ltd
Logic Unils£ 20 .705 £ 20 .705
DigtalEquipm ent Irrt B V Galway
DevelopmentCentre
£ 155,706 £ 155.706G eoironica Ltd
Ê 2.850 £ 2.850HitechElectronics Ltd
ResistorNetworks £ 29.154 £ 27.703 £ 24.945 £ 17.731 £ 2.309 £ 14,704 £ 21 .509 £ 138.055
MDB Systems Ireland Ltd
ComputerInterfaces £ 2,420
M iao ElectronicSecuritySystems,Galway
Phone-Alarm
£ 4,429 £ 2.225 £ 6.654Micromotors G roschopp (Ire) Ltd £ 20 .880 £ 20,880Noctecti Ltd Galway
Equipment
£ 35,859 £ 35.859Northern Telecom Ltd Galway
AutomaticTransformerTest* £ 27,539 £ 53 .528 £ 96.782 £ 181,620 £ 359.469
PulseErwine eri na Ltd
ElectronicComponent* £ 2.831 £ 2.831
PrecisionM anagem entServices
VDUs
£ 29 ,840 £ 29 .840Square D 4 Co (Ireland) Ltd
ElectricalControlE a u lD m en t £ 25,714 £ 1,193 E 26 .907
9 0
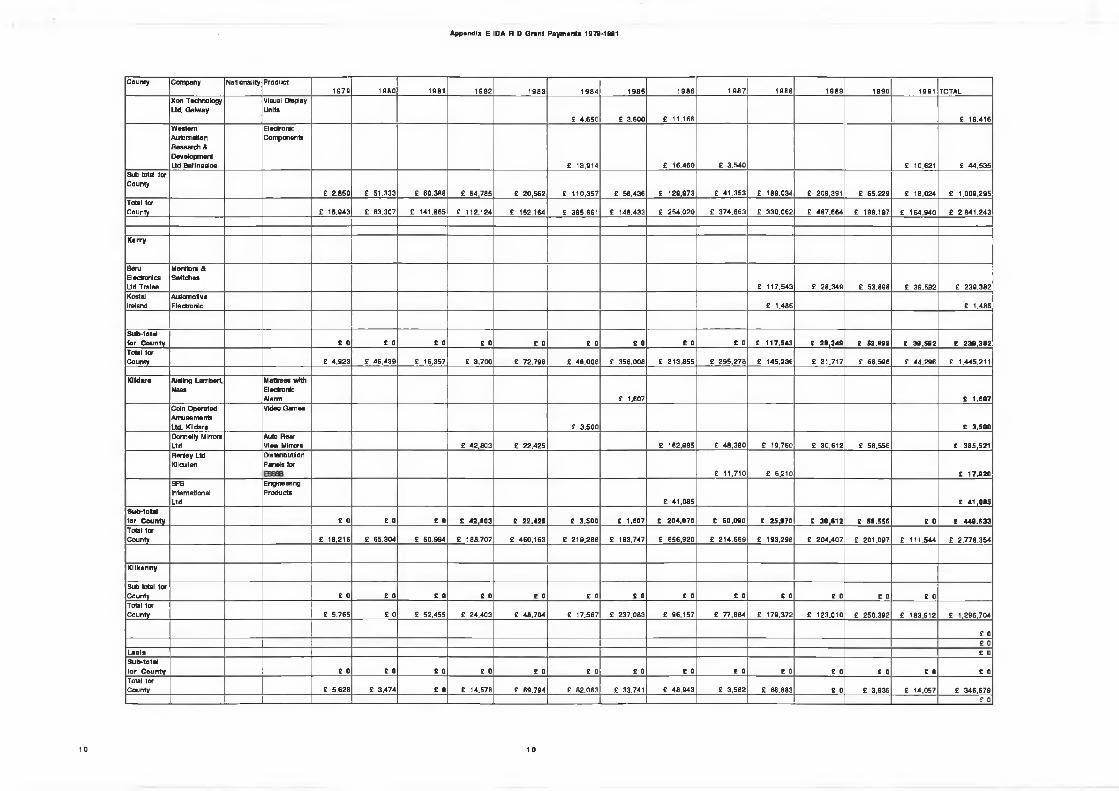
Appendix E IDA H D Grant Payment« 1979-1991
County Company Nationality Product197 0 1 980 1981 198 2 1983 1 9 8 4 1 9 8 5 1986 1 9 8 7 1988 1 9 8 9 1 9 9 0 1991 TOTAL
Xon Technology Ltd. Galway
Visual Display Units
£ 4.650 £ 3.600 £ 11.166 £ 19,416W estern Automation R esearch & D evelopm ent Lid Ballinasioe
ElectronicCom ponents
£ 13,914 £ 16.460 £ 3 .540 £ 10,621 £ 44 .535Sub-total for County
£ 2,850 £ 51.333 £ 60.388 £ 54,785 £ 20,562 £ 110,357 £ 58.436 £ 129.973 £ 41 .353 £ 189.034 £ 209.391 £ 65.229 E 18,024 £ 1,009,295Total forCounty £ 16,943 £ 63,307 £ 141.865 £ 112.124 £ 152.164 £ 395.861 £ 148.433 £ 254.020 £ 374 .663 £ 330.062 £ 487,664 £ 199.197 £ 164,940 £ 2 .841 .243
K erry
SeruElectronics Lid Tralee
Monitor» & Switches
£ 117,543 E 28,349 £ 53.898 £ 39 .592 £ 239.382KostalIreland
AutomotiveElectronic £ 1.486 £ 1,486
S u b -to tr i for C oun ty £ 0 £ 0 £ 0 £ 0 £ 0 £ 0 £ 0 £ 0 £ 0 £ 1 17,543 £ 28 ,349 £ 53.898 £ 3 9 ,5 9 2 £ 2 3 9 ,3 8 2Total for County £ 4 .923 £ 46 ,439 £ 16.357 £ 3 .700 £ 72.798 £ 48 ,008 £ 356.008 £ 313.855 £ 295 .27S £ 145.236 £ 31.717 £ 66.596 £ 44,296 £ 1.445.211
Kildare Aiallng Lambert, Naas
M attress withElectronicAlarm £ 1,607 £ 1.607
Coin O perated A m usem ents Ltd, Kildare
Video G am es
£ 3 .500 E 3,500Domeliy Mirror» Ltd
Auto Rear View Mirrors £ 42.803 £ 22.425 £ 162.985 £ 48 ,380 £ 19.760 £ 30.612 £ 58.556 £ 385.521
Renley Ltd Kilciilen
DlstsrlbuUion Panels for
£ 11,710 £ 6.210 £ 17 .920SPSInternationalLtd
EngineeringProducts
£ 41 ,085 E 41 ,0 8 5Sub-total for County £ 0 e o £ 0 £ 4 2 ,803 £ 22.425 £ 3 ,500 £ 1.607 £ 2 04,070 C 60 ,090 E 25 ,970 £ 3 0 ,612 £ 58.556 £ 0 E 44 9 .6 3 3Total for County £ 18,216 £ 65,304 £ 50.994 £ 188.707 £ 460.163 £ 219 .288 £ 193,747 £ 656,920 £ 214 ,669 £ 193.298 £ 204,407 £ 201,097 £ 111.544 £ 2 .778 .354
K ilkenny
Sub-total 1 orCounty C 0 £ 0 £ 0 £ 0 £ Q £ 0 £ 0 £ 0 £ 0 C 0 £ 0 C 0 £ 0Total for County £ 5,765 £ 0 £ 52.455 £ 24,403 £ 48.704 £ 17,567 £ 237.083 £ 96,157 £ 77.884 £ 179.372 £ 123,010 £ 250,392 £ 183,912 £ 1,296,704
£ 0£ 0
L aols £ 0S ub-to ta l fo r C o u n ty £ 0 £ 0 £ 0 £ 0 £ 0 £ 0 £ 0 £ 0 £ 0 £ 0 £ 0 E 0 £ 0 E 0Total for Countv £ 5.628 £ 3.474 £ 0 £ 14.578 £ 69.794 £ 82.063 £ 33.741 £ 48.943 £ 3 .582 E 66.883 £ 0 £ 3,936 £ 14,057 £ 346,679
£ 0
10 10

Appendix E IDA R D Grant Payment« 1979-1961
County Company Nationality P roduct19 7 0 198 0 1981 19 8 2 1983 1 9 8 4 1 9 8 5 198 6 1 9 8 7 198 8 1989 1990 1991 TOTAL
£ 0L e itr im £ 0
Frese (Ire) Lid C ar Mirrors £ 162.892 £ 16 2 .0 0 2National Electrical D edans Ltd,
Mlnature Circuit Breaker
£ 64.909 £ 64 ,9 0 9Sub-total to r C o u n ty £ 0 E 0 £ 0 £ 0 C 0 £ 0 £ 0 £ 0 £ 0 £ 0 £ 64 ,909 £ 162,892 £ 0 £ 227,801Total lor Countv £ 60 .173 £ 900 C 0 £ 5.672 £ 0 £ 0 £ 0 £ 10.525 £ 0 £ 0 £ 142.758 £ 85.043 £ 93.898 £ 3 98 .969
£ 0£ 0
Lim erick £ 0Analog Devices BV
ElectronicC om ponents £ 84.120 £ 124,988 £ 97.320 £ 58.073 £ 20.423 £ 88.547 £ 199.866 £ 80.430 £ 113.637 £ 123.010 £ 9 9 0 .4 1 4
ArtieEnvironmentalLtd £ 10.986 £ 28.415 £ 39 .401AsHingM lcrosyssstem s Ltd Limerick
Electrical AElectronicEquipment £ 68.963 £ 84.893 £ 134,369 £ 86,176 £ 19,077 £ 0 £ 3 9 3 ,4 7 8
Bally nee ty Manufacturing Service Lid £ 49.990 £ 55 .253 £ 1 0 5 ,2 4 3Colenta Ltd Limerick
RimDev elem entMachine* £ 13.263 £ 7 .110 £ 2 0 ,3 7 3
C onservation of Energy(Limerick) Lid
Autom aticDispensingUnit £ 3.850 £ 3 ,8 5 0
Electronic D ealer A
Power Factor Controller £ 5,021 E 5,021
E ectro tek ,Limerick
ElectronicC om ponents £ 2 .293 £ 2 ,2 9 3
Etverex Ltd, Limerick
Com puterServices £ 9 ,732 £ 9 ,7 3 2
FlemningOacn MedicalInstrum ents £ 157.. 165 £ 188,747 £ 25 .385 £ 82 ,304 £ 453.601
GTI Ireland Ltd Abbevfeale
Diode Leads£ 15.000 £ 1 5 ,0 0 0
lA C U dLimerick
A lternatorVoltageR eq u e sto rs £ 6.700 £ 6 ,7 0 0
industrial A Scientific Imaging Ltd
Autom aticVisualInstrum ents £ 20.436 £ 4 .376 £ 2 4 ,8 1 2
Interpro System s Lid.
T estE qupm ert £ 45.886 £ 105.703 £ 85.172 £ 125.030 £ 120,965 £ 67.705 £ 4 1 t206 £ 9.600 £ 6 0 1 ,2 6 7
Location Techroloav Ltd £ 12.522 £ 1 2 ,5 2 2MicroprocessorDevelopment
Dom esticH eaters £ 13,500 £ 1 3 ,5 0 0
MonroeManufacturingLtd
C ar S e c u r ity S ystem s
£ 1.822 £ 1 ,8 2 2PI assay T ec h n o lo g y
Electronicengineering
£ 0 £ 0SeagiilElectronics
Hightechnology £ 1.872 £ 2.491 E 4 ,3 6 3
Verbatim Ltd Magnetic Storaoe Media £ 5.700 £ 68,031 E 73 ,731
V iP
MicroelectronicsProduction Ltd
Desicp & Developm ent of T est £ 9.088 £ 38.280 £ 4 7 .3 6 8
11
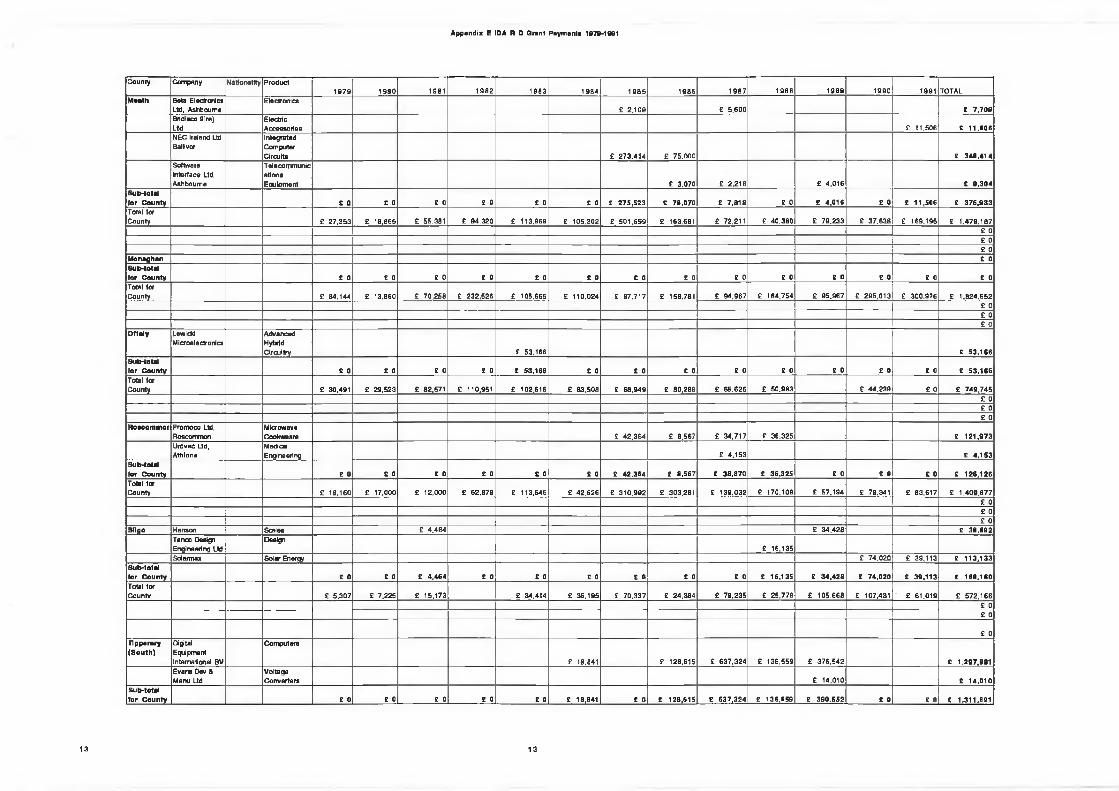
Appendix E IDA R D Orant Payments 1070-1991
County Company Nationality P roduct1 6 7 9 1 9 8 0 1981 1 982 1983 1 9 8 4 1 8 8 5 1 986 1 9 8 7 1980 1 989 1990 1991 TOTAL
M M ttl Beta Electronics Ltd, Ashbourne
Electronics£ 2,109 £ 5,600 E 7 ,709
Bndisco 9 Ire) Ltd
ElectricA ccessories £ 11.506 E 1 1 .5 0 6
NEC Ireland Ltd BaJHvor
IntegratedComputerCircuits £ 273,414 £ 75.000 E 3 4 8 ,4 1 4
Software Interface Ltd, A shbourne
Teiecom m unicationsEau Id merit £ 3.070 £ 2,218 £ 4 ,016 E 9 ,3 0 4
S u b -to ta l fo r C o u n ty £ Q E 0 E 0 E 0 E 0 E 0 E 275 ,523 E 78 ,070 £ 7 ,818 £ 0 E 4 ,016 E 0 £ 11 ,506 E 3 7 6 ,9 3 3Total lor County £ 27,353 £ 18,065 £ 55.381 £ 94 ,320 £ 113,969 £ 105.302 £ 501 .659 £ 163,681 £ 72.211 £ 40.380 £ 79 .233 £ 37.638 £ 169,195 £ 1 ,479 ,187
£ 0£ 0£ 0
M onaghan E 0S u b to ta l lo r C o u n ty £ 0 £ 0 £ 0 E 0 E 0 £ 0 £ 0 E 0 £ 0 E 0 E 0 E 0 E 0 E 0Total lor County £ 84.1+4 £ 13.860 £ 70,258 £ 232,526 £ 105.665 £ 110.024 £ 97.717 £ 150.781 £ 94 .967 £ 164.754 £ 95,967 £ 295,013 £ 300.976 £ 1.824.652
£ 0£ 0£ 0
O ffa ly LewlckiMicroelectronic*
AdvancedHybridCircuitry £ 53,166 E 5 3 ,1 6 6
Sub-totai for C ounty £ 0 E 0 £ 0 E 0 £ 53.188 E 0 E 0 E 0 E 0 E 0 £ 0 £ 0 E 0 E 5 3 ,1 6 6Total for County £ 30,491 £ 29.523 £ 82,571 £ 110,951 £ 102.616 £ 83.508 £ 68.949 £ 80,288 £ 65.626 £ 50.983 £ 44 ,239 £ 0 £ 749 .745
£ 0£ 0£ 0
R oaoom m or Pro mo co Ltd, Roscommon
MicrowaveCookwaare £ 42.364 £ 8,567 £ 34 ,717 £ 36.325 E 12 1 ,9 7 3
U rovac Ud, A thlane
Medical Engine erinq £ 4.153 E 4 ,1 5 3
Sub-total fo r County E 0 £ 0 E 0 E 0 £ 0 £ 0 E 42 .364 E 8,567 E 38 .870 £ 36,325 E 0 £ 0 £ 0 E 12 6 ,1 2 6Total for County £ 18.160 £ 17,000 £ 12,000 £ 62 .879 £ 113.646 £ 42,626 £ 310.992 £ 303,281 £ 139,032 £ 170,109 £ 57,194 £ 79,341 £ 83,617 £ 1 .409 ,877
£ 0£ 0£ 0
Sii go Hanson Scales £ 4 .464 j £ 34.428 £ 3 8 .8 9 2Tertco D esiai Engineer! nq Lid
Deslfpi£ 16,135
Sotarmax Solar Energy £ 74,020 £ 39,113 E 11 3 ,1 3 3Sub-total for County E 0 E 0 E 4 ,464 E 0 E 0 £ 0 E 0 E 0 E 0 £ 16,135 £ 34 ,428 £ 74 ,020 E 39 ,113 E 16 8 ,1 6 0Total tor Co untv £ 5,307 £ 7.225 £ 15,173 £ 34.414 £ 36,195 £ 70,337 £ 24,384 £ 79,235 £ 25,770 £ 105.668 £ 107,431 £ 61,019 £ 5 72,166
£ 0£ 0
£ 0T ipperary(S o u th )
Digital Equipment International BV
Com puters
£ 18.841 £ 128,615 £ 6 37.324 £ 136.559 £ 3 76.542 £ 1 ,297 ,881Evans Dev & Manu Ltd
VoltageC onverters £ 14.010 £ 1 4 ,0 1 0
s u b -to ta l fo r C ounty E 0 £ 0 E 0 E 0 E 0 E 18,841 E 0 E 128,615 E 63 7 ,3 2 4 £ 136,559 E 390 .552 £ 0 £ 0 £ 1 ,311 .891
13 13
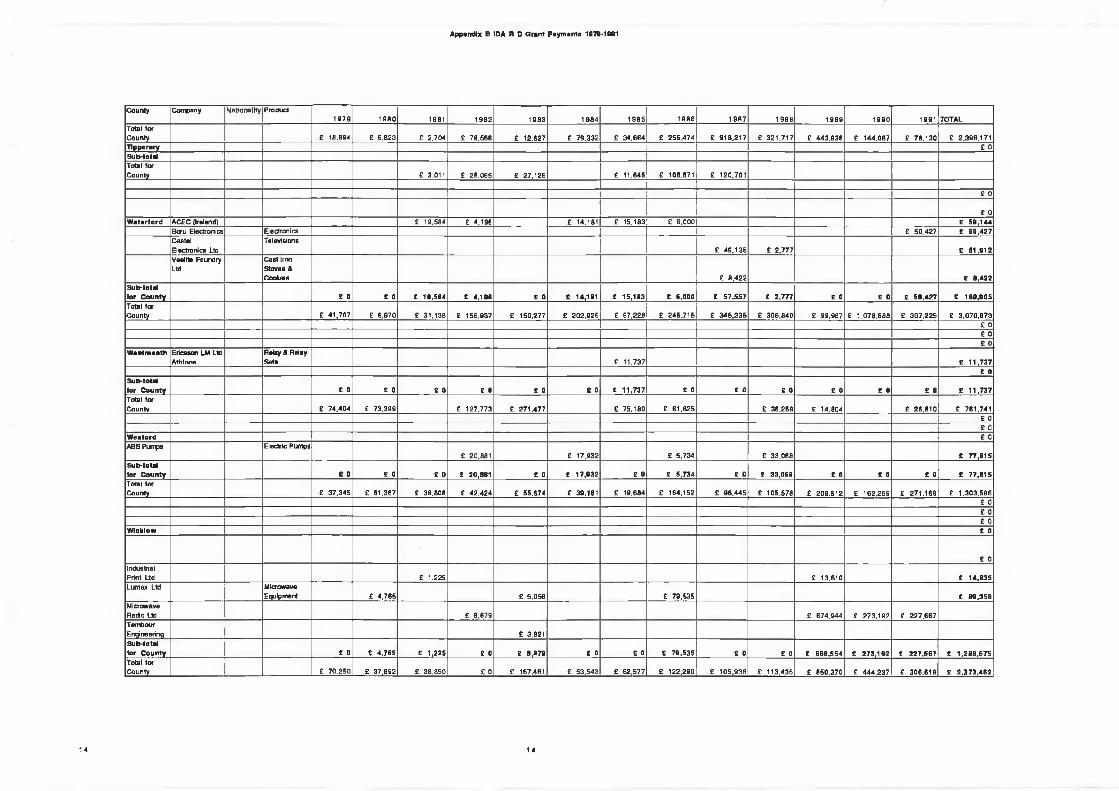
Appendix E IDA R D Grant Payments 1979*1991
County Company Nationality Product1 9 7 9 1 9 8 0 19B1 198 2 1 983 16 8 4 1 9 8 5 1986 1 9 8 7 198B 19B6 199 0 1991 TOTAL
Total forCounty £ 1H.BB4 £ 6,823 £ 2,704 £ 78,566 £ 12.627 £ 79.332 £ 34.664 £ 256.474 £ 918 ,217 £ 321.717 £ 443.936 £ 144.087 £ 78 .130 £ 2.396 .171T ip p erary £ 0S u b -to ta lTotal for County £ 3,011 £ 28.065 £ 27,126 £ 11.645 £ 106.671 £ 120.701
£ 0
£ 0W a te rfo rd ACEC (Ireland) £ 19,584 £ 4.196 £ 14.181 £ 15,183 £ 6,000 E 5 9 ,1 4 4
Boru Electronics Electronics £ 50,427 E 5 0 ,4 2 7Caste!Electronics Ltd
Televisione£ 49 .135 £ 2.777 E 51 ,912
Veefrts Foundry Ltd
C ast iron Stoves & Cookers £ 8,422 E 8 ,422
S u b -to ta l fo r C o u n ty E 0 E 0 £ 19,584 £ 4,196 £ 0 £ 14,181 £ 15,183 £ 6,000 £ 57 .557 E 2,777 £ 0 £ 0 £ 5 0 ,4 2 7 £ 16 9 ,9 0 5Total forCounty £ 41 ,707 £ 6,970 £ 31.138 £ 156.937 £ 150.277 £ 202,926 £ 97.228 £ 245.715 £ 3 4 5 .2 3 5 £ 306.840 £ 99,987 £ 1.078 .688 £ 307.225 £ 3 .0 70 .873
£ 0£ 0£ 0
W e a tm e a th Ericsson LM Ltt Athlon«
Relay & Relay Sets £ 11.737 £ 1 1 ,7 3 7
£ 0Sub-total for C ounty £ 0 E 0 £ 0 E 0 £ 0 £ 0 £ 11 ,737 E 0 £ 0 E 0 £ 0 E 0 E 0 E 1 1 ,7 3 7Total for Countv £ 74,4(W £ 73,399 £ 127.773 £ 271.477 £ 75.180 £ 61.625 £ 36.269 £ 14.804 £ 26.810 £ 761.741
£ 0£ 0
W exlo rd e oABS Pumps Electric Pumps
£ 20.881 £ 17.932 £ 5.734 £ 33.068 £ 7 7 ,8 1 5Sub-total for C ounty £ 0 E 0 £ 0 £ 20,881 £ Q £ 17 ,932 E 0 E 5 ,734 E 0 £ 33,068 E Û £ 0 E 0 E 77,81 STotal tor County £ 37,345 £ 61,367 £ 38,806 £ 42.424 £ 55.674 £ 39.181 £ 19,684 £ 164.152 £ 96 .445 £ 105.578 £ 209.512 £ 162.259 £ 271.169 £ 1.303.596
£ 0£ 0£ 0
W ioklow £ 0
£ 0Industrial Print Ltd £ 1.225 £ 13,610 E 1 4 ,8 3 5Lumex Ltd Microwave
Equipment £ 4,765 £ 5.058 £ 79,535 £ 8 9 ,3 5 8Microwave R ed o Ltd £ 8.679 £ 674.944 £ 273,192 £ 227.667TembourEngineering £ 3.821S u b -to ta l for C o u n ty £ 0 £ 4,765 E 1,225 £ 0 E 8,879 £ 0 £ 0 £ 7 9 ,5 3 5 £ 0 £ 0 £ 688,554 £ 273 ,192 E 2 27 ,667 £ 1 ,2 8 8 ,6 7 5Total for County £ 70.250 £ 37,892 £ 38.850 £ 0 £ 167.461 £ 53.543 £ 62,577 £ 122,290 £ 105.938 £ 113,435 £ 850,370 £ 444,237 £ 306,619 E 2 ,3 7 3 ,4 6 2
14 14
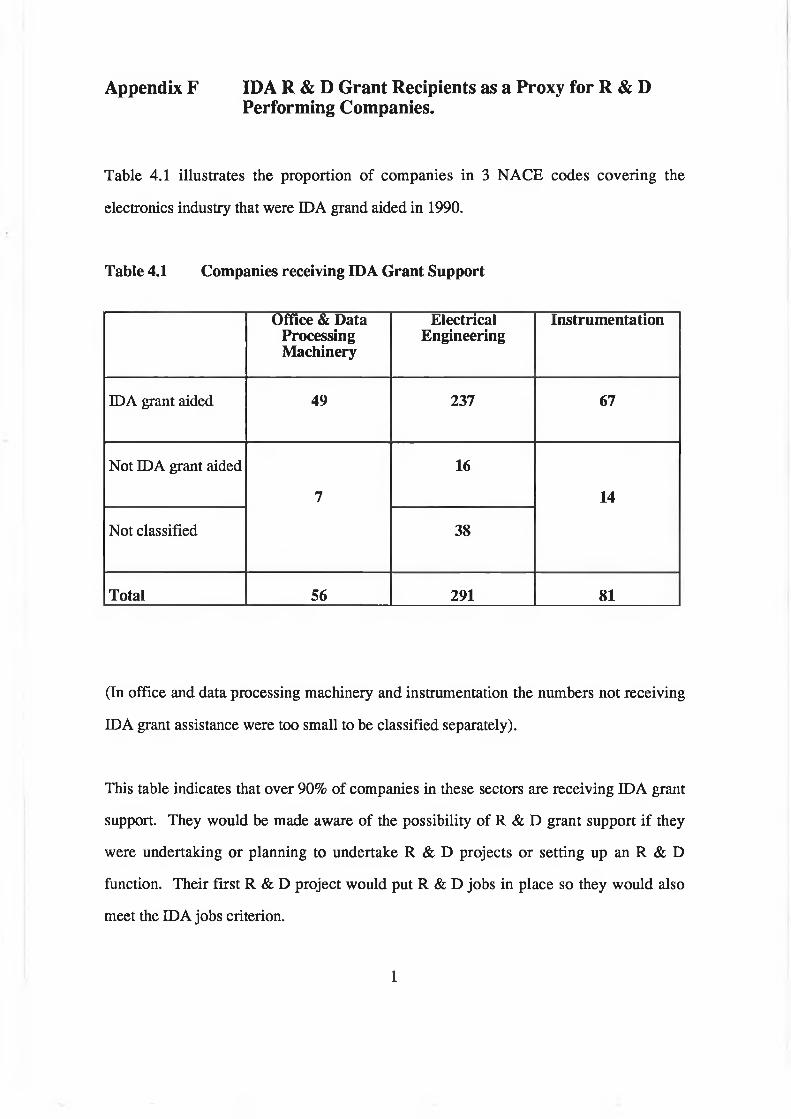
Appendix F IDA R & D Grant Recipients as a Proxy for R & D Performing Companies.
Table 4.1 illustrates the proportion of companies in 3 NACE codes covering the
electronics industry that were IDA grand aided in 1990.
Table 4.1 Companies receiving IDA Grant Support
Office & Data Processing Machinery
ElectricalEngineering
Instrumentation
IDA grant aided 49 237 67
Not IDA grant aided
7
16
14
Not classified 38
Total 56 291 81
(In office and data processing machinery and instrumentation the numbers not receiving
IDA grant assistance were too small to be classified separately).
This table indicates that over 90% of companies in these sectors are receiving IDA grant
support. They would be made aware of the possibility of R & D grant support if they
were undertaking or planning to undertake R & D projects or setting up an R & D
function. Their first R & D project would put R & D jobs in place so they would also
meet the IDA jobs criterion.
1

To receive IDA funding a specific project must be identified costed and commercially
justifiable. Since 1987, it also has had to undergo a technical assessment by Eolas to
ensure it was legitimate R & D.
The funding is paid only after technical and commercial reports are written, and these
reports approved b;y the IDA.
Thus the IDA data represents payments made to support planned R & D projects that
have been technically and commercially evaluated. Over the 12 year period in question it
should capture 90% of the companies undertaking R & D. From reviewing the
companies, their apparent level of R & D and the level of funding provided there would
appear to be a good correlation between the two.
The companies receiving the largest grant funding are clearly those who are (were)
undertaking the most R & D - Analog Devices, ATT, Digital, ECCO and AEG/Inland
Motors on the multinational side and Mentec, Lake Electronics and Interpro on the
indigenous side.
The total amount paid has fallen significantly as a percentage of the total spend on R & D
in the sectors, so to get a truer picture it might be necessary to weight late eighties
payments heavier than payments in the mid eighties.
Because the IDA funded projects are of "assessed quality", cover 90% of the industry and
are independently assessable (since company names and project titles are published),
they represent a more valuable source of data than the Eolas statistical reports which are
more extensive.
2