research and development center bet y t al ucasified … · -m,ft2 117 roughness effects on ittc...
TRANSCRIPT

-M,ft2 117 ROUGHNESS EFFECTS ON ITTC (INTERNATIONAL TONING TAMS £CONFERENCE) PROPELLE (U) DAVID W TAYLOR NAVAL SHIPRESEARCH AND DEVELOPMENT CENTER BET Y T SHEN ET AL
UCASIFIED JAN 83 DTNSRC/51D-1255-91 F/G 13/10 WIIIIIIIIIIIIl
llllllllllllEEE

.
1.0 llIQl
,,::: IIIIL-2 11111"--- LA .
MICROCOPY RESOLUTION TEST CHART
"p
.L.
4
HI', f '
d,
0 . • • MICROCOPY REOU ON JES ChART w...- % - .. ., -. ,.,, ,-,. ,, ,v ".ev. -' - '," ,, w r:'r- ,/ .s
.. .. '. .,q, ., - - -..

,. ....." + + ~ ............... -...-+ -CrDavid W. Taylor Naval Ship Research and Development CenterBethesda, MD 20084-5000
DIRC-SHD 1255-0 January 1988
* Ship Hydranechanics [epartrent9.
ROUGrHNESS EFFECT'S CN
ITIC PIELLER CAVITATIC1N-. 0
by
7.+.
Young T. ShenKirk J. Anderson
-44
['.'.'. '-I
U) -Approved for public release;
Distribution is unlimited.
DTIC-" "SELECTEA U MAR 1 11988
* '-4r, 0- H
6::"
_-,.N q ++ + mI , -,, " " " ""d"",,A'.' %,,,; -2 ," -,r ,,,, ,- ,. ,,' .. .r ,. ,,. . . . . . . .. ,
COMMANDER 00
TECHNICAL DIRECTOR 01
*OFFICER IN CHARGE OFFICER IN CHARGECARDEROCK 05 04 ANNAPOLIS
* SHIP SYSTEMS INTEGRATION PROPULSION AND AUXILIARYDEPARTMENT 12 27 SYSTEMS DEPARTMENT
SHIP PERFORMANCE SHIP MATERIALS ENGINEERINGDEPARTMENT 15 28 DEPARTMENT
AVIATION AND SURFACEEFFECTS DEPARTMENT 16
STRUCTURES DEPARTMENT 17
COMPUTATION, MATHEMATICS
& LOGISTICS DEPARTMENT 18
SHIP ACOUSTICS DEPARTMENT 19
CENTRAL INSTRUMENTATIONDEPARTMENT 29
4I'l
DESTRUCTION NOTICE - For classified documents, follow the procedures in DOD5220.22M, Industrial Security Manual, Section 11-9, or DOD 5200.1-R, InformationSecurity Program Regulation, Chapter IX. For unclassified, limited documents,destroy by any method that will prevent disclosure of contents or reconstruction ofthe document.
I NOW-OTNSROC S02130 (Rev 4-0)

ROJUGHNESS EFFECTS ON
IMr PROPELLER CAVITATION
byf 4
Young T. Shen
Kirk J. Anderson.
Approved for public release;Distribu.tion unlimited.
*~~~4V ~ ~ ~iV . ~ ~ t~i , . ' S-
, ' "f
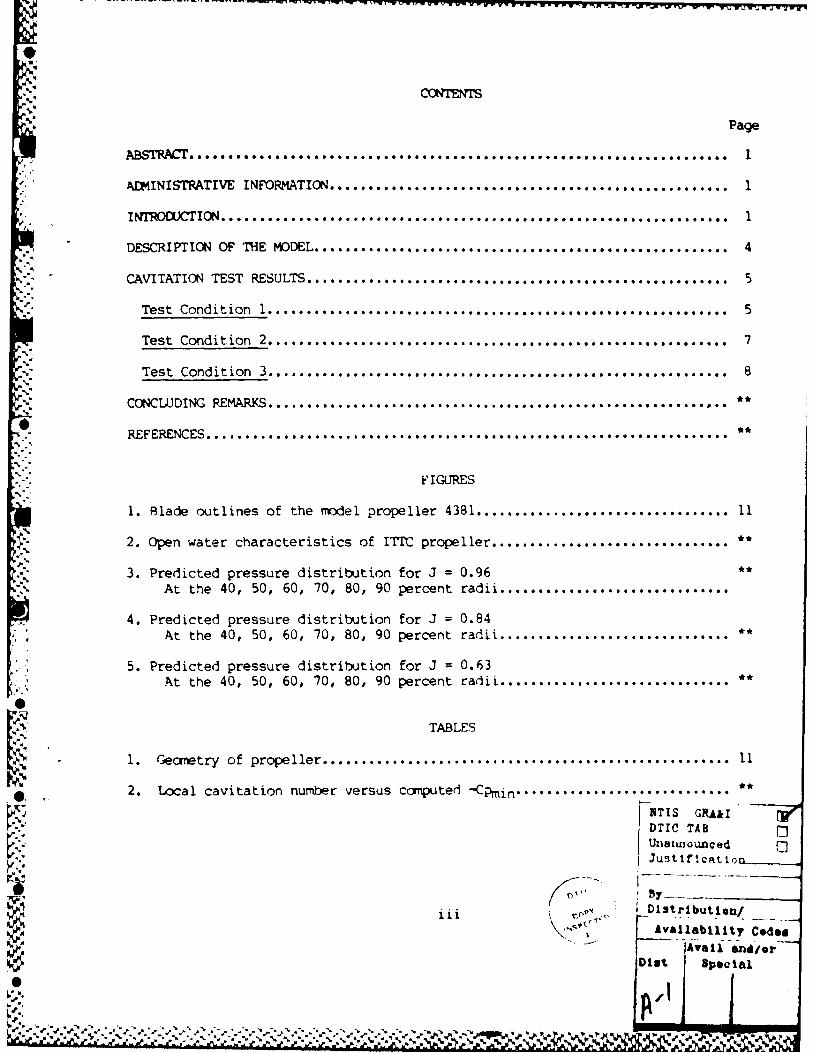
COR1IENTS
9' Page'
oOBSTRA T.. . . . .. ....l ~ o ... .oe . ....e.. e. . . . ....
ee l l l O~ e .1 . e. o. ].
A INISTRATIVE INFORMATION .................................................... 1
ItIRODUCTION ......................... * .. .......... # ...... ....... . ........... . 1
DESCRIPTION OF THE MODEL. ..... . .. . .. ..... . *. . . . .*. . .. . . . . . . ....... * 4
CAVITATION TEST RESULTS.... .......... ........................... .......... 5
, "Test Cond it ion 1 ................................................. so........... 5
pTest Condition 2 ................................................ s.. *......... 7
w" Test Condition 3 .. . . . . . . . . . . . . . . . . . . . . . .*. . . . . 8
CONCLJDING REMARKS .*............................................. *
REFERENCES ....................................................... ........
F IGURES
1. Blade outlines of the model propeller 4381 ................................. 11
2. Open water characteristics of ITTC propeller ...............................
3. Predicted pressure distribution for J = 0.96 **At the 40, 50, 60, 70, 80, 90 percent radii .................
4. Predicted pressure distribution for J = 0.84At the 40, 50, 60, 70, 80, 90 percent radii.................. **
5. Predicted pressure distribution for J = 0.63At the 40, 50, 60, 70, 80, 90 percent radii ...........................
TABLES
1. Geometry of propeller ..................................................... 11
2. Local cavitation number versus computed -CPmin ..........................
NTIS GRA&IDTIC TABU1,81wouncled
Justlicat Io
v -Dlst rtbutle~n/
kk"+'+'Y' I Availablity C es
" J -- ]Av-il and/or':IDt Special
:.,,.',"-' ..J.-"..' '-,%5 ,-"'.'''", .'v-".',"%'.''.:£'.,'~'"-" . +
_
.'' a, '
I. - - . .. . U' : , ' --r
& - U " ' . L: ,I . . 7u ''w- 'i i f .m q
1. Sandblasted blade surface ....... *......*...... . ................ **
2. Macro photographs of sanbiasted regions (from ref. 6).....................
3. Cavitation patterns at test condition 1, KT = 0.18 and On = 0.874
4. Cavitation patterns at test condition 2, KT - 0.24 and an = 2.375. Cavitation patterns at test condition 3, KT =0.36 and 0n = 2.37 .......... **
* F.
.,
iv

ABSTRACT
Different cavitation patterns are often observedbetween the model propeller and the full scale proto-type. Scale effects on cavitation inception and cav-ity extent cause uncertainty in the extrapolation oftest results from model to full scale. The Interna-tional Towing Tank Conference Cavitation Committeerecognized this undesirable cavitation scaling pro-blem and proposed an international cooperative prograu,to investigate the use of leading edge roughness toreduce the cavitation scaling problem.
A 5-bladed bronze propeller was fabricated atMARIN (NSMB) in the Netherlands. The surfaces onblades 1 and 2 were smooth and the surfaces of blades3 and 4 were sandblasted. Blade 5 was roughened withcarborundum. The same propeller was tested in the
" facilities of the different committee members at thesame loading conditions.
-'. The model propeller was tested in the DIX 24-InchVariable Pressure Water Tunnel. The influences of
Reynolds number, air content, " ious types of leadingedge roughness, and blade loadingS on cavitation wereinvestigated. The cavitation test results were com-pared with the theoretically predicted pressure dis-tribution to evaluate the effectiveness of using
. leading edge roughness in reducing the czvitationscaling problem.
-N. A DMINISTRATIVE INFORMATION
This work was funded by the Naval Sea Systems Command under the Applied Hydro-
mechanics Research Program, Element 61153N, Task Area R0230101 and wa, carried out
by the Ship Hydramechanics Department under work units of 1542-817.
• ~INTRODUCTION
It has often been assumed that cavitation inception occurs when the static
pressure reaches the vapor pressure of the flowing fluid. This assumption is used
- in model cavitation tests and full scale predictions. The deficiency of this
assumption is clearly brought out in the series of headform experiments organized byI , , the International Towing Tank Conference (ITTC headform)1 . The same model tested
1k

-* at different facilities or the same facility at different test speeds and/or air
contents showed different types of cavitation appearance and different indices of
cavitation inception. Acosta and Parkin1 pointed out that the free stream nuclei
distribution and the boundary layer characteristics of the model are responsible for
the chaotic appearance of cavitation patterns.
Field observations indicate that leading edge sheet cavitation occurs much eas-
ier on a full-scale propeller than on a model propeller at a given cavitation
number. Experimental investigations clearly demonstrate that no leading edge sheet
cavitation occurs if the boundary layer is laminar. This is the case in many model
experiments. However, with a difference of two orders of magnitude in Reynolds num-
ber, the boundary layer is turbulent and leading edge cavitation occurs easily on a
2prototype propeller at high speeds Different cavitation patterns are often
observed between the model and the prototype. Scale effects on cavitation inception
and cavitation extent cause uncertainty in the extrapolation of test results from
model to full scale. This fact contributes to one of the well known cavitation
scaling problems.
Attempts have been made to improve model cavitation tests so that undesirable
scale effects are reduced. Recent studies seem to indicate that distributed rough-
ness around the leading edge of a foil can be used effectively to promote the onset
w. ,- of boundary layer transition either via the destabilization mechanism of the
Tollemin-Schlichting waves at lower values of Reynolds numbers or via the mechanism
of Strouhal oscillation at higher values of Reynolds number3 Uniformly distributed
roughness or a single wire has been extensively used in aerodynamics and hydrody-
namics to stimulate boundary layer development. A locally induced disturbance to
the pressure and velocity fields around the leading edge by roughness elements
K' should not significantly alter overall lift and drag characteristics, which are
0.
,e,2

of main interest for lifting surfaces in the absence of cavitation.
However, in marine applications the occurrence of cavitation is very sensitive
to the magnitude of the local pressure field. The information accumulated on aero-
dynamics thus can not be used directly without going through a further refinement.
This is evident from many recent publications on the subject of roughness distribu-
tion and cavitation3 ,4 ,5.
The Cavitation Committee of the ITrC recognizes the potential benefit of apply-
ing distributed surface roughness to minimize the scale effect on leading edge sheet
cavitation. In the 18th IThC Cavitation Committee report, an international coopera-
tive program was established to test the sane model propeller in different facili-
ties.
6The objectives of this international cooperative program are as follows6 -
1. To examine the effectiveness of leading edge roughness in
reducing scale effects on cavitation inception.
2. To examine the condition of premature cavitation induced by theroughness elements and the subsequent influence on the cavity length.
3. To examine the effectiveness of leading edge roughness indecreasing the differences in cavitation inception and cavity extentbetween test facilities.
Because of the extreme sensitivity of cavitation to local propeller geometry,
this program requires the use of identical propellers. The DTRC model propeller
74381 was designated by the 18th ITTC as the test propeller . A brief description
of this propeller geometry is given in Table I. The ITTC model propeller was subse-
quently fabricated at MARIN (NSMB). This propeller has since been tested at MARIN6 ,
CSSRC (China)8 , and HSVA (Federal Republic of Germany)9 and then shipped to DMC.
The cavitation tests described in the present report were conducted in aTr's
24-inch variable pressure water tunnel. The first half of this test program focused
on the test parameters recommended by the ITIM Committee. The second half of the
3
IV

test program focused on the construction of cavitation inception buckets at several
* radial locations with different roughness distributions. The present report docu-
ments the results from the first half of the test program.
DESCRIPTION OF THE MODEL
The model is a five-bladed propeller with the expanded and projected outlines
*. shown in Figure 1. This bronze model with a diameter of 250 mu was constructed at
*. MARIN. The surfaces of Blades No. 1 and No. 2 are smooth. The surface of Blade No.
3 was sandblasted from the leading edge, the width of the sandblasted area varying
with the blade radius. At 0.7 radius, the bandwidth is about 1.8 miv which is
approximately 2.1 percent of the local chord length. Blade No. 4 was sandblasted in
a strip at 1.5 mm from the leading edge with the strip width of lnn. Bl~de No. 5
was carborundum coated from the leading edge. The width of the coated roughness is
approximately 1.5 rn at 0.7 radius with a RMS roughness height of 0.093 nui. It is
noticeable that the roughness on Blades 3, 4 and 5 cover both the back and the face
" of the blades. Photos la and b show the general view of roughness coverage at the
outer radii. Photos 2a and b show the magnified vie of the sandblasted patterns.
CAVITATION TEST RESULTS
Cavitation experiments were conducted in the open jet test section of the DTRC
24-inch variable pressure water tunnel. The propeller was mounted on the downstream
shaft with an axially uniform inflow. To compensate for the tunnel wall effects on
the flow field, the test speed in the water tunnel was set by using the thrust iden-
tity method based on open water data.
The open water data used in setting up the test conditions for the water tunnel
were obtained in a towing tank. The measured KT and k values are given in Figure
2. For purposes of comparison, numerical computations were performed by using MIT's
4
o. 0 * WI ~-

PSF2 ccmputer code. The friction coefficient used in the computation was based on a
smooth blade surface. The computed results are plotted in Figure 2 along with the
measured data. Good agreement between Teasured and computed KT values is noted
along with a slight difference in the K0 data.
Three test conditions were set in the tunnel to reflect the influence of vari-
ous types of propeller loading on cavitation.
o Test Condition 1
.The test conditions were KT = 0.18 and On = 0.87. At KT = 0.18, the open water
data give J = 0.964. The corresponding pressure distributions computed at several
propeller radii from MIT's PSF2 computer code are shown in Figure 3. Lighthill's
'. formula was used to correct the nonlinear effect around the leading edge: Within
the resolution of this calculation no suction pressure peak is predicted at any
blade radius, so that the blades experience shock-free entry. It is concluded that
no leading edge sheet cavitation should occur at full scale with this type of pres-
sure loading.
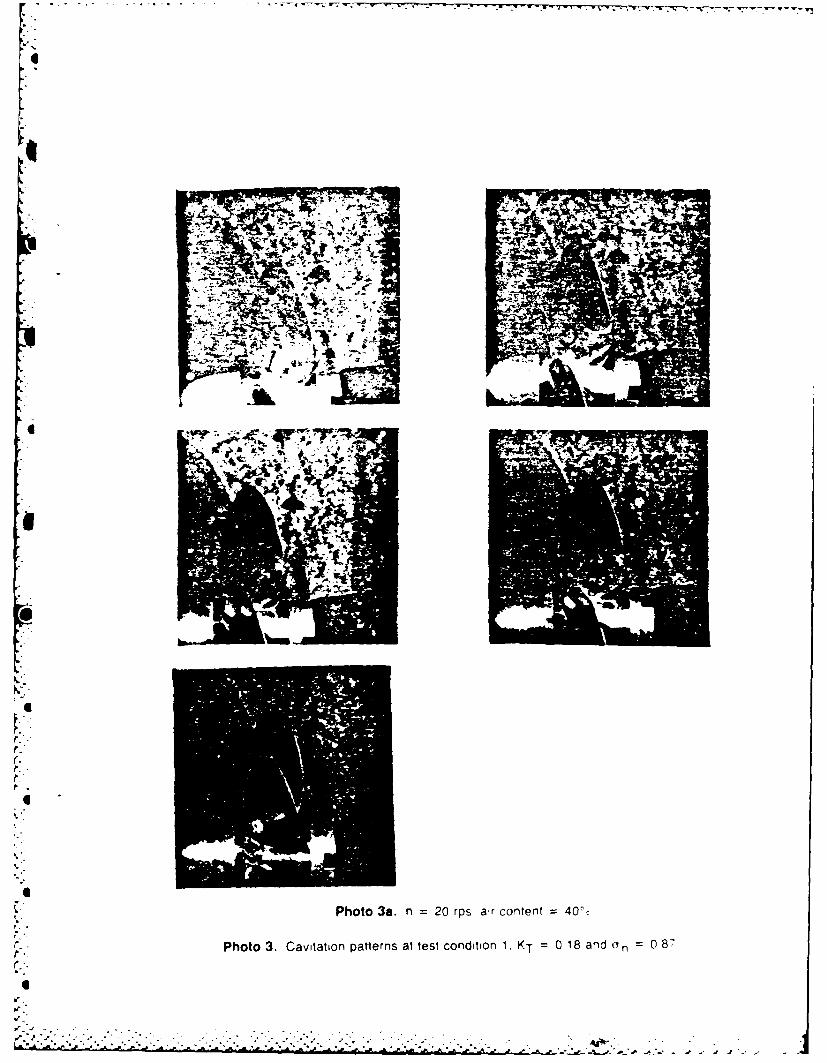
The cavitation patterns at this test condition are shown in Photo 3 at 1200
shaft RPM which gives a local Reynolds number of 1.12x10 6 at the 0.7 radius. Photo
3a shows the cavitation patterns for an air content of 40 percent of saturation at
-S atmospheric pressure. First consider the cavitation pattern on Blade No. 1. Cavi-
0 tation bubbles are visible at the inner radii from the root to 0.5 radius. In gene-
ral, the photos indicate similar cavitation patterns on Blades No. 1 through 4. At
this test condition, the influence of the sandblasting on cavitation seems negligi-
ble. However, Blade No. 5, which is coated with carborundum roughness, exhibits no
cavitation bubbles. Previous experiments on a two dimensional hydrofoil showed that
% .10surface roughness reduces the effective camber and the pressure loading 0 . This may
5-5
lee
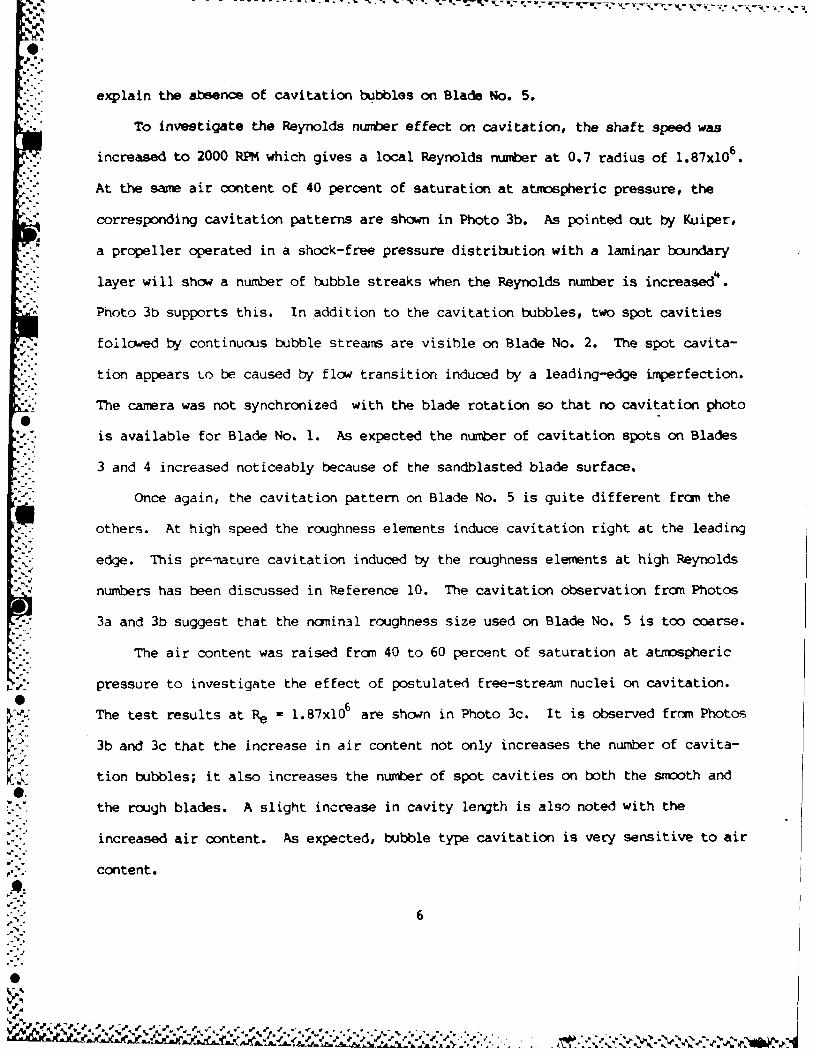
explain the absence of cavitation bubbles on Blade No. 5.
To investigate the Reynolds number effect on cavitation, the shaft speed was
increased to 2000 RPM which gives a local Reynolds number at 0.7 radius of 1.87xi06 .
At the same air content of 40 percent of saturation at atmospheric pressure, the
corresponding cavitation patterns are shown in Photo 3b. As pointed out by Kuiper,
a propeller operated in a shock-free pressure distribution with a laminar boundary
layer will show a number of bubble streaks when the Reynolds number is increased'.
Photo 3b supports this. In addition to the cavitation bubbles, two spot cavities
followed by continuous bubble streamrs are visible on Blade No. 2. The spot cavita-
tion appears to be caused by flow transition induced by a leading-edge imperfection.
'-; The camera was not synchronized with the blade rotation so that no cavitation photo
V "is available for Blade No. 1. As expected the number of cavitation spots on Blades
3 and 4 increased noticeably because of the sandblasted blade surface.
Once again, the cavitation pattern on Blade No. 5 is quite different from the
others. At high speed the roughness elements induce cavitation right at the leading
edge. This premature cavitation induced by the roughness elements at high Reynolds
numbers has been discussed in Reference 10. The cavitation observation from Photos
3a and 3b suggest that the nomin3l roughness size used on Blade No. 5 is too coarse.
The air content was raised from 40 to 60 percent of saturation at atmospheric
pressure to investigate the effect of postulated free-stream nuclei on cavitation.
S6The test results at Re = 1.87xi0
6 are shown in Photo 3c. It is observed from Photos
3b and 3c that the increase in air content not only increases the number of cavita-
tion bubbles; it also increases the number of spot cavities on both the smooth and
the rough blades. A slight increase in cavity length is also noted with the
increased air content. As expected, bubble type cavitation is very sensitive to air
content.
6
%0
AJ~X- *

Theory predicts that cavitation will occur on a full scale propeller frcn the
0.4 to the 0.8 radius. The cavitation patterns on the sandblasted blades are in
reasonably good agreement with the theoretical predictions when the model propeller
was tested at high Reynolds number and high air content.
Test Condition 2
The tests were conducted at KT 0.24 and on = 1.03. The open water data give
J = 0.84 at KT = 0.24. The corresponding pressure distributions and -Cpmin conputed
at several radii are given in Figure 4 and Table 2. Weak suction pressure peaks
occur around 3 to 5 percent of chord from the leading edge. A comparison of pres-
-.- sure distributions and the local cavitation numbers at as shown in Table 2 indicates
*' that cavitation on a full scale propeller is expected to occur around the leading
edge between the 0.4 to 0.8 radius. In the region between the 0.8 and 0.9 radii the
computed -CPmin is only slightly lower than at. The difference is so small that
cavitation could be expected to occur on the prototype because it is doubtful the
surface would be smooth.
Test results at 1200 RPM and 40 percent air content saturation are shown in
Photo 4a. The corresponding Reynolds number for this test condition is 1.10xl0 6 at
the 0.7 radius. In the case of the smooth blades, four streaks of cavities occur on
Blale No. 1 fr-om the 0.6 to 0.9 radii and three streaks on Blade No. 2 from the 0.7
* to 0.9 radii. The number of streak cavities increases on the sandblasted or rough-
ened blades, but the inner radii between 0.4 to 0.65 are still relatively free of
'" "cavitation.
* With the shaft RPM increased to 1620 and air content maintained at 40 percent
of saturation, Photo 4b shows the corresponding results. The Reynolds number at 0.7
radius at this test condition is 1.49xi06 . The blade area covered by cavities
A, 7
% %0. P. .. 0 ?_ . j

increases noticeably with Reynolds number and surface roughness as seen in Photos 4a
and 4b. However, even on the sandblasted blades there are still many bare spots
between the cavities. It seems that a further increase in Reynolds number is needed
to improve the cavitation coverage on sandblasted blades.
Cavitation covers all of Blade No. 5, however. Again, premature cavitation is
induced by the carborundum roughness in the inner radii fram the root to 0.4 radius
* - and in the outer radii fran 0.9 to the tip. Furthermore, the cavity lengths on
Blade No. 5 are greater than the cavity lengths on the other blades at the same pro-
peller radii. These problems might be avoided if the roughness size is reduced.
This is the same recommendation given for Test Condition 1.
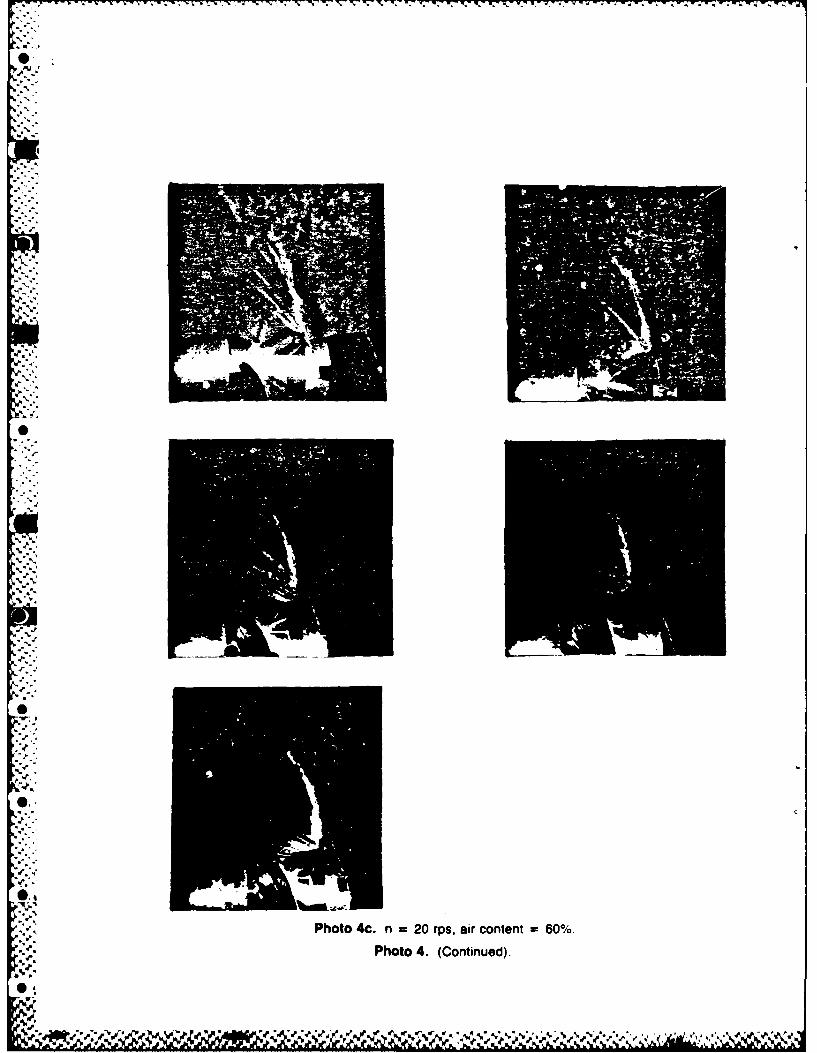
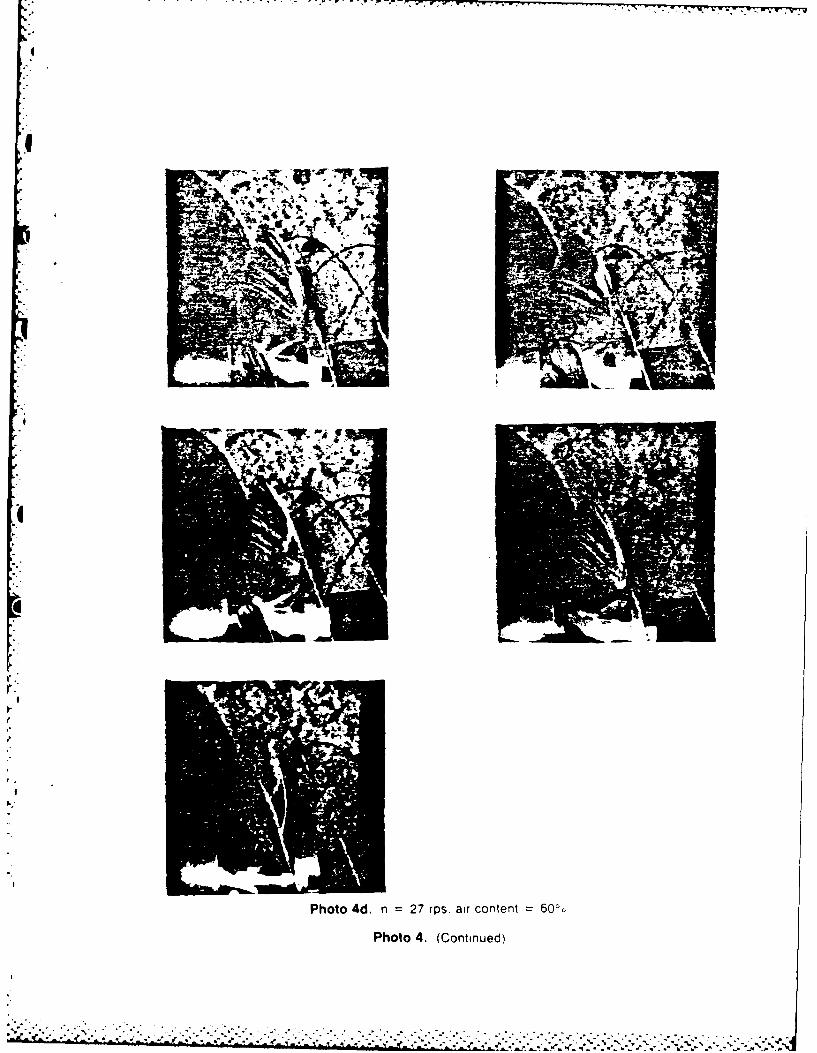
The air content was raise f ran 40 to 60 percent of saturation. The cavitation
. .coverage is increased on Blades 1 and 2 and much increased on Blades 3 and 4 as
shown in Photos 4c and 4d. The same conclusion given in Test Condition 1 is appli-
cable to Test Condition 2. The agreement on cavitation patterns between predicted
"-'" and measured is improved if the model is tested at high Reynolds number and high air
content.
Test Condition 3
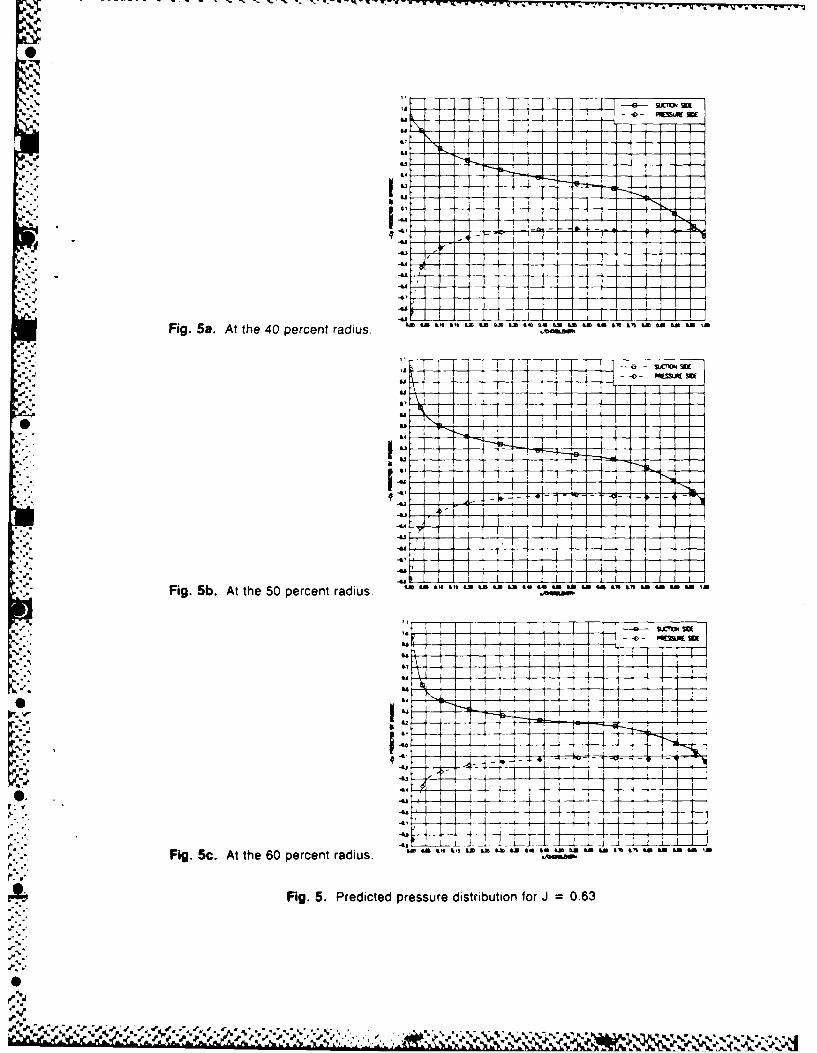
The tests were conducted at KT = 0.36 and On = 2.37. The open water data give
-. J = 0.63 at KT = 0.36. The corresponding pressure distributions and -CPmin computed
at several radii are given in Figure 5 and Table 2. Very strong suction peaks are
predicted in the outer radii. A cavprison of ccputed pressures and the local cav-
W itation numbers a, indicates that leading edge sheet cavitation should occur at fullO,
scale from 0.45 radius to the tip.
, 'Test results at 1200 RPM and 40 percent air content saturation are shown in.le% Photos 5a. The corresponding Reynolds number at this condition is 1.06x10⁶ at 0.7
7"I
80
1%°O
N V.'?,-.~~.\ -- .. ;%.

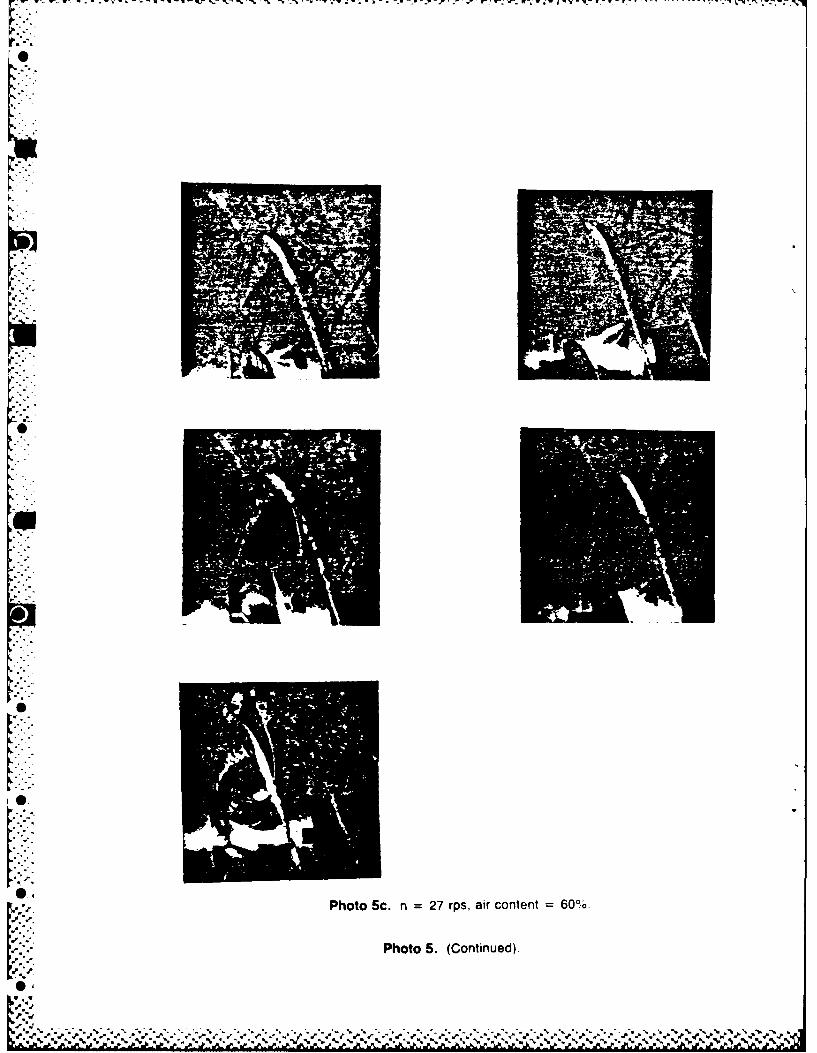
radius. Cavitation patterns are almost identical on all five blades. Photos 5b and
5c respectively show the results when air content was raised to 60 percent of satu-
ration and when the rotational speed was raised to 1620 RPM. In both cases the cav-
itation patterns on all blades are nearly the same.
Very strong suction peaks at the leading edge should occur at this test condi-
tion. The resultant negative pressure gradient may force the flow on a smooth blade
to separate and reattach downstream. Hence a small separation bubble may form on a
6model propeller for which the Reynolds number is on the order of 10". (See Refer-
ences 11 and 12.) The photograph taken by Kuiper in his flow visualization work
K shows such a separation at a low value of J. (See Figure 2 of Reference 6.)
Leading edge sheet cavitation forms easily when the boundary layer separates. It
0 also form easily when the boundary layer becomes turbulent with the surface rough-
ness applied. Therefore, only minor differences in developed leading edge sheet
cavitation are expected on model propeller blades with either a separation bubble or
leading edge roughness. This explains why the Photos in 5a,b,c all look similar.
The boundar layer transition from laminar to turbulent should always take
place right at the leading edge on a full scale propeller for which the Reynolds
Snitmber is on the order of 108. Therefore, only minor scale effects on leading edge
* sheet cavitation are expected at heavily loaded operating conditions such as those
in Test Condition 3, regardless of the blade condition.
CONCLUDING REMARKS
The theoretically computed pressure distributions from MIT-PSF2 code and
Lighthill's leadind edge correction were used to evaluate the local pressure. With
full-scale Reynolds number on the order 108, it is reasonable to assume that cavita-
tion inception will occur on a prototype propeller if the local pressure on the1.
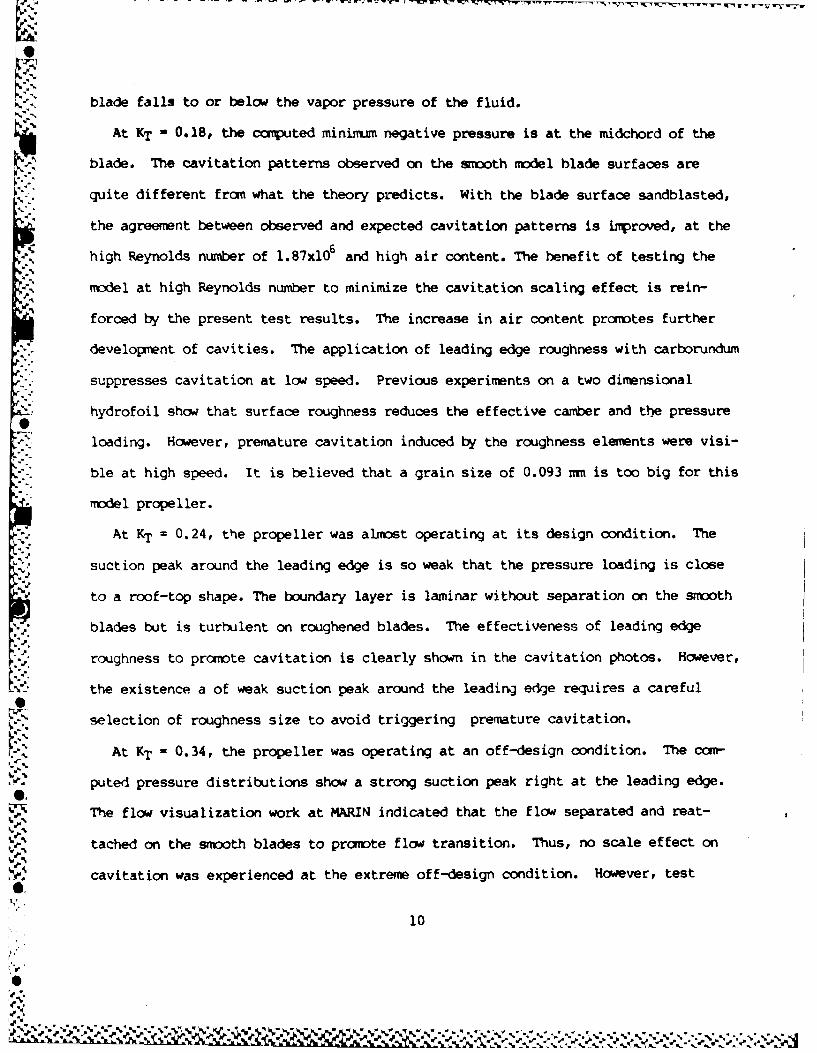
blade falls to or below the vapor pressure of the fluid.
At KT - 0.18, the ccumputed minimum negative pressure is at the midchord of the
blade. The cavitation patterns observed on the smooth model blade surfaces are
quite different from what the theory predicts. With the blade surface sandblasted,
the agreement between observed and expected cavitation patterns is improved, at them6
high Reynolds number of 1.87x10⁶ and high air content. The benefit of testing the
model at high Reynolds number to minimize the cavitation scaling effect is rein-
forced by the present test results. The increase in air content promotes further
development of cavities. The application of leading edge roughness with carborundum
suppresses cavitation at low speed. Previous experiments on a two dimensional
hydrofoil show that surface roughness reduces the effective camber and the pressure
loading. However, premature cavitation induced by the roughness elements were visi-
ble at high speed. It is believed that a grain size of 0.093 mm is too big for this
model propeller.
At KT = 0.24, the propeller was almost operating at its design condition. The
suction peak around the leading edge is so weak that the pressure loading is close
to a roof-top shape. The boundary layer is laminar without separation on the smooth
blades but is turbulent on roughened blades. The effectiveness of leading edge
roughness to promote cavitation is clearly shown in the cavitation photos. However,
the existence a of weak suction peak around the leading edge requires a careful
selection of roughness size to avoid triggering premature cavitation.
At KT - 0.34, the propeller was operating at an off-design condition. The cor-
puted pressure distributions show a strong suction peak right at the leading edge.
The flow visualization work at MARIN indicated that the flow separated and reat-
tached on the smooth blades to promote flow transition. Thus, no scale effect on
cavitation was experienced at the extreme off-design condition. However, test
10

results fran MARIN seem ttc suggest that ttwxe is sdiql m-erit in using leadi edge
roughness to reduce the scale effect if t Reynaltr mm±un-z is not too large- Care
should be exercised wherb selectig the prper lwtn.,r rid roughness size tc, t
applied.
% % %
V,
O.'.
4".
Op.

W V - V Y1. W2ranw VWS.rI usVwrr. r r ' T'
',
EXPANDED- OUTLINE
x 0.7"i SECTION
PROJECTED.OUTLINE
t* Fig. 1. Blade outlines of the model propeller 4381.
Table 1. Geometry of Propeller.
Number of blades 5
Expanded area ratio 0.725
Section meanline NACA a = 0.8
Section thickness distribution NACA 66 with NSRDC modified nose and tail[- "Design J 0.889
it,,,"Design CTh 0.5342
* r/R tan c/D t/C Os (deg) P/D fM/c
0.2 1.8256 0.174 0.2494 0.0 1.2648 0.0311
0.3 1.3094 0.229 0.1562 0.0 1.3448 0.03680.4 1.0075 0.275 0.1068 0.0 1.3580 0.0348
0.5 1.8034 0.312 0.0768 0.0 1.3361 0.0307
0.6 0.6483 0.337 0.0566 0.0 1.2797 0.0245
0.7 0.5300 0.347 0.0421 0.0 1.2099 0.01910.8 0.4390 0.334 0.0314 0.0 1.1366 0.0148
0.9 0.3681 0.280 0.0239 0.0 1.0660 0.0123
-2

Table 2. Local cavitation number versus computed -Cp mmn
J = 0.964, KT = 0.18 J = 0.84. KT = 0.24 J = 0.63, KT =0.34
rfR U Cpmin at -Cpmin ae -Cpmin
0.3 0.48 0.46 0.63 0.54 1.85 0.88*0.4 0.347 0.378 0.43 0.45 1.20 0.92
0.5 0.256 0.285 0.31 0.37 0.83 1.02
.0.6 0.194 0.214 0.23 0.29 0.60 0.980.7 0.151 0.160 0.18 0.22 0.45 0.870.8 0.121 0.121 0.14 0.16 0.35 0.870,9 0.097 0.093 0.11? 0.11 0.28 0.55
% % %
L%

-~.-~'. WMW W- -wrJ 'W17%'rm v .XP v' IF -. 7 .- g-
0-0
-i 0*
II
U U
S. >E 0 0
I0
00 I 4
oo
0 *
0.C
* 0ZZ*5v i50

4.4
V0.
0,0
-0.2
00 0l 0,2 0.3 04 05 06 07 0.8 as 10Fig. 3a. At the 40 percent radius.
00
%.
000 0I 0.2 0 3 04 0.5 00 07 GJ 09 10Fig. 3b. At the 50 percent radius.
0.2
-0.3
-0.2
J- 0.0 C 2 0 4 0 ~ 0 ' 0 0 I
-0.
Fig. 3. Predicted pressure distribution for J =0.96.
66J
it Np

0-4
"- - - --,T -. T n - -- -- . ., : rr
001
- 1"04
-- 0 44--SM S0 1 0203 04 0F 6 07 O .
-Si__....
0-"0 0.2 03 4 _ 0. -04 7 0.- - T
del ,'. Fig. 3d. At the 70 percent radius. . ooLE ,
-I.
"-'20. - -+ -040
I: -+ _ _ ._
-02 -"4
-Ci--- .-- -- - -- ]44--- ---
-04_ -" - - .- -
.-+- 1 , + - +-+.-.i -i......... - - - ________
00 0' 02 0.3 0.4 0.5 0CA 07 U 0.8 1.0Fig. 3e. At the 80 percent radius. -OY
-- 4 z~--4-. 2 - - -4
,..._ 0, 1 , 2 0; "., 0, 0+.. 06 07 0-, 06 ,0
Fig. 3. (Continued). - --

-T--
-0.4w -44
04 -
4 -0.0-
-03 $ - - - --
-o4, - - 7 - --,---'----,~~-
0.0 0a 02 03 04 0.5 01 0.7 03 09 10Fig. 4a. At the 50 percent radius. /0RE)V
00
-06 ii L X I.43
Fig. 4.. Prdite presur dit5bto peorn radi0.84
SX....ID04pESV o
V ~ '0.3

00-
-0.2
-04-0.5
Fig. 4d. At the 70 percent rais 0.3040c 060Oii0.
0.51a I SD
04
041 - -
04-- - - li
0,3-
00
00 13 .2 O 04 0.3 Do 0' 01 0,96 '0
Fig. 4f. At the 90 percent radius.
Fig. 4. (Continued).
N e --. -V-
iii
,---- I
-4- -..
A... . - -
Fig. 5a. At the 40 percent radius. "
&4, . ...
-4,
Fig. 5b. At the 50 percent radius - 1-ik I I
1'' .-. t -e- J
4-i
"" 77Pixfi ii
Fig. 5c. At the 60 percent radius. .. SMAm.
Fig. 5. Predicted pressure distribution for J =0.63
"0 ] : I i " ! I I '%'/ -- l l~ S

.- ", ElW.- TVI l -
~--- -TT_ LW C
"'- ! I + I) ] - T- r-] ---- 'I
.2-i~_ K7
-48
Fig.S5d. At the 70percent radius.
L4C{,1 i L 21
Fig 5e. At the 80 percent radius.
i_ _ e ---
o., 4--•- - - .
Fig. 5f. At the 90 percent radius. t am Ill all $ LO 0 0 LN to 60 LO I,, $,5 am , ' am I'm
Fig. 5. (Continued).
j6
8 ;
S' ' ' - . r
I 'I ' ; ]

sii
Phot Is.Blad numer 3
44
4.0
I-X
Photo l1b. Blade number 4.
Photo 1. Sandblasted blade surface.

S'p
,t.
* .
i . Photo 2a. Blade number 3.
'9- ht .M cr htgah f adlse eios(rmrf )
a,.i.
S'; -- I- .: 2.: .. , .. , . ,,: ' .. N-,,: :-~. ; :- :,
- - -..- -- .-
I
~4 a
a. -~
.~;-, I- -~*
~.
U
0
6
I.
I
6
Photo 3a. n = 20 rps. ar content = 4OCc
r Photo 3. Cavitation patterns at test condition 1. KT 0 18 and ~ = 087
6
- ~ . .. . . . .
-. -:-.- -. -. -- d J -. -. -

0. 7R R o
1V
0e
Pht b 33rsarcnet 4%
Photo 3b 3.3 (prCont e nt 0
Pht%.(otne)
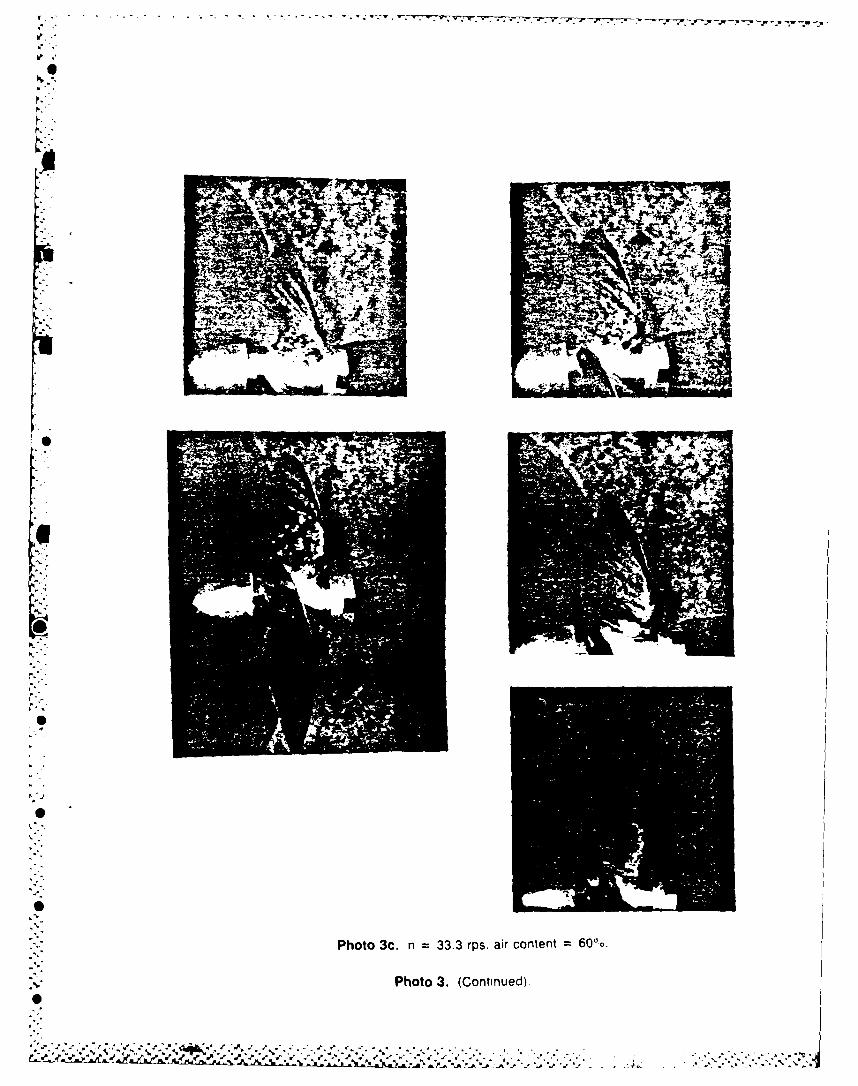
Pht 3. (Continued)
0t
It4,

*~~- 777 V q '
0
oir0ht 8 0rsarcnet 4%
PhtU.Cvtto atrsa et odto ,K .4ad(n 10
0%

- * -
.1.7-
A
Av~
Photo 4b. n 27 rps, air content =40%.
Photo 4. (Continued)
% Nr ,% 4'
- p . r - rr
I
IPA
- S
I
C
r
F -
p..
Photo 4d. n = 27 rps. air content = 600o
Photo 4. (Continued)
- - ' -. - - - .......... A ~ . -

WaW
%
..
Photo 5a. n =20 rps, air content =400,.
Photo 5. Cavitation patterns at test condition 3, KT 03anGn 23

-. ~~~~~~ am. T.. ~-~P~\ *N WW-- -~ V W ~ W~I 7 WT . 9jwJ' %- T" 9.'
%: %
~W W ~U ~ ~. * ~. * 1W~'~7~ 1 'W77 (V~W~V~T . . -
0
0
p
S
0
LiPhoto Sc. n = 27 rps, air content = 60%.
Photo 5. (Continued).
S

W. 1k. V. ..- - -"
I
REFERENCES
1. Acosta, A.J. and B.R. Parkin, *Cavitation Inception - A Selective Review,"
Journal of Ship Research, Vol. 19, No. 4, pp. 193-205 (1975).
2. Huang, T.T. and F.B. Peterson, "Influence of Visocus Effects on Model Full-Scale
Cavitation Scaling," Journal of Ship Research, Vol. 20, No. 4, pp. 215-223
(1976).
3. Huang, T.T. and Y.T. Shen, "Application of Turbulence Stinulator to Reduce Scale
Effect on Cavitation Inception," Proceedings of the International Symposium on
Propeller and Cavitation, Wuxi, China (1986).
4. Kuiper, G., "Effects of Artificial Roughness on Sheet Cavitation," IMECH,
pp. 151-166 (1983).
5. Ishii, N., H. Yagi, and H. Yuasa, "Model Testing of Propeller Cavitation by
Roughening the Leading Edge of Blades," Journal of the Society of Naval
Architects of Japan, Vol. 153, pp. 106-116 (1983).
6. Kuiper, G. "Recormended Test Conditions for ITTC Propeller with Leading Edge
Roughness," NSMB Report No. 50618-1-RD (1986).
" 7. Boswell, R.J., "Design, Cavitation Performance, and Open-Water Performance of a
Series of Research Skewed Propellers," DTNSRDC Report 3339 (1971).
8. Ye, Y.P. and T.K. Wang, "Cavitation Tests with the 18th ITC Propeller Model
No. 1 with Leading Edge Roughness," CSSRC Report 87004, Wuxi, China (1987).I
" 9. Friesch, J., "Untersuchungen zum Einfluss von Aufrauhungen und der Propeller-
kante auf die Kavitationserscheinungen," HSVA-Bericht 1549/86, Hamburg,Germany
(1986).
10. Shen, Y.T., "Wing Sections for Hydrofoils - Part 3: Experimental Verifications,"
Journal of Ship Research, Vol. 29, pp. 39-50 (1985).
-.
I,
2 v V - ~**.
0
1i. Kerneen, R.W., "Water Tunnel Tests of NACA 4412 and Walchner Profile 7 Hydro-
foils in Noncavitating and Cavitating Flows," CIT Hydrodynamics Laboratory
Rexrt 47-5 (1956).
12. Katz, J., "Cavitation Phencaena Within Regions of Flow Separation," Journal of
Fluid Mechanics, Vol. 140, pp. 397-436 j1981).
13. Parkin, B., "The Onset of Bubble-Ring Cavitation on Hemispherical Headforms,"A,.
Journal of Fluids Engineering: ASME Vol. 104, pp. 115-122 (1982).-lt-
V:...
0
-t

I ..
1. DTNSRDC reports, a formal series, contain information of permanent technicalvalue They carry a consecutive numerical identification regardless of their classificationor the originating department.0
2 Departmental reports, a semiformal series, contain information of a preliminary,temporary, or proprietary nature or of limited interest or significance. They carry adepartmental alphanumerical identification.
3. Technical memoranda, an Informal series, contain technical documentation oflimited use and interest. They are primarily working papers intended for internal use.They carry an identifying number which indicates their type and the numerical code ofthe originating department. Any distribution outside DTNSRDC must be approved bythe head of the originating department on a case-by-case basis.
NOW DINSADC W02, 4fe, 4 861
N~~~~ N * .NyN M.A%
% .J
% r
J.,
-b-
S 0S SS. S .
NV