research and development tax credits statistics - gov.uk · pdf file6 section 2: statistics...
TRANSCRIPT

Coverage: United Kingdom Theme: The Economy Released: 11 September 2015 Next Release: August 2016 Frequency of release: Annual Media contact: HMRC Press Office (Business) 03000 585028 Out-of-hours: 07860 359544 Statistical contacts: Vivienne Opoku [email protected] Neil Wilson [email protected] KAI Direct Business Taxes Room 2/43 HM Revenue and Customs 100 Parliament Street London SW1A 2BQ Website: https://www.gov.uk/government/collections/corporate-tax-research-and-development-tax-credits
Research and Development Tax Credits Statistics
September 2015

Contents
Section 1: Introduction 3
About these statistics 3 What are Research and Development (R&D) tax credits? 3 What do the tables contain? 5
Section 2: Statistics and Commentary 6
2.1 Key points 6 2.2 Number of claims 7 2.3 Companies with more than one claim in a year 7 2.4 Type of relief claimed 8 2.5 Amount of relief claimed 8 2.6 R&D expenditure 9 2.7 Combination claims 10 2.8 SMEs claiming as sub-contractors 10 2.9 Vaccines Research Relief 10 2.10 Registered office location 11 2.11 Industry sector analysis 12
Section 3: Background Information 13
Data sources 13 Methodology 14 Limitations and reliability of the estimates 14 Rounding and totals 15 Financial years, accounting periods and receipt of tax 16 Revisions to previously published tables 16 Tables RD4 to RD6 16 Who might be interested? 18
User engagement 18 Other statistics on R&D in the United Kingdom 18
National Statistics 18 Contact points 19 Annex A: Statistical reference tables – RD1 to RD6 20

3
Section 1: Introduction
About these statistics
This publication includes details of the numbers of companies claiming R&D tax credits and the cost to the Exchequer of providing that support. The statistics are compiled using claims made for tax credits which are reported on the Company Tax return form CT600. The CT600 form shows the enhanced amount of R&D expenditure and the amount of any R&D payable tax credit. Companies also state under which scheme they are claiming for the SME and large company schemes. The figures are for 2000-01 to 2013-14 and are based on returns received on or before 30 June 2015. The filing deadline for CT returns is one year from the end of the accounting period. The latest possible filing deadline for accounting periods ending in 2013-14 was 31 March 2015, and the extra 3 months allows for the processing of returns and the inclusion of those filed late. The number of claims made is higher than the number of companies who made claims. This is because a company can make more than one claim in the same year, either because they claim under different schemes or because they have more than one accounting period ending in the year. What are Research and Development (R&D) tax credits?
R&D tax credits are a tax relief designed to encourage greater R&D spending, leading in turn to greater investment in innovation. They work by reducing a company's tax bill by an amount equal to a percentage of the company’s allowable R&D expenditure. A company can only claim R&D tax credits if it is liable for Corporation Tax. There are three schemes for claiming relief:
The Small or Medium-sized Enterprise (SME) Scheme; The Large Company Scheme; and Research and Development Expenditure Credits.
The Research and Development Expenditure Credit (RDEC) scheme (also known as ‘Above-the-Line’) was introduced in April 2013 for large companies. Companies can choose the new RDEC scheme or the Large Company scheme until April 2016, after which the Large Company scheme will no longer be available. A company with no tax liability that claims the expenditure credit may now claim a cash payment. The new RDEC is included in these statistics for the first time. At Budget 2014 it was announced that the rate of R&D payable credit available to loss-making SMEs conducting R&D activities will be increased from 11% to 14.5% from 1st April 2014. This increases the rate of the cash credit payable to SMEs that conduct qualifying R&D activity but do not have corporation tax liabilities. This change will not be reflected in these statistics.

4
Under the normal EU definition, a SME is a company or organisation with fewer than 250 employees and either of the following:
an annual turnover not exceeding €50 million; and a balance sheet not exceeding €43 million.
This definition was used in deciding eligibility for R&D tax credits until 1 August 2008. Since then, a wider definition of SME has been used – but only in the context of R&D tax credits. This new definition, still in force, states: “A SME is a company or organisation with fewer than 500 employees and either of the following:
an annual turnover not exceeding €100 million; and a balance sheet not exceeding €86 million.
However, a company may not be considered to be a SME if it is part of a larger enterprise that, taken as a whole, would fail these tests. A SME may claim a higher rate of relief than a large company. Also, a SME which has no tax bill to reduce may claim a cash payment instead. R&D tax credits were introduced for SMEs in 2000 and extended to large companies from 2002. An additional “top-up” relief for vaccines research was introduced in 2003 – known as Vaccines Research Relief - VRR1. Both corporation tax and R&D tax credit rates have changed over the years. For information about current and historical rates of deduction and payable credits, and who can claim them (including sub-contractors), please see http://www.hmrc.gov.uk/ct/forms-rates/claims/randd.htm.
1 VRR for SMEs has been removed for expenditure incurred on or after 1 April 2012, but is still available to large companies.

5
What do the tables contain?
Table RD1 shows how many R&D tax credit claims have been made under each scheme since 2000. Tables RD2 and RD3 show the cost to the Exchequer (on an accounting period basis and on a receipts basis, respectively – see explanation in the Financial years section below) of meeting the claims shown in table RD1. Table RD4 shows how much qualifying R&D expenditure has been used to make the R&D tax credit claims shown in table RD1. Table RD5 provides a registered office regional analysis of R&D tax credit claims for 2013-14. Table RD6 provides an industry sector analysis of R&D tax credit claims for 2013-14.

6
Section 2: Statistics and Commentary
2.1 Key Points
Since the R&D tax credit schemes were launched in 2000-01 up until 2013-14, almost 120,000 claims had been made and more than £11.4 billion in tax relief claimed.
By the end of 2013-14, more than 33,800 different companies had made claims under the SME (Small and Medium Enterprise) scheme since it began in 2000-01, and over 7,800 under the large company scheme, which launched in 2002-03.
The total number of claims rose to 20,100 for the accounting period ending in 2013-14. The increase was primarily driven by an increase in the number of SME claims (up 23%). This is distinct from the number of returns (18,720) as a return can include more than one claim, e.g. where there is a claim for both the large company scheme and Vaccine Research Relief.
The total amount of R&D support claimed rose to £1.75bn – an increase of £380m from the previous year. The cost of support for the SME scheme rose by £200m from £600m to £800m. The cost of the large company scheme was lower at £380m, reflecting the introduction of the new RDEC scheme; the cost of the RDEC scheme was £580m.
The total R&D expenditure against which claims were made amounted to £14.3bn in 2013-14, an increase of 7% from the previous year.
R&D claims and the amount claimed are mainly concentrated among companies with a registered office in London, the South East or the East of England (46% of all claims and 64% of the total amount claimed). However, the regional split is based on the registered office location, which may not be where all of the R&D activity took place.
The ‘Manufacturing’, ‘Professional, Scientific and Technical’, and ‘Information and Communication’ sectors continued to have the greatest volume of claims, making up a total of 76% of claims and 81% of the total amount claimed for 2013-14). However, these figures should be treated with caution as the industry classifications used are company classifications and may not reflect the industry in which the R&D activity itself is carried out.
7
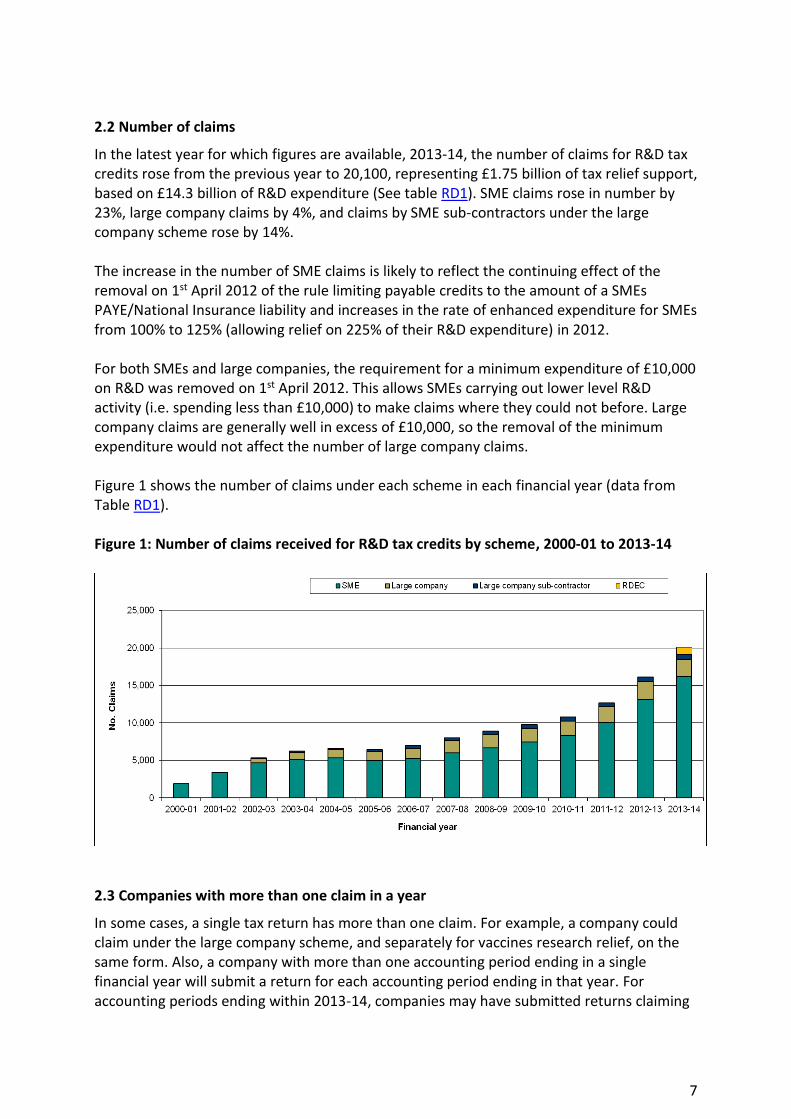
2.2 Number of claims
In the latest year for which figures are available, 2013-14, the number of claims for R&D tax credits rose from the previous year to 20,100, representing £1.75 billion of tax relief support, based on £14.3 billion of R&D expenditure (See table RD1). SME claims rose in number by 23%, large company claims by 4%, and claims by SME sub-contractors under the large company scheme rose by 14%. The increase in the number of SME claims is likely to reflect the continuing effect of the removal on 1st April 2012 of the rule limiting payable credits to the amount of a SMEs PAYE/National Insurance liability and increases in the rate of enhanced expenditure for SMEs from 100% to 125% (allowing relief on 225% of their R&D expenditure) in 2012. For both SMEs and large companies, the requirement for a minimum expenditure of £10,000 on R&D was removed on 1st April 2012. This allows SMEs carrying out lower level R&D activity (i.e. spending less than £10,000) to make claims where they could not before. Large company claims are generally well in excess of £10,000, so the removal of the minimum expenditure would not affect the number of large company claims. Figure 1 shows the number of claims under each scheme in each financial year (data from Table RD1). Figure 1: Number of claims received for R&D tax credits by scheme, 2000-01 to 2013-14
2.3 Companies with more than one claim in a year
In some cases, a single tax return has more than one claim. For example, a company could claim under the large company scheme, and separately for vaccines research relief, on the same form. Also, a company with more than one accounting period ending in a single financial year will submit a return for each accounting period ending in that year. For accounting periods ending within 2013-14, companies may have submitted returns claiming

8
under both the large company and RDEC schemes; the latter not being available until 1st April 2013. For 2013-14, a total of 18,160 companies made 20,100 relief claims (see table RD1. The claims figures in RD1 do not sum to the number of returns with a claim. A key factor in this is that some returns included a claim for both RDEC and the large company scheme.). The increase in the number of claims in 2013-14 was primarily driven by an increase in the number of claims by SME companies: there was a 23% increase in SME scheme claims between 2012-13 and 2013-14.
2.4 Type of relief claimed
The most common way for SMEs to claim R&D tax credits was by deduction from CT liability, with 10,470 claims for this in 2013-14, compared to 2,810 claims for a payable credit (used by loss-making companies which have no CT liability against which to set the deduction). From 2008-09 the relief rate for deduction claims increased by 50%, and the figures in tables RD1 and RD2 reflect this, showing a significant increase in the number and cost of deduction claims compared with payable credit claims.
2.5 Amount of relief claimed
Although the numbers claiming under the SME scheme are much larger than those claiming under the large company and RDEC schemes, most of the relief claimed has been by large companies. This is because the amounts they claim are generally much larger than those claimed by SMEs. The amounts claimed are shown in Figure 2 (data from table RD2). The cost of support has increased substantially each year except for 2009-10. The increase in the rate of enhanced expenditure for SMEs from 100% to 125% in 2012-13 and then to 130% in 2013-14 is a factor in the increase in the support claimed by SMEs. £1.75 billion of support was claimed for 2013-14 (£800m under the SME scheme, £370m under the large company scheme, and £580m under the RDEC scheme). This represents an increase from 2012-13 of 27%.

9
Figure 2: Total support claimed through R&D tax credits by scheme, 2000-01 to 2013-14 (£m, accounting period end date basis)
2.6 R&D expenditure
Figure 3 (data from table RD4) shows the total qualifying expenditure on R&D which has been used to claim R&D tax credits. This does not represent all expenditure on R&D in the UK, just that which qualifies for R&D tax credits and has been used to make a claim. Figure 3: Total R&D expenditure used to claim R&D tax credits by scheme, 2000-01 to 2013-14 (£m, accounting period end date basis)

10
The total R&D expenditure used to claim R&D tax credits amounted to £14.3bn in 2013-14, an increase of 7% from the previous year. R&D expenditure by companies claiming under the SME scheme rose by £720m between 2012-13 and 2013-14. For companies claiming under the large company scheme, expenditure fell by £5bn; however, this is due to the start of the RDEC scheme which accounted for £5.3bn in expenditure in 2013-14. The largest amount of expenditure was related to claims under the large company scheme at £5.4bn.
2.7 “Combination” claims
In some cases, a SME can first use its R&D tax credit to reduce its tax bill to zero, and then take the rest as a cash payment. In other cases, a SME with no tax bill might choose to take some or none of its R&D tax credit as cash, with the remainder being carried forward. All such cases are referred to as “combination claims”. In 2013-14, £950m of expenditure was used to make combination claims, while just over £1.4bn of R&D expenditure was used to claim pure deductions from CT liability, and over £1bn used for payable credits.
2.8 SMEs claiming as sub-contractors under the large company scheme
SMEs working for large companies as sub-contractors must claim under the large company or RDEC scheme. The number of these cases rose steadily from 2002-03 to 2010-11, from 60 to 530. There was a slight drop in 2011-12 to 510, but the numbers rose to 580 in 2012-13 and then 660 in 2013-14. The removal of the £10,000 minimum claim requirement in 2012-13 will have allowed more SME sub-contractors to make claims where they could not before. Due to the way that the data is recorded, it is not currently possible to distinguish between SMEs claiming as sub-contractors under the large company scheme and those claiming under the RDEC scheme. Large companies themselves account for almost all of the support claimed under the large company scheme. The level of support for SME sub-contractors has remained steady at £10m (See table RD2). In 2013-14 this represented around just 1% of support claimed under the large company and RDEC schemes combined.
2.9 Vaccines Research Relief (VRR)
VRR allows companies to deduct a further 40% of qualifying expenditure on R&D into certain vaccines and medicines when calculating their profit for tax purposes. This is on top of the already enhanced deduction. Previously, loss-making SMEs could surrender enhanced VRR deductions for a cash payment, just as with the SME R&D tax credit. However, VRR for SMEs was reduced to 20% of qualifying expenditure from 1st April 2011 and was then removed for expenditure incurred on or after 1st April 2012. Large companies claiming VRR can only use the deduction option; they cannot claim payable credits for VRR, just as they cannot under the main R&D scheme. The number of claims under the VRR scheme has remained at about 10 a year since its introduction in 2003-04 (See table RD1) though has fallen to less than 10 in 2013-14. This represents a very small cost to the Exchequer, with support claimed less than £5m each year (not shown in Figure 2, due to its small size).

11
Expenditure used to claim under the VRR scheme (data from table RD4) rose from approximately £10m in 2003-04, when the scheme was introduced, to £30m in 2011-12, with a subsequent fall to £20m in 2012-13 and 2013-14.
2.10 Registered office location
Table RD5 shows the distribution of R&D tax credit claims by government office region of the company’s registered address. The numbers and amounts are for 2013-14, and are shown in Figure 4 below (data from Table RD5). The figures continue to show a concentration of companies with registered offices in London (17% of all claims and 31% of total claimed), the South East (19% of claims and 21% of total claimed) and the East of England (10% of all claims and 12% of total claimed). Table RD5 should be interpreted with caution because this table is based on registered office location, which may not be where the actual R&D activity is carried out– see section on tables RD4–RD6 in the Background Information chapter below. Figure 4: Registered office regional analysis of R&D tax credit claims, 2013-14

12
2.11 Industry sector analysis
Table RD6 shows the distribution of R&D tax credit claims by industry sector for 2013-14. The figures show a concentration of claims in the ‘Manufacturing’ (31%), ‘Professional, Scientific and Technical’ (19%) and ‘Information and Communication’ (26%) sectors, accounting for 37%, 24% and 20% of the total amount claimed respectively. The coding of industry sectors does not always reliably describe the sector of companies’ R&D activity for a variety of reasons – as described in the Tables RD4-RD6 part of the Background information section below. Caution should therefore be exercised in interpreting this chart.
Section 3: Background Information
Data sources
The main administrative data used to compile National Statistics on R&D tax credits are derived from information provided by companies on the Company Tax return (CT600), with any modifications or additions made in subsequent assessments. The data cover all CT returns received by HMRC and records are available for all SME and large company claims made in those returns. The CT return collects information on the enhanced level of R&D expenditure and the amount of any R&D payable tax credit. Companies also specify whether they are claiming under the SME or large company scheme, and declare the expenditure they are claiming under the SME sub-contractor or vaccines research relief scheme, if applicable. The figures also include cases in which the SME or large company claim box was ticked in the CT return but the associated expenditure was only recorded later as part of the CT assessment process. The CT600 form contains a step-by-step record of the company’s corporation tax calculations, starting with its income and chargeable gains, and taking into account any relevant deductions and reliefs. Initial checks carried out on the data include:
Correction of calculation errors in the tax return;
Automated checks which take place when loading data into the analysis database. Inconsistencies are automatically ‘repaired’ if possible; otherwise the record is flagged as invalid.
Once the claims data have been extracted from the analysis database:
Outliers are identified and their veracity checked – records are then removed or corrected appropriately;
Any large changes in figures from one statistical release to the next are investigated.
Tables RD1 to RD4 relate to claims made in CT returns for the SME, large company R&D tax credit, RDEC schemes, and vaccines research relief. The figures cover the period 2000-01 to 2013-14 and are based on CT returns received on or before 30 June 2015. Because a company can sometimes claim under more than one scheme in any one accounting period, and can have more than one accounting period ending during any one financial year, the number of companies making claims in any one year is less than the number of claims in that year. Table RD1 provides the number of companies claiming R&D tax credits by financial year, and the number of tax returns in which they make those claims.

14
Postcode and industry sector data for companies claiming R&D tax credits are obtained from Companies House via FAME (Financial Analysis Made Easy) under licence from Bureau Van Dijk Electronic Publishing and also from the Office for National Statistics’ (ONS) Inter-Departmental Business Register (IDBR) survey. These data extracts are combined with CT return data to produce Tables RD5 and RD6. Because all the necessary data for the R&D Tax Credits National Statistics are obtained from administrative data sources, there is no additional burden on companies or HMRC tax inspectors to provide information.
Methodology
The R&D tax credit tables include every case captured via a CT600 form. As no sampling is necessary, sampling error is not an issue. Each claim is classified (e.g. as a SME payable credit, or Large company sub-contractor, etc.) based on the information provided on the CT600 form and its associated R&D expenditure and tax cost calculated. The numbers, costs and expenditure are then aggregated to produce Tables RD1, RD2 and RD4. Table RD3 is produced by applying standard conversion factors to the figures in Table RD2.
Limitations and reliability of the estimates
Although the data are the best available at the time, claims for R&D tax credits can be made up to 2 years after the end of an accounting period (i.e. amendments can be made to returns already submitted within this time period), so some claims may be received after the statistics are released. Figures for earlier years may therefore have changed since a previous release.
The statistics are produced based on information provided to HMRC on the CT600 and related forms. The figures represent the initial claims made prior to any compliance checks being carried out and are known to exclude a small number of large company claims that come in a non-standard format.
This release provides information on research and development activities for which R&D tax credits have been claimed. Not all expenditure on R&D in the UK is used to claim the tax credit, so these statistics are not a comprehensive account of all R&D activity in the UK.
The RDEC tax credit scheme was introduced in 2013-14. Large companies claiming RDEC can be clearly identified in the CT600 tax return data. Small companies claiming a tax credit may have claimed under RDEC as sub-contractors or through the SME scheme. To distinguish these, information is additionally needed that is provided in the supplementary information to the claims. It has therefore been necessary to make certain assumptions in compiling the figure for SME subcontractors for 2013-14. However, sub-contractors have historically accounted for only a very small proportion of the support claimed under the large company scheme and this fact has been used in compiling the latest figures.
15
A new version of the CT600 form has been introduced for accounting periods starting on or after 1 April 2015 that will enable improvements to the figures for this sub-category. Tables RD5 and RD6 should be interpreted with caution. Table RD5 looks at the regional split of R&D claims. However, this is based on registered office location, which may not be where the actual R&D activity is carried out. Table RD6 provides the industry breakdown of R&D activity. However, this may not reflect the industry in which the R&D activity itself is carried out. For more info, see the note on tables RD4 to RD6 below.
All figures should therefore be considered provisional, although any revisions are more likely to affect the later years. Sources of error in the published statistics include:
Although the data are broadly complete, as explained above, there are a small number of returns received after the 30th June which add to the existing data and can therefore result in minor revisions to previously published figures. Accordingly, the results for all years should be considered as provisional, although any such revisions are more likely to impact on the later years;
Data capture errors: companies may make errors entering their information onto the CT600 Company Tax Return form, whether this is done on paper or electronically. The data are subsequently entered onto the COTAX system either manually or by electronic transmission. This is another point at which data may be altered due to human error or software errors. There is a risk that errors involving very large profits or tax amounts may distort the overall statistics. To mitigate this, checks are carried out and any incorrect large values which are detected are altered in the analysis database before the statistics are produced;
A small number of companies submit claims in a non-standard format and are therefore not included in these statistics; and
Data on company location and industry sector are not necessarily reliable indicators of the R&D being carried out - see explanation of tables RD4 to RD6 below.
Rounding and totals
The figures have been independently rounded, e.g. to the nearest 10 or £10 million for tables RD1 to RD4. This can lead to components not summing to the totals shown. Also, for table RD1, the total claims provided for individual schemes do not sum to the total returns for all R&D schemes shown in that table. This is because: some sub-contractor and vaccine research relief claims are included on the same return as existing SME or large company claims; and, due to the accounting periods (explained further below) claims may be made for the large company and RDEC schemes on the same return.

16
Financial years, accounting periods and receipt of tax
Despite appearances, tables RD2 and RD3 present slightly different costs. Table RD2 shows costs falling on the Exchequer according to when the company incurred the R&D expenditure, whereas table RD3 shows estimates of the costs according to when tax would have been received, or the payment was made, by HMRC. The financial year in table RD2 is therefore defined by the date at which the company’s accounting period ends. For example, if the end date of the accounting period is 31st January 2006, the claim is said to be for financial year 2005-06 (which ended on 31st March 2006). However, in table RD3, the financial year indicates when the cost was incurred by HMRC. So, in the same example, if the claim was paid on 27th April 2006, then that cost will fall in financial year 2006-07.
Revisions to previously published tables
Companies’ corporation tax assessments are subject to revision, and although the majority of assessments are finalised within two years, there are exceptional cases which can take much longer. There is thus no specific point at which the R&D tax credit claims for a particular year can be considered complete or final. In practice, the statistics are refreshed each year for all years since the start of the scheme, particularly to accommodate late submission of the company’s tax return, and to replace any provisional figures in the previous release of the statistics. The cut-off date for receipt of returns has been set to minimize omissions and amendments, resulting in very little change to the published tables. Revisions to the published figures are not routinely made until the following year’s release. Typically the only revisions are to the most recent year’s figures, reflecting returns received after the cut-off date.
Tables RD4 to RD6
Tables RD4 to RD6 were published for the first time in 2012 in response to user requests and on the recommendation of the United Kingdom Statistics Authority (UKSA). Table RD4 reports the amount of R&D expenditure that gives rise to the tax relief claims, which for some users is a more relevant business measure than the tax cost. Table RD5 analyses claims for 2013-14 by the government office region (GOR) of the registered address of the companies making the claims. A company may operate at different locations throughout the UK but its tax return will be made on behalf of the whole company and linked to its registered office address. A geographical breakdown will therefore show all the company’s expenditure and tax liability as originating at the location of the registered office, which may not reflect the location of the company’s actual R&D activities. Since the publication of the 2010-11 statistics, a regional breakdown of registered office addresses has been provided in Table RD5, subject to the above important caution. Table RD5 is classified as official statistics rather than as National Statistics. Similarly, Table RD6 analyses claims by industry sector based on the SIC classification of the companies. The classification is based on the UK Standard Industrial Classification 2007

17
standard; prior to the 2014 set of statistics it was based on SIC20032. Companies have been assigned to a SIC 2007 sector based on information from the ONS’s Inter-Departmental Business Register (IDBR) survey where there was a unique match, or otherwise from information provided by companies to Companies House. However, this classification can be misleading for several reasons. It might simply be wrong - the company has changed its primary business since first registration; or, although its primary business is correct (eg telecommunications), the company’s current research is in a different sector (eg materials science). In the case of companies within a group, the industry sector might be recorded as that of its holding company, and appear under “activities of holding companies” within the Business Services sector. It is for these reasons that analyses by industry sector were not routinely published in the past. Since the publication of the 2010-11 statistics, an industry sector analysis of claims has been provided in Table RD6, subject to the above important caution. Table RD6 is classified as official statistics rather than as National Statistics
2 Please see the link below to the Office for National Statistics (ONS) which provides further information on
SIC2007 including the correlation between SIC2003 and SIC2007:
http://www.ons.gov.uk/ons/guide-method/classifications/current-standard-classifications/standard-industrial-
classification/index.html

18
Who might be interested?
These statistics may be of interest to anyone seeking the latest data about the uptake of R&D tax credits, their cost, and the nature of the companies claiming them. They may also be of interest to organisations such as think-tanks, universities and other similar institutions, e.g. for comparing the relative effects of similar incentives operating in other countries. Such organisations might also be interested in an evaluation of R&D tax credits published on the HMRC web site at: http://www.hmrc.gov.uk/research/report107.pdf.
User engagement
We are committed to improving the official statistics we publish. We want to encourage and promote user engagement, so we can improve our statistical outputs. We would welcome any views you have. We will use this information to influence the development of our official statistics. We will summarise and publish user comments at regular intervals. If you have ideas for improvements, or comments on changes made this year, or any other suggestions relating to this release, please let us know by visiting: https://www.gov.uk/government/organisations/hm-revenue-customs/about/statistics#contact-us Other statistics on R&D in the United Kingdom These statistics comprise information on research and development activities for which R&D tax credits have been claimed. Not all expenditure on R&D in the UK is used to claim the tax credit, so these statistics are not a comprehensive account of all R&D activity in the UK. The Office for National Statistics (ONS) publishes several additional National Statistics on R&D in the UK, including the Business Enterprise Research and Development (BERD) survey and Gross Domestic Expenditure on Research and Development. Additionally, the Scottish Government and the Northern Ireland Statistics and Research Agency publish National Statistics on R&D activity in Scotland and Northern Ireland, including the Business Enterprise Research and Development, Scotland, Gross Expenditure on Research and Development Scotland, and the Research & Development Survey (Northern Ireland). For access to these and other related publications on R&D activity in the UK, please visit: https://www.gov.uk/government/statistics/announcements
National Statistics
National Statistics are produced to high professional standards set out in the Code of Practice for Official Statistics. They undergo regular quality assurance reviews to ensure that they meet customer needs. They are produced free from any political interference. For general enquiries about National Statistics contact the National Statistics Public Enquiry Service.

19
Telephone: 0845 601 3034 Overseas: +44 (1633) 653 599 Minicom: 01633 812399 Email: [email protected] Fax: 01633 652747 Letters: Customer Contact Centre, Room 1.015, Cardiff Road, Newport, NP10 8XG You can also find National Statistics on the internet at: www.statistics.gov.uk Contact points Enquiries about these statistics should be directed to the statisticians responsible for these statistics: Vivienne Opoku/Neil Wilson KAI Direct Business Taxes HM Revenue & Customs Room 2/43 100 Parliament Street London SW1A 2BQ Telephone: 03000 589 093/03000 574 402 E-mail: [email protected] or [email protected] Media enquiries should be directed to the HMRC Press Office contacts listed on the front page of this release.

20
RD1 Claims for the R&D tax credit by scheme and financial year, 2000-01 to 2013-14 1 2 3 4 5
Numbers: Actual
Deductions
from CT
liability
Payable
credits
Combination TOTAL Large
company
R&D scheme
RDEC
scheme
SME sub-
contractors
TOTAL returns companies
2000-01 990 630 240 1,860 1,860 1,780
2001-02 1,650 1,130 630 3,410 3,410 3,270
2002-03 2,370 1,380 880 4,640 630 60 690 5,300 5,110
2003-04 2,940 1,290 940 5,160 920 120 1,050 10 6,130 5,950
2004-05 3,120 1,280 920 5,310 1,090 220 1,310 10 6,490 6,310
2005-06 2,960 1,100 900 4,960 1,200 290 1,490 10 6,290 6,120
2006-07 3,230 1,060 990 5,270 1,320 350 1,670 10 6,760 6,560
2007-08 3,760 1,090 1,130 5,990 1,640 400 2,030 10 7,810 7,570
2008-09 4,180 570 1,910 6,670 1,810 440 2,260 10 8,670 8,470
2009-10 4,820 880 1,770 7,470 1,830 490 2,320 10 9,500 9,250
2010-11 5,460 800 2,020 8,280 1,960 530 2,490 10 10,440 10,200
2011-12 6,770 800 2,460 10,030 2,150 510 2,660 10 12,340 12,050
2012-13 8,810 1,240 3,100 13,140 2,380 580 2,960 10 15,700 15,280
2013-14 10,470 2,810 2,880 16,160 2,350 940 660 3,950 <10 18,720 18,160
1. Estimates of the number of claims are rounded to the nearest ten. Totals may not sum due to rounding. Totals for all R&D schemes may not sum to the
totals of individual schemes, as some SME subcontractor and vaccines research relief claims are included with existing SME, RDEC or large company claims.
These claims have been removed from the total to avoid double counting.
2. The number of claims is based on the date that the accounting period covered by the claim ends. Table RD1 is comparable with cost data in Table RD2
where costs are apportioned on the same accounting period basis.
5. The Research and Development Expenditure scheme was introduced on 1 April 2013.
3. The figures are based on claims for R&D tax credits made by companies in Company Tax returns received on or before 30 June 2015.
4. Statistics in this table are consistent with HMRC’s policies on dominance and disclosure.
SME R&D scheme Schemes for large companies Vaccines
research
relief
All R&D schemes

21
RD2 Cost of support claimed for the R&D tax credit by scheme and financial year on an accounting period basis, 2000-01 to 2013-14 1 2 3 4 5
£ million
Deductions
from CT
liability
Payable
credits
TOTAL Large
company
R&D scheme
RDEC
scheme
SME sub-
contractors
TOTAL
2000-01 10 60 70 70
2001-02 20 150 170 170
2002-03 30 180 210 200 * 200 410
2003-04 40 150 190 340 * 340 * 540
2004-05 50 140 190 390 * 400 * 590
2005-06 40 140 180 450 10 460 * 640
2006-07 50 150 200 480 10 490 * 690
2007-08 60 180 240 550 10 560 * 810
2008-09 80 190 270 730 10 740 * 1,000
2009-10 130 190 320 670 10 690 * 1,010
2010-11 160 190 350 750 10 760 * 1,110
2011-12 210 220 430 780 10 790 * 1,220
2012-13 320 290 600 760 10 770 * 1,370
2013-14 380 420 800 370 580 10 960 * 1,750
1. Estimates of the cost of support claimed are rounded to the nearest £10m. Totals may not sum due to rounding.
2. Tables RD2 and RD3 are not directly comparable due to the time basis on which they are calculated. The accounting period basis in Table RD2
apportions costs to financial years based on the accounting period end-date of the R&D tax claim. The receipts basis in Table RD3 apportions costs
based on when HM Revenue & Customs is estimated to incur the cost arising from R&D tax credits. Where claims are for a combination of deductions
from Corporation Tax liability and the payable credit, the cost of the claim has been split into the two separate components. Table RD2 is comparable
with Table RD1 where the number of claims is also presented on an accounting period basis.
4. Statistics in this table are consistent with HMRC’s policies on dominance and disclosure.
5. The Research and Development Expenditure scheme was introduced on 1 April 2013.
* Negligible amount (less than £5m)
Schemes for large companies
3. The figures are based on claims for R&D tax credits made by companies in Company Tax returns received on or before 30 June 2015. They exclude a small number
SME R&D scheme Vaccines
research relief
All R&D schemes

22
RD3 Cost of support claimed for the R&D tax credit by scheme and financial year on a receipts basis, 2000-01 to 2013-14 1 2 3 4 5
£ million
Deductions
from CT
liability
Payable
credits
TOTAL Large
company R&D
scheme
RDEC
scheme
SME sub-
contractors
TOTAL
2000-01 * 20 20 20
2001-02 10 90 100 100
2002-03 30 160 180 180 * 190 370
2003-04 30 170 200 330 * 330 * 540
2004-05 40 150 190 390 * 390 * 590
2005-06 50 140 190 440 * 450 * 640
2006-07 40 150 190 480 10 490 * 680
2007-08 60 160 220 550 10 560 * 770
2008-09 70 180 250 720 10 720 * 980
2009-10 100 190 290 670 10 690 * 970
2010-11 140 190 330 740 10 760 * 1,090
2011-12 180 200 380 770 10 780 * 1,160
2012-13 230 230 460 770 10 770 * 1,230
2013-14 330 310 640 400 540 10 950 * 1,590
1. Estimates of the cost of support claimed are rounded to the nearest £10m. Totals may not sum due to rounding.
2. Tables RD2 and RD3 are not directly comparable due to the time basis on which they are calculated. The accounting period basis in Table RD2 apportions
costs to financial years based on the accounting period end date of the R&D tax claim. The receipts basis in Table RD3 apportions costs based on when HM
Revenue & Customs is estimated to incur the cost arising from R&D tax credits. Where claims are for a combination of deductions from Corporation Tax
liability and the payable credit, the cost of the claim has been split into the two separate components.
4. Statistics in this table are consistent with HMRC’s policies on dominance and disclosure.
5. The Research and Development Expenditure scheme was introduced on 1 April 2013.
* Negligible amount (less than £5m)
number of large company claims made alongside the returns totalling around £20 million a year.
3. The figures are based on claims for the R&D tax credits made by companies in Company Tax returns received on or before 30 June 2015. They exclude a small
SME R&D scheme All R&D schemesVaccines
research
relief
Schemes for large companies

23
RD4 R&D expenditure used to claim R&D tax credits by scheme and finance year, 2000-01 to 2013-14 1 2 3 4
£ million
SME R&D scheme Vaccines Research
Large company R&D
scheme
RDEC scheme SME sub-
contractors
Relief
2000-01 360 360
2001-02 890 890
2002-03 1,140 2,620 30 * 3,780
2003-04 1,130 4,520 40 10 5,700
2004-05 1,150 5,250 60 20 6,470
2005-06 1,090 5,960 170 10 7,240
2006-07 1,280 6,390 180 20 7,870
2007-08 1,530 7,350 150 20 9,050
2008-09 1,700 9,100 170 20 10,990
2009-10 1,740 7,990 230 20 9,980
2010-11 1,960 8,910 170 20 11,070
2011-12 2,260 9,580 180 30 12,050
2012-13 2,670 10,490 180 20 13,360
2013-14 3,390 5,420 5,330 140 20 14,300
1. Estimates of the expenditure used to claim tax credtis are rounded to the nearest £10m.
3. Statistics in this table are consistent with HMRC’s policies on dominance and disclosure.
4. The Research and Development Expenditure scheme was introduced on 1 April 2013.
* Negligible amount (less than £5m)
All R&D schemesSchemes for large companies
2. Totals may not sum due to rounding.

24
RD5
Government Office Region
Number of
claims
Amount
claimed
Number of
claims
Amount
claimed
Number of
claims,
All
Amount claimed,
Large company
R&D scheme
Amount
claimed,
RDEC
Number of
claims
Amount
claimed
Number of
claims
Amount
claimed
Number of
claims
Amount
claimed
North East 605 25 35 0 25 0 5 0 5 15 0 675 40
North West 1,650 60 110 5 85 5 20 5 15 55 0 1,905 105
Yorkshire and The Humber 1,145 40 75 5 55 5 10 0 0 40 0 1,315 55
East Midlands 1,025 40 60 20 60 0 10 0 5 40 0 1,190 75
West Midlands 1,325 50 90 5 65 5 15 5 75 50 0 1,540 145
East of England 1,635 85 150 20 90 20 75 0 0 85 0 1,965 200
London 2,785 215 275 70 200 40 180 10 30 80 0 3,355 540
South East 2,970 150 320 105 160 20 75 10 15 135 5 3,600 365
South West 1,260 55 95 10 70 5 10 0 0 60 0 1,490 80
Wales 495 15 30 0 30 0 5 0 0 25 0 580 25
Scotland 820 35 125 10 50 0 5 0 0 50 0 1,045 55
Northern Ireland 335 15 55 5 15 0 5 5 5 10 0 420 25
Channel Islands / Isle of Man * * 0 0 0 0 0 0 0 * * * *
Total 16,060 780 1,420 270 905 105 415 35 165 655 10 19,205 1,715
5. Dual claims are those where a company made a claim under both the Large Company and RDEC schemes.
Numbers: actual
Amounts: £ million
Schemes for large companies All schemes
Dual Claims RDEC scheme SME sub-contractors
Regional analysis of number and cost of R&D tax credit claims, 2013-14 1 2 3 4 5
SME R&D scheme
3. Numbers are rounded to the nearest 5 and amounts are rounded to the nearest £5m. Totals may not sum due to rounding.
4. Statistics in this table are consistent with HMRC’s policies on dominance and disclosure.
where the R&D activity takes place, so caution must be exercised when interpreting these figures.
* Value suppressed as cell count less than 5
Large company R&D
scheme
1. Regional allocation is based on the postcode of the company's registered address, which might not correspond to
2. Figures exclude claims where region is not known.

25
RD6
Industry sector
Number of
claims
Amount
claimed
Number of
claims
Amount
claimed
Number of
claims,
All
Amount
claimed, Large
company R&D
scheme
Amount
claimed,
RDEC
scheme
Number of
claims
Amount
claimed
Number of
claims
Amount
claimed
Number of
claims
Amount
claimed
A. Agriculture, Forestry, Fishing 70 * 15 * 5 0 0 0 0 5 0 95 *
B. Mining & Quarrying 20 * 20 5 10 * 15 0 * 0 0 50 25
C. Manufacturing 4,690 205 540 90 425 45 175 15 115 150 * 5,815 635
D. Electricity, Gas, Steam and Air Conditioning 30 * 10 * 5 0 * 0 0 0 0 45 5
E. Water, Sewerage and Waste 100 * 15 * 5 0 0 0 * 0 0 120 5
F. Construction 320 10 40 * 15 * * 0 0 5 0 380 20
G. Wholesale & Retail Trade, Repairs 1,600 50 135 20 45 * 10 0 * 35 0 1,820 85
H. Transport & Storage 85 * 10 * 10 0 * 0 * 0 0 110 5
I. Accommodation & Food 30 * 0 0 0 0 0 0 0 0 0 35 *
J. Information & Communication 4,345 250 230 35 125 10 30 5 15 165 * 4,875 335
K. Financial & Insurance 170 15 35 15 25 5 10 0 * 0 0 240 45
L. Real Estate 30 0 0 0 0 0 0 0 0 0 0 30 0
M. Professional, Scientific & Technical 3,015 180 275 70 165 30 125 5 10 210 * 3,670 415
N. Admin & Support Services 835 30 65 10 45 * 15 0 5 40 0 985 65
O. Public Admin, Defence & Social Services 0 0 5 * 5 * 5 0 0 0 0 5 10
P. Education 125 * 5 0 0 0 0 0 0 5 0 135 *
Q. Health & Social Work 125 10 15 * 5 0 * 0 0 5 0 150 10
R. Arts, Entertainment & Recreation 100 10 5 5 5 * 10 0 0 0 0 105 25
S. Other services activities 265 5 10 0 5 0 * 0 0 15 0 295 10
Total 15,955 780 1,425 265 905 105 415 40 155 650 10 18,965 1,710
Notes
4. Statistics in this table are consistent with HMRC’s policies on dominance and disclosure.
5. No claims for R&D tax relief were received from companies classified within SIC2007 sectors T (Activities of households as employers) and U (Activities of extraterritorial organisations and bodies).
These sectors were therefore excluded from the table.
6. Dual claims are those where a company made a claim under both the Large Company and RDEC schemes.
SME sub-contractors
1. Industry sector is based on primary SIC2007 coding of registered company. This coding might not correspond to the
industry sector of the R&D activity, so caution must be exercised when interpreting these figures.
Industry sector analysis of number and cost of R&D tax credit claims, 2013-14 1 2 3 4 5 6
Numbers: actual
Amounts: £ million
SME R&D scheme All schemes
RDEC schemeDual Claims
Schemes for large companies
Large company R&D
scheme
2. Figures exclude claims where industry sector is not known.
3. Numbers are rounded to the nearest 5 and amounts are rounded to the nearest £5m. Totals may not sum due to rounding.
* Value suppressed as cell count less than 5