research and geospatial information - luton · research and geospatial information team department...
TRANSCRIPT
Research and Geospatial Information Team Department of Environment and Regeneration
2015 Indices of Multiple Deprivation Luton
November 2015
Headlines
The Indices of Multiple Deprivation rank relative deprivation amongst areas in England.
Luton is currently ranked 59th most deprived area from 326 local authorities, this is an increase in ranking from 69th in 2010. Therefore Luton is becoming relatively more deprived.
Luton has nine output areas in the top ten per cent most deprived areas in the country. Three of these are in Northwell, two in Farley and South wards and one in Biscot and Dallow wards.
Luton highest deprivation rankings are in the crime (24th) and Barriers to Housing and Services (15th) indicators.
2015 Indices of Multiple Deprivation
The Index of Multiple Deprivation 2015 combines a number of indicators, chosen to cover a range of economic, social and housing issues, into a single deprivation score for each small area in England. This allows each area to be ranked relative to one another according to their level of deprivation. As with the 2010, 2007 and 2004 Indices, the Indices of Deprivation 2015 have been produced at Lower Super Output Area (LSOA) level, of which there are 32,844 in the country. These data are produced by Communities & Local Government (CLG). The IMD are based on 37 separate indicators, organised across seven distinct domains of deprivation which are combined, using appropriate weights, to calculate the Index of Multiple Deprivation 2015 (IMD 2015). This is an overall measure of multiple deprivation experienced by people living in an area and is calculated for every Lower layer Super Output Area (LSOA), or neighbourhood, in England. Every such neighbourhood in England is ranked according to its level of deprivation relative to that of other areas. There are also six district summary scores for each Local Authority district (there are 326 districts in England). A relative ranking of areas, according to their level of deprivation is then provided. The categories are barriers to housing services, crime, education, education, employment, health and living environment. There are also supplementary Indices measuring income deprivation amongst children and older people: the Income Deprivation Affecting Children Index and the Income Deprivation Affecting Older People Index. The methodology underpinning the 2015, 2010, 2007 and 2004 indices are largely the same though there have been small changes to some of the underlying indicators. Comparison between the three Indices is therefore acceptable.
Research and Geospatial Information

2015 Indices of Multiple Deprivation Luton
November 2015
Research and Geospatial Information Team Department of Environment and Regeneration
The Indices are used widely to analyse patterns of deprivation, identify areas that would benefit from special initiatives or programmes and as a tool to determine eligibility for specific funding streams. The 2015 Indices of Multiple Deprivation (IMD) were published in September 2015. Luton is ranked as the 59th (out of 326) most deprived local authority. In 2010 Luton was ranked as the 69th most deprived local authority in 2007 as the 87st (out of 354 authorities) and in 2004 the 101st most deprived local authority. This indicates that Luton is becoming relatively more deprived in comparison to the other local authorities of England and the trend of has been happening since 2004.
Table 1: Comparison of ranks for 2004-2015 (where 1 = Most Deprived and 326 = Least Deprived in 2010 and 2015 and 354 in 2007 and 2004)
2004 rank
2007 rank
2010 rank
2015 rank
Local Concentration is the population weighted average of the ranks of a district’s most deprived SOAs that contain exactly 10% of the district’s population.
134
120
112
114
Extent is the proportion of a district’s population living in the most deprived SOAs in the country. This aims to portray how widespread high levels of deprivation are in a district.
95
85
74
57
Income Scale is the number of people who are Income deprived. These aim to indicate the numbers of people experiencing Income Deprivation.
69
55
63
58
Employment Scale is the number of people who are Employment deprived. These aim to indicate the numbers of people experiencing Employment Deprivation.
82
78
87
103
Average of Ranks - Population weighted average of the combined ranks for the wards in a district. This summarises the district as a whole, including both deprived and less deprived wards.
103
86
60
40
Rank of Average Scores - Population weighted average of the combined scores for a district. This also summarises the district as a whole, taking into account the complete range of scores across the district.
101
87
69
59
2015 Indices of Multiple Deprivation Luton
November 2015
Research and Geospatial Information Team Department of Environment and Regeneration
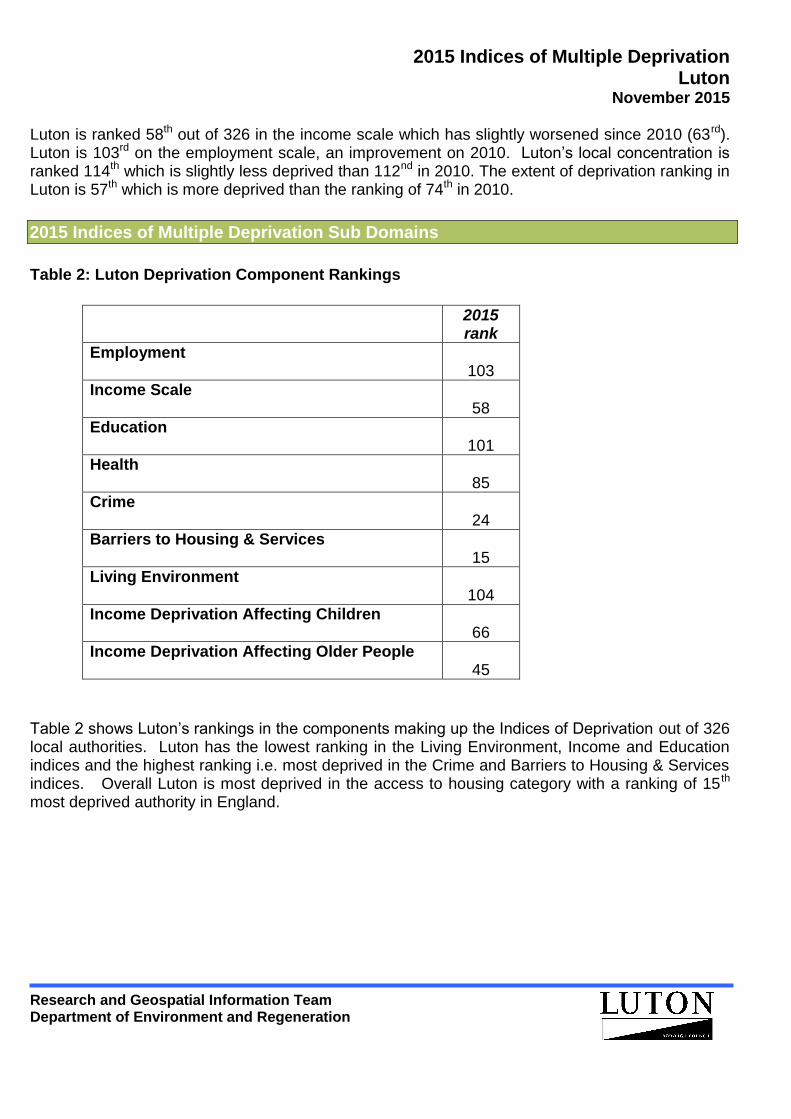
Luton is ranked 58th out of 326 in the income scale which has slightly worsened since 2010 (63rd). Luton is 103rd on the employment scale, an improvement on 2010. Luton’s local concentration is ranked 114th which is slightly less deprived than 112nd in 2010. The extent of deprivation ranking in Luton is 57th which is more deprived than the ranking of 74th in 2010.
2015 Indices of Multiple Deprivation Sub Domains
Table 2: Luton Deprivation Component Rankings
2015
rank
Employment 103
Income Scale 58
Education
101
Health
85
Crime
24
Barriers to Housing & Services
15
Living Environment
104
Income Deprivation Affecting Children
66
Income Deprivation Affecting Older People
45
Table 2 shows Luton’s rankings in the components making up the Indices of Deprivation out of 326 local authorities. Luton has the lowest ranking in the Living Environment, Income and Education indices and the highest ranking i.e. most deprived in the Crime and Barriers to Housing & Services indices. Overall Luton is most deprived in the access to housing category with a ranking of 15 th most deprived authority in England.

2015 Indices of Multiple Deprivation Luton
November 2015
Research and Geospatial Information Team Department of Environment and Regeneration
Indices of Multiple Deprivation by Output Area
Mapping the Indices of Deprivation provides an insight into the different types of deprivation experienced by local communities. Maps have been produced for all the Indices for Luton. Luton is also compared with its statistical neighbours. Map 1: 2015 Index of Multiple Deprivation in Luton by LSOA
Luton has nine output areas in the top ten per cent most deprived areas in the country. Three of these are in Northwell, two in Farley and South wards and one in Biscot and Dallow wards.

2015 Indices of Multiple Deprivation Luton
November 2015
Research and Geospatial Information Team Department of Environment and Regeneration
2010, 2007 & 2004 Indices of Multiple Deprivation by Output Area
Map 2: 2010 Index of Multiple Deprivation in Luton by LSOA
Map 3: 2007 Index of Multiple Deprivation in Luton by LSOA

2015 Indices of Multiple Deprivation Luton
November 2015
Research and Geospatial Information Team Department of Environment and Regeneration
Map 4: 2004 Index of Multiple Deprivation in Luton by LSOA
Comparing Maps 1,2, 3 & 4 shows that areas of Luton are becoming more deprived particularly in Northwell and Farley wards.
2015 Indices of Multiple Deprivation: Luton and Selected Comparators Rankings
Rank of IMD
Rank of average rank
Rank of local concentration
Rank of extent
Rank of employment
Rank of income
Luton 59 40 114 57 103 58
Bedford 148 154 133 139 138 135
Central Bedfordshire
260 264 209 214 253 233
Blackburn with Darwen
15 24 20 13 20 22
Milton Keynes
164 181 120 147 172 129
Slough 112 79 182 155 164 106
Rankings out of 326 local authorities, 1 = most deprived area.
2015 Indices of Multiple Deprivation Luton
November 2015
Research and Geospatial Information Team Department of Environment and Regeneration
2015 Indices of Multiple Deprivation: Luton Components by Output Area
The Index of Multiple Deprivation (IMD) combines information from the seven domains to produce an overall relative measure of deprivation. The domains are combined using the following weights:
Income Deprivation (22.5%)
Employment Deprivation (22.5%)
Education, Skills and Training Deprivation (13.5%)
Health Deprivation and Disability (13.5%)
Crime (9.3%)
Barriers to Housing and Services (9.3%)
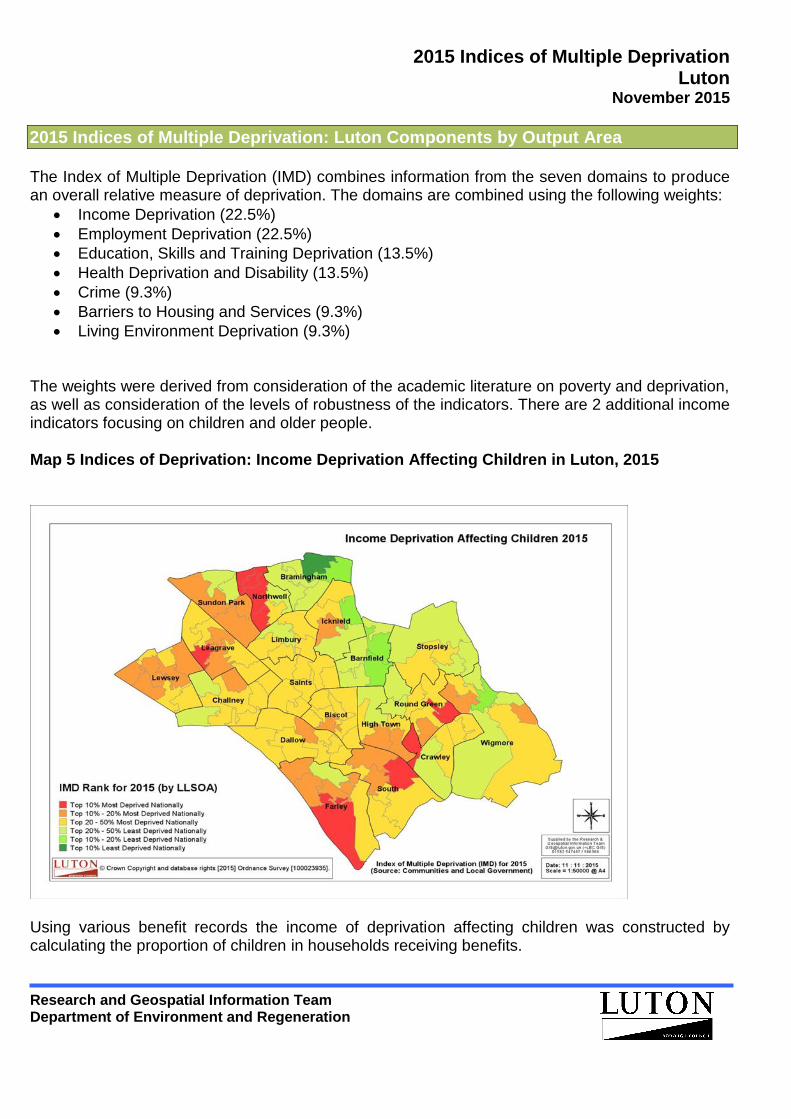
Living Environment Deprivation (9.3%) The weights were derived from consideration of the academic literature on poverty and deprivation, as well as consideration of the levels of robustness of the indicators. There are 2 additional income indicators focusing on children and older people. Map 5 Indices of Deprivation: Income Deprivation Affecting Children in Luton, 2015
Using various benefit records the income of deprivation affecting children was constructed by calculating the proportion of children in households receiving benefits.
2015 Indices of Multiple Deprivation Luton
November 2015
Research and Geospatial Information Team Department of Environment and Regeneration
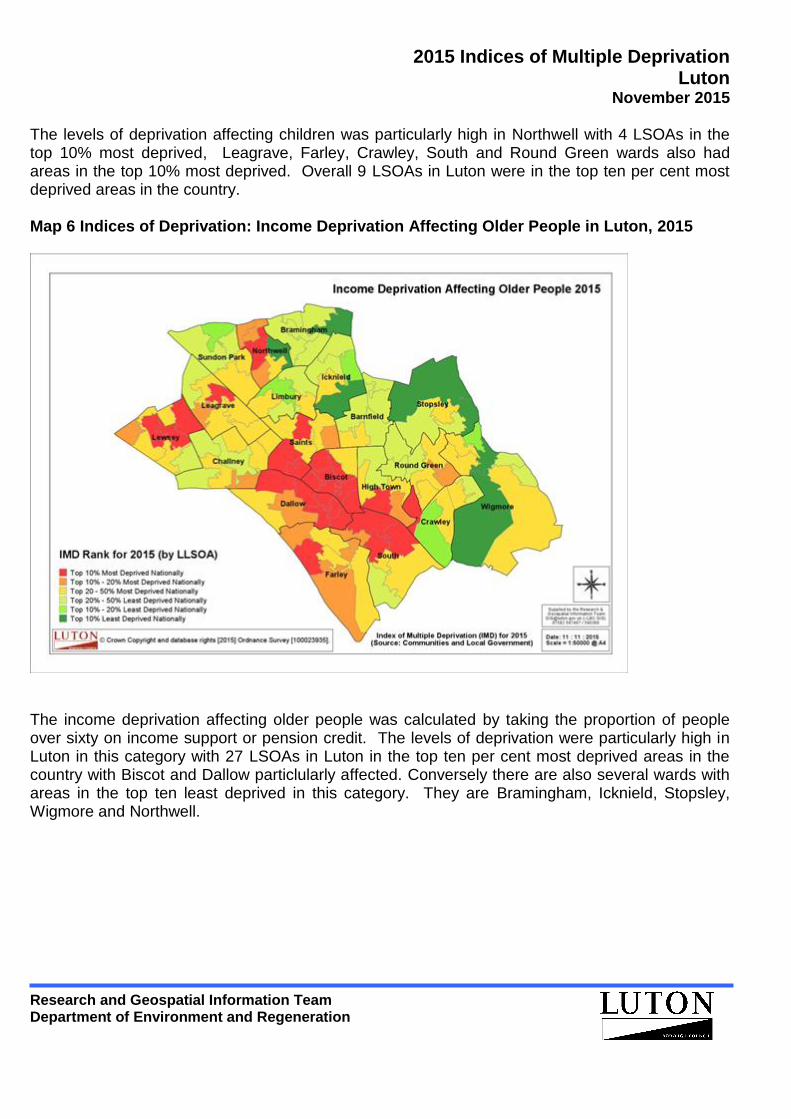
The levels of deprivation affecting children was particularly high in Northwell with 4 LSOAs in the top 10% most deprived, Leagrave, Farley, Crawley, South and Round Green wards also had areas in the top 10% most deprived. Overall 9 LSOAs in Luton were in the top ten per cent most deprived areas in the country. Map 6 Indices of Deprivation: Income Deprivation Affecting Older People in Luton, 2015
The income deprivation affecting older people was calculated by taking the proportion of people over sixty on income support or pension credit. The levels of deprivation were particularly high in Luton in this category with 27 LSOAs in Luton in the top ten per cent most deprived areas in the country with Biscot and Dallow particlularly affected. Conversely there are also several wards with areas in the top ten least deprived in this category. They are Bramingham, Icknield, Stopsley, Wigmore and Northwell.

2015 Indices of Multiple Deprivation Luton
November 2015
Research and Geospatial Information Team Department of Environment and Regeneration
Map 7 Indices of Deprivation: Income Deprivation in Luton, 2015
The Income Deprivation Domain measures the proportion of the population experiencing deprivation relating to low income. The definition of low income used includes both those people that are out-of-work, and those that are in work but who have low earnings (and who satisfy the respective means tests). There were 15 LSOAs in Luton in the top 10% most deprived with 4 areas in Northwell, two in Farley, Leagrave, Lewsey and Dallow and one each in South, Round Green and Crawley. There were 3 LSOAs in the top 10% least deprived, one each in Stopsley, Bramingham & Wigmore.

2015 Indices of Multiple Deprivation Luton
November 2015
Research and Geospatial Information Team Department of Environment and Regeneration
Map 8 Indices of Deprivation: Employment Deprivation in Luton, 2015
The Employment Deprivation Domain measures the proportion of the working age population in an area involuntarily excluded from the labour market. This includes people who would like to work but are unable to do so due to unemployment, sickness or disability, or caring responsibilities. There are 4 LSOAs in the top 10% most deprived areas, these are in Northwell, Lewsey, Farley and Leagrave. There are 2 areas in the top 10% least deprived, one area in Bramingham and Barnfield.

2015 Indices of Multiple Deprivation Luton
November 2015
Research and Geospatial Information Team Department of Environment and Regeneration
Map 9 Indices of Deprivation: Education, Skills & Training Deprivation in Luton, 2015
The Education, Skills and Training Deprivation Domain measures the lack of attainment and skills in the local population. The indicators fall into two sub-domains: one relating to children and young people and one relating to adult skills. There is only one LSOA in the most 10% deprived nationally which is in Biscot. However there are no areas in the top 10% least deprived.
2015 Indices of Multiple Deprivation Luton
November 2015
Research and Geospatial Information Team Department of Environment and Regeneration
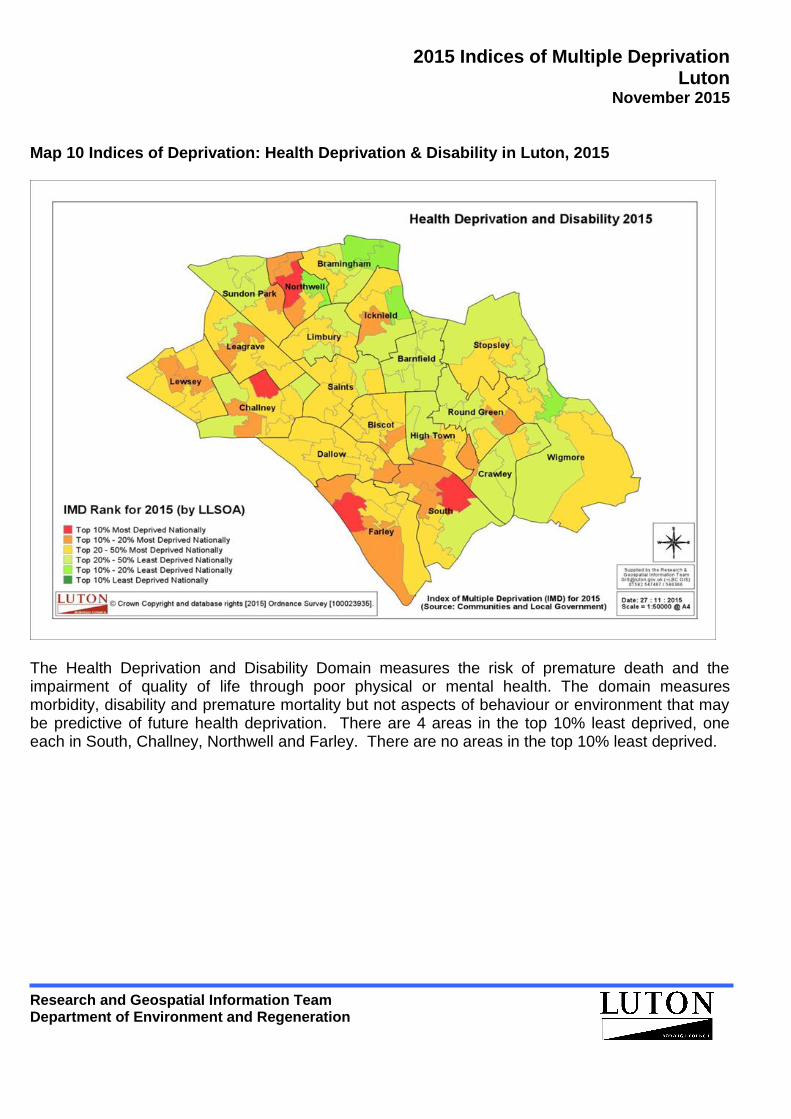
Map 10 Indices of Deprivation: Health Deprivation & Disability in Luton, 2015
The Health Deprivation and Disability Domain measures the risk of premature death and the impairment of quality of life through poor physical or mental health. The domain measures morbidity, disability and premature mortality but not aspects of behaviour or environment that may be predictive of future health deprivation. There are 4 areas in the top 10% least deprived, one each in South, Challney, Northwell and Farley. There are no areas in the top 10% least deprived.
2015 Indices of Multiple Deprivation Luton
November 2015
Research and Geospatial Information Team Department of Environment and Regeneration
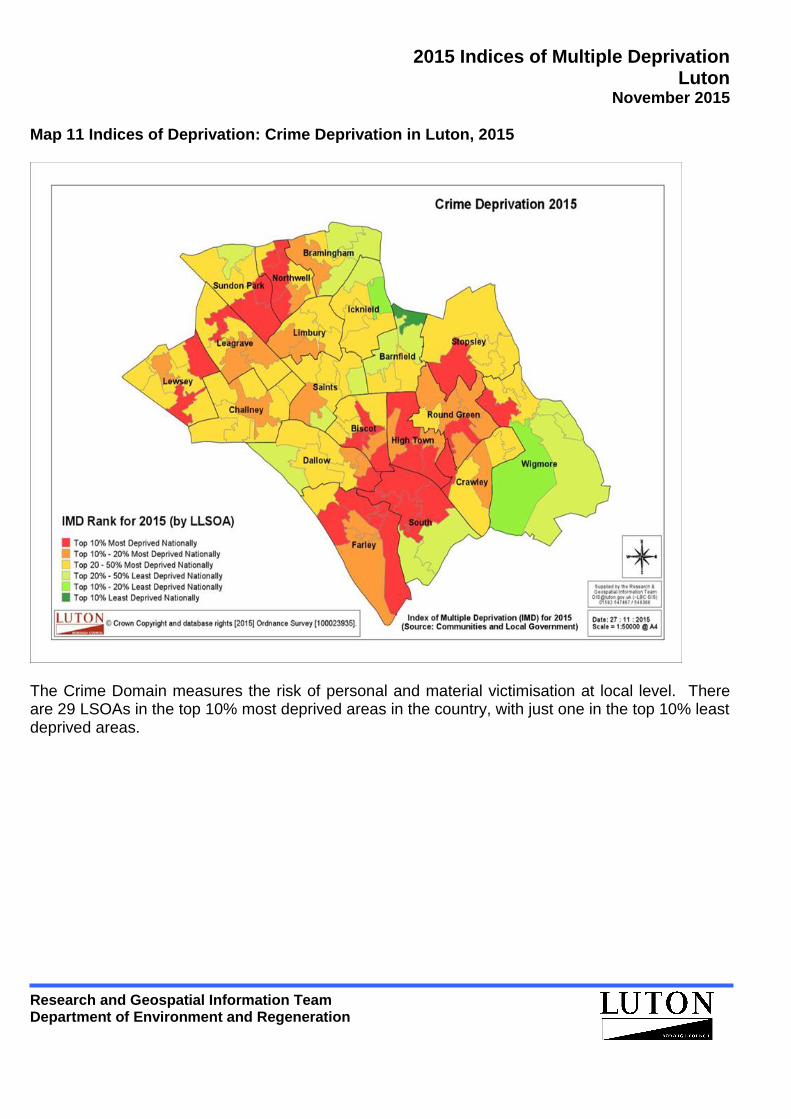
Map 11 Indices of Deprivation: Crime Deprivation in Luton, 2015
The Crime Domain measures the risk of personal and material victimisation at local level. There are 29 LSOAs in the top 10% most deprived areas in the country, with just one in the top 10% least deprived areas.
2015 Indices of Multiple Deprivation Luton
November 2015
Research and Geospatial Information Team Department of Environment and Regeneration
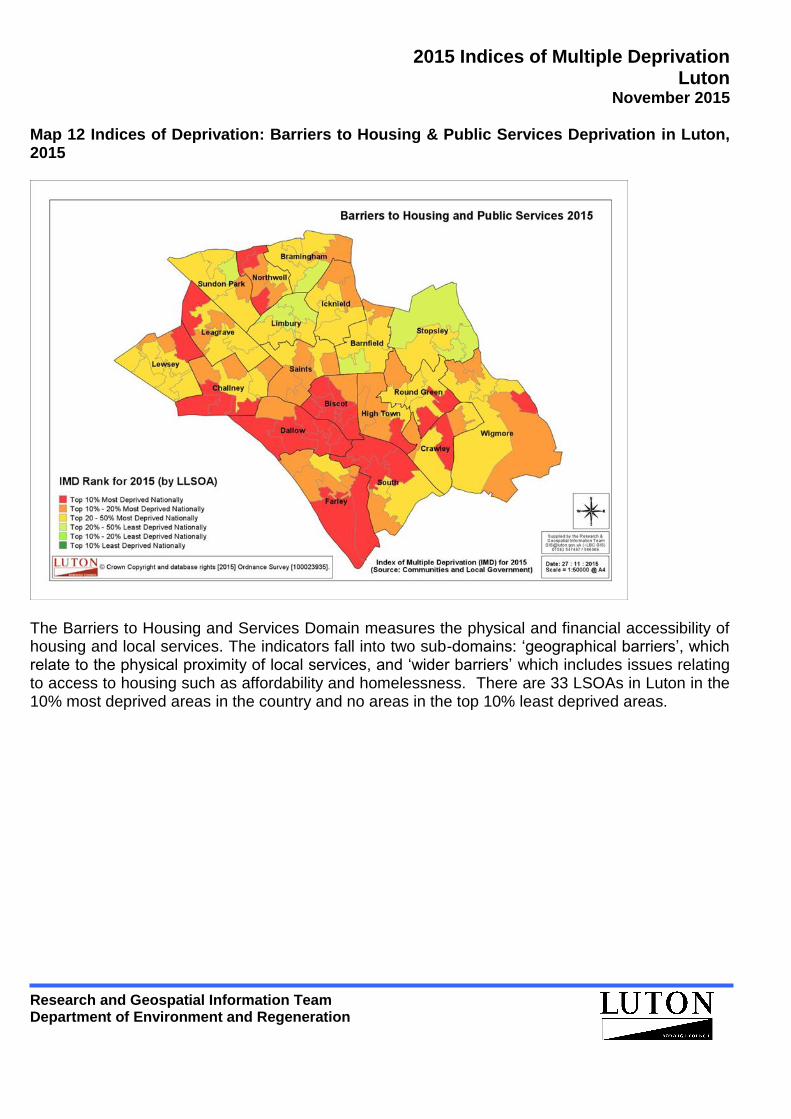
Map 12 Indices of Deprivation: Barriers to Housing & Public Services Deprivation in Luton, 2015
The Barriers to Housing and Services Domain measures the physical and financial accessibility of housing and local services. The indicators fall into two sub-domains: ‘geographical barriers’, which relate to the physical proximity of local services, and ‘wider barriers’ which includes issues relating to access to housing such as affordability and homelessness. There are 33 LSOAs in Luton in the 10% most deprived areas in the country and no areas in the top 10% least deprived areas.
2015 Indices of Multiple Deprivation Luton
November 2015
Research and Geospatial Information Team Department of Environment and Regeneration
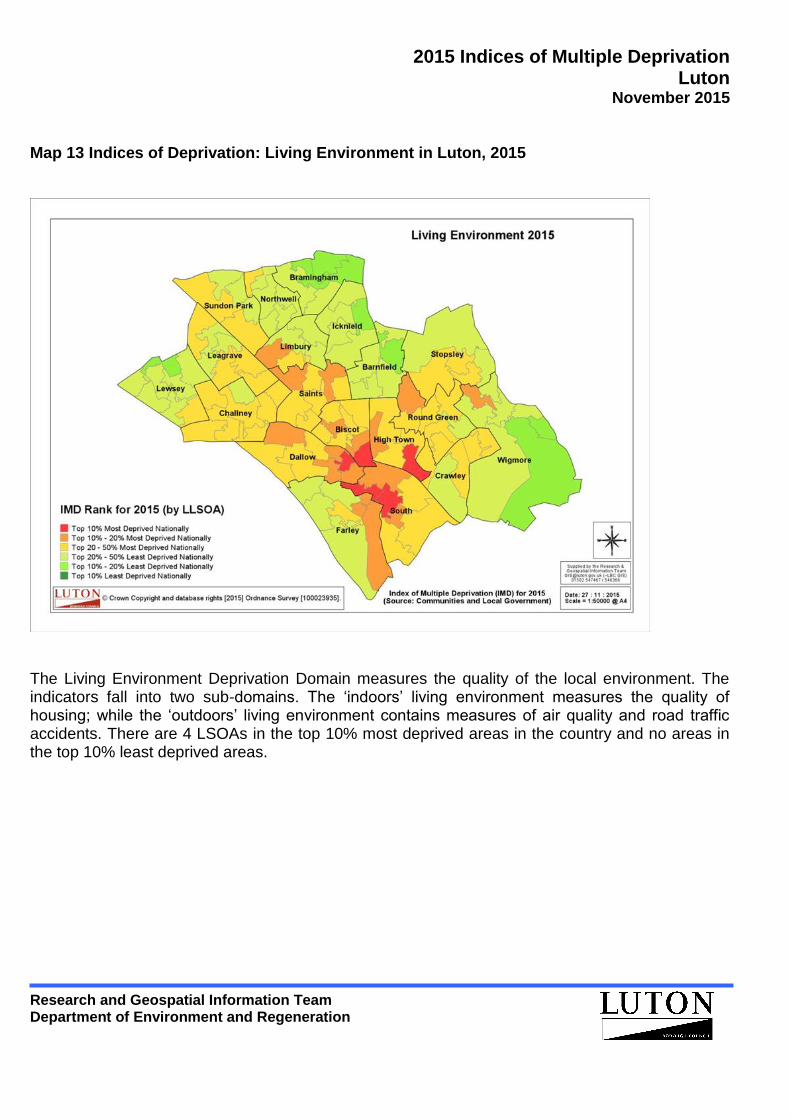
Map 13 Indices of Deprivation: Living Environment in Luton, 2015
The Living Environment Deprivation Domain measures the quality of the local environment. The indicators fall into two sub-domains. The ‘indoors’ living environment measures the quality of housing; while the ‘outdoors’ living environment contains measures of air quality and road traffic accidents. There are 4 LSOAs in the top 10% most deprived areas in the country and no areas in the top 10% least deprived areas.
2015 Indices of Multiple Deprivation Luton
November 2015
Research and Geospatial Information Team Department of Environment and Regeneration
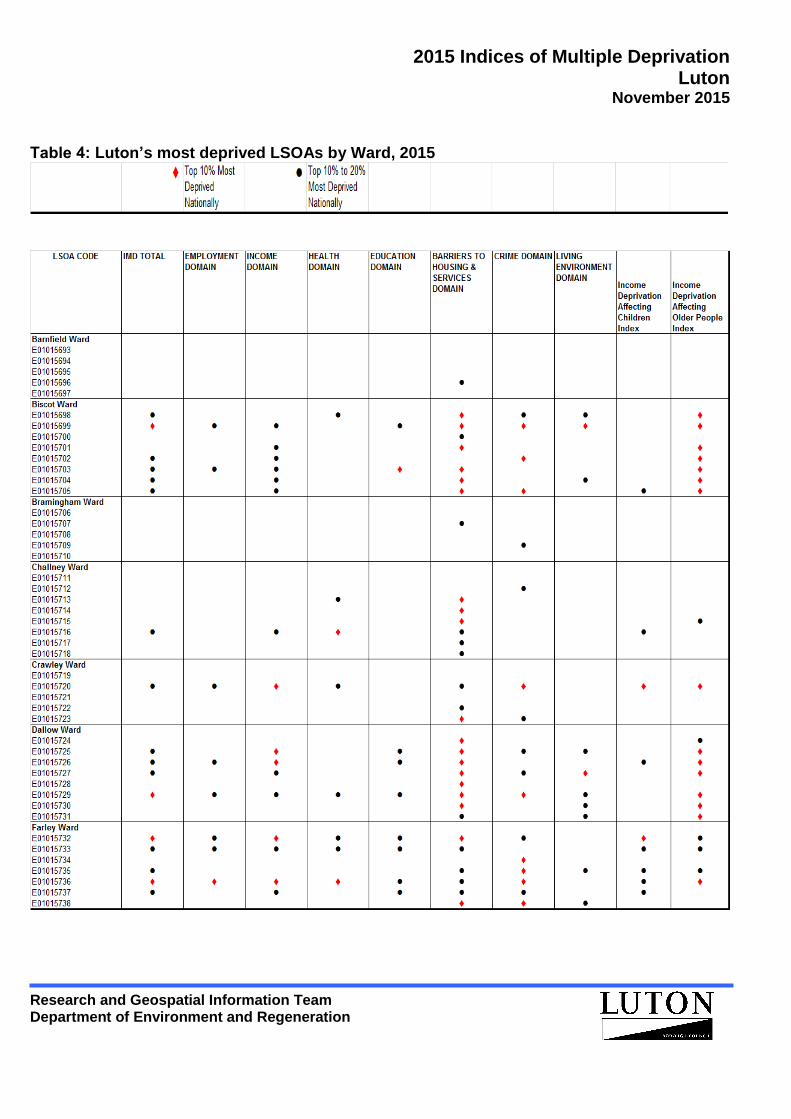
Table 4: Luton’s most deprived LSOAs by Ward, 2015

2015 Indices of Multiple Deprivation Luton
November 2015
Research and Geospatial Information Team Department of Environment and Regeneration

2015 Indices of Multiple Deprivation Luton
November 2015
Research and Geospatial Information Team Department of Environment and Regeneration
One LSOA in South and Northwell wards were in the top ten % most deprived area in 6 categories. Overall the areas in Luton experiencing the highest levels of deprivation across the categories are in Northwell, Biscot, Dallow and Farley. Luton has considerably higher levels of deprivation than its neighbours in Bedford and Central Bedfordshire. Luton has become relatively more deprived between 2004 and 2015 according to the indices of deprivation.
2015 Indices of Multiple Deprivation Luton
November 2015
Research and Geospatial Information Team Department of Environment and Regeneration
The deprivation categories in which Luton had the most LSOAs in the top 10 per cent most deprived areas in England was the barriers to housing and services index, the crime index and the index affecting older people. The full range of data from CLG can be found in the following link: CLG For further information on this topic, please contact the Research and Geospatial Information Team
via Research. Intelligence @luton.gov.uk