research article brain parenchymal fraction: a relatively
TRANSCRIPT

Research ArticleBrain Parenchymal Fraction: A Relatively Simple MRIMeasure to Clinically Distinguish ALS Phenotypes
Venkateswaran Rajagopalan1,2 and Erik P. Pioro3,4
1Department of Electrical and Electronics Engineering, Birla Institute of Technology and Science, Pilani,Hyderabad Campus, Hyderabad 500078, India2Department of Biomedical Engineering, ND2, Lerner Research Institute, Cleveland Clinic, Cleveland, OH 44195, USA3Neuromuscular Center and Department of Neurology, Neurological Institute, Cleveland Clinic, Cleveland, OH 44195, USA4Department of Neurosciences, Lerner Research Institute, Cleveland Clinic, Cleveland, OH 44195, USA
Correspondence should be addressed to Erik P. Pioro; [email protected]
Received 19 July 2015; Revised 19 November 2015; Accepted 23 November 2015
Academic Editor: Yukihisa Takayama
Copyright © 2015 V. Rajagopalan and E. P. Pioro. This is an open access article distributed under the Creative CommonsAttribution License, which permits unrestricted use, distribution, and reproduction in any medium, provided the original work isproperly cited.
Even though neuroimaging and clinical studies indicate that amyotrophic lateral sclerosis (ALS) manifests with distinct clinicalphenotypes, no objective test exists to assess upper motor degeneration in ALS. There is great interest in identifying biomarkersof ALS to allow earlier diagnosis and to recognize disease subtypes. Current quantitative neuroimaging techniques such asT2 relaxometry and diffusion tensor imaging are time-consuming to use in clinical settings due to extensive postprocessingrequirements.Therefore, we aimed to study the potential role of brain parenchymal fraction (BPF) as a relatively simple quantitativemeasure for distinguishing ALS phenotypes. T1-weightedMR images of brain were obtained in 15 neurological controls and 88 ALSpatients categorized into 4 distinct clinical phenotypes, upper motor neuron- (UMN-) predominant ALS patients with/withoutcorticospinal tract (CST) hyperintensity on T2/PD-weighted images, classic ALS, and ALS with frontotemporal dementia (ALS-FTD). BPF was calculated using intracranial grey matter, white matter, and cerebrospinal fluid volumes obtained in control andALS subgroups using SPM8 software. Only ALS-FTD patients had significant reduction in BPF when compared to controls andnondemented ALS patients. Correlation of clinical measures such as disease duration with BPF further supports the view that theBPF could be a potential biomarker for clinical diagnosis of ALS-FTD patients.
1. Introduction
Amyotrophic lateral sclerosis (ALS) is a progressive degener-ation of motor neurons in brain and spinal cord of unknowncause [1]. Growing evidence from neuroimaging and clinicalstudies indicates that ALS manifests with distinct clinicalphenotypes identified by extent of upper motor neuron(UMN) dysfunction [2], cognitive impairment (ALS patientswith frontotemporal lobe dementia, ALS-FTD), and variabledegrees of lower motor neuron dysfunction. According tothe revised El Escorial criteria [3], the diagnosis of ALS isbased on the presence of both UMN and LMN symptomsand signs. Whereas electromyography (EMG) is an objectivetest for LMNdegeneration [4], no easily accessible equivalentexists to objectively identify UMN dysfunction in ALS,
contributing to incorrect or delayed diagnoses [5]. There isgreat interest in identifying biomarkers of ALS to allow earlierdiagnosis, recognize disease subtypes (which exist phenotypi-cally), monitor disease progression, and assess the efficacy oftherapeutic interventions.
Even though ALS patients have clinical evidence of bothUMN and LMN dysfunction, a percentage of patients beginwithUMNabnormalities before developing identifiable LMNsigns. We have observed that some patients with predom-inantly UMN signs have bilateral corticospinal tract (CST)hyperintensities visible on conventional T2-, proton density-,and FLAIR-weighted image, while others with similar clin-ical features do not [2]. Why some patients with UMN-predominantALS possess CSThyperintensities and others donot is unknown. Also, cognitive impairment in some patients
Hindawi Publishing CorporationBioMed Research InternationalVolume 2015, Article ID 693206, 6 pageshttp://dx.doi.org/10.1155/2015/693206

2 BioMed Research International
with ALS affects predominantly frontotemporal areas tocause frontotemporal dementia (FTD) while prominentLMN dysfunction with UMN signs occurs in patients withclassic ALS. Based on such observations, one can hypoth-esize different pathological mechanisms of ALS in UMN-predominant patients with or without CST hyperintensity, aswell as those with combined UMN and LMN dysfunction orthose with FTD.
Currently neuroimaging studies especially using MRI(because of versatile contrasts) to evaluate UMN dysfunctionhave provided better understanding of pathophysiologicalchanges brought out by the ALS disease process. How-ever, techniques such as T2 relaxometry, diffusion tensorimaging, and quantitative assessment of T1-weighted imagesusing techniques such as voxel based morphometry (VBM)and cortical thickness analysis are time-consuming due toextensive postprocessing requirements.Therefore, these tech-niques have less widespread application clinically as opposedto research setting.On the other hand,measures such as brainparenchymal fraction (BPF) are not only quantitative but alsosimple and easy to calculate in clinical settings. Two previousstudies in ALS [6, 7] found significant reduction in BPF ofALS patient brain; however, they did not categorize or classifyALS patients by their clinical phenotypes. Furthermore,they did not study the role of BPF as a potential clinicalquantitative measure for distinguishing ALS phenotypes. Wehypothesize that categorizing ALS patients by their clinicalphenotype would reveal quantitative differences in BPFbetween such ALS subgroups and may identify the potentialof BPF for distinguishing ALS phenotypes.
2. Methods
2.1. Demographics. MRI data obtained at 1.5 T during rou-tine clinical neuroimaging were approved by the ClevelandClinic Institutional Review Board for storage and analysis asdeidentified images after patients (or their legal representa-tive when they were cognitively impaired) provided verbalconsent. The data were analyzed in the following patientgroups: (1) neurologic disease controls (associated diagnosesindicated in Table 1); (2) UMN-predominant ALS patientswith CST hyperintensity on T2/PD-weighted images (ALS-CST+) (this hyperintense signal is predominantly seen inposterior limb of the internal capsule (corresponding to cor-ticospinal tract) and was identified by a blinded evaluator);(3) UMN-predominant ALS patients without CST hyperin-tensity identified on T2/PD-weighted images (ALS-CST–);(4) classic ALS (ALS-Cl); and (5) ALS with frontotemporaldementia (ALS-FTD). Representative demographics of theabove patient populations are given in Table 2.
Patients who were identified by one of us (EPP) duringclinical evaluation as having cognitive or behavioral impair-ment (e.g., disturbances of impulse control, executive func-tion, and language) underwent formal neuropsychometrictesting in most cases. Eighteen ALS patients met Neary crite-ria of FTD [8] after testing by an experienced neuropsychol-ogist (𝑛 = 11) or bedside evaluation with MoCA (𝑛 = 7) andwere included in theALS-FTD subgroup. Table 3 gives details
Table 1: Clinical diagnoses of neurologic disease controls.
Subject Clinical diagnosis1 Severe fatigue, headache2 Stiff person syndrome3 Myasthenia gravis4 Parkinson’s disease5 Depression, headache, and fibromyalgia-like syndrome6 Fibromyalgia-like syndrome, headache7 Painful sensory polyneuropathy8 Insomnia, headache9 Parkinson’s disease10 Cervical radiculopathy11 Non-length-dependent small fiber sensory neuropathy12 Headache, pain in lower leg13 Small fiber neuropathy, headache14 Large fiber neuropathy15 Fibromyalgia-like syndrome, headache
of the domains affected in each of the ALS-FTD patients andtheir FTD subtype UMN-predominant ALS patients weredefined as those with no lower motor neuron (LMN) signsor if present then these were restricted to only one neuraxiallevel (bulbar, cervical, thoracic, or lumbosacral) at the timeof MRI. Classic ALS (ALS-Cl) had combined UMN andLMN features at one or more levels and did not displayhyperintensity of CST. None of the ALS patients in the non-ALS-FTD subgroups had clinical evidence of FTD.
2.2. Clinical Data. Clinical measures of revised ALS func-tional rating scale (ALSFRS-R), disease duration (duration ofsymptoms prior to MRI), and disease progression rate werealso measured and are given in Table 2. Disease progressionratewas calculated by dividing the number of pointsALSFRS-R score decreased from normal (i.e., 48) at the time ofneuroimaging by symptom duration in months [9].
2.3.MR Image Acquisition. Structural high-resolution 3DT1-weighted MR images of head were obtained on a 1.5 T system(Siemens Symphony, Erlangen, Germany) using magnetiza-tion-prepared rapid gradient echo (MPRAGE) sequence.Imaging parameters were as follows: 160 slices, 1mm thick,with 1.0 × 1.0mm in-plane resolution; pulse sequence param-eters were as follows: TR = 1970ms; TE = 4.38ms; numberof averages = 1; and scan time = 6.45 minutes. T2- andPD-weighted images were also obtained using dual-echoFSE sequence to assess hyperintense signal changes alongcorticospinal tract in ALS patients. Imaging parametersinclude the following: 40 contiguous slices; slice thickness =4mm; in-plane resolution = 0.9 × 0.9mm; pulse sequenceparameters were as follows: repetition time (TR) = 3900ms;echo time (TE) = 26ms and 104ms; echo train length or turbofactor = 7; and number of averages = 1; total scan time = 3.5minutes. Although this datasetwas used in our previousVBMstudies [9], we did not study brain parenchymal fraction andso applied it to this study.
BioMed Research International 3
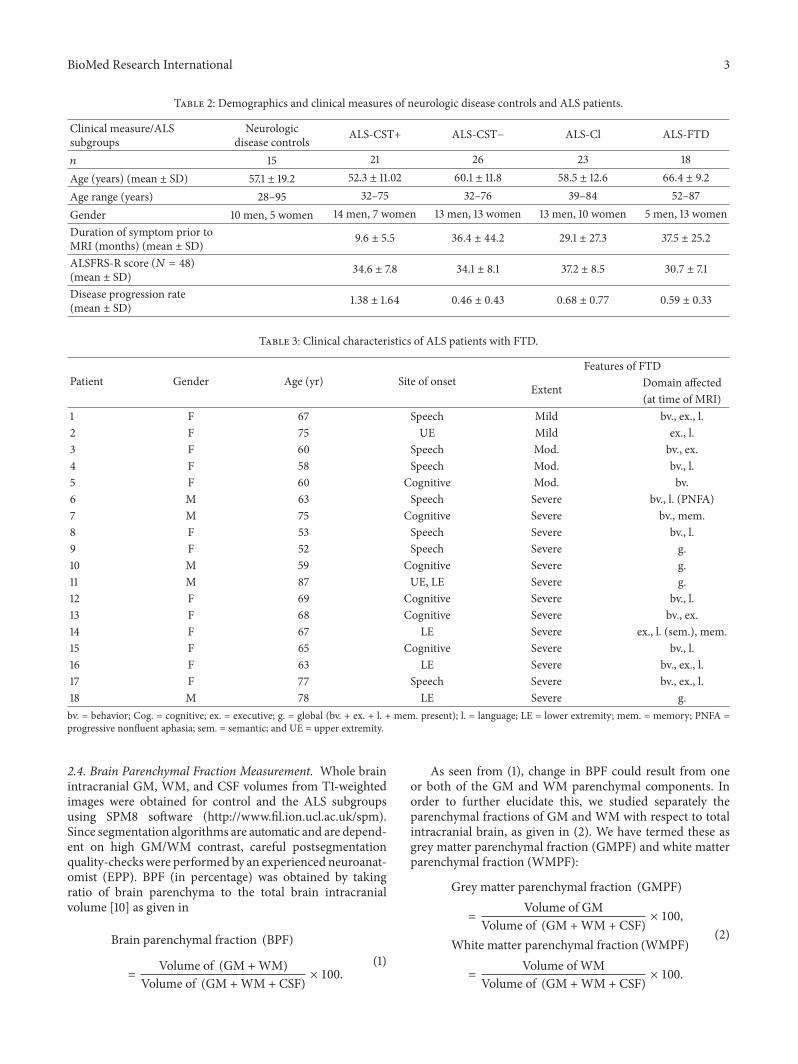
Table 2: Demographics and clinical measures of neurologic disease controls and ALS patients.
Clinical measure/ALSsubgroups
Neurologicdisease controls ALS-CST+ ALS-CST− ALS-Cl ALS-FTD
𝑛 15 21 26 23 18Age (years) (mean ± SD) 57.1 ± 19.2 52.3 ± 11.02 60.1 ± 11.8 58.5 ± 12.6 66.4 ± 9.2Age range (years) 28–95 32–75 32–76 39–84 52–87Gender 10 men, 5 women 14 men, 7 women 13 men, 13 women 13 men, 10 women 5 men, 13 womenDuration of symptom prior toMRI (months) (mean ± SD) 9.6 ± 5.5 36.4 ± 44.2 29.1 ± 27.3 37.5 ± 25.2
ALSFRS-R score (𝑁 = 48)(mean ± SD) 34.6 ± 7.8 34.1 ± 8.1 37.2 ± 8.5 30.7 ± 7.1
Disease progression rate(mean ± SD) 1.38 ± 1.64 0.46 ± 0.43 0.68 ± 0.77 0.59 ± 0.33
Table 3: Clinical characteristics of ALS patients with FTD.
Patient Gender Age (yr) Site of onsetFeatures of FTD
Extent Domain affected(at time of MRI)
1 F 67 Speech Mild bv., ex., l.2 F 75 UE Mild ex., l.3 F 60 Speech Mod. bv., ex.4 F 58 Speech Mod. bv., l.5 F 60 Cognitive Mod. bv.6 M 63 Speech Severe bv., l. (PNFA)7 M 75 Cognitive Severe bv., mem.8 F 53 Speech Severe bv., l.9 F 52 Speech Severe g.10 M 59 Cognitive Severe g.11 M 87 UE, LE Severe g.12 F 69 Cognitive Severe bv., l.13 F 68 Cognitive Severe bv., ex.14 F 67 LE Severe ex., l. (sem.), mem.15 F 65 Cognitive Severe bv., l.16 F 63 LE Severe bv., ex., l.17 F 77 Speech Severe bv., ex., l.18 M 78 LE Severe g.bv. = behavior; Cog. = cognitive; ex. = executive; g. = global (bv. + ex. + l. + mem. present); l. = language; LE = lower extremity; mem. = memory; PNFA =progressive nonfluent aphasia; sem. = semantic; and UE = upper extremity.
2.4. Brain Parenchymal Fraction Measurement. Whole brainintracranial GM, WM, and CSF volumes from T1-weightedimages were obtained for control and the ALS subgroupsusing SPM8 software (http://www.fil.ion.ucl.ac.uk/spm).Since segmentation algorithms are automatic and are depend-ent on high GM/WM contrast, careful postsegmentationquality-checkswere performed by an experienced neuroanat-omist (EPP). BPF (in percentage) was obtained by takingratio of brain parenchyma to the total brain intracranialvolume [10] as given in
Brain parenchymal fraction (BPF)
=
Volume of (GM +WM)Volume of (GM +WM + CSF)
× 100.
(1)
As seen from (1), change in BPF could result from oneor both of the GM and WM parenchymal components. Inorder to further elucidate this, we studied separately theparenchymal fractions of GM and WM with respect to totalintracranial brain, as given in (2). We have termed these asgrey matter parenchymal fraction (GMPF) and white matterparenchymal fraction (WMPF):
Grey matter parenchymal fraction (GMPF)
=
Volume of GMVolume of (GM +WM + CSF)
× 100,
White matter parenchymal fraction (WMPF)
=
Volume of WMVolume of (GM +WM + CSF)
× 100.
(2)

4 BioMed Research International
Control ALS-FTD ALS-CST+ ALS-CST− ALS-Cl
∗
∗
∗
∗
74
76
78
80
82
84
86
88
Brai
n pa
renc
hym
al fr
actio
n
Figure 1: Brain parenchymal fraction values are significantly lowerin patients with ALS-FTD compared to neurologic controls andother ALS subgroups. ∗𝑃 < 0.05.
2.5. Statistical Analysis. Clinical measures of revised ALSfunctional rating scale (ALSFRS-R), disease duration, anddisease progression rate were compared between ALS sub-groups using Kruskal-Wallis test with post hoc Mann-Whitney 𝑈 test (using Bonferroni correction). BPF, GMPF,and WMPF measures were compared between control andALS subgroups using ANCOVA by regressing out age,ALSFRS-R score, and disease duration. Multiple comparisoncorrections using Sidak test were performed with 𝑃 < 0.05.Correlations between clinical measures (disease duration,ALSFRS-R, and disease progression rate) and BPF in ALSpatients were performed using Spearman’s rank correlationcoefficient.
3. Results
Significant (𝑃 < 0.05) reductions in BPF and GMPF wereobserved only between control and ALS-FTD groups asshown in Figures 1 and 2. Similar reductions in BPF andGMPF were significant in ALS-FTD patients when com-pared to other ALS subgroups (ALS-CST+, ALS-CST−, andALS-Cl). However, WMPF showed no significant differencebetween controls and any of the ALS subgroups (Figure 3).Inability to discriminate the other patient groups fromneuro-logical controls may arise from some of these controls havinga degree of cerebral atrophy from other neurodegenerativeconditions (e.g., two with Parkinson disease). In order toevaluate this, statistical analysis was performed with thetwo parkinsonian patients excluded from the neurologiccontrol group. However, we still failed to observe anysignificant differences between the control and other ALSsubgroups/phenotypes, and the results remained the samewhether Parkinson disease patients were excluded or notfrom the neurologic control group. Correlation between BPFand clinical measures revealed moderately significant posi-tive correlation (𝑟 = 0.287, 𝑃 = 0.005) between BPF and dis-ease duration. No significant correlation was found between
Control ALS-FTD ALS-CST+ ALS-CST− ALS-Cl
∗
∗
∗
∗
05
1015202530354045
Gre
y m
atte
r par
ench
ymal
frac
tion
Figure 2: Grey matter parenchymal fraction values are significantlylower in patients with ALS-FTD compared to controls and otherALS subgroups. ∗𝑃 < 0.05.
Control ALS-FTD ALS-CST+ ALS-CST− ALS-Cl4041424344454647484950
Whi
te m
atte
r par
ench
ymal
frac
tion
Figure 3: White matter brain parenchymal fraction values are notsignificantly different in any ALS patient subgroups compared tocontrols.
BPF and ALSFRS-R score (𝑟 = 0.143, 𝑃 = 0.197), BPF anddisease progression rate (𝑟 = 0.072,𝑃 = 0.521).No significantcorrelation was observed between WMPF and any of theclinical measures, that is,WMPF versus disease duration (𝑟 =−0.021, 𝑃 = 0.843), WMPF versus ALSFRS-R score (𝑟 =0.025,𝑃 = 0.816), andWMPF versus disease progression rate(𝑟 = 0.016, 𝑃 = 0.886). No significant correlation was foundbetweenGMPFanddisease duration (𝑟 = −0.197,𝑃 = 0.061),GMPF and ALSFRS-R score (𝑟 = 0.062, 𝑃 = 0.55).
4. Discussion
The main findings of this study are as follows: (1) BPF wassignificantly reduced in ALS-FTD patients when comparedto controls and nondementedALS patients; (2) this reductionprimarily arose from changes in the greymatter parenchymalfraction (GMPF) and not the white matter parenchymal frac-tion (WMPF); (3) BPF significantly correlated with clinicaldisease duration but not withALSFRS-R score orwith diseaseprogression rate.

BioMed Research International 5
The present BPF results align with our previous findingsof significant GM atrophy in only ALS-FTD patients asmeasured by VBM [9]. BPF reduction in ALS-FTD patientsappears to result entirely from GMPF changes with nosignificant decrease in WMPF. The preferential reductionof GMPF in ALS-FTD patients also supports our previ-ous hypothesis that GM atrophy results from a dying for-ward “neuronopathy” in such patients [9]. WMPF on theother hand is actually slightly increased in the ALS-FTDgroup (meanWMPF in neurological controls equals 45.06%,whereas in ALS-FTD patients it equals 46.05%), althoughnot reaching statistical significance. This increase in WMPFcould be due to gliosis that results in response to damageof WM axons and/or myelin. Similarly, our previous VBManalyses failed to reveal significant changes of subcorticalWM in brain regions of ALS patients compared to controlindividuals [9]. In addition, we observed WM abnormalitiesin diffusion tensor imaging (DTI) metrics at rostral but notcaudal levels of the corticospinal tract (CST) in nondementedALS patients as revealed by fractional anisotropy (FA),axial diffusivity, and radial diffusivity values [11]. Lack ofconcordance between the DTI studies andWMPF findings inALS patients may occur because (1) WMPF and WM VBMdetect macroscopic changes whereas DTI identifies moremicroscopic changes resulting in earlier and more sensitivedetection of pathology than do volumetric measures and (2)WMPF represents whole brain WM tracts while only theCST fiber tracts are included in our DTI findings. Takentogether, abnormalities of CST DTI metrics (demonstratedpreviously) but not abnormalities of BPF, including GMPFmeasures (demonstrated in the present study), suggest thatALS-CST+,ALS-CST–, andALS-Cl patients have less corticalpathology than do ALS-FTD patients.
In contrast to our findings, previous VBM studies inALS found significantly reduced grey matter volume innondemented ALS patients [6, 7], although at least someof these patients showed cognitive impairment clinically.Other possible reasons for these disparate results includethe following: (i) combining various clinical phenotypes ofALS patients into the same group for analysis [6] ratherthan separating by distinct clinical phenotypes as in ourstudy; (ii) studying patients with extensive disease burdenand more advanced disease, for example, all with definiteALS [7] rather than ALS subgroups with relatively restrictedLMN abnormalities (as in our study with patients average ElEscorial score = 2, indicating laboratory-supported probableALS); (iii) using neurologic disease controls rather thanhealthy controls, which may have introduced some degreeof abnormality (e.g., atrophy) into our “control” group butalternatively represented a more appropriate (“real world”)comparison with ALS patients. Only healthy controls havebeen used in all other studies, making ours the first we knowto have used neurologic disease controls.
Overall, ALSFRS-R values showed little difference amongALS subgroups suggesting that data were collected frompatients with relatively similar degrees of functional impair-ment. However, significant differences were observed indisease duration among ALS subgroups. BPF and GMPFin ALS patients were significantly correlated with clinical
markers of disease, including disease duration and diseaseprogression rate. For example, positive correlation betweendisease duration and BPF suggests that shorter disease dura-tion may be associated with worse disease and indicate bothGM andWM damage.
Limitations of our study include the following: (1) lackof estimating the sensitivity and specificity of BPF, GMPF,and WMPF measures and (2) not evaluating changes in BPF,GMPF, and WMPF over time because of the cross-sectionalnature of this study. Future longitudinal studies with largersample sizes could confirm our findings.
MR imaging studies using techniques such as VBM,cortical thickness, and DTI showed significant GM andWMdamage in ALS patients [6, 7, 12]. Although these techniquescan certainly reveal abnormalities in specific brain regionsas compared to BPF, which is a whole brain measure, theyrequire extensive postprocessing of MR images, which isimpractical in a clinical setting. Techniques such as VBMrequire robust registration to a template which in variouspathological conditions (e.g., ventriculomegaly) may causesuboptimal normalization and segmentation leading to spu-rious results [13]. On the other hand Juengling and Kassubek[14] reported that BPF can not only be used for objectiveassessment of cerebral atrophy but can be included in MRreports of patients in routine diagnosis for neurodegenerativediseases. Along these lines we explored the use of BPF as arelatively quick and easy volumetric measure to distinguishALS patients from controls as well as within ALS subgroups.Our results suggest that BPF, along with GMPF and WMPF,could serve as a potential MRI biomarker to distinguish ALS-FTD from other ALS subgroups in a clinical setting.
5. Conclusion
ALS patients with frontotemporal dementia have greatestreduction in brain parenchyma among ALS patients withoutdementia. Significant reduction in the GMPF and not theWMPF component of BPF suggests cortical atrophy and pos-sibly a neuronopathy, in patients with ALS-FTD. Correlationof clinical disease duration with BPF further supports oursuggestion that BPF and its individual components, GMPFand WMPF, may be useful MRI biomarkers for the clinicaldiagnosis of the ALS-FTD phenotype.
Conflict of Interests
The authors declare no conflict of interests regarding thepublication of this paper.
Authors’ Contribution
Venkateswaran Rajagopalan was responsible for designingthe study, data collection, processing, analysis, and writingthe paper. Erik P. Pioro was responsible for conceiving thestudy, data collection, and significant revision of the paper.

6 BioMed Research International
Acknowledgments
The authors thank all the patients and their caregivers whoparticipated in this study. Support of this work was throughfunding from the Bright Side of the Road Foundation, theFight ALS Fund, and the Frankino Foundation.
References
[1] S. Cluskey and D. B. Ramsden, “Mechanisms of neurodegener-ation in amyotrophic lateral sclerosis,”Molecular Pathology, vol.54, no. 6, pp. 386–392, 2001.
[2] G. P.Matte and E. P. Pioro, “Clinical features and natural historyin ALS patients with upper motor neuron abnormalities onconventional brain MRI,” Neurology, vol. 74, supplement 2, p.A216, 2010.
[3] B. R. Brooks, R. G. Miller, M. Swash, and T. L. Munsat,“El Escorial revisited: revised criteria for the diagnosis ofamyotrophic lateral sclerosis,”Amyotrophic Lateral Sclerosis andOther Motor Neuron Disorders, vol. 1, no. 5, pp. 293–299, 2000.
[4] B. R. Brooks, “Diagnostic dilemmas in amyotrophic lateral scle-rosis,” Journal of the Neurological Sciences, vol. 165, supplement1, pp. S1–S9, 1999.
[5] P. Kaufmann, S. L. Pullman, D. C. Shungu et al., “Objective testsfor upper motor neuron involvement in amyotrophic lateralsclerosis (ALS),” Neurology, vol. 62, no. 10, pp. 1753–1757, 2004.
[6] D. M. Mezzapesa, A. Ceccarelli, F. Dicuonzo et al., “Whole-brain and regional brain atrophy in amyotrophic lateral sclero-sis,” American Journal of Neuroradiology, vol. 28, no. 2, pp. 255–259, 2007.
[7] J. Kassubek, A. Unrath, H.-J. Huppertz et al., “Global brain atro-phy and corticospinal tract alterations inALS, as investigated byvoxel−based morphometry of 3−D MRI,” Amyotrophic LateralSclerosis and Other Motor Neuron Disorders, vol. 6, no. 4, pp.213–220, 2005.
[8] D. Neary, J. S. Snowden, L. Gustafson et al., “Frontotemporallobar degeneration: a consensus on clinical diagnostic criteria,”Neurology, vol. 51, no. 6, pp. 1546–1554, 1998.
[9] V. Rajagopalan and E. P. Pioro, “Distinct patterns of corticalatrophy in ALS patients with or without dementia: an MRIVBM study,” Amyotrophic Lateral Sclerosis & FrontotemporalDegeneration, vol. 15, no. 3-4, pp. 216–225, 2014.
[10] M. D. Phillips, R. I. Grossman, Y.Miki et al., “Comparison of T2lesion volume andmagnetization transfer ratio histogram anal-ysis and of atrophy and measures of lesion burden in patientswith multiple sclerosis,” American Journal of Neuroradiology,vol. 19, no. 6, pp. 1055–1060, 1998.
[11] V. Rajagopalan, G. H. Yue, and E. P. Pioro, “Brain white matterdiffusion tensor metrics from clinical 1.5T MRI distinguishbetween ALS phenotypes,” Journal of Neurology, vol. 260, no.10, pp. 2532–2540, 2013.
[12] R. Walhout, H.-J. Westeneng, E. Verstraete et al., “Corticalthickness in ALS: towards a marker for upper motor neuroninvolvement,” Journal of Neurology, Neurosurgery and Psychia-try, vol. 86, no. 3, pp. 288–294, 2015.
[13] A.Mechelli, C. Price, K. Friston, and J. Ashburner, “Voxel-basedmorphometry of the human brain: methods and applications,”CurrentMedical Imaging Reviews, vol. 1, no. 2, pp. 105–113, 2005.
[14] F. D. Juengling and J. Kassubek, “Standardized calculation ofbrain parenchymal fraction: an approach to objective assess-ment of cerebral atrophy,” American Journal of Neuroradiology,vol. 24, no. 7, pp. 1492–1493, 2003.

Submit your manuscripts athttp://www.hindawi.com
Stem CellsInternational
Hindawi Publishing Corporationhttp://www.hindawi.com Volume 2014
Hindawi Publishing Corporationhttp://www.hindawi.com Volume 2014
MEDIATORSINFLAMMATION
of
Hindawi Publishing Corporationhttp://www.hindawi.com Volume 2014
Behavioural Neurology
EndocrinologyInternational Journal of
Hindawi Publishing Corporationhttp://www.hindawi.com Volume 2014
Hindawi Publishing Corporationhttp://www.hindawi.com Volume 2014
Disease Markers
Hindawi Publishing Corporationhttp://www.hindawi.com Volume 2014
BioMed Research International
OncologyJournal of
Hindawi Publishing Corporationhttp://www.hindawi.com Volume 2014
Hindawi Publishing Corporationhttp://www.hindawi.com Volume 2014
Oxidative Medicine and Cellular Longevity
Hindawi Publishing Corporationhttp://www.hindawi.com Volume 2014
PPAR Research
The Scientific World JournalHindawi Publishing Corporation http://www.hindawi.com Volume 2014
Immunology ResearchHindawi Publishing Corporationhttp://www.hindawi.com Volume 2014
Journal of
ObesityJournal of
Hindawi Publishing Corporationhttp://www.hindawi.com Volume 2014
Hindawi Publishing Corporationhttp://www.hindawi.com Volume 2014
Computational and Mathematical Methods in Medicine
OphthalmologyJournal of
Hindawi Publishing Corporationhttp://www.hindawi.com Volume 2014
Diabetes ResearchJournal of
Hindawi Publishing Corporationhttp://www.hindawi.com Volume 2014
Hindawi Publishing Corporationhttp://www.hindawi.com Volume 2014
Research and TreatmentAIDS
Hindawi Publishing Corporationhttp://www.hindawi.com Volume 2014
Gastroenterology Research and Practice
Hindawi Publishing Corporationhttp://www.hindawi.com Volume 2014
Parkinson’s Disease
Evidence-Based Complementary and Alternative Medicine
Volume 2014Hindawi Publishing Corporationhttp://www.hindawi.com