research article development and … article development and characterization of a new set of...
TRANSCRIPT

RESEARCH ARTICLE
Development and characterization of a new
set of genomic microsatellite markers in rice
bean (Vigna umbellata (Thunb.) Ohwi and
Ohashi) and their utilization in genetic
diversity analysis of collections from North
East India
Banshanlang Iangrai1☯, Arunava Pattanayak1☯¤a*, D. Evanoreen Ann Khongwir1,
Gratify Pale1, Emica Mary Gatphoh1, Alpana Das1¤b, Nikhil Kumar Chrungoo2
1 Centre for Biotechnology, ICAR Research Complex for NEH Region, Umiam, Meghalaya, India,
2 Department of Botany, North Eastern Hill University, Shillong, Meghalaya, India
☯ These authors contributed equally to this work.
¤a Current address: ICAR-Vivekananda Parvatiya Krishi Anusandhan Sansthan, Almora, Uttarakhand, India.
¤b Current address: CPCRI Regional Centre, Guwahati, Assam, India.
Abstract
Rice bean [Vigna umbellate (Thumb.) Ohwi and Ohashi] is an underutilized crop believed to
be domesticated in the Myanmar-Thailand region of Asia. In India, rice bean is mainly culti-
vated in the North-Eastern Hills, which is a hotspot for biological diversity. A 5’ anchored
PCR was used to develop microsatellite markers in rice bean. Twenty-eight specific primer
pairs were designed and employed to characterize sixty five ricebean accessions collected
from North East India. A total of 179 alleles were amplified with an average of 6.393 alleles
per locus. The gene diversity was high (mean 0.534) in the accessions collected from Dar-
jeeling, Nagaland and Manipur, which are bordering areas with East Nepal and Myanmar,
respectively. Exceptionally high outcrossing rate was observed in the entire population.
Population structure analysis identified three distinct clusters in which accessions collected
from areas bordering Myanmar and East Nepal grouped separately. Using a combination of
STRUCTURE and Principal Coordinate Analysis, relative affinity of the intermediate acces-
sions could be established. However, differences in allelic counts among populations were
non-significant. The results showed that there is a high level of genetic diversity within the
accessions, with high outcrossing rate.
Introduction
Rice bean [Vigna umbellate (Thunb) Ohwi and Ohashi] is a less utilized grain legume culti-
vated mainly in Nepal, Bhutan, North East India up to Myanmar, Southern China, Northern
PLOS ONE | https://doi.org/10.1371/journal.pone.0179801 July 7, 2017 1 / 18
a1111111111
a1111111111
a1111111111
a1111111111
a1111111111
OPENACCESS
Citation: Iangrai B, Pattanayak A, Khongwir DEA,
Pale G, Gatphoh EM, Das A, et al. (2017)
Development and characterization of a new set of
genomic microsatellite markers in rice bean (Vigna
umbellata (Thunb.) Ohwi and Ohashi) and their
utilization in genetic diversity analysis of collections
from North East India. PLoS ONE 12(7): e0179801.
https://doi.org/10.1371/journal.pone.0179801
Editor: Manoj Prasad, National Institute of Plant
Genome Research, INDIA
Received: January 11, 2017
Accepted: June 5, 2017
Published: July 7, 2017
Copyright: © 2017 Iangrai et al. This is an open
access article distributed under the terms of the
Creative Commons Attribution License, which
permits unrestricted use, distribution, and
reproduction in any medium, provided the original
author and source are credited.
Data Availability Statement: All relevant data are
within the paper and its Supporting Information
files.
Funding: The author(s) received no specific
funding for the project.
Competing interests: The authors have declared
that no competing interests exist.
Thailand, Laos, Vietnam, Indonesia and East Timor [1]. It is mainly grown under shifting cul-
tivation and used as vegetable, pulse, fermented pulse, fodder and in folk medicine. It is one of
the eight Vigna species domesticated in Asia, and is very closely related to adzuki bean [V.
angularis(Willd.) Ohwi and Ohashi] [2,3,4]. The original center of domestication of the Asian
Vignaspecies is thought to be the Indo China region, and they belong to the subgenus Cerato-tropis, comprising 3 sections, Ceratotropis, Aconitifoliaeand Angulares. Angularesis the most
recent and diversified section of the subgenus [5], to which rice bean belongs. Rice bean is
believed to be domesticated from a wild form V. umbellate vargracilis, which is a cross fertile
type. These wild types have been reported to occur in natural and disturbed habitats and are of
indeterminate, photoperiod-sensitive, freely-branching, twining plant types with small seeds.
Most rice bean landraces cultivated in North Eastern India are similar to these wild types.
In India, as a cultigen its distribution is mainly confined to the tribal regions of North East-
ern hills and hilly tracts of Western and Eastern Ghats [6]. In the North Eastern Hill Region of
India (Arunachal Pradesh, Manipur, Meghalaya, Mizoram, Nagaland, Sikkim, and Tripura)
rice bean is grown predominantly under rainfed conditions in a mixed farming system, under
shifting cultivation or in kitchen gardens and backyards. It is grown on a limited scale in the
eastern and western peninsular tracts of India.
In a study of the genetics of domestication of rice bean, Isemura et al. [7] reported high col-
linearity between adzuki bean and rice bean in the order of molecular markers. Similarity in
the domestication genes between the genome of the two species was also reported in the same
study. They concluded that the elite genes of rice bean hold great potential for its improvement
as well as its allied species. However, improvement and utilization of rice bean through con-
ventional or molecular breeding still lag behind other crops like cowpea and mung bean in the
genus Vigna [8].Genetic diversity studies with a limited number of accessions from China,
Nepal and Thailand have been reported earlier [9,10,11]. Wang et al. [8] studied genetic diver-
sity in 230 accessions of rice bean collected from 12 provinces of China using mung bean
SSRs. They reported a clustered yet generalized distribution of the accessions suggesting a
wide exchange of germplasm across the provinces. However, the most comprehensive study so
far with a very wide range of cultivated and wild rice bean accessions is by Tian et al. [1]. They
studied 472 accessions (cultivated and wild) from 16 Asian countries and reported high gene
diversity (>0.5) in the South and South East Asian accessions. In all these studies, number of
Indian germplasm was negligible. Muthusamy et al. [12] studied genetic diversity in 10 rice
bean germplasm collected from Meghalaya, a North Eastern Himalayan state of India and
reported high genetic diversity. Studies of genetic diversity with a considerable number of
germplasm from Indian Himalayan region, where rice bean is mainly cultivated, has not been
conducted.
Simple sequence repeats (SSRs) or microsatellites are motifs of short tandem repeats that
may vary in the repeat units at a given locus. SSRs have specific advantages over other markers
as they occur frequently and randomly in all eukaryotic DNA [13], are multiallelic and are
amenable to both manual scoring and automation [14]. SSRs have been used in diversity anal-
ysis [15,16], genetic fidelity analysis [17], gene mapping and species identification [18] and
linkage analysis [19].
Among different crop species, the frequencies and occurrence of the two most common
dinucleotide repeats {(AC)n and (GA)n} have been worked out in relatively greater detail
[20]. Trinucleotide and tetranucleotide repeats are also found in plant genomes, the most fre-
quent among them being (AAG)n, and (AAT)n [13]. In another survey of published DNA
sequences in 54 plant species, Wang et al. [21] observed that the (AT)n, sequences were the
most abundant followed by (A)n, (AG)n, (AAT)n, (AAC)n, (AGC)n, (AAG)n, (AATT)n,
(AAAT)n and (AC)n.
Rice bean genetic diversity
PLOS ONE | https://doi.org/10.1371/journal.pone.0179801 July 7, 2017 2 / 18
Many different strategies for obtaining microsatellite DNA loci have been described. The
simplest approach; cloning small genomic fragments and using radiolabeled oligonucleotide
probes of microsatellite repeats to identify clones with microsatellites, was the first described
and work well in organisms with abundant microsatellite loci [22,23,24]. Unfortunately, this
approach does not work properly when microsatellite repeats are less abundant. Later, two
types of enrichment strategies were developed: 1) uracil-DNA selection [25] and 2) hybridiza-
tion capture [26,27]. Hybridization capture is the predominant strategy in use because it allows
selection prior to cloning, and therefore, is faster and easier to do with multiple samples than
uracil-DNA selection, which requires passage of each library through two bacterial strains.
With the availability of largescale sequence database, development of microsatellite markers
from expressed sequence tags (EST) has now become routine in many laboratories as it is fast
and does not require elaborate facilities. Introduction of high-throughput next-generation
DNA sequencing made development of microsatellite markers much easier and faster. While
the EST-based SSRs still suffer from the drawback that gene / genes not expressing at a particu-
lar organ / time are not included, high-throughput DNA sequencing requires substantial
investment. The 5’-anchored polymerase chain reaction [28,29] is one of the simplest and fast
methodsfor developing SSR enriched genomic libraries and subsequent isolation of microsat-
ellites that does not require substantial investment.
Materials and methods
Plant materials and DNA extraction
Sixty-five accessions of rice bean collected from six North Eastern Himalayan states of India
(Fig 1) were used for the study. All genotypes used for the diversity analysis are described in
Table 1. These were maintained at the Division of Plant Breeding (re-named Crop Improve-
ment), ICAR Research Complex for NEH Region, Umiam, Meghalaya. The total genomic
DNA was extracted from leaves of 14-day old seedlings (one per accession) using the Plant
DNA Isolation Kit (GCC Biotech, India) following the protocol of the manufacturer. DNA
sample concentration was determined using a NanoDrop2000 (Thermo Fisher Corporation
Inc.), and the DNA samples were diluted to 10 ng/μl prior to polymerase chain reaction (PCR)
amplification.
Microsatellite library construction by 5’ anchored PCR
A microsatellite library was constructed using the method of Fisher et al. [28]. Briefly, degener-
ate primers designed to anchor at the 5’ end of microsatellite sequences were used to amplify
genomic DNA. Di-repeated primers (PCT2 and PCT4) containing 7 degenerate bases at the 5’
end of repeats were comprised of i) PCT2 - [5’-KKVRVRV(CT)15−3’] and ii) PCT4 - [5’-KKRVRVR(CT)6−3’] (where K = G/T,V = G/C/A and R = G/A) were used in PCR amplifi-
cation to isolate a range of repeat motifs. PCR amplification was carried out in a total volume
of 20 μl containing 50 ng of template DNA, 2.5 mM MgCl2, 1 X PCR buffer containing 10 mM
Tris-HCl (pH = 8.0), 50 mM KCl, 1 unit Taq DNA Polymerase (Prime Taq, GCC Biotech,
India) 10 pmol of degenerate primer (PCT2/PCT4) and 0.2 mM of dATP, dGTP, dCTP and
dTTP. Amplification was carried out in a thermocycler (Genamp PCR 9700, Applied Biosys-
tem), with an initial denaturation of 94˚C for 3 minutes followed by 35 cycles of 94˚C for 30
secs, 58.4˚C (PCT2)/ 54.5˚C (PCT4) for 40 secs, one minute at 72˚C and a final extension step
of 72˚C for 5minutes. Successful amplification was confirmed by electrophoresing the PCR
products on 0.8% agarose gel with a 1kb ladder (GCC Biotech, India) as size standard. The
PCR products were afterwards purified using a PCR Purification Kit (GCC Biotech, India),
cloned into pGEM1-T vector (Promega, Madison, USA) and a library was made. One
Rice bean genetic diversity
PLOS ONE | https://doi.org/10.1371/journal.pone.0179801 July 7, 2017 3 / 18
hundred and twenty four random clones were then sequenced using Bigdye Terminator v3.1
Cycle Sequencing Ready Reaction kit (Thermo Fisher Corporation Inc.) on an ABI 310 genetic
analyzer. Microsatellite containing sequences and natures of microsatellites were identified
and analyzed using the software MISA [30] and specific primers were designed using Primer3
[31].
Marker analysis
Primer modelling was possible for 53 primers pairs, which were then synthesized (GCC Bio-
tech, India) and checked for amplification in a set of 12 accessions (2 from each population).
Twenty-eight primer pairs that consistently gave unambiguous scorable single bands in all the
12 accessions were later resynthesized with fluorescent labeling (S1 Table) on the forward
primer.
Fig 1. Geographic location of collection sites in the North Eastern Hills of India. The map used in the smaller
box is reprinted from http://www.d-maps.com/carte.php?num_car=24867&lang=en. following their policy of free use (S1
File). Original copyright holder d-maps3.com. The map of North Eastern part of India (larger box) has been taken from
the publication of National Atlas and Thematic Mapping Organization, Kolkata, India (original copyright holder). Circles
in the both the maps indicate area of collection. Black dots inside circles indicate approximate location of collection.
https://doi.org/10.1371/journal.pone.0179801.g001
Rice bean genetic diversity
PLOS ONE | https://doi.org/10.1371/journal.pone.0179801 July 7, 2017 4 / 18

Table 1. List of rice bean accessions used for genetic diversity analysis.
Sl
No
Name IC-No Collection location
1 BKSB-255 IC350170 Lapnan, Tirap District, Arunachal Pradesh
2 BKSB-268 IC0137143 Meghalaya (maintained from original collection BD-15-A)
3 BKSB-221 (local name–Tohja) IC350791 Jaintia Hills, Jaintia Hills District, Meghalaya
4 BKSB-202 IC351753 Rishi, West Sikkim District, Sikkim
5 Rhujon Lotha green IC423278 Agunto village, Zoneheboto District, Nagaland
6 RBS-16 IC0141073 Meghalaya (maintained from BD-16-A)
7 BKSB-168 IC351543 Teesta, Darjeeling District, West Bengal
8 BKSB-225 IC350817 Mynso village, Jaintia Hills District, Meghalaya
9 BKSB-48 IC298009 Peducha, Kohima District, Nagaland
10 BKSB-156 IC352953 Hawaivingtekpi, Imphal District, Manipur
11 RHIDI(N)-2 IC423291 Tizu, Zoneheboto District, Nagaland
12 BKSB-194 (Local name–Metho bean) IC351696 West Sikkim District, Sikkim
13 BKSB-164 (Local name–Seti bean) IC351514 Algarh, Darjeeling District, West Bengal
14 BKSB-192 IC351671 Teesta Bazar, Darjeeling District, West Bengal
15 BKSB-245 IC350124 Phanyal, Changlang District, Arunachal Pradesh
16 BKSB-214 IC350763 Umden Mission, Ri-Bhoi District, Meghalaya
17 BKSB-195 IC351702 Legship, East Sikkim District, Sikkim
18 BKSB-246 IC350125 Changlang, Changlang District, Arunachal Pradesh
19 BKSB-188 (local name–Moissaeum) IC351659 South Sikkim District, Sikkim
20 BKSB-233 IC350011 Miao, Changlang District, Arunachal Pradesh
21 BKSB-204 (Local name–Latera) IC351761 West Sikkim District, Sikkim
22 BKSB-201 (Local name–Kalimani) IC351748 West Sikkim District, Sikkim
23 BKSB-163 (Local name–Rato) IC351512 Darjeeling District, West Bengal
24 BKSB-160 (Local name–Gala Dal) IC351508 Darjeeling, Darjeeling District, West Bengal
25 BKSB-158 (Local name–Ransang) IC351502 Darjeeling District, West Bengal
26 RHIDI KEMAGH IC423239 Zoehnoboto, Zoehnoboto District, Nagaland
27 BKSB-70 (Local name–Bethe) IC298121 Sarchi, Manipur
28 BKSB-207 (Local name–Moisseum) IC351773 West Sikkim District, Sikkim
29 BKSB-46 (Kerhu– 2, black rice bean) IC298097 Kohima, Kohima District, Nagaland
30 BKSB-45 (Kerhu– 1, white rice bean) IC298096 Kohima, Kohima District, Nagaland
31 Jaluki (N) IC423321 Yisemyong, Mokokchung District, Nagaland
32 Chungata IC423323 Mongsinyini, Mokokchung District, Nagaland
33 BKSB-145 IC352930 Kakching, Thoubal District, Manipur
34 RHIDI KEKVA(N) IC423332 Mopongchukak, Mokokchung District, Nagaland
35 BKSB-184 (Local name–Bhatamash) IC351599 East Sikkim District, Sikkim
36 BKSB-220 IC350788 Phlongingkhw, Jaiantia Hills District, Meghalaya
37 BKSB-223 (Local name–Toh) IC350791 Jaiantia Hills District, Meghalaya
38 BKSB-182 IC351588 Sukna, Darjeeling District, West Bengal
39 BKSB-170 (Local name—Rato bean) IC351545 Darjeeling District, West Bengal
40 BKSB-166 (Local name–Thuli
bhatamash)
IC351534 Darjeeling District, West Bengal
41 BKSB-254 (Local name–Pinchari) IC350166 Changlang, Changlang District, Arunachal Pradesh
42 BKSB-36 RK-36, Local name–
Rajamoong)
IC0129076 Shillong, East Khasi Hills District, Meghalaya
43 BKSB-165 (Local name–Ketimausem) IC351529 Darjeeling District, West Bengal
44 BKSB-40 (Local name–Rumbaija) IC298091 East Khasi Hills District, Meghalaya
45 BK-07-05 (Local name–Mashiam dal) IC557283 East Sikkim District, Sikkim
(Continued )
Rice bean genetic diversity
PLOS ONE | https://doi.org/10.1371/journal.pone.0179801 July 7, 2017 5 / 18

Fluorescently-labeled microsatellite marker analysis
Individual PCR amplifications for each microsatellite were performed using the Genamp PCR
9700 thermocycler (Applied Biosystems.). The PCR amplification was carried out in a total
volume of 10 μl containing 10 ng of template genomic DNA, 1.5 mM MgCl2, 1 X PCR buffer
containing 10 mM Tris-HCl (pH = 8.0) and 50 mM KCl, 0.5 unit of Taq DNA Polymerase
(GCC Biotech, India), two pmol of flourscent dye labeled forward primer, two pmol of unla-
beled reverse primer and 0.1 mM of dATP, dGTP, dCTP and dTTP. The PCR profile was: 94o
C for 5 minutes followed by 35 cycles of 94o C for one minute, 50.0˚C- 60˚C (depending on
primer) for one minute, 72o C for two minutes, and a final extension step of 72˚C for 10min-
utes. The amplified PCR products were analyzed in an ABI Prism 310 genetic analyzer
(Thermo Fisher Corporation Inc.) using GeneScanTM -500 LIZ as size standard.
Statistical analysis
Alleles were manually assigned to regular fluorescence peaks, and the sizes of the alleles were
calibrated by the GeneMapper Software version 4.0 against GeneScanTM -500 LIZ Size Stan-
dard. Autobin v 0.9 software (Franck Salin, INRA Pierroton-UMR BIOGECO) was used to
analyze the raw data. For statistical analysis, the accessions were grouped into six population
viz. P1 = Arunachal Pradesh; P2 = Manipur; P3 = Nagaland, P4 = Sikkim; P5 = Darjeeling;
P6 = Meghalaya according to their geographic location (state of India except Darjeeling, which
is a district) of collection. Allelic patterns, analysis of molecular variance (AMOVA), principal
co-ordinate analysis (PCoA) and Nei [32] genetic distances were calculated using GenAlex
software [33]. Population wise expected (He) and observed (Ho) heterozygosity, f (fixation
Table 1. (Continued)
Sl
No
Name IC-No Collection location
46 BKSB-102 IC298153 Sumer, Ri-bhoi District, Meghalaya
47 RBS-24 (BKS, Local name–Rumbaija) IC0129056 Ri-Bhoi District, Meghalaya
48 MRB-4 (Elite line PISRB1) IC0557725 Meghalaya
49 MRB-6 (Elite line PISRB6) IC0557728 Meghalaya
50 BK-07-07 (Local name–Mashiam dal) IC557285 East Sikkim District, Sikkim
51 BK-07-20 (Local name–Mashiam dal) IC557298 West Sikkim District, Sikkim
52 RCRB-06-10 (white creamy ricebean) Selection from IC0015510 Meghalaya
53 RCRB-13 (Elite line) IC0112382 Meghalaya
54 RHIDI(N)-1 IC423364 Yimyu, Mokokchung, Nagaland
55 RBS-15 (Elite line BD-14-A) IC0015533 Meghalaya
56 RCRB-16 (Elite line) IC0112381 Meghalaya
57 RCRB-1-6 (Yellow creamy rice bean) Selection from IC0129056 Meghalaya
58 MRB-9 (Elite line BD-15-A) IC0137140 Meghalaya
59 BKSB-122 (Local name–
Chakwiachouba)
IC352853 Imphal East, Manipur
60 MNPL-3 No pedigree information
available
Entered in the All India Coordinated Trial in 2003 as an entry from
Manipur
61 BKSB-231 (Local name–Sarai) IC350008 Changlang District, Arunachal Pradesh
62 MRB-2 (Elite line PISRB2) IC0137141 Meghalaya
63 BKSB-200 IC351741 West Sikkim District, Sikkim
64 RBS-2 (Elite line BD-21-A) IC0144686 Meghalaya
65 BKSB-235 (Local name–Sarai) IC350031 Changlang District, Arunachal Pradesh
https://doi.org/10.1371/journal.pone.0179801.t001
Rice bean genetic diversity
PLOS ONE | https://doi.org/10.1371/journal.pone.0179801 July 7, 2017 6 / 18
index) values were calculated using gDA v1.0 software [34]. Out crossing rate was calculated
from fixation index using the equation t = (1-f)/(1+f)[1].The number of alleles/locus, major
allele frequency, gene diversity and PIC values were calculated using Power marker version
3.25 software [35]. Genetic distance was calculated using C.S. Chord distances, and phyloge-
netic tree was constructed based on neighbor joining (NJ) method as in the Power Marker
Software. The tree was viewed using the software Tree view v1.6.6 (http://taxonomy.zoology.
gla.ac.uk/rod/treeview.html). Population structure was analyzed using the software STRUC-
TURE V.2.3.4 [36,37] as described by Roy et al. [15] except that initially 40 replicate runs were
done for K = 1–12, and the second run was done at K = 3, K = 6 and K = 8 with 40 replications.
Finally, at K = 3, the membership co-efficient from the run with the highest LnP(D) value
(-3940.2) was used to assign the accessions to cluster 1–3 (SP1-3) based on their highest mem-
bership co-efficient for a cluster. Accessions with<0.6 membership co-efficient for all the clus-
ters were grouped as admixtures (SP4). For the structure clusters (SP1-4), allelic pattern,
genetic distance, AMOVA and PCoA were calculated using the GenAlEx V6.5 [33].For the
geographic location-based and Structure-based populations, significance of difference of allelic
count (FPTest) was tested using FPTestR software [38].
Results and discussion
Characterization of microsatellite loci
DNA sequencing of the clones indicated the presence of a total of 124 microsatellite repeats
(Table 2). Di-nucleotide repeats were the most abundant (79%) followed by penta-nucleotide
repeats (17.7%) and tri-nucleotide repeats (3.2%). CT (48.98%) and GA (46.9%) were the most
abundant type. Repeat units in the dinucleotide varied from 9–25 (both in AG). However, 16
units was the most common (40 in CT and 38 in GA). Among the pentanucleotides, TAAAAmotif was the most abundant (14 of 22). A total of 124 clones yielded fragments containing 49
dinucleotides, two trinucleotides and two pentanucleotides. Primer modelling was possible for
53 microsatellite loci out of which 28 microsatellite loci were found to give unambiguous scor-
able bands. These were selected for further analysis.
Details of the developed SSR primers with Tm, expected product size and dye labeling used
for our study are given in the S1 Table. All the SSRs showed polymorphism and average alleles
per locus (NA) was 6.39 (Table 3) within a range of 2 (VUCT 18) to 13 (VUCT 19). Gene
diversity ranged from 0.03 (VUCT26) to 0.784 (VUAG09) with a mean of 0.532. Observed het-
erozygosity ranged from 0.062 (VUGA 25) to 1.00 (VUTG 21) with a mean of 0.528. Mean
Table 2. Distribution of isolated microsatellite motifs in the identified microsatellites.
Motif Repeat unit No. of sequences
AG 9 02
AG 25 02
CT 10 06
CT 16 40
CT 17 02
GA 10 06
GA 16 38
GA 17 02
TTC 9 4
ATTTT 5 8
TAAAA 5 14
https://doi.org/10.1371/journal.pone.0179801.t002
Rice bean genetic diversity
PLOS ONE | https://doi.org/10.1371/journal.pone.0179801 July 7, 2017 7 / 18
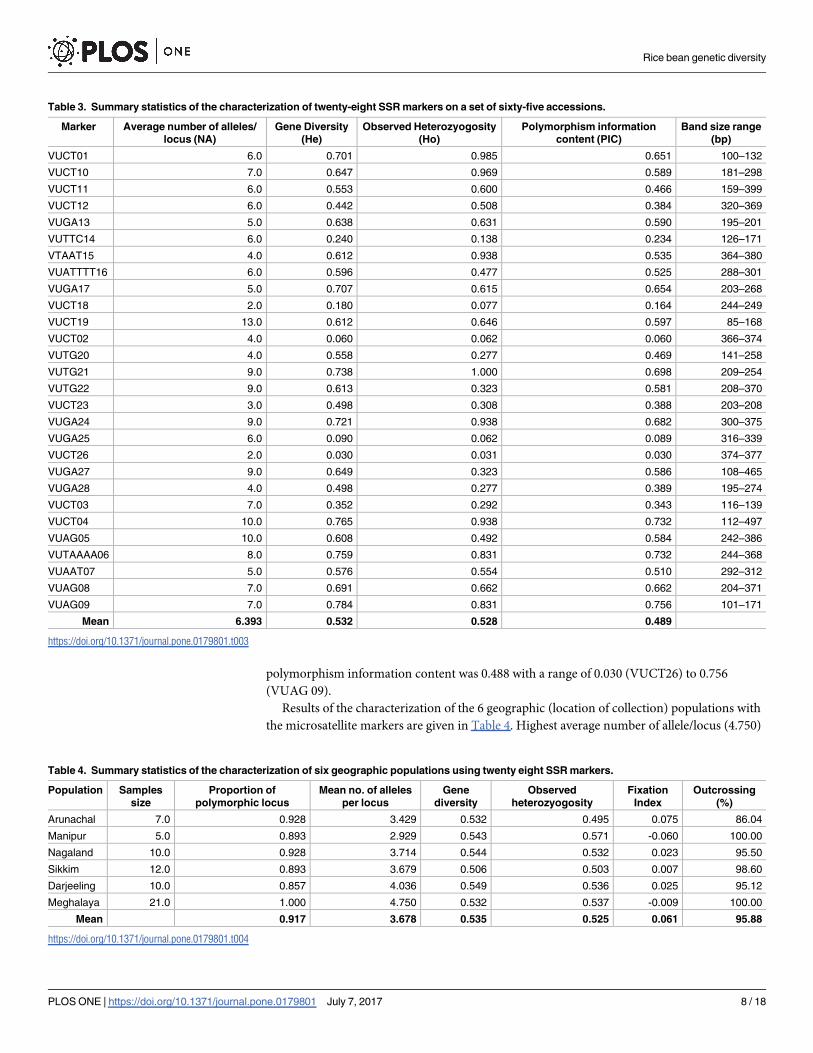
polymorphism information content was 0.488 with a range of 0.030 (VUCT26) to 0.756
(VUAG 09).
Results of the characterization of the 6 geographic (location of collection) populations with
the microsatellite markers are given in Table 4. Highest average number of allele/locus (4.750)
Table 3. Summary statistics of the characterization of twenty-eight SSR markers on a set of sixty-five accessions.
Marker Average number of alleles/
locus (NA)
Gene Diversity
(He)
Observed Heterozyogosity
(Ho)
Polymorphism information
content (PIC)
Band size range
(bp)
VUCT01 6.0 0.701 0.985 0.651 100–132
VUCT10 7.0 0.647 0.969 0.589 181–298
VUCT11 6.0 0.553 0.600 0.466 159–399
VUCT12 6.0 0.442 0.508 0.384 320–369
VUGA13 5.0 0.638 0.631 0.590 195–201
VUTTC14 6.0 0.240 0.138 0.234 126–171
VTAAT15 4.0 0.612 0.938 0.535 364–380
VUATTTT16 6.0 0.596 0.477 0.525 288–301
VUGA17 5.0 0.707 0.615 0.654 203–268
VUCT18 2.0 0.180 0.077 0.164 244–249
VUCT19 13.0 0.612 0.646 0.597 85–168
VUCT02 4.0 0.060 0.062 0.060 366–374
VUTG20 4.0 0.558 0.277 0.469 141–258
VUTG21 9.0 0.738 1.000 0.698 209–254
VUTG22 9.0 0.613 0.323 0.581 208–370
VUCT23 3.0 0.498 0.308 0.388 203–208
VUGA24 9.0 0.721 0.938 0.682 300–375
VUGA25 6.0 0.090 0.062 0.089 316–339
VUCT26 2.0 0.030 0.031 0.030 374–377
VUGA27 9.0 0.649 0.323 0.586 108–465
VUGA28 4.0 0.498 0.277 0.389 195–274
VUCT03 7.0 0.352 0.292 0.343 116–139
VUCT04 10.0 0.765 0.938 0.732 112–497
VUAG05 10.0 0.608 0.492 0.584 242–386
VUTAAAA06 8.0 0.759 0.831 0.732 244–368
VUAAT07 5.0 0.576 0.554 0.510 292–312
VUAG08 7.0 0.691 0.662 0.662 204–371
VUAG09 7.0 0.784 0.831 0.756 101–171
Mean 6.393 0.532 0.528 0.489
https://doi.org/10.1371/journal.pone.0179801.t003
Table 4. Summary statistics of the characterization of six geographic populations using twenty eight SSR markers.
Population Samples
size
Proportion of
polymorphic locus
Mean no. of alleles
per locus
Gene
diversity
Observed
heterozyogosity
Fixation
Index
Outcrossing
(%)
Arunachal 7.0 0.928 3.429 0.532 0.495 0.075 86.04
Manipur 5.0 0.893 2.929 0.543 0.571 -0.060 100.00
Nagaland 10.0 0.928 3.714 0.544 0.532 0.023 95.50
Sikkim 12.0 0.893 3.679 0.506 0.503 0.007 98.60
Darjeeling 10.0 0.857 4.036 0.549 0.536 0.025 95.12
Meghalaya 21.0 1.000 4.750 0.532 0.537 -0.009 100.00
Mean 0.917 3.678 0.535 0.525 0.061 95.88
https://doi.org/10.1371/journal.pone.0179801.t004
Rice bean genetic diversity
PLOS ONE | https://doi.org/10.1371/journal.pone.0179801 July 7, 2017 8 / 18

was observed in the Meghalaya population while the lowest (2.929) was in the Manipur popu-
lation. Gene diversity was highest (0.549) in the population from Darjeeling followed by popu-
lations from Nagaland and Manipur (0.544 and 0.543 respectively). It was the lowest in the
Sikkim population (0.506). Observed heterozygosity (Ho) was highest in the Manipur popula-
tion (0.571) and lowest in the Arunachal population (0.495).Mean out crossing was 95.88%.
Allelic patterns across the six populations are presented in Table 5. Number of alleles with a
frequency of>5% were lower than the number of different alleles (alleles/locus) in the Sikkim
(Pop5) and Meghalaya (Pop6) populations. Shannon’s Information Index (I) and alleles spe-
cific to a population (private allele) were the highest in the Meghalaya population (1.019 and
0.929 respectively, Table 5). Primers 17, 18, and 20 showed the highest number of private allele
(4 each) while primer 1 and 5 showed the lowest number of private allele (1 each). Highest
number of private allele was seen in the genotypes 28, 31, 60 and 64 (3 each).Principal coordi-
nate Analysis (PCoA) showed that the 65 genotypes could be divided amongfour groups (Fig
2A). Manipur (Pop2) and Darjeeling (Pop5) populations showed clustering in two distinctly
separated groups. First three axes of the coordinate described 28.32% of the variation.
AMOVA showed that 98% of the variance was within population variance (Fig 2B).
Analysis of the population using the model-based approach of the STRUCTURE software
indicated the presence of structured population. Initially, the analysis was performed for evalu-
ating 1 to 10 clusters (K) with five replicated runs per K value. ‘Structure Harvester’ program
(http://taylor0.biology.ucla.edu/) was used to determine the optimum K value based on both
LnP(D) and Evanno’sΔK[39]. Two peaks were obtained, one at K = 3 (major peak) and the
other at K = 5 (S1A Fig). Considering both the peaks, a second analysis was done with K = 2 to
6, length of burnin period 10,000, number of MCMC repeats 100,000, number of replicate
runs 10 and keeping other conditions the same. Analysis with the Structure Harvester program
produced a minor ΔK peak at K = 3 and a major peak at K = 5 (S1B Fig). To overcome this
problem, the method suggested by Gante et al. [40] was used with slight modification. For the
analysis, K = 1 to 12, burn in period 5000, MCMC repeats 50,000 and replicates 40 was were
used. Structure harvester produced a clear ΔK peak at K = 3 with the lowest SD value for LnP
(D). Two minor peakswere also seen atK = 6 and K = 8 (S2 Fig). Three further runs with K = 3,
6 and 8 were done keeping length of burnin period 10,000, MCMC repeats 100,000 and 40 rep-
licates. Analysis of results in the runs with the highest LnP(D) values showed that atK = 3,
nearly 50% of the accessions could be assigned to one of the three SPs considering a member-
ship coefficient of�0.6 for a SP. However, at K = 6 and K = 8, keeping the same parameter, no
accession could be assigned to several SPs. Therefore, the run with the highest LnP(D) value at
K = 3 was used for assignment of accessions to SPs.
Table 5. Mean values of allelic pattern of six geographic (collection location) populations.
Pop1 Pop 2 Pop 3 Pop 4 Pop 5 Pop 6
NA 3.429 2.929 3.714 3.679 4.036 4.750
Na Freq/ > = 5% 3.429 2.929 3.714 2.714 4.036 2.893
Ne 2.389 2.332 2.470 2.303 2.802 2.442
I 0.897 0.845 0.947 0.887 1.009 1.019
No. of private alleles 0.143 0.107 0.357 0.071 0.286 0.643
No. of Less com alleles (< = 50%) 0.714 0.321 0.536 0.714 0.893 0.929
NA = No. of different alleles; Na Freq/> = 5% = No. of different alleles with a frequency of > = 5%; Ne = No. of effective alleles; I = Shanon’s information
index.
Pop1 = Arunachal Pradesh; Pop2 = Manipur; Pop3 = Nagaland; Pop4 = Sikkim; Pop5 = Darjeeling; Pop6 = Meghalaya.
https://doi.org/10.1371/journal.pone.0179801.t005
Rice bean genetic diversity
PLOS ONE | https://doi.org/10.1371/journal.pone.0179801 July 7, 2017 9 / 18

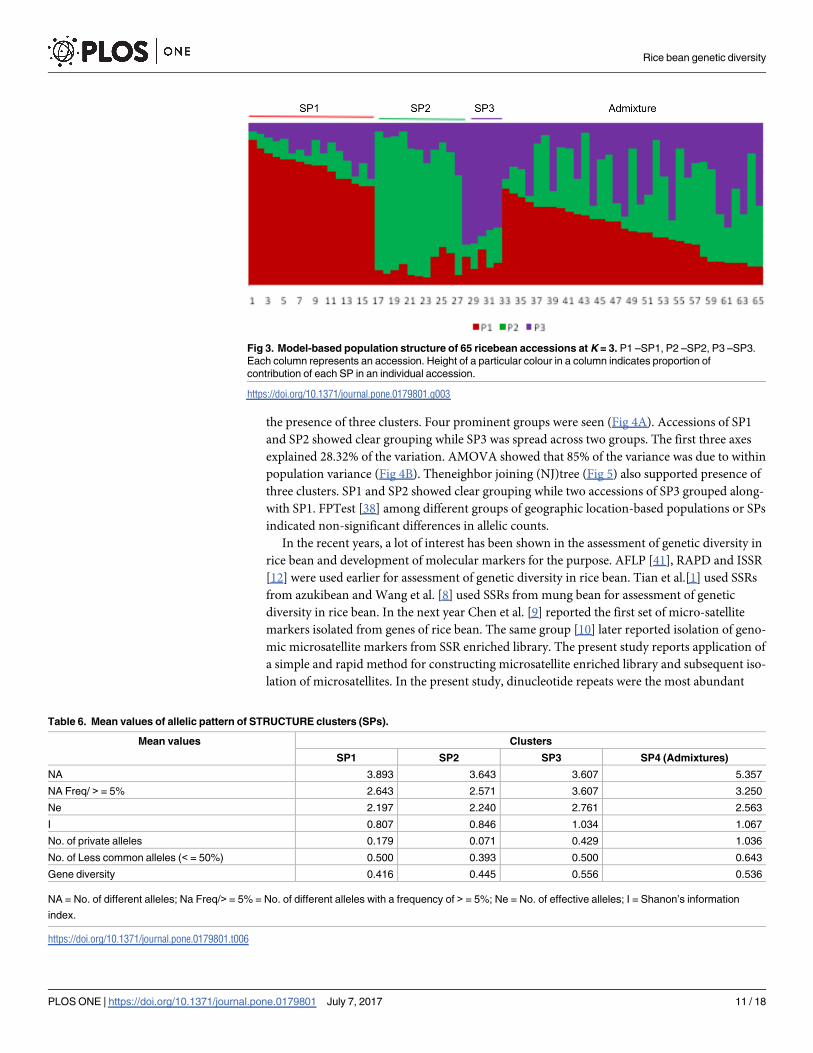
The LnP(D) and Evanno’sΔK method supported the presence of 3 clusters (K = 3), repre-
sented here as SP1, SP2 and SP3, respectively. The inferred population structure is given in the
Fig 3. SP1 contained 16 individuals (24.6% of the total accessions), dominated by accessions
from Meghalaya (5) and followed byNagaland, Sikkim, Darjeeling (3 each) and Arunachal Pra-
desh (2). However, no accession from Manipur was included in this cluster. SP2 contained 11
individuals (16.9% of the total) with 3 accessions each from Meghalaya and Sikkim and 2
accessions from Darjeeling. One accession each from Arunachal Pradesh, Manipur and Naga-
landwere also included in this cluster. SP3 was the smallest (5 accessions) representing 7.7% of
the accessions studied. Three accessions from Meghalaya and 1 each from Manipur and Naga-
land were included in this cluster.
The three clusters (SP1-SP3) had population specific Fst values (as calculated in STRUC-
TURE) of 0.400, 0.441 and 0.650, respectively with an average of 0.497indicating a low to mod-
erate difference among clusters. Net nucleotide distance among SPs was highest between SP1
and SP2 (0.130) and lowest between SP1 and SP3 (0.052). At K = 3, 32 accessions were admix-
ture (<0.6 membership co-efficient for any cluster).
Mean allele pattern across the SPs is given in Table 6. For this calculation, admixtures were
treated as a separate population (SP4). Allele frequency was highest in SP1 (3.893). Shanon’s
information index and number of private alleles were higher in the SP3. PCoA also supported
Fig 2. (a) Principal coordinate analysis of six geographic populations. Pop1 –Arunachal Pradesh, Pop2 –
Manipur, Pop3 –Nagaland, Pop4 –Sikkim, Pop5 –Darjeeling, Pop6 –Meghalaya. (b) Analysis of molecular
variance of six geographic populations.
https://doi.org/10.1371/journal.pone.0179801.g002
Rice bean genetic diversity
PLOS ONE | https://doi.org/10.1371/journal.pone.0179801 July 7, 2017 10 / 18
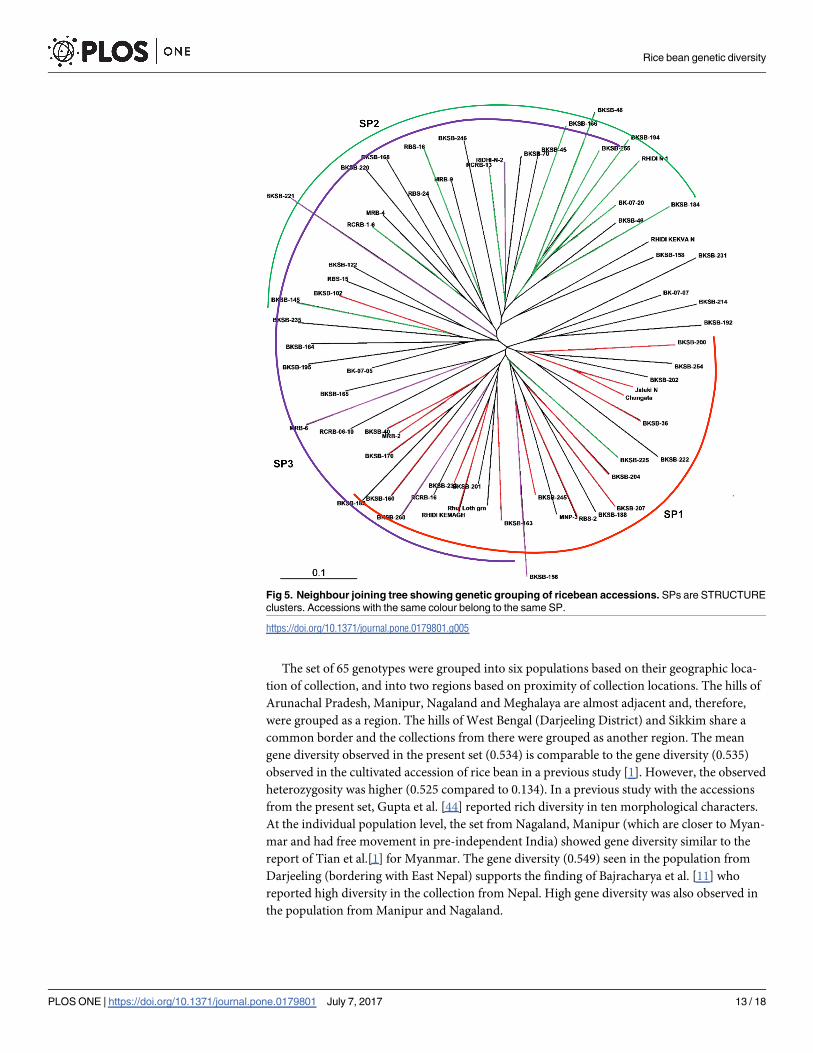
the presence of three clusters. Four prominent groups were seen (Fig 4A). Accessions of SP1
and SP2 showed clear grouping while SP3 was spread across two groups. The first three axes
explained 28.32% of the variation. AMOVA showed that 85% of the variance was due to within
population variance (Fig 4B). Theneighbor joining (NJ)tree (Fig 5) also supported presence of
three clusters. SP1 and SP2 showed clear grouping while two accessions of SP3 grouped along-
with SP1. FPTest [38] among different groups of geographic location-based populations or SPs
indicated non-significant differences in allelic counts.
In the recent years, a lot of interest has been shown in the assessment of genetic diversity in
rice bean and development of molecular markers for the purpose. AFLP [41], RAPD and ISSR
[12] were used earlier for assessment of genetic diversity in rice bean. Tian et al.[1] used SSRs
from azukibean and Wang et al. [8] used SSRs from mung bean for assessment of genetic
diversity in rice bean. In the next year Chen et al. [9] reported the first set of micro-satellite
markers isolated from genes of rice bean. The same group [10] later reported isolation of geno-
mic microsatellite markers from SSR enriched library. The present study reports application of
a simple and rapid method for constructing microsatellite enriched library and subsequent iso-
lation of microsatellites. In the present study, dinucleotide repeats were the most abundant
Fig 3. Model-based population structure of 65 ricebean accessions at K = 3. P1 –SP1, P2 –SP2, P3 –SP3.
Each column represents an accession. Height of a particular colour in a column indicates proportion of
contribution of each SP in an individual accession.
https://doi.org/10.1371/journal.pone.0179801.g003
Table 6. Mean values of allelic pattern of STRUCTURE clusters (SPs).
Mean values Clusters
SP1 SP2 SP3 SP4 (Admixtures)
NA 3.893 3.643 3.607 5.357
NA Freq/ > = 5% 2.643 2.571 3.607 3.250
Ne 2.197 2.240 2.761 2.563
I 0.807 0.846 1.034 1.067
No. of private alleles 0.179 0.071 0.429 1.036
No. of Less common alleles (< = 50%) 0.500 0.393 0.500 0.643
Gene diversity 0.416 0.445 0.556 0.536
NA = No. of different alleles; Na Freq/> = 5% = No. of different alleles with a frequency of > = 5%; Ne = No. of effective alleles; I = Shanon’s information
index.
https://doi.org/10.1371/journal.pone.0179801.t006
Rice bean genetic diversity
PLOS ONE | https://doi.org/10.1371/journal.pone.0179801 July 7, 2017 11 / 18

motif (79%) as was reported earlier (81.6%) by Wang et al. [10]. However, in the study with
genic SSRs [9], dinucleotide repeats were much lower (26.8%). Thus, it appears that in the
genomic SSRs dinucleotide is the most abundant class. Nevertheless, the repeat motif (CT/GA)
was somewhat similar to the previous reports on genic SSRs (AG/CT) of rice bean [9] and
mung bean [42]. In the genomic SSRs, AC/GTwas reported to be the most frequent type [10].
The proportion of the pentanucleotide class (17.7%), as seen in this studyis higher than all pre-
vious studies (0.27 in genic and 0.5% in genomic SSRs respectively). Comparison of the results
obtained by us and in the previous studies suggested that both class and motif of SSRs at inter
and intragenic sequences are different, which may be due to their distinctive roles at these two
levels.
Average numbers of alleles per locus amplified by the primers reported here are more com-
pared to previously reported SSRs from rice bean (6.39 alleles compared to 3 in genic and a
maximum of 4 alleles in genomic SSRs) and azuki bean [43]. However, this is much lower
compared to the average 12.9 alleles reported by Tian et al. [1] while using azukibean SSRs.
The reason for this probably lies in the fact that rice bean SSRs were tested on a set of germ-
plasm collected from a specific area while the azukibean SSRs were tested on a global set,
including wild types. PIC values of the present set of SSRs (0.488) is also lower than the azuki-
bean SSRs (0.57) tested on the global set [1].
Fig 4. (a) Principal coordinate analysis of STRUCTURE clusters showing four prominent groups. Pop1 –
Cluster 1 (SP1), Pop2 –Cluster 2 (SP2), Pop3 –Cluster 3 (SP3), Pop4 –Admixtures (SP4). (b) Analysis of
molecular variance of STRUCTURE clusters (SPs).
https://doi.org/10.1371/journal.pone.0179801.g004
Rice bean genetic diversity
PLOS ONE | https://doi.org/10.1371/journal.pone.0179801 July 7, 2017 12 / 18
The set of 65 genotypes were grouped into six populations based on their geographic loca-
tion of collection, and into two regions based on proximity of collection locations. The hills of
Arunachal Pradesh, Manipur, Nagaland and Meghalaya are almost adjacent and, therefore,
were grouped as a region. The hills of West Bengal (Darjeeling District) and Sikkim share a
common border and the collections from there were grouped as another region. The mean
gene diversity observed in the present set (0.534) is comparable to the gene diversity (0.535)
observed in the cultivated accession of rice bean in a previous study [1]. However, the observed
heterozygosity was higher (0.525 compared to 0.134). In a previous study with the accessions
from the present set, Gupta et al. [44] reported rich diversity in ten morphological characters.
At the individual population level, the set from Nagaland, Manipur (which are closer to Myan-
mar and had free movement in pre-independent India) showed gene diversity similar to the
report of Tian et al.[1] for Myanmar. The gene diversity (0.549) seen in the population from
Darjeeling (bordering with East Nepal) supports the finding of Bajracharya et al. [11] who
reported high diversity in the collection from Nepal. High gene diversity was also observed in
the population from Manipur and Nagaland.
Fig 5. Neighbour joining tree showing genetic grouping of ricebean accessions. SPs are STRUCTURE
clusters. Accessions with the same colour belong to the same SP.
https://doi.org/10.1371/journal.pone.0179801.g005
Rice bean genetic diversity
PLOS ONE | https://doi.org/10.1371/journal.pone.0179801 July 7, 2017 13 / 18

Nature of the accessions
Most of the rice bean cultivated in the North Eastern Himalayas are similar to wild types in
morphological traits except for some from Manipur (viz. MNPL3 used in this study), which
are bold seeded. However, rice bean is seldom maintained as a perineal crop. The f (fixation
index) values obtained in the 6 geographic location-based populations indicate an exception-
ally high out crossing rate, which needs further investigation. Furthermore, the low inter popu-
lation variation and non-significant differences in allelic counts are probably because of the
high outcrossing rate. It is interesting to note that the Manipur population, and the Darjeeling
population mostly grouped separately in the PCoA. The Nagaland and Meghalaya populations
(Pop3 and Pop6 respectively) showed a tendency to group in these two groups. Half of the Sik-
kim (bordering Darjeeling) population (Pop 4) also showed grouping with the Darjeeling pop-
ulation. Manipur is an Indian State bordering with Myanmar (Fig 1) while Darjeeling is a
bordering district with East Nepal. In a previous study [1], Myanmar and Nepalese popula-
tions were reported to group separately. In the STRUCTURE grouping, almost half of the
accessions from Arunachal Pradesh, Nagaland, Darjeeling and Sikkim were spread across SP1
and SP2 along with 50% of the accessions from Meghalaya. On the other hand, only one of the
accession from Manipur was included in SP2. In SP3, although accessions from Manipur,
Nagaland and Meghalaya were included, Arunachal, Sikkim and Darjeeling were unrepre-
sented. It appears that the rice bean population of North Eastern Indian Himalaya is probably
related with populations in Nepal and Myanmar as the collections from bordering areas
grouped separately. To understand this better, another PCoA (S3 Fig) with the same data was
conducted where the admixtures were further grouped into three clusters based on their high-
est membership coefficient (SP4 –for accessions showing highest membership coefficient for
SP1 and so on). Results showed that majority of the admixtures grouped with SP1 and SP3
while a small part of it grouped with few accessions of SP2. As seen from the accession details,
the pure SP2 is represented by accessions from Darjeeling, Sikkim (both bordering Nepal),
Meghalaya and Nagaland. The accessions of SP2 that grouped with admixtures are 3 from
Meghalaya and one from Manipur (bordering Myanmar). The part of the SP3 that grouped
with admixtures were one each from Manipur, Meghalaya and Nagaland and the part that
grouped with SP1 were all from Meghalaya. Seehalak et al. [41] suggested that rice bean was
probably domesticated in Myanmar and Northern Thailand. Tian et al. [1] detected some
unique alleles in Western Nepal and Indian Himalayan accessions, which were not detected in
Thai, Myanmar or other wild accessions. They indicated a possibility that the Himalayan
region may be a domestication center. Our results suggest that the accessions from North East-
ern Indian hills (region between Myanmar and Eastern Nepal) are probably related to the pop-
ulations of both Eastern Nepal and Myanmar. However, a further study with accessions from
Nepal, Myanmar and North East India would confirm this.
In summary, the study demonstrated that 5’ anchored PCR-based enrichment method is a
fast and reliable method for developing new SSR markers, and for a better understanding of
the nature of the admixtures identified by STRUCTURE software, PCoA is a valuable statistical
tool. This is also the first comprehensive genetic analysis of rice bean accessions from North
East Indian Himalayan region, which is considered as the center of diversity of many crops.
The results further showed that there is a high level of genetic diversity within the accessions
with exceptionally high outcrossing rate.
Supporting information
S1 Table. Characteristics of the twenty eight microsatellite primers isolated from V.
umbellata. Shown for each primer pairs are the forward and reverse sequences with the
Rice bean genetic diversity
PLOS ONE | https://doi.org/10.1371/journal.pone.0179801 July 7, 2017 14 / 18
flourochromes (6-FAM, NED, VIC and PET), repeat motif, annealing temperature and
expected product size when run individually. Genebank accession numbers of clones:
JQ839228.1 GI: 383479073 to JQ839255.1 GI: 383479100.
(DOCX)
S1 Fig. Delta K values of initial STRUCTURE analysis. (a)–Burnin period 5,000, MCMC
repeats 50,000, number of replicates 10, clusters 1–10. (b)—Burnin period 10,000, MCMC
repeats 100,000, number of replicates 10, clusters 2–6.
(TIFF)
S2 Fig. Delta K and Ln prob figures of the STRUCTURE analysis with a burnin period
5,000, MCMC repeats 50,000, number of replicates 40, clusters 1–12.
(TIFF)
S3 Fig. Principal coordinate analysis of STRUCTURE clusters and admixtures. Pop1 –SP1,
Pop2 –SP2, Pop–SP3, Pop4 –SP4 (highest membership coefficient for SP1), Pop5 –SP5 (high-
est membership coefficient for SP2), Pop5 –SP5 (highest membership coefficient for SP3).
(TIFF)
S1 File. Map permission.
(DOCX)
Acknowledgments
We thank Dr. S. V. Ngchan, Director, ICAR Research Complex for NEH Region for providing
all facilities including chemicals, consumables, farm and manpower. We are indebted to H.
Ahmed, J. Das, S. Singh, N. L. Chetri and Mahesh for their help in the field. We also acknowl-
edge the support of Indian Council of Agricultural Research, New Delhi through NATP in
which majority of the accessions were collected. The authors wish to thank the unknown
reviewers whose critical evaluation helped to improve the manuscript.
Author Contributions
Conceptualization: Banshanlang Iangrai, Arunava Pattanayak.
Data curation: Banshanlang Iangrai, Arunava Pattanayak.
Formal analysis: Banshanlang Iangrai, Arunava Pattanayak.
Investigation: Banshanlang Iangrai, D. Evanoreen Ann Khongwir, Gratify Pale, Emica Mary
Gatphoh, Alpana Das.
Methodology: Banshanlang Iangrai, Arunava Pattanayak.
Project administration: Banshanlang Iangrai, Arunava Pattanayak, Nikhil Kumar Chrungoo.
Resources: Banshanlang Iangrai, Arunava Pattanayak.
Software: Banshanlang Iangrai, Arunava Pattanayak.
Supervision: Banshanlang Iangrai, Arunava Pattanayak, Nikhil Kumar Chrungoo.
Validation: Banshanlang Iangrai, Arunava Pattanayak, Nikhil Kumar Chrungoo.
Visualization: Banshanlang Iangrai, Arunava Pattanayak, Alpana Das, Nikhil Kumar
Chrungoo.
Writing – original draft: Banshanlang Iangrai, Arunava Pattanayak.
Rice bean genetic diversity
PLOS ONE | https://doi.org/10.1371/journal.pone.0179801 July 7, 2017 15 / 18

Writing – review & editing: Banshanlang Iangrai, Arunava Pattanayak.
References1. Tian J, Isemura T, Kaga A, Vaighan DA, Tomooka N. Genetic diversity of the rice bean (Vignaumbel-
lata) as assessed by SSR markers. Genome. 2013; 56: 717–727. https://doi.org/10.1139/gen-2013-
0118 PMID: 24433207
2. Kaga A, Ohnishi M, Ishii T, Kamijima O. A genetic linkage map of azuki bean constructed with molecular
and morphological markers using an interspecific population (Vignaangularisx V. nakashimae). Theor.
Appl. Genet. (1996); 93: 658–663. https://doi.org/10.1007/BF00224059 PMID: 24162391
3. Tomooka N, Vaughan DA, Moss H, Maxted N. The Asian Vigna genus Vigna subgenus Creatotropis
genetic resources. Kluwer Academic Publishers, Dordrecht, the Netherlands. (2002).
4. Toomaka N, Kaga A, Vaughan DA. The Asian Vigna (Vigna subgenus Creatropis) biodiversity and evo-
lution. In Plant Genome: biodiversity and evolution. Edited by Sharma A. K. and Sharma A. Science
Publishers, Enfield, N. H. (2006); pp 87–126.
5. Doi K, Kaga A, Tomooka N, Vaughan DA. Molecular phylogeny of Vigna subgenus Ceratotropis based
on rDNA ITS and atpB-rbcL intergenic spacer of cpDNA sequences. Genetics. (2002); 114: 129–145.
6. Arora RK, Chandel KPS, Pant KC, Joshi BS. Rice Bean- A tribal pulses of Eastern India. (1980); 34:
260–263.
7. Isemura T, Kaga A, Tomooka N, Shimizu T, Vaughan DA. The genetics of domestication of rice bean,
Vigna umbellate. Ann. Bot. (2010); 106(6): 927–944. https://doi.org/10.1093/aob/mcq188 PMID:
20880934
8. Wang LX, Chen LH, Bai P, Wu JX, Wang SH, Blair MW, et al. The transferability and polymorphism of
mung bean SSR markers in rice bean germplasm. Mol. Breed. (2015); 35(2):1–10. https://doi.org/10.
1007/s11032-015-0280-y
9. Chen H, Chen X, Tian J, Yang Y, Liu Z, Hao X,et al. Development of gene-based SSR markers in rice
bean (Vigna umbellate L.) based on transcriptome data. PLoS ONE. (2016); 11(3): 1–13. https://doi.
org/10.1371/jpurnal.pone.0151040
10. Wang L, Kim KD, Gao D, Chen H, Wang S, Lee S, et al. Analysis of simple sequence repeats in rice
bean (Vigna umbellate) using an SSR-enriched library. The Crop J. (2016); 4: 40–47. https://doi.org/
https://doi.org/10.1016/j.cj.2015.09.004
11. Bajracharya J, Singh S, Dangol B, Hollington PA, Witcombe JR. Molecular marker diversity in Nepalese
and Indian rice bean germplasm. Europian Commission 6th Framework Programme Report 7. Food
security through Rice bean Research in India and Nepal (FOSRIN), Nepal Agricultural Research Coun-
cil, Kathmandu, Nepal and Centre for Advanced Research in International Agricultural Development,
College of Natural Sciences, Bangor University, Bangor, Wales, UK. (2010); Available at http://www.
ricebean.org/deliverables/deliverable%207%20%20molecular%20diversity.pdf (accessed on 7th Janu-
ary, 2017).
12. Muthusamy S, Kanagarajan S, Ponnusamy S. Efficiency of RAPD and ISSR markers system in assess-
ing genetic variation of rice bean (Vigna umbellate) landraces. Electron. J. Biotechnol. (2008); 11(3): 1–
10. https://doi.org/10.2225/vol11-issue3-fulltext-8
13. Gupta PK, Balyan HS, Sharma PC. Microsatellites in plants: a new class of molecular markers. Current
Sci. (1996); 70(1): 45–54.
14. Powell W, Mackray GC, Provan J. Polymorphism revealed by simple sequence repeats. Trends in Plant
Sci. (1996); 1: 215–222.
15. Roy S, Banerjee A, Mawkhleing B, Misra AK, Pattanayak A, Harish GD, et al. Genetic diversity and pop-
ulation structure in aromatic and quality rice (Oryzasativa L.) land races from North East India. PLoS
ONE. (2015); 10(6): 1–13. https://doi.org/10.1371/journal.pone.0129607 PMID: 26067999
16. Tiwari KK, Singh A, Pattnaik S, Sandhu M, Kaur S. Identification of a diverse mini-core panel of Indian
rice germplasm based on genotyping using microsatellite markers. Plant Breed. (2015); 134(2): 164–
171.
17. Khate P, Pattanayak A, Iangrai B, Khongwir EA, Sarma BK. Fertile plant regeneration from cryopre-
served calli of Oryzarufipogon Griff. and assessment of variation in the progeny of regenerated plants.
Plant Cell Rep. (2009); 29: 1423–1433.
18. Shirasawa K, Hirakawa H. DNA marker applications to molecular genetics and genomics in tomato.
Breed. Sci. (2013); 63(1): 21–30. https://doi.org/10.1270/jsbbs.63.21 PMID: 23641178
19. Temnykh S, Park WD, Ayres N, Cartinhour S, Hauck N, Lipovich L, et al. Mapping and genome organi-
zation of microsatellite sequences in rice (Oryza sativa L.).Theor. Appl. Genet. (2000); 100(5): 697–
712.
Rice bean genetic diversity
PLOS ONE | https://doi.org/10.1371/journal.pone.0179801 July 7, 2017 16 / 18

20. Qin Z, Wang Y, Wang Q, Li A, Hou F, Zhang L. Evolution analysis of simple sequence repeats in plant
genome. PLoSONE. (2015); 10(12): https://doi.org/https://doi.org/10.1371/journal.pone.0144108
21. Wang Z, Weber JL, Zhong G. Survey of plant short tangem DNA repeat. Theor. Appl. Genet. (1994);
88(1): 1–6. https://doi.org/10.1007/BF00222386 PMID: 24185874
22. Tautz D. Hypervariability of simple sequences as a general source for polymorphic DNA markers.
Nucleic Acids Res. (1989); 17: 6463–6471. PMID: 2780284
23. Weber JL, May PE. Abundant class of human DNA polymorphisms which can be typed using the poly-
merase chain reaction. American J. Human Genet. (1989); 44:388–396.
24. Weissenbach J, Gyapay G, Dib C, Vignal A, Morissette J, Millasseau P, et al. A second-generation link-
age map of the human genome. Nature. (1992); 359(6398): 794–801. https://doi.org/10.1038/
359794a0 PMID: 1436057
25. Ostrander EA, Jong PM, Rine J, Duyk G. Construction of small-insert genomic DNA libraries highly
enriched for microsatellite repeat sequences. Proc. Nat. Acad. Sci., USA. (1992); 89:3419–3423.
26. Kandpal RP, Kandpal G, Weissman SM. Construction of libraries enriched for sequence repeats and
jumping clones, and hybridization selection for region-specific markers. Proc. Nat. Acad. Sci., USA.
(1994); 91: 88–92.
27. Kijas JMH, Fowler JCS, Garbett CA, Thomas MR. Enrichment of microsatellites from the citrus genome
using biotinylated oligonucleotide sequences bound to streptavidin-coated magnetic particles. BioTech-
niques. (1994); 16: 656–662. PMID: 8024786
28. Fisher PJ, Gardner RC, Richardson TE. Single locus microsatellites isolated using 5’ anchored PCR.
Nucleic Acids Res. (1996); 24(21): 4369–4371. PMID: 8932400
29. Ling LP, Adibah AB, Tan SG, Christianus A, Faridah QZ. Isolation by the 5’anchored PCR technique
and characterizationof eighteen microsatellite loci in the horseshoe crab (Tachypleusgigas). J. Genet.
(2011); 90:101–104. Online only: http://www.ias.ac.in/jgenet/OnlineResources/90/e101.pdf.
30. Thiel T, Michalek W, Varshney RK, d Graner A. Exploiting EST databases for the development and
characterization of gene-derived SSR-markers in barley (Hoedeum vulgare L.). Theor. Appl. Genet.
(2003); 106(3): 411–422. https://doi.org/10.1007/s00122-002-1031-0 PMID: 12589540
31. Untergrasser A, Cutcutache I, Koressaar T, Ye J, Faircloth BC, Remm M, et al. Primer3—new capabili-
ties and interfaces. Nucleic Acid Res. (2012); 40(15): 1–12.
32. Nei M, Tajima F, Tateno Y. Accuracy of estimated phylogenetic trees from molecular data. II. Gene fre-
quency data. J. Mol. Evol. (1983); 19(2): 153–170. PMID: 6571220
33. Peakall R, Smouse PE. GenAlEx 6.5: genetic analysis in Excel. Population genetic software for teach-
ing and research-an update. Bioinformatics. (2012); 28(19): 2537–2539. https://doi.org/10.1093/
bioinformatics/bts460 PMID: 22820204
34. Lewis PO, Zaykin D. Genetic Data Analysis: Computer program for the analysis of allelic data. Version
1.0 (d16c). (2001); Free program distributed by the authors over the internet from http://lewis.eeb.
uconn.edu/lewishome/software.html. (accessed on 7th January, 2017).
35. Liu K, Muse SV. POWERMARKER: an integrated analysis environment for genetic marker analysis.
Bioinformatics. (2005); 21: 2128–2129. https://doi.org/10.1093/bioinformatics/bti282 PMID: 15705655
36. Pitchard JK, Stephens M, Donnelly P. Inference of population structure using multilocus genotype data.
Genetics. (2000); 155(2): 945–959. PMID: 10835412
37. Hubisz MJ, Falush D, Stephens M, Pitchard JK. Inferring weak population structure with the assistance
of sample group information. Mol. Ecol. Resour. (2009); 9(5): 1322–1332. https://doi.org/10.1111/j.
1755-0998.2009.02591.x PMID: 21564903
38. Yang MH, Fu YB. An R version of FPTest for testing differences in allelic count. Conservation Genet.
Resour. (2016); https://doi.org/10.1007/s12686-016-0644-6
39. Evanno G, Regnaut S, Gaudt J. Detecting the number of cluster of individuals using the software
STRUCTURE: a simulation study. Mol. Ecol. 2005. 14(8): 2611–2620. https://doi.org/10.1111/j.1365-
294X.2005.02553.x PMID: 15969739
40. Gante HF, Doadrio I, Alves MJ, Dowling TE. Semi-permeable species boundaries in Iberian barbels
(Barbus and Luciobarbus, Cyprinidae). BMC Evolutionary Biology. (2015); 15:111. https://doi.org/10.
1186/s12862-015-0392-3 PMID: 26066794
41. Seehalak W, Tomooka N, Waranyuwat A, Thipyapong P, Laosuwan P, Kaga A, et al. Genetic diversity
of the Vigna germplasm from Thailand and neighbouring regions revealed by AFLP analysis. Genet.
Resour. Crop Evol. (2006); 53(5): 1043–1059.
42. Moe KT, Chung JW, Cho YI, Moon JK, Ku JH, Jung JK, et al. Sequence information on simple sequence
repeats and single neucleotide polymorphism through transcriptome analysis of mung bean. J. Integr.
Plant Biol. (2011); 53: 63–73. https://doi.org/10.1111/j.1744-7909.2010.01012.x PMID: 21205180
Rice bean genetic diversity
PLOS ONE | https://doi.org/10.1371/journal.pone.0179801 July 7, 2017 17 / 18
43. Chen H, Liu L, Wang L, Wang S, Wang ML, Cheng X. Development of SSR markers and assessment of
genetic diversity of adzuki bean in the Chinese germplasm collection. Mol. Breed. (2015); 35: 191.
https://doi.org/10.1007/s11032-015-0383-5
44. Gupta S, Kozak M, Sahay G, Durrai AA, Mitra J, Verma MR, et al. Genetic parameters of selection and
stability and identification of divergent parents for hybridization in rice bean (Vigna umbellataThunb.
(Ohwi and Ohashi)) in India. J. Agric. Sci. (2009); 147 (05): 581–588.
Rice bean genetic diversity
PLOS ONE | https://doi.org/10.1371/journal.pone.0179801 July 7, 2017 18 / 18