research article enhancing seismic capacity of pile...
TRANSCRIPT

Hindawi Publishing CorporationJournal of StructuresVolume 2013, Article ID 329130, 13 pageshttp://dx.doi.org/10.1155/2013/329130
Research ArticleEnhancing Seismic Capacity of Pile-Supported Wharves UsingYielding Dampers
Seyed Amin Mousavi and Khosrow Bargi
School of Civil Engineering, University of Tehran, P.O. Box 11365-4563, Tehran, Iran
Correspondence should be addressed to Seyed Amin Mousavi; [email protected]
Received 15 February 2013; Revised 5 May 2013; Accepted 13 May 2013
Academic Editor: Domenico Bruno
Copyright © 2013 S. A. Mousavi and K. Bargi. This is an open access article distributed under the Creative Commons AttributionLicense, which permits unrestricted use, distribution, and reproduction in any medium, provided the original work is properlycited.
This paper presents a numerical study on the seismic response of pile-supported wharves equipped with metallic yielding dampers.Using 20 ground acceleration records, the contribution of the yielding damper is examined, and its main parameters are optimizedthrough a parametric study. In the current study, considering coupling effects of different parameters, a new optimization procedureis proposed. The obtained results indicate that the stability condition of the retaining wall (quay wall) behind the wharf, periodof the soil-wharf system, and also maximum allowable ductility ratio of the damper are the key factors affecting the optimumdamper parameters. A simplified design guideline is proposed for either the design or the retrofit purposes followed by a numericalassessment to evaluate the contribution of the proposed damper on the seismic behavior of a typical pile-supported wharf. Theobtained results show that yielding dampers, through their nonlinear behavior, can dissipate a large portion of seismic input energyand mitigate piles damages which have been observed in earlier earthquake events.
1. Introduction
During an earthquake event liquefaction of saturated loosesandy soils and excessive piles drifts make the most commoncauses of damages to pile-supported wharves. Therefore, inabsence of liquefaction conditions, pile drift can be consid-ered as a suitable indicator in order to evaluate performanceof wharves under seismic events. Some techniques, whichrely on stiffness increasing, such as inclined piles, have beeninvestigated in earlier studies by Gerolymos et al. [1] andPoulos [2], as a method to reduce lateral displacementsof pile-supported wharves. Inclined piles have two maindrawbacks, high construction costs and punching failures intheir connections. As reported byOyenuga et al. [3], however,the punching failure problem can be moderated using a newdesign approach for pile-deck connections. Lehman et al. [4]have also improved performance of pile-wharf connections.In another study a novel stone column has been proposed byMageau andChin [5] to improve seismic behavior ofwharves.Using passive control techniques, this study tried to improvethe seismic behavior of pile-supported wharves.
Nowadays passive control methods have gained moreattention in order to mitigate natural or man-made struc-tural vibrations. Some of these passive techniques havebeen briefly described by Soong and Dargush [6]. Earlierstudies on passive control techniques have been commonlyrestricted to long period structures, such as tall buildings,long-span bridges, and offshore jacket platforms, to theauthors’ knowledge, passive energy dissipation devices havenot been investigated earlier for wharves. Among variouspassive dampers, metallic yielding damper seems to be moreappropriate as yielding dampers are easy to manufacture andneed no specific maintenance. To date, many studies havebeen devoted to yielding dampers [7–10]. However, they havemainly focused on building structures inwhich damperswerein conjunction with chevron braces.
Nowadays, with increasing ship sizes, berth deepeningseems to be inevitable and consequently a new generation ofpile-supported wharves would have relatively larger periods.Accordingly, the focus of this study is mainly on flexiblewharves. As depicted in Figure 1, stability conditions of theretaining wall would dictate themaximum allowable yielding

2 Journal of Structures
Metallic yielding damper
Soil layers
Water
Deck
Approach bridge
Backfill
Retaining wall
(a)
Deck
Approach bridge
Damper link
Yielding device
Shear key
Foam
Retaining wall
Backfill
(b)
Figure 1: Damper-wharf system.
force of the damper.Note that the yielding force of the dampercan be adjusted to very small values. In other words, during aseismic event, damper forces can be tuned to be far less thanthose imposed by other sources, such as backfill soil pressureor inertial force of the retaining wall. As a result, the dampercan be designed as if it has virtually no destructive effect onthe retaining wall. It should be elaborated that the retainingwall can be of any type, for example, gravity wall, caisson,sheet pile, and so forth. During this study, metallic yieldingdamper, metallic damper, yielding damper, and damper areall considered to have the samemeaning and are used insteadof each other.
2. Scope of the Current Study
Themain objective of the present study is tomitigate seismic-induced responses of pile-supported wharves using metallicyielding dampers that were placed between the deck andthe retaining wall (quay wall) in specific intervals along theshoreline, as illustrated in Figure 1. In the design procedure, itis very important to transmit the damper force to the groundwithin a safe load path. As a result, depending on residualcapacity of the retaining wall, there is a restriction on theallowable yielding force of the damper. As shown in Figure 1,the damper includes two parts, the yielding device and thedamper link. The damper link connects the yielding deviceto the wharf deck and the retaining wall. The link is very stiffdue to its short lengths and can be assumed to be rigid. Tooptimize different parameters of the damper, sets of valuesfor damper stiffness and yielding force are considered, andthe contribution of the damper for each of them is evaluated.
3. Optimization Procedure
In the optimization process, four single degree of freedom(SDOF) systems with periods of 0.4 s, 0.6 s, 0.8 s, and 1.0 s
are adopted and subjected to 20 digitized ground accel-eration records. It is assumed that, during an earthquake,displacements at the top of the retaining wall are the sameas those at the base of the wharf, that is, sea bed. In otherwords, displacements at the free end of the damper elementare the same as those at the base of the SDOF system,Figure 2. Accordingly, during the optimization process, theretaining wall is not modeled as there are numerous differentwalls with different dynamic characteristics, and it is notpractical to consider all possible wall conditions. Besides, thissimplification is reasonable as the period of the wharf is farabove than that of wall-soil system, especially in the case oflong periodwharveswhich are themain concern of this study.As a result, the wall-soil system can be assumed to be rigidcompared to the wharf. Besides, the sea bed is very closeto the top of the retaining wall, and it is possible to assumethat seismic waves hit these two points simultaneously.While there are some experimental evidence that validate theprevious assumptions [11, 12], in the Numerical Assessment,validity of this assumption would be also investigated. Threevalues of 0.05, 0.1, and 0.2 are adopted for yielding force-deckweight ratio, that is, the ratio of the damper yielding forceto weight of the SDOF system. In addition, for each SDOFsystem, different stiffness ratios, that is, ratio of the damperstiffness to the SDOF stiffness, are adopted according to theperiod of the SDOF system, as presented in Table 1. Stiffnessratios for each period are selected so that maximum ductilityratio of the damper falls in a reasonable range.
Note that a constant value of 0.03 is considered for thestrain hardening ratio of the damper material. As reportedby Xia and Hanson [7], strain hardening ratio has a littleinfluence on the behavior of yielding dampers.Therefore, thestrain hardening is excluded from the carried out parametricstudy. According to most codes of practice, such as OCDI[13], pile-supported wharves should be designed to remainmainly elastic during ultimate seismic excitations. As a result,

Journal of Structures 3
These excitations are assumed to be the same.
Imposed acceleration from the ground to the piles.
Mass of the wharf is mainly localized in its deck.
Lateral stiffness would be provided mainly through the piles.
Imposed acceleration from the retaining wall to the damper.
Metallic yielding damper
Stiffness depends on the considered period
Mass = 200 ton
Figure 2: SDOF-damper system that is used in the optimization process. Mass = 200 ton.
Period (s)
Average spectrum
Individual spectra
10
8
6
4
2
00 0.2 0.4 0.6 0.8 1 1.2 1.4 1.6 1.8 2
Four
ier a
mpl
itude
(m/s
)
(a)
Average spectrum
Individual spectra
Period (s)0 0.2 0.4 0.6 0.8 1 1.2 1.4 1.6 1.8 2
1.4
1.2
1
0.8
0.6
0.4
0.2
0Spec
tral
resp
onse
acce
lera
tion
(g)
(b)
Figure 3: (a) Fourier spectra of the considered earthquakes and (b) 5% damped spectral response acceleration of the considered earthquakes.
Table 1: Stiffness ratios which are considered for the SDOF systems.
Period of the SDOF system (s) Considered stiffness ratios0.4 0.5, 1, 2, 3, 40.6 1, 2, 3, 4, 50.8 2, 4, 6, 8, 101 4, 6, 8, 10, 12
in the optimization procedure behaviors of the adoptedSDOFs are assumed to be linear elastic.
4. Record Selection
As mentioned earlier, 20 digitized ground motion records,obtained from PEER database [14], are used in the opti-mization process. Adopted groundmotions have magnitudesgreater than 6, and they are selected such that their averagedFourier spectrum covers a broad band of periods of interest,that is, between 0.4 s and 1 s. Characteristics of these groundmotions are illustrated in the appendix. Moreover, frequencycontents and acceleration response spectra of these 20 dig-itized ground acceleration records are shown in Figure 3. Inthe optimization process, all of these ground accelerations arescaled to 0.3 g.
It should be elaborated that considering the lower PGAsis not necessary as the purpose of the damper is to remainelastic during moderate ground motions, and the mainconcern is only about extreme earthquake events. Notethat selected ground accelerations are not explicitly scaledaccording to their response spectrum the as effect of theirfrequency contents on the damper parameters would bealso investigated during the parametric study. Accordingto Figure 3 and Table 1, however, it is clear that most ofthe considered earthquakes would impose a high level ofresonance on the considered SDOF systems which is inagreement with the main philosophy of the spectrum-basedscaling technique.
5. Optimum Parameters ofthe Yielding Damper
Optimization of the damper parameters is not a straight-forward procedure. While higher damper stiffness woulddecrease deck displacement, it would also increase ductilitydemand of the damper. As a result, for a particular yieldingforce, higher stiffness values are not necessarily preferabledue to the limitation on maximum allowable ductility of thedamper.

4 Journal of Structures
Yiel
ding
forc
e-de
ck w
eigh
t rat
io0.2
0.15
0.1
0.050.5 1 1.5 2 2.5 3 3.5 4
0.35
0.4
0.45
0.50.55
0.6
0.650.7
Stiffness ratio
(a)
Yiel
ding
forc
e-de
ck w
eigh
t rat
io
0.2
0.15
0.1
0.050.5 1 1.5 2 2.5 3 3.5 4
Stiffness ratio
3
6
912
1518
21 24 27
(b)
Figure 4: (a) Mean maximum displacement ratio and (b) mean maximum ductility ratio, period = 0.4 s.
Yiel
ding
forc
e-de
ck w
eigh
t rat
io
0.2
0.15
0.1
0.051 1.5 2 2.5 3 3.5 4 4.5 5
0.36
0.4
0.440.48
0.520.56
0.60.64
Stiffness ratio
(a)
Yiel
ding
forc
e-de
ck w
eigh
t rat
io
0.2
0.15
0.1
0.051 1.5 2 2.5 3 3.5 4 4.5 5
24211815
129
6
3
Stiffness ratio
(b)
Figure 5: (a) Mean maximum displacement ratio and (b) mean maximum ductility ratio, period = 0.6 s.
In this study mean maximum displacement ratio ofeach SDOF system is considered as the optimization index,and the mean maximum ductility ratio is also obtainedfor different values of the damper parameters. The resultsare shown in Figures 4, 5, 6, and 7. Required analysis iscarried out by OpenSees, which has been developed byMazzoni et al. [15]. Giuffre-Menegotto-Pinto model [15] isalso adopted to simulate nonlinear behavior of the yieldingdamper. It should be clarified that, for each SDOF system,mean maximum displacement ratio is defined to be themean of the maximum displacement ratios with and withoutdamper, andmeanmaximumductility ratio is themean of themaximum damper ductility ratios for all 20 ground motionrecords. Note that the ductility ratio is the ratio of the damperdeformation to its yielding deformation such that it cannot besmaller than one.
As stated earlier, the retaining wall would determine theallowable yielding force of the damper. Therefore, optimumvalues of the damper parameters depend on the periodof the soil-wharf system, target maximum ductility ratioand stability conditions of the retaining wall. According toFigures 4–7, in the case of short period wharves and for
low stiffness ratios, by increasing the damper yielding forceno improvement would occur on the damper efficiency. Ingeneral, the efficiency of the damper always increases byincreasing the stiffness ratio; however, themaximumductilityratio of the damper would also increase. Based on earlierexperimental tests which have been reported by Xia andHanson [7], value of about 6 is well suited for the maximumductility ratio of a metallic yielding damper. As a result, otherparameters should be selected such that maximum ductilityratio of the damper remains close to 6.
Using resonance index concept, the effects of the fre-quency content on the damper efficiency and also on themaximum ductility ratio are investigated. Resonance index,as defined by Mousavi et al. [16], is the ratio of the Fourieramplitude corresponding to the period of the system to themaximum Fourier amplitude. Accordingly, if the value ofthe resonance index is close to one, the structure wouldexperience a high level of resonance, and, if its value is closeto zero, no noticeable resonance would occur. It should bepointed out that the term resonance in the current studyrefers to resonance of the first mode, and it would happenif the frequency content of the ground acceleration has high

Journal of Structures 5
Yiel
ding
forc
e-de
ck w
eigh
t rat
io0.2
0.15
0.1
0.05
0.32
0.36
0.4
0.44
0.480.520.56
0.6
2 3 4 5 6 7 8 9 10Stiffness ratio
(a)
Yiel
ding
forc
e-de
ck w
eigh
t rat
io
0.2
0.15
0.1
0.052 3 4 5 6 7 8 9 10
3
6
9
1215
18 2124 27 30
Stiffness ratio
(b)
Figure 6: (a) Mean maximum displacement ratio and (b) mean maximum ductility ratio, period = 0.8 s.
Yiel
ding
forc
e-de
ck w
eigh
t rat
io
0.2
0.15
0.1
0.05
0.3
0.33
0.36
0.39
0.420.45
0.480.510.54
4 5 6 7 8 9 10 11 12Stiffness ratio
(a)
Yiel
ding
forc
e-de
ck w
eigh
t rat
io
0.2
0.15
0.1
0.054 5 6 7 8 9 10 11 12
3
6
912
15 1821
24 27 30
Stiffness ratio
(b)
Figure 7: (a) Mean maximum displacement ratio and (b) mean maximum ductility ratio, period = 1.0 s.
Fourier amplitudes in frequencies close to the fundamentalfrequency of the structure.
As illustrated in Figure 8, the resonance index has affectedthe damper efficiency and its maximum ductility ratio in anirregular manner.This is mainly due to nonlinear behavior ofthe damper and different pulse arrangements of the consid-ered records. In other words, during an earthquake event, awharf-damper systemdoes not have a constant period, and itsperiod would be a time, dependent parameter. From Figure 8it is obvious that, in a general manner, by increasing theresonance index, the maximum ductility ratio increases, andthe RMS (root mean square) displacement ratio decreases.This result is quite reasonable as in the resonance conditionthe damper would have a greater effect on the response andconsequently would suffer greater damages (larger ductilitydemands).
According to the obtained results, using Matlab’s CurveFitting Toolbox [17], following relations for the stiffnessratio and its corresponding mean maximum displacementratio can be proposed. Note that in proposed relations theallowable maximum ductility ratio is restricted to 6:
SR = 0.875𝑒14.2𝛼𝑇, (1)
MR = (0.9 − 3.15𝛼) (1 − 0.15𝑇) , (2)
where SR is the stiffness ratio, MR represents the maximumdisplacement ratio, 𝛼 denotes the yielding force-deck weightratio, and 𝑇 stands for the period of the soil-wharf system(without damper).
In the case of yielding dampers, structural responsewould be reduced due to two reasons: (a) the energy dissipa-tion capability of the damper and (b) stiffness increasing dueto stiffness of the damper.While, in conventionalmethods [6,18], both of the previous effects have been considered in esti-mating the equivalent viscous damping, in this study a newapproach is proposed for evaluating the equivalent viscousdamping. In this method, using the maximum displacementratio, MR, and relevant response spectra, such as thoseproposed in FEMA-356 [19], the equivalent viscous dampingcan be estimated. According to the definition of MR, it ispossible to rewrite it as follows:
MR =𝑆𝑎eq
𝑆𝑎
, (3)
where 𝑆𝑎eq
and 𝑆𝑎are the spectral response accelerations of the
wharf with andwithout damper, respectively. HavingMR and

6 Journal of Structures
0.9
0.8
0.7
0.6
0.5
0.4
0.3
0.20 0.1 0.2 0.3 0.4 0.5 0.6 0.7
Resonance index
Case 1Case 2
RMS
disp
lace
men
t rat
io
(a)
16
14
12
10
8
6
4
20 0.1 0.2 0.3 0.4 0.5 0.6 0.7
Resonance index
Case 1Case 2
Max
imum
duc
tility
ratio
(b)
Figure 8: Dependency of (a) damper efficiency and (b) dampermaximum ductility ratio on frequency content of the groundmotions. Case 1:period = 0.6 s, stiffness ratio = 1, and yielding force-deck weight ratio = 0.05. Case 2: period = 0.6 s, stiffness ratio = 4, and yielding force-deckweight ratio = 0.10.
Metallic yielding damper Retaining wall
Backfill
Sand
Soft clay
P-y element
Bed rock
4m
6m
15m
fill
...
Figure 9: Considered soil-wharf-damper system.
𝑆𝑎, it is possible to obtain value of the 𝑆
𝑎eqand consequently
the equivalent viscous damping. Obviously, the equivalentviscous damping can be used only for preliminary design, andfor the final design nonlinear behavior of the damper shouldbe explicitly considered.
6. Design of the Damper
A simple retrofit-based design procedure is proposed in thissection assuming that the stability condition of the retainingwall cannot be improved. A stable condition for a sheetpile wall would be provided if its safety factors in shearand flexure remain in acceptable ranges. In the case of agravity wall, stability condition would be provided if the wallhas acceptable safety factors against slip and rotation. The
authors would like to elaborate that the damper force has nonoticeable effect on other failure modes, such as foundationbearing or settlement.
Step 1. Determine the allowable force that the retainingwall can sustain at the damper location during the designearthquake, 𝑅.
Again it should be clarified that 𝑅 is a small fraction ofredundant capacity of the retaining wall that is provided byits initial safety factor. It is obvious that reduction of the wallsafety factor is inevitable, but the value of𝑅 can be tuned suchthat the reduced safety factor still remains in an acceptablerange. Clearly, the damper force and other imposed forces onthe wall are not necessarily in phase. However, in this designguideline, these forces are assumed to be in phase in favor of

Journal of Structures 7
Kobe
Gro
und
acce
lera
tion
(g)
Time (s)
0.3
0.15
0
−0.15
−0.30 5 10 15 20 25 30 35 40
Kobe
(a)
Four
ier a
mpl
itude
(m/s
)
Kobe
Period (s)
1
0.5
0
1
0.5
00.2 0.4 0.6 0.8 1 1.2 1.4 1.6 1.8 2
Kobe
(b)
Northridge
Gro
und
acce
lera
tion
(g)
Time (s)
0
0.3
0.15
−0.15
−0.30 5 10 15 20 25 30 35 40
Northridgee
(c)
Four
ier a
mpl
itude
(m/s
)
Northridge
Period (s)0.2 0.4 0.6 0.8 1 1.2 1.4 1.6 1.8 2
1.4
1.2
1
0.8
0.6
0.4
0.2
0
Northridge
(d)
Parkfield
Gro
und
acce
lera
tion
(g)
Time (s)
0.3
0.15
−0.15
−0.3
0
0 5 10 15 20 25 30
Parkfield
(e)
Four
ier a
mpl
itude
(m/s
)
Parkfield
Period (s)0.2 0.4 0.6 0.8 1 1.2 1.4 1.6 1.8 2
1.4
1.2
1
0.8
0.6
0.4
0.2
00
Parkfield
(f)
Figure 10: Considered ground accelerations at the rock outcropping and their corresponding Fourier spectra.
safety. A simplified guideline is presented in Section 6.1 forselecting the value of 𝑅.
Step 2. Determine the yielding force of the damper:
𝐹𝑦= FS ⋅ 𝑅, (4)
where 𝐹𝑦represents yielding force of the damper and FS is
an appropriate factor of safety lower than the unity whichconsiders the effect of the damper strain hardening (value of0.9 is reasonable for FS.)
Step 3. Determine the value of the yielding force-deck weightratio, 𝛼:
𝛼 =
𝐹𝑦
𝑊𝐷
, (5)
where𝑊𝐷is the seismic weight of the deck attributed to the
damper.
Step 4. Determine the period of the soil-wharf system, 𝑇.
Step 5. According to (1), evaluate the stiffness ratio, SR, andconsequently damper stiffness as follows:
𝐾 =
4𝜋
2𝑊𝐷SR
𝑔𝑇
2, (6)
where 𝑔 and 𝐾 stand for acceleration of gravity and damperstiffness, respectively.
Step 6. For the preliminary design, according to (2) and (3),estimate the obtained equivalent viscous damping, and for

8 Journal of Structures
Mid
dle p
ile d
rift (m
m)
Time (s)
Without damperWith damper
90
60
30
0
−30
−60
−900 5 10 15 20 25 30 35 40
(a)
Dam
per d
uctil
ity
Time (s)0 5 10 15 20 25 30 35 40
10
8
6
4
21
(b)
Damper deformation (mm)
Dam
per f
orce
(kN
)
200
100
0
−100
−200
−100 −80 −60 −40 −20 0 20 40 60 80 100
(c)
Figure 11: (a) Drift of the middle pile with and without damper, (b) ductility ratio of the damper, and (c) cyclic behavior of the damper-Kobe1995 earthquake.
the final design use the obtained yielding force (Step 2) andstiffness (Step 5) of the damper in a nonlinear model.
There are some relations in the literature relating stiffnessof the yielding damper to its geometrical parameters, suchas those proposed by Tehranizadeh [20] for added dampingand stiffness devices (ADAS) and those obtained by Soongand Dargush [6] for triangular added damping and stiffnessdampers (TADAS). As mentioned earlier, stiffness and yield-ing displacements of the yielding device are equal to those ofthe yielding damper due to the rigidity of the damper link.
It should be pointed out that, if the stability conditionof the retaining wall can be improved, the design directionwould be changed. In this case, according to the desireddamping ratio, value of MR can be evaluated first, and thenrequired values of 𝛼 and SR would be obtained according to(2) and (1), respectively.
6.1. 𝑅 Selection. A simple yet accurate guideline is presentedhere to estimate the appropriate value for 𝑅. Note that all ofthe presented calculations should be carried out for the mostcritical section of thewall which experiences the largest forcesand has the lowest capacity.
Step 1. Determine shear and flexural (or slip and rotational)capacities of the retaining wall,𝐶V and𝐶𝑓, respectively, at thecritical section of the wall.
Step 2. Estimate the maximum expected seismic inertialforce of the wall, 𝐹
𝐼, the maximum seismic horizontal force
from the backfill soil, 𝐹𝑠, the hydrostatic force, 𝐹hs, and the
maximum hydrodynamic force, 𝐹hd. It should be pointedout that 𝐹
𝑠and 𝐹hd can be evaluated by many techniques
such as Mononobe-Okabe method andWestergaard’s theory,respectively [21]. Note that𝐹hs tends to stabilize the wall while𝐹hd could have a destructive effect depending on its direction.
Step 3. Estimate the maximum moments at the criticalsection of the wall due to its inertial force, 𝑀
𝐼, the backfill
soil pressure,𝑀𝑠, the hydrostatic force,𝑀hs, and the hydro-
dynamic force,𝑀hd.
Step 4. Determine the acceptable reduced factor of safety,FS𝑟, of the retainingwall which is greater than unity. As stated
earlier, reduction of the retaining wall safety factor cannot beavoided. It is clear that this reduction must be in an allowableand reasonable range. In fact just a 10% reduction is enoughfor a significant reduction in the wharf response.
Journal of Structures 9
Time (s)
Mid
dle p
ile d
rift (m
m)
60
40
20
0
−20
−40
−60
−800 5 10 15 20 25 30 35 40
Without damperWith damper
(a)
Time (s)
Dam
per d
uctil
ity
0 5 10 15 20 25 30 35 40
6
5
4
3
2
1
(b)
Damper deformation (mm)
Dam
per f
orce
(kN
)
200
100
0
−100
−200−60 −40 −20 0 20 40 60
(c)
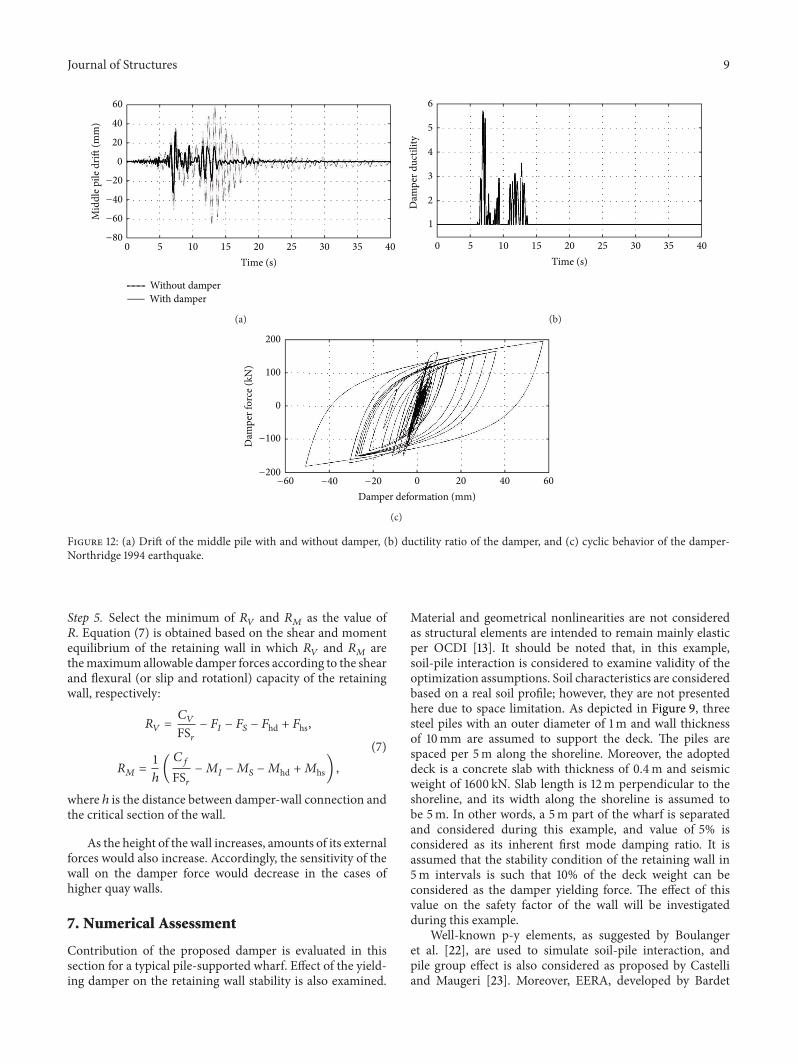
Figure 12: (a) Drift of the middle pile with and without damper, (b) ductility ratio of the damper, and (c) cyclic behavior of the damper-Northridge 1994 earthquake.
Step 5. Select the minimum of 𝑅𝑉and 𝑅
𝑀as the value of
𝑅. Equation (7) is obtained based on the shear and momentequilibrium of the retaining wall in which 𝑅
𝑉and 𝑅
𝑀are
themaximumallowable damper forces according to the shearand flexural (or slip and rotationl) capacity of the retainingwall, respectively:
𝑅𝑉=
𝐶𝑉
FS𝑟
− 𝐹𝐼− 𝐹𝑆− 𝐹hd + 𝐹hs,
𝑅𝑀=
1
ℎ
(
𝐶𝑓
FS𝑟
−𝑀𝐼−𝑀𝑆−𝑀hd +𝑀hs) ,
(7)
where ℎ is the distance between damper-wall connection andthe critical section of the wall.
As the height of the wall increases, amounts of its externalforces would also increase. Accordingly, the sensitivity of thewall on the damper force would decrease in the cases ofhigher quay walls.
7. Numerical Assessment
Contribution of the proposed damper is evaluated in thissection for a typical pile-supported wharf. Effect of the yield-ing damper on the retaining wall stability is also examined.
Material and geometrical nonlinearities are not consideredas structural elements are intended to remain mainly elasticper OCDI [13]. It should be noted that, in this example,soil-pile interaction is considered to examine validity of theoptimization assumptions. Soil characteristics are consideredbased on a real soil profile; however, they are not presentedhere due to space limitation. As depicted in Figure 9, threesteel piles with an outer diameter of 1m and wall thicknessof 10mm are assumed to support the deck. The piles arespaced per 5m along the shoreline. Moreover, the adopteddeck is a concrete slab with thickness of 0.4m and seismicweight of 1600 kN. Slab length is 12m perpendicular to theshoreline, and its width along the shoreline is assumed tobe 5m. In other words, a 5m part of the wharf is separatedand considered during this example, and value of 5% isconsidered as its inherent first mode damping ratio. It isassumed that the stability condition of the retaining wall in5m intervals is such that 10% of the deck weight can beconsidered as the damper yielding force. The effect of thisvalue on the safety factor of the wall will be investigatedduring this example.
Well-known p-y elements, as suggested by Boulangeret al. [22], are used to simulate soil-pile interaction, andpile group effect is also considered as proposed by Castelliand Maugeri [23]. Moreover, EERA, developed by Bardet
10 Journal of Structures
Without damperWith damper
Mid
dle p
ile d
rift (m
m)
Time (s)
15
10
5
0
−5
−10
−15
−200 5 10 15 20 25 30
(a)
Time (s)
Dam
per d
uctil
ity
0 5 10 15 20 25 30
2.62.42.2
21.81.61.41.2
1
(b)
Damper deformation (mm)
Dam
per f
orce
(kN
)
200
100
0
−100
−200−20 −15 −10 −5 0 5 10 15 20 25
(c)
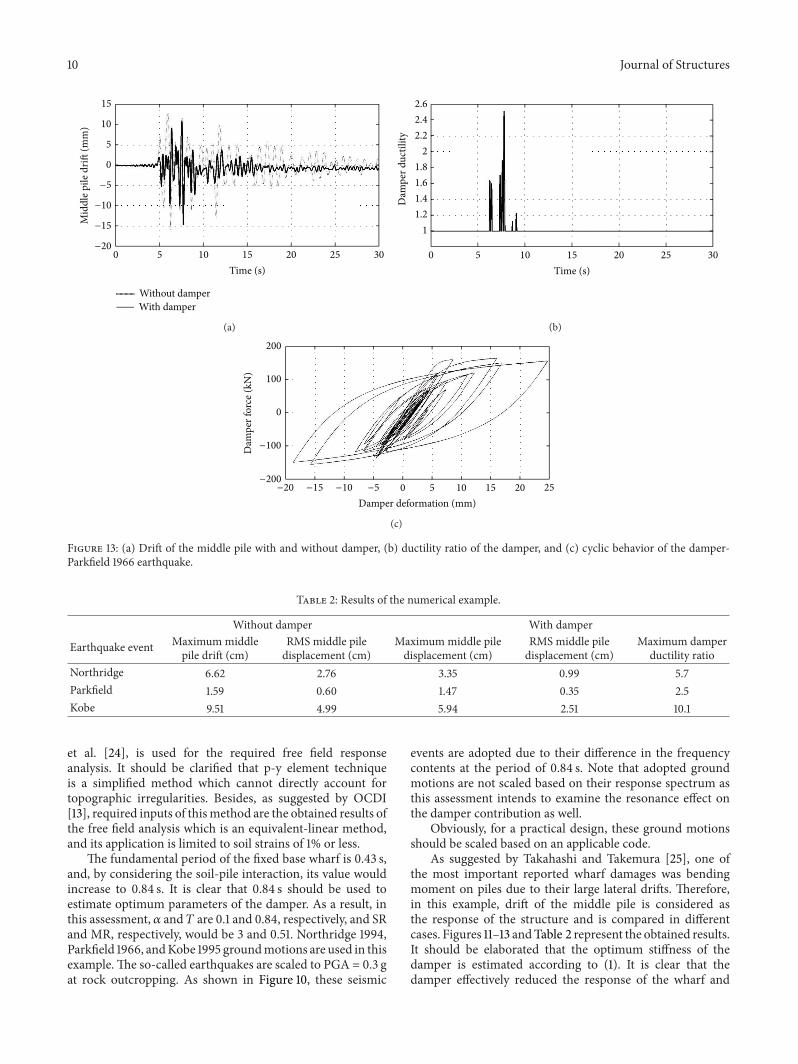
Figure 13: (a) Drift of the middle pile with and without damper, (b) ductility ratio of the damper, and (c) cyclic behavior of the damper-Parkfield 1966 earthquake.
Table 2: Results of the numerical example.
Without damper With damper
Earthquake event Maximum middlepile drift (cm)
RMS middle piledisplacement (cm)
Maximummiddle piledisplacement (cm)
RMS middle piledisplacement (cm)
Maximum damperductility ratio
Northridge 6.62 2.76 3.35 0.99 5.7Parkfield 1.59 0.60 1.47 0.35 2.5Kobe 9.51 4.99 5.94 2.51 10.1
et al. [24], is used for the required free field responseanalysis. It should be clarified that p-y element techniqueis a simplified method which cannot directly account fortopographic irregularities. Besides, as suggested by OCDI[13], required inputs of thismethod are the obtained results ofthe free field analysis which is an equivalent-linear method,and its application is limited to soil strains of 1% or less.
The fundamental period of the fixed base wharf is 0.43 s,and, by considering the soil-pile interaction, its value wouldincrease to 0.84 s. It is clear that 0.84 s should be used toestimate optimum parameters of the damper. As a result, inthis assessment, 𝛼 and 𝑇 are 0.1 and 0.84, respectively, and SRand MR, respectively, would be 3 and 0.51. Northridge 1994,Parkfield 1966, andKobe 1995 groundmotions are used in thisexample.The so-called earthquakes are scaled to PGA = 0.3 gat rock outcropping. As shown in Figure 10, these seismic
events are adopted due to their difference in the frequencycontents at the period of 0.84 s. Note that adopted groundmotions are not scaled based on their response spectrum asthis assessment intends to examine the resonance effect onthe damper contribution as well.
Obviously, for a practical design, these ground motionsshould be scaled based on an applicable code.
As suggested by Takahashi and Takemura [25], one ofthe most important reported wharf damages was bendingmoment on piles due to their large lateral drifts. Therefore,in this example, drift of the middle pile is considered asthe response of the structure and is compared in differentcases. Figures 11–13 andTable 2 represent the obtained results.It should be elaborated that the optimum stiffness of thedamper is estimated according to (1). It is clear that thedamper effectively reduced the response of the wharf and

Journal of Structures 11
Northridge
Period (s)
Spec
tral
resp
onse
acce
lera
tion
(g)
0.3
0.80.70.60.50.4
0.9
0.20.1
00
0.42 0.84 1 1.5 2 2.5 3
Sa (0.84 s) = 0.67g
(a)
Kobe
Period (s)
Spec
tral
resp
onse
acce
lera
tion
(g)
0 0.42 0.84 1 1.5 2 2.5 3
1.61.41.2
10.80.60.40.2
0
Sa (0.84 s) = 1.59g
(b)
Period (s)
Spec
tral
resp
onse
acce
lera
tion
(g)
Parkfield
0.90.80.70.60.50.40.30.20.1
00 0.42 0.84 1 1.5 2 2.5 3
Sa (0.84 s) = 0.12 g
(c)
Figure 14: Spectral response accelerations of the considered ground motions.
Table 3: Validity of the optimization assumptions.
Earthquake event Earthquake intensity Maximum displacement ratio (MR) Maximum ductility ratioPredicted Observed Predicted Observed
Northridge strong 0.51 0.51 6 5.7Kobe Very strong 0.51 0.62 6 10.1Parkfield weak 0.51 0.92 6 2.5
saved the piles from severe seismic-induced damages, regard-less of the resonance condition.
It can be seen from Table 2 that, in the resonancecondition, that is, Northridge and Kobe events, the dampereffectively reduced both maximum and RMS responses, andthe reduction was mainly due to the energy dissipationcapability of the damper. However, in the case in which theresonance has not occurred, that is, Parkfield earthquake, thedamper was able to reduce only the RMS response mainlythrough stiffness increasing rather than energy dissipation.This should be considered as the merit of yielding dampersas these devices remain mainly elastic during service levelground motions and localize damages and show noticeableenergy dissipation capabilities in the cases of design levelearthquakes. In Kobe earthquake, ground acceleration fre-quencies are concentrated in a narrow band making theearthquake very similar to a harmonic excitation with theresonance frequency. Therefore, the damper sustained largeductility demands during the Kobe groundmotion. Howeverthis value is still in a safe range. Table 3 represents validity
of the optimization assumptions. Parkfield earthquake wasa very weak excitation for the considered wharf and isexcluded in Table 3. Note that intensities of the earthquakesare evaluated based on their spectral acceleration spectra asshown in Figure 14.
Obtained results indicate that the proposed technique isaccurate for design level earthquakes (Northridge earthquakein this case). However the accuracy would be lost for veryweak and very strong ground motions.
Friction angle, density, and pore pressure ratio of thebackfill soil are assumed to be 30 degree, 1800 kg/m3, and0.15, respectively. Dead and live loads on the backfill soil are35 kN/m2. Moreover, thickness of the retaining wall is 0.8m.As a result, the maximum slip force and rotational momenton the wall would be 580 kN and 1110 kN⋅m per unit lengthof the wall, respectively. As illustrated earlier in Figure 12, themaximumdamper force in the case of design level earthquake(Northridge earthquake) is only 200 kN for 5m length of thewall, that is, 40 kN per unit length, and its correspondingrotational moment is 140 kN⋅m per unit length. It is obvious
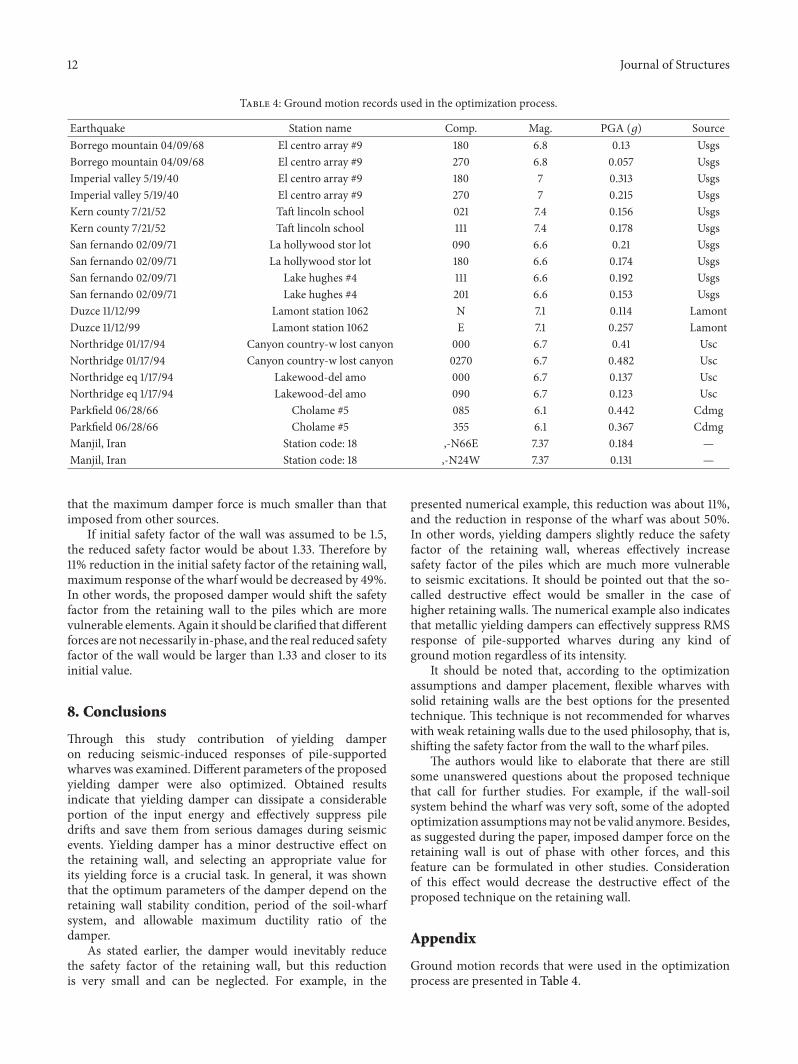
12 Journal of Structures
Table 4: Ground motion records used in the optimization process.
Earthquake Station name Comp. Mag. PGA (𝑔) SourceBorrego mountain 04/09/68 El centro array #9 180 6.8 0.13 UsgsBorrego mountain 04/09/68 El centro array #9 270 6.8 0.057 UsgsImperial valley 5/19/40 El centro array #9 180 7 0.313 UsgsImperial valley 5/19/40 El centro array #9 270 7 0.215 UsgsKern county 7/21/52 Taft lincoln school 021 7.4 0.156 UsgsKern county 7/21/52 Taft lincoln school 111 7.4 0.178 UsgsSan fernando 02/09/71 La hollywood stor lot 090 6.6 0.21 UsgsSan fernando 02/09/71 La hollywood stor lot 180 6.6 0.174 UsgsSan fernando 02/09/71 Lake hughes #4 111 6.6 0.192 UsgsSan fernando 02/09/71 Lake hughes #4 201 6.6 0.153 UsgsDuzce 11/12/99 Lamont station 1062 N 7.1 0.114 LamontDuzce 11/12/99 Lamont station 1062 E 7.1 0.257 LamontNorthridge 01/17/94 Canyon country-w lost canyon 000 6.7 0.41 UscNorthridge 01/17/94 Canyon country-w lost canyon 0270 6.7 0.482 UscNorthridge eq 1/17/94 Lakewood-del amo 000 6.7 0.137 UscNorthridge eq 1/17/94 Lakewood-del amo 090 6.7 0.123 UscParkfield 06/28/66 Cholame #5 085 6.1 0.442 CdmgParkfield 06/28/66 Cholame #5 355 6.1 0.367 CdmgManjil, Iran Station code: 18 ,-N66E 7.37 0.184 —Manjil, Iran Station code: 18 ,-N24W 7.37 0.131 —
that the maximum damper force is much smaller than thatimposed from other sources.
If initial safety factor of the wall was assumed to be 1.5,the reduced safety factor would be about 1.33. Therefore by11% reduction in the initial safety factor of the retaining wall,maximum response of the wharf would be decreased by 49%.In other words, the proposed damper would shift the safetyfactor from the retaining wall to the piles which are morevulnerable elements. Again it should be clarified that differentforces are not necessarily in-phase, and the real reduced safetyfactor of the wall would be larger than 1.33 and closer to itsinitial value.
8. Conclusions
Through this study contribution of yielding damperon reducing seismic-induced responses of pile-supportedwharves was examined. Different parameters of the proposedyielding damper were also optimized. Obtained resultsindicate that yielding damper can dissipate a considerableportion of the input energy and effectively suppress piledrifts and save them from serious damages during seismicevents. Yielding damper has a minor destructive effect onthe retaining wall, and selecting an appropriate value forits yielding force is a crucial task. In general, it was shownthat the optimum parameters of the damper depend on theretaining wall stability condition, period of the soil-wharfsystem, and allowable maximum ductility ratio of thedamper.
As stated earlier, the damper would inevitably reducethe safety factor of the retaining wall, but this reductionis very small and can be neglected. For example, in the
presented numerical example, this reduction was about 11%,and the reduction in response of the wharf was about 50%.In other words, yielding dampers slightly reduce the safetyfactor of the retaining wall, whereas effectively increasesafety factor of the piles which are much more vulnerableto seismic excitations. It should be pointed out that the so-called destructive effect would be smaller in the case ofhigher retaining walls. The numerical example also indicatesthat metallic yielding dampers can effectively suppress RMSresponse of pile-supported wharves during any kind ofground motion regardless of its intensity.
It should be noted that, according to the optimizationassumptions and damper placement, flexible wharves withsolid retaining walls are the best options for the presentedtechnique. This technique is not recommended for wharveswith weak retaining walls due to the used philosophy, that is,shifting the safety factor from the wall to the wharf piles.
The authors would like to elaborate that there are stillsome unanswered questions about the proposed techniquethat call for further studies. For example, if the wall-soilsystem behind the wharf was very soft, some of the adoptedoptimization assumptionsmaynot be valid anymore. Besides,as suggested during the paper, imposed damper force on theretaining wall is out of phase with other forces, and thisfeature can be formulated in other studies. Considerationof this effect would decrease the destructive effect of theproposed technique on the retaining wall.
Appendix
Ground motion records that were used in the optimizationprocess are presented in Table 4.

Journal of Structures 13
References
[1] N. Gerolymos, A. Giannakou, I. Anastasopoulos, and G. Gaze-tas, “Evidence of beneficial role of inclined piles: observationsand summary of numerical analyses,”Bulletin of Earthquake En-gineering, vol. 6, no. 4, pp. 705–722, 2008.
[2] H. G. Poulos, “Raked piles—virtues and drawbacks,” Journal ofGeotechnical and Geoenvironmental Engineering, vol. 132, no. 6,pp. 795–803, 2006.
[3] D.Oyenuga, E. Abrahamson,A.Krimotat, A. Kozak, T. Labasco,and F. Lobedan, “A study of the pile-wharf deck connection atthe Port of Oakland,” in Ports 2001: American’s Ports-Gatewaysto the Global Economy, 2004.
[4] D. E. Lehman, E. Brackmann, A. Jellin, and C.W. Roeder, “Seis-mic performance of pile-wharf connections,” in Proceedings ofthe ASCE Technical Council on Lifeline Earthquake EngineeringConference (TCLEE ’09), p. 84, Oakland, Calif, USA, July 2009.
[5] D. Mageau and K. Chin, “Effectiveness of stone columns onslope deformations beneath wharves,” in Proceedings of theASCE Technical Council on Lifeline Earthquake EngineeringConference (TCLEE ’09), p. 94, Oakland, Calif, USA, July 2009.
[6] T. T. Soong and G. Dargush, Passive Energy Dissipation Systemsin Structural Engineering, Wiley, Chichester, UK, 1997.
[7] C. Xia and R. D. Hanson, “Influence of ADAS elementparameters on building seismic response,” Journal of StructuralEngineering, vol. 118, no. 7, pp. 1903–1918, 1992.
[8] D. Foti, L. Bozzo, and F. Lopez-Almansa, “Numerical efficiencyassessment of energy dissipaters for seismic protection ofbuildings,” Earthquake Engineering and Structural Dynamics,vol. 27, pp. 543–556, 1998.
[9] L.M.Moreschi andM.P. Singh, “Design of yieldingmetallic andfriction dampers for optimal seismic performance,” EarthquakeEngineering and Structural Dynamics, vol. 32, no. 8, pp. 1291–1311, 2003.
[10] F. C. Ponzo, A. di Cesare, D. Nigro et al., “JET-PACS project:dynamic experimental tests and numerical results obtained fora steel frame equipped with hysteretic damped chevron braces,”Journal of Earthquake Engineering, vol. 16, pp. 662–685, 2012.
[11] I. Towhata, M. J. Alam, T. Honda, and S. Tamate, “Model testson behaviour of gravity-type quay walls subjected to strongshaking,” Bulletin of the New Zealand Society for EarthquakeEngineering, vol. 42, no. 1, pp. 47–56, 2009.
[12] A. Sadrekarimi, A. Ghalandarzadeh, and J. Sadrekarimi, “Staticand dynamic behavior of hunchbacked gravity quay walls,” SoilDynamics and Earthquake Engineering, vol. 28, no. 2, pp. 99–117,2008.
[13] OCDI,Technical Standards andCommentaries for Port andHar-bor Facilities in Japan, The Overseas Coastal Area DevelopmentInstitute of Japan, Tokyo, Japan, 2002.
[14] PEER, Strong Ground Motion Database, 2009, http://peer.berkeley.edu/smcat/.
[15] S. Mazzoni, F. McKenna, M. H. Scott, and G. L. Fenves, TheOpenSees Command Language Manual: Version 1.7.3, PacificEarthquake Engineering Center, University of California,Berkeley, Calif, USA, 2006.
[16] S. A. Mousavi, K. Bargi, and S. M. Zahrai, “Optimum param-eters of tuned liquid column-gas damper for mitigation ofseismic-induced vibrations of offshore jacket platforms,” Struc-tural Control and HealthMonitoring, vol. 20, no. 3, pp. 422–444,2013.
[17] Matlab, User Guide, Curve Fitting Toolbox, MathWorks Inc.,Version 7.6.0, 2008.
[18] Applied Technology Council (ATC), “Seismic evaluation andretrofit of concrete buildings,” Tech. Rep.ATC40,AppliedTech-nology Council, Redwood City, Calif, USA, 1996.
[19] ASCE, Prestandard and Commentary for the Seismic Rehabilita-tion of Buildings (FEMA356), Federal Emergency ManagementAgency, Washington, DC, USA, 2000.
[20] M. Tehranizadeh, “Passive energy dissipation device for typicalsteel frame building in Iran,” Engineering Structures, vol. 23, no.6, pp. 643–655, 2001.
[21] S. L. Kramer, Geotechnical Earthquake Engineering, PrenticeHall, Englewood Cliffs, NJ, USA, 1996.
[22] R. W. Boulanger, C. J. Curras, B. L. Kutter, D. W.Wilson, and A.Abghari, “Seismic soil-pile-structure interaction experimentsand analyses,” Journal of Geotechnical and GeoenvironmentalEngineering, vol. 125, no. 9, pp. 750–759, 1999.
[23] F. Castelli andM.Maugeri, “Simplified approach for the seismicresponse of a pile foundation,” Journal of Geotechnical andGeoenvironmental Engineering, vol. 135, no. 10, pp. 1440–1451,2009.
[24] J. P. Bardet, K. Ichii, and C. H. Lin, A Computer Program forEquivalent-Linear Earthquake Site Response Analyses, Depart-ment of Civil Engineering, University of Southern California,2000.
[25] A. Takahashi and J. Takemura, “Liquefaction-induced large dis-placement of pile-supported wharf,” Soil Dynamics and Earth-quake Engineering, vol. 25, no. 11, pp. 811–825, 2005.

International Journal of
AerospaceEngineeringHindawi Publishing Corporationhttp://www.hindawi.com Volume 2014
RoboticsJournal of
Hindawi Publishing Corporationhttp://www.hindawi.com Volume 2014
Hindawi Publishing Corporationhttp://www.hindawi.com Volume 2014
Active and Passive Electronic Components
Control Scienceand Engineering
Journal of
Hindawi Publishing Corporationhttp://www.hindawi.com Volume 2014
International Journal of
RotatingMachinery
Hindawi Publishing Corporationhttp://www.hindawi.com Volume 2014
Hindawi Publishing Corporation http://www.hindawi.com
Journal ofEngineeringVolume 2014
Submit your manuscripts athttp://www.hindawi.com
VLSI Design
Hindawi Publishing Corporationhttp://www.hindawi.com Volume 2014
Hindawi Publishing Corporationhttp://www.hindawi.com Volume 2014
Shock and Vibration
Hindawi Publishing Corporationhttp://www.hindawi.com Volume 2014
Civil EngineeringAdvances in
Acoustics and VibrationAdvances in
Hindawi Publishing Corporationhttp://www.hindawi.com Volume 2014
Hindawi Publishing Corporationhttp://www.hindawi.com Volume 2014
Electrical and Computer Engineering
Journal of
Advances inOptoElectronics
Hindawi Publishing Corporation http://www.hindawi.com
Volume 2014
The Scientific World JournalHindawi Publishing Corporation http://www.hindawi.com Volume 2014
SensorsJournal of
Hindawi Publishing Corporationhttp://www.hindawi.com Volume 2014
Modelling & Simulation in EngineeringHindawi Publishing Corporation http://www.hindawi.com Volume 2014
Hindawi Publishing Corporationhttp://www.hindawi.com Volume 2014
Chemical EngineeringInternational Journal of Antennas and
Propagation
International Journal of
Hindawi Publishing Corporationhttp://www.hindawi.com Volume 2014
Hindawi Publishing Corporationhttp://www.hindawi.com Volume 2014
Navigation and Observation
International Journal of
Hindawi Publishing Corporationhttp://www.hindawi.com Volume 2014
DistributedSensor Networks
International Journal of