research article examination of experimental designs and...
TRANSCRIPT

Research ArticleExamination of Experimental Designs and Response SurfaceMethods for Uncertainty Analysis of Production Forecast ANiger Delta Case Study
Akeem O Arinkoola1 and David O Ogbe12
1Department of Petroleum Engineering African University of Science and Technology (AUST) Km 10 Airport Road GaladimawaAbuja Nigeria2No 1 Odi Street Old GRA Port Harcourt Rivers State Nigeria
Correspondence should be addressed to Akeem O Arinkoola moranroolaakeemyahoocom
Received 18 November 2014 Accepted 22 February 2015
Academic Editor Mikhail Panfilov
Copyright copy 2015 A O Arinkoola and D O Ogbe This is an open access article distributed under the Creative CommonsAttribution License which permits unrestricted use distribution and reproduction in any medium provided the original work isproperly cited
The purpose of this paper is to examine various DoE methods for uncertainty quantification of production forecast duringreservoir management Considering all uncertainties for analysis can be time consuming and expensive Uncertainty screeningusing experimental design methods helps reducing number of parameters to manageable sizes However adoption of variousmethods is more often based on experimenter discretions or company practices This is mostly done with no or little attentionbeen paid to the risks associated with decisions that emanated from that exercise The consequence is the underperformance ofthe project when compared with the actual value of the project This study presents the analysis of the three families of designsused for screening and four DoE methods used for response surface modeling during uncertainty analysis The screening methods(sensitivity by one factor at-a-time fractional experiment and Plackett-Burman design) were critically examined and analyzedusing numerical flow simulation The modeling methods (Box-Behnken central composite D-optima and full factorial) wereprogrammed and analyzed for capabilities to reproduce actual forecast figuresThe best method was selected for the case study andrecommendations were made as to the best practice in selecting various DoE methods for similar applications
1 Introduction
The increasing necessity for systematic and consistency ofmethodologies for analyzing uncertainties and their asso-ciated effects on investment decisions has become veryimportant in management decisions This is one of the majorreasons why the use of experimental design has been on theincrease in the exploration and production (EampP) industryTo be able to harness the benefits associated with design ofexperiment (DoE) usersmust apply it wisely failure of whichcan result in waste of time and costly decisions Importantareas of application of DoE in petroleum engineering includeuncertainty screening and quantification With DoE onecan significantly reduce the number of simulations requiredto assess uncertainties since considering large number ofsimulations is not feasible due to limited available time
and resources Previous screening methodologies [1] haveconsidered static sensitivity analysis Though still applicablefor some studies the dynamic behaviour of the sensitivity isimportant to observe because different uncertainty attributesmay influence reservoir performance at different time
Recent research and applied reservoir characterizationand modelling projects have focused on the application ofexperimental design (ED) and response surface techniques[2ndash4] Successes recorded from the use of ED depend largelyon number of factors These include available time num-ber of factors the study objectives and amount of detailsrequired from integrated reservoir simulation studies Thereare several designs Morris [5] classified ED into fractionalfactorial design (FRFD) optimal design and Latin hypercubedesign (LHD)The first two classes are extensively used in thearea of physical experiments for model development [6 7]
Hindawi Publishing CorporationJournal of Petroleum EngineeringVolume 2015 Article ID 714541 16 pageshttpdxdoiorg1011552015714541
2 Journal of Petroleum Engineering
LHD is an efficient design that allows representation of entireparameter range in the design matrix Its construction isbased on the idea of stratified sampling which requires asearch algorithms and prespecified optimality criteria [6]
The underlining assumption using 2-level factorialdesigns is that the 3-factor interactions higher order factorsare negligible Consequently most of the experiments areomitted from the analysis and therefore seldom used forconstruction of response surfaces For illustration if weconsider 7 parameters system that require a 27 = 128-run fulldesign Among the 127 degrees of freedom in the design only7 are used to estimate the linear terms and 21 to estimate the2-factor interactions The remaining 119 degrees of freedomare associated with three-factor interactions higher orderfactors that are supposed to be negligible In practice if thenumber of factors ranges from 2 to 15 fractional factorialcan be used to screen the significant few by estimating themain effects and interactions There are various possiblefraction designs 64- 32- or 16-run designs The 16-rundesign usually is preferred since this is the cheapest designwith resolution IV that is available for uncertainties higherthan eight
Two-level Plackett-Burman (PB) designs have been usedin the context of classical statistical experiments for screeningpurposes However PB designs cannot be used when highernumber of levels is required or where simulator proxyrsquosdevelopment remains the priority of the study One variableat a time is a screening process involving varying a parametervalues between its minimum (minus1) and maximum (+1) rangeswithin the parameter space The degree of the displacementfrom the base case of resultant response indicates the extent ofinfluence the parameter has on the measured response Onevariable at a time method is a static sensitivity common inclassical laboratory experiments However its application forscreening large number of uncertainties has been reported[8]
Three-level experimental design methods are high reso-lution algorithms for response surface construction Centralcomposite design (CCD) consists of a factorial design withthe corners at +1 of the cube augmented by additionalldquostarrdquo and ldquocentrerdquo points which allow the estimation ofthe second-order polynomial equation [9] Like CCDs Box-Behnkendesigns are a family of three-level designs and can beconstructed by the combination of factorial and incompleteblock designs [7] The application of 3-level full factorial islimited only to four factors or lower due to the accompaniedlarge number of runs for large number of uncertaintiesHowever 2-level factorial designs (fractional designs) havealso been used where 3-level full factorial is infeasible forresponse surface construction [10]
There are various response modeling techniquesdescribed in the literature [7 11] The creation of proxy-models of a high quality is related to the selection ofappropriate experimental design algorithms the quality ofthe input dataset and the degree of linearity and nonlinearityof input-output relationship Yeten et al [12] studied thecapability of different experimental designs and proxymodels to predict uncertainties A good result was reportedin application of Kriging and Splines models with Latin
hypercube design However underperformance of modelsdeveloped using traditional experimental designs wasobserved due to under sampling of uncertainty space andhigh degree of nonlinearity of input-output relationship
Fetel and Caumon [13] demonstrated how flow simula-tion results can be combined with secondary information toovercome sampling problem for modeling complex responsesurfaces A more accurate response surface at affordablecost was generated when compared with the conventionaltechniques Recent studies have shown that the problem ofnonlinearity is addressed using ANN [14] and fuzzy inferencesystem [15] that employs hybrid-learning rules for trainingprocess
Whenever experimental design is used RSM are usu-ally constructed with regression interpolation and neuralnetwork [16 17] methods The methodology integrated 3-level designs with some screening linear designs In reservoirsimulation a response surface model is essentially an equa-tion derived from the multiple regressions of all the mainattributes (reservoir parameters) that impact the reservoirresponse This provides a good approximation to simulatorand also provides simplified solution to even very complexproblems that required huge computation time [18] Theresulting proxy model is a function of the number of valuesfor each uncertainty and is readily amenable to sampling byMonte Carlo simulation for uncertainty quantification
This study critically examined three common families ofexperimental designs used for screening during uncertaintyanalysis in simulation for reservoir management Theseinclude (a) sensitivity by one factor at-a-time (b) fractionalexperiment and (c) Placket-Burman design The selectionof ldquoheavy-hittersrdquo was based on the dynamic sensitivity withresponses measured at the end-of-simulation However thepotential of missing out some parameters that are timedependent as pointed out by Amudo et al 2008 [4] wasminimized by taking measurement of the response after 15and 30 years of simulation With this measure uncertaintypropagation was adequately captured and all uncertaintieswere included in the analysis The study developed possibleresponse surface models that are consequence of the variousscreening methodsThemodels were validated and subjectedto statistical error and Monte Carlo analysis
2 Methodology
21 Description of Uncertainty There are total of 10 majoruncertainties in this study Table 1 shows the descriptions thekeywords used and the corresponding ranges of uncertain-ties as multipliers on the base case value
22 Experimentation Experiments were performed usinghistory matched model The response is the cumulativeoil production (FOPT) after 15 and 30 years of forecastSimulation runs vary according to design methods and atthe end of simulation responses are available for statisticalanalysis Figure 1 shows a typical cumulative productioncurve at the end of history or beginning of productionforecast The profile shows the existence of uncertainty in the
Journal of Petroleum Engineering 3
Table 1 Experimental range in terms of multipliers on the base case uncertain parameters
SN Parameters Keywords Minimum value Base case Maximum value1 Oil viscosity OVISC 090 1 1102 Horizontal permeability PERMX 057 1 1293 Vertical permeability PERMZ 050 1 6004 Porosity PORO 090 1 1105 Critical gas saturation SGCR 050 1 1506 Critical water saturation SWCR 053 1 1077 Fault transmissibility multiplier MULTFLT 050 1 2008 Water relative permeability KRW(SORW) 036 1 1259 Initial water saturation SWI 065 1 09010 Aquifer pore volume AQUIPV 085 1 135
5000 7500 10000 12500 15000 17500 20000
FOPT
(STB
)
Days
History match Forecast period
1E + 07
2E + 07
2E + 07
3E + 07
3E + 07
4E + 07
4E + 07
Figure 1 A typical production profile showing the end of historymatch (calibrated model) and beginning of production forecast(start date for all experiments)
response Only runs that preserved original history matchwere retained in the design matrix
23 Uncertainty Screening The three screening designsexamined in this study include (a) sensitivity by one factorat-a-time (b) fractional experiment and (c) Placket-BurmandesignUsing the parameters inTable 1 the design pointswithcorresponding responses for different methods are shown inTables 2 3 and 4
The ldquo1rdquo ldquominus1rdquo and ldquo0rdquo represent absolute high low andbase case values of the parameters The contribution of eachuncertainty factor was estimated following the significant testfor the regression used in the analysis of variance (ANOVA)for all the methods The two hypotheses used for the test areas follows
(1) The null hypothesis all treatments are of equal effects
119867
0 1198871= 119887
2= 119887
119896= 0 (1)
(2) The alternative hypothesis some treatment is ofunequal effects
119867
1 119887119895= 0 for at least one 119895 (2)
To reject the null hypothesis 1198670at least one of the variables
explains significantly the variability observed on the responseso that the model is valid
The effects of the different attributes on the response forTable 4 were estimated using [19]
Attributeeffect =119883max minus 119883minsum
1003816
1003816
1003816
1003816
119883max minus 119883min1003816
1003816
1003816
1003816
(3)
where 119883max and 119883min are maximum and minimumresponses respectively
24 Development of Response Surfaces Figures 2 3 and4 show Pareto charts associated with different screeningmethods highlighting the impact of the various parameterson the reserves over the forecast periods The vertical blacklines correspond to a 95 confidence level implying that anyparameter to the right is significant (ldquoheavy-hitterrdquo) with 95confidence
Figure 2 shows the six ldquoheavy-hittersrdquo identified forfractional experiment at the end of 15-year forecast theOVISC SWI PERMX PORO KRW and PERMZ The fourother parameters that is the SGCR theAQUIPVMULTFLTand SWCR are insignificant on reserve forecast within theseperiods However at the end of 30-year simulation KRWeffect was insignificant and this reduced the number ofldquoheavy-hittersrdquo to five
Figure 3 shows the five ldquoheavy-hittersrdquo identified for PBexperiment at the end of 15-year forecast the OVISC SWIPERMX PORO and PERMZ However at the end of 30-yearsimulation PERMZ became insignificant on the model Thefour identified ldquoheavy-hittersrdquo includeOVISC SWI PERMXand PORO
Figure 4 shows the ldquoheavy-hittersrdquo identified for varyingone parameter at-a-time at the end of 15- and 30-yearforecast respectively In both cases OVISC PERMX andSWI have the most influence on the response One importantobservation is the time-dependent nature of the aquiferproperties (AQUIPV)
To determine whether there is a linear relationshipbetween the response and various ldquoheavy-hittersrdquo test for sig-nificance of regressionwas performed byANOVAThis studyutilized the computed Fisher variable (119865) and its associatedprobability (prob gt 119865) to assess the model significance aswell as to select regressors with high impact on the model byassuming 95 confidence level or 5 significant limit (ie120572 = 005)
4 Journal of Petroleum Engineering
Table2DoE
matrix
forfractionalfactoria
lmetho
d
Run
AO
VISC
BPE
RMX
CPE
RMZ
DP
ORO
ESG
CRFSW
CRGM
ULT
FLT
HK
RWJISW
KAQ
UPV
Respon
seFOPT
(STB
)15
years
30years
1minus1
11
1minus1
1minus1
minus1
minus1
minus1
2927126833277150
21
minus1
11
minus1
minus1
1minus1
minus1
minus1
2561077628803106
3minus1
11
minus1
minus1
minus1
11
1minus1
3055836634219088
4minus1
minus1
11
1minus1
minus1
11
13063223036143012
51
1minus1
1minus1
minus1
minus1
1minus1
12738475831335538
6minus1
1minus1
11
minus1
1minus1
1minus1
3032718235035264
7minus1
1minus1
minus1
11
minus1
1minus1
minus1
2811745031376578
8minus1
minus1
minus1
1minus1
11
1minus1
12782702832052148
91
11
minus1
1minus1
minus1
minus1
minus1
12648546830122768
10
minus1
minus1
1minus1
11
1minus1
minus1
12707957831057656
11
minus1
minus1
minus1
minus1
minus1
minus1
minus1
minus1
11
2734039031168096
12
1minus1
minus1
minus1
1minus1
11
minus1
minus1
2530320827984070
13
1minus1
1minus1
minus1
1minus1
11
minus1
2682741029853822
14
11
minus1
minus1
minus1
11
minus1
11
2734492031090104
15
1minus1
minus1
11
1minus1
minus1
1minus1
2652291630021116
16
11
11
11
11
11
3013041635331656
Journal of Petroleum Engineering 5
Table3PB
desig
ntablefor
10parameters
Run
AO
VISC
BPE
RMX
CPE
RMZ
DP
ORO
ESG
CRFSW
CRGM
ULT
FLT
HK
RWJISW
KAQ
UPV
FOPT
(15y
rs)
FOPT
(30y
rs)
1minus1
minus1
minus1
11
1minus1
11
minus1
30848400
33479500
21
minus1
11
minus1
1minus1
minus1
minus1
127154800
29412400
31
11
minus1
11
minus1
1minus1
minus1
28005900
29769600
41
1minus1
11
minus1
1minus1
minus1
minus1
27889000
30076700
5minus1
minus1
11
1minus1
11
minus1
130629500
33815700
6minus1
minus1
minus1
minus1
minus1
minus1
minus1
minus1
minus1
minus1
26898400
28727400
71
minus1
1minus1
minus1
minus1
11
1minus1
28034500
29923100
81
minus1
minus1
minus1
11
1minus1
11
27275300
29486200
9minus1
11
minus1
1minus1
minus1
minus1
11
32087300
35060000
10
minus1
1minus1
minus1
minus1
11
1minus1
130096500
32551700
11
minus1
11
1minus1
11
minus1
1minus1
33201400
36053900
12
11
minus1
1minus1
minus1
minus1
11
130582600
33411100
6 Journal of Petroleum Engineering
Table 4 One variable at a time design table for 10 parameters
Runs OVISC PERMX PERMZ PORO SGCR SWCR MULTFLT KRW SWI AQUIPV FOPT (15 yrs) FOPT (30 yrs)1 1 0 0 0 0 0 0 0 0 0 29761616 352456722 minus1 0 0 0 0 0 0 0 0 0 29116404 344894523 0 1 0 0 0 0 0 0 0 0 29343824 344957684 0 minus1 0 0 0 0 0 0 0 0 29058182 342264525 0 0 1 0 0 0 0 0 0 0 28566772 333224166 0 0 minus1 0 0 0 0 0 0 0 29484880 347396167 0 0 0 1 0 0 0 0 0 0 29502398 351384768 0 0 0 minus1 0 0 0 0 0 0 29016448 342281369 0 0 0 0 1 0 0 0 0 0 28963490 3410983610 0 0 0 0 minus1 0 0 0 0 0 28046878 3273712211 0 0 0 0 0 1 0 0 0 0 28873100 3353829612 0 0 0 0 0 minus1 0 0 0 0 28597504 3366192413 0 0 0 0 0 0 minus1 0 0 0 28902034 3403426814 0 0 0 0 0 0 1 0 0 0 30595368 3619320015 0 0 0 0 0 0 0 minus1 0 0 27848692 3256835016 0 0 0 0 0 0 0 1 0 0 28692348 3376908417 0 0 0 0 0 0 0 0 minus1 0 28460282 3308352818 0 0 0 0 0 0 0 0 1 0 28978374 3397574019 0 0 0 0 0 0 0 0 0 minus1 28928676 3399166420 0 0 0 0 0 0 0 0 0 1 26487010 30639428
Significance limit
0 5 10 15 20 25 30 35AE
FAHAGADAC
G-MULTFLTK-AQUPV
E-SGCRC-PERMZ
H-KRWD-PORO
B-PERMXJ-ISW
A-OVISC
Contribution ()
Para
met
ers
(a)
0 5 10 15 20 25 30 35
AEF
AHACAGAD
G-MULTFLTE-SGCRH-KRW
K-AQUPVC-PERMZB-PERMX
D-POROJ-ISW
A-OVISC
Contribution ()
Para
met
ers
Significance limit
(b)
Figure 2 Pareto charts from fractional experiment showing key parameters impacting reserves after (a) 15-year and (b) 30-year forecasts
0 5 10 15 20 25 30 35 40
F-SWCRE-SGCR
G-MULTFLTK-AQUPV
H-KRWC-PERMZ
D-POROB-PERMX
J-ISWA-OVISC
Contribution
Para
met
ers
Significant
(a)
0 5 10 15 20 25 30 35 40
F-SWCRE-SGCR
G-MULTFLTH-KRW
K-AQUPVC-PERMZ
D-POROB-PERMX
J-ISWA-OVISC
Contribution ()
Para
met
ers
Significant
(b)
Figure 3 Pareto charts from Placket-Burman experiment showing key parameters impacting reserves after (a) 15-year and (b) 30-yearforecasts
Journal of Petroleum Engineering 7
0 5 10 15 20 25
SGCRSWCR
MULTFLTAQUIPV
KRWPERMZ
POROSWI
PERMXOVISC
Effects ()
Para
met
ers
Significance limit
(a)
0 5 10 15 20 25
SWCRMULTFLT
SGCRKRW
AQUIPVPERMZ
POROSWI
PERMXOVISC
Effects ()
Para
met
ers
Significance limit
(b)
Figure 4 Pareto chart from one parameter at-a-time experiment showing key parameters impacting reserves after (a) 15-year forecast and(b) 30-year forecast
Table 5 Analysis of variance for Box-Behnken model associated with fractional factorial screening design
Source Sum of squares DF Mean square 119865-value Prob gt 119865Model 166119864 + 14 9 185119864 + 13 103125 lt00001 SignificantA-PORO 158119864 + 13 1 158119864 + 13 88142 lt00001B-PERMX 181119864 + 13 1 181119864 + 13 101313 lt00001C-PERMZ 753119864 + 12 1 753119864 + 12 42069 lt00001D-ISW 178119864 + 13 1 178119864 + 13 99428 lt00001E-OVISC 323119864 + 13 1 323119864 + 13 180644 lt00001B2
187119864 + 12 1 187119864 + 12 10426 lt00001C2
110119864 + 12 1 110119864 + 12 6171 lt00001D2
566119864 + 13 1 566119864 + 13 316024 lt00001E2
363119864 + 12 1 363119864 + 12 20282 lt00001Residual 644119864 + 11 36 179119864 + 10
Lack of fit 644119864 + 11 31 208119864 + 10
Pure error 0 5 0Cor total 167119864 + 14 45
Table 5 is a typical ANOVA table for Box-Behnkenmethod associated with fractional factorial screening designThemodel 119865-value of 103125 implies the model is significantThere is only a 001 chance that a ldquomodel 119865-valuerdquo this largecould occur due to noise Values of ldquoProb gt 119865rdquo less than00500 indicate models terms are significant In this case A(PORO) B (PERMX) C (PERMZ) D (SWI) E (OVISC) B2C2 D2 and E2 are all significant model terms
In general 10 different response surface correlationswere developed The regression equations were based onthe outcome from the three screening methods earlier dis-cussed Four methods were considered for response surfacemodelling Box-Behnken design (BBD) central compositedesign (CCD) full factorial design (FFD) and D-optimaldesign (DOD) Thus model equations (4) (5) (6) and (7)are associated with fractional factorial method (FRFDRSMs)model equations (8) (9) (10) and (11) are associated withPlacket-Burman method (PBDRSMs) and the 2 feasibleresponse model equations (12) and (13) are associated withscreening using one variable at-a-time (OVAATRSMs)
Tables 6 7 and 8 show the constants in all the equations
FOPTBox-Behnken (MMSTB)
= 119886
0+ 119886
1PORO + 119886
2PERMX + 119886
3PERMZ
+ 119886
4SWC + 119886
5OVISC + 119886
6PERMX2
+ 119886
7PERMZ2 + 119886
8SWC2 + 119886
9OVISC2
(4)
FOPTCentral Composite (MMSTB)
= 119886
0+ 119886
1PORO + 119886
2PERMX + 119886
3PERMZ
+ 119886
4SWC + 119886
5OVISC + 119886
6PERMX2
(5)
FOPTD-Optimal (MMSTB)
= 119886
0+ 119886
1PORO + 119886
2PERMX + 119886
3PERMZ
+ 119886
4SWC + 119886
5OVISC + 119886
8SWC2
+ 119886
9OVISC2 + 119886
10PORO lowastOVISC
(6)
8 Journal of Petroleum Engineering
FOPTFull Factorial (MMSTB)
= 119886
0+ 119886
1PORO + 119886
2PERMX + 119886
3PERMZ
+ 119886
4SWC + 119886
5OVISC + 119886
10PORO lowastOVISC
+ 119886
11PORO lowast PERMX
(7)
FOPTBox-Behnken (MMSTB)
= 119887
0+ 119887
1PORO + 119887
2PERMX + 119887
3SWC
+ 119887
4OVISC + 119887
5PERMX2 + 119887
6SWC2
+ 119887
7OVISC2
(8)
FOPTFFD (MMSTB)
= 119887
0+ 119887
1PORO + 119887
2PERMX + 119887
3SWC
+ 119887
4OVISC + 119887
5PERMX2 + 119887
6SWC2
+ 119887
7OVISC2 + 119887
8PORO lowast PERMX
+ 119887
9PORO lowast SWC + 119887
10PORO lowastOVISC
(9)
FOPTD-Optimal (MMSTB)
= 119887
0+ 119887
1PORO + 119887
2PERMX + 119887
3SWC
+ 119887
4OVISC + 119887
6SWC2
(10)
FOPTCCD (MMSTB)
= 119887
0+ 119887
1PORO + 119887
2PERMX + 119887
3SWC
+ 119887
4OVISC + 119887
6SWC2
(11)
FOPTD-OPT (MMSTB)
= 119862
0+ 119862
1PORO + 119862
2PERMX + 119862
3PERMZ
+ 119862
4AQUIPV + 119862
5SWI + 119862
6KRW
+ 119862
7OVISC + 119862
8SWI2
(12)
FOPTBox-Behnken (MMSTB)
= 119862
0+ 119862
1PORO + 119862
2PERMX + 119862
3PERMZ
+ 119862
4AQUIPV + 119862
5SWI + 119862
6KRW
+ 119862
7OVISC + 119862
8SWI2 + 119862
9PERMX2
+ 119862
10PERMZ2 + 119862
11OVISC2 + 119862
12SWI lowastOVISC
(13)
3 Model Validation
Figures 5(a) 5(b) and 5(c) are parity plots for the variousprediction methods corresponding to different screeningmethod These graphs are plots of the predicted productionforecast as a function of the experimental reserves values If
Table 6 Constants in (4) (5) (6) and (7)
119886
119894Box-Behnken Central composite D-optimal Full factorial119886
0minus621 1697 minus3165 1733
119886
1993 738 2011 1892
119886
2916 3081 289 021
119886
3minus004 020 024 021
119886
425137 806 21460 816
119886
5minus13830 minus1280 minus6358 minus104
119886
6minus3339 minus1497 000 000
119886
70045 000 000 000
119886
8minus15673 000 minus13286 000
119886
96204 000 3020 000
119886
10000 000 minus1127 minus1270
119886
11000 000 000 260
Table 7 Constants in (8) (9) (10) and (11)
119887
119894Box-Behnken Central composite D-optimal Full factorial119887
0minus691 minus3645 minus5838 minus1204
119887
1977 787 1003 1301
119887
2896 259 290 611
119887
324865 17954 23551 24223
119887
4minus13377 minus1219 minus1490 minus11875
119887
5minus325 minus11158 minus14639 minus313
119887
6minus15502 000 000 minus15553
119887
75990 000 000 5845
119887
8000 000 000 257
119887
9000 000 000 7052
119887
10000 000 000 minus1171
Table 8 Constants in (12) and (13)
119862
119894Box-Behnken method D-optimal method
119862
03400 3429
119862
1087 090
119862
2113 098
119862
3065 057
119862
4047 059
119862
5111 115
119862
6042 037
119862
7minus150 minus143
119862
8minus058 minus235
119862
9031 000
119862
10minus242 000
119862
11078 000
119862
12minus038 000
the prediction methods were a perfect fit of the experimentaldata then all of the points would lie on the 119909 = 119910 line
Parity plots do not reveal much information Howeverthe plots for the Box-Behnkenmethod generally demonstratethat the method predict the actual value more accuratelyOn these plots the vast majority of the points are along the119909 = 119910 line In addition the plots reveal that regardlessof the screening method CCD exhibits the least accurateprediction
The validation using cross plots only assess model effi-ciencies within the experimental range of parameters In
Journal of Petroleum Engineering 9
Pred
icte
d va
lue (
MM
STB)
Actual value (MMSTB)
3E + 07
3E + 07
3E + 07
3E + 07
3E + 073E + 07
4E + 07
4E + 07
4E + 07
4E + 074E + 07
Box-BehnkenFull factorial
D-optimalCentral composite
(a)
Pred
icte
d va
lue (
MM
STB)
3E + 07
3E + 07
3E + 07
3E + 07 3E + 07
3E + 07
3E + 07
4E + 07
4E + 07
4E + 07 4E + 07
4E + 07
Actual value (MMSTB)
Box-BehnkenFull factorial
D-optimalCentral composite
(b)
Pred
icte
d va
lues
(MM
STB)
3E + 07
3E + 07
3E + 07 3E + 07
3E + 07
3E + 07
4E + 07
4E + 07
4E + 074E + 07
4E + 07
Box-Behnken (R2= 0982)
D-optimal (R2= 0972)
Actual value (MMSTB)
(c)
Figure 5 Comparison of the actual and predicted reserves by (a) FRFRSMs (b) PBRSMs and (c) OVAATRSMs
order to determine model predictability elsewhere this studyperformed a ldquoblind testrdquo using parameter values outside therange already defined in Table 1 The simulation and predic-tion were made only on OVISC because it is controllable
Figures 6(a) 6(b) and 6(c) show respectively the com-parison of RSMs from FRFD PBD and OVAAT with theactual experimentalsimulated valuesThe simulated produc-tion upon degradation of OVISC by 30 50 and 70 isshown in Figure 6(d) It was noticed that prediction usingfull factorial method was excellent with maximum deviationof 079MMSTB followed by central composite method withmaximum deviation of 39MMSTB Box-Behnken generallyoverpredicted the actual reserves volume with deviationapproximately 20MMSTB
4 Statistical Error Analysis
The performance indices used are summarized in Table 9Each of the response surfaces developed was used to estimatethe production forecast for each of the data sets Tables 10 11
Table 9 Performance indices for model evaluation
Name of measure Formula
Absolute deviation AD = 1119873
119873
sum
119894=1
(Pred minus Exp)
Average absolutedeviation AAD = 1
119873
119873
sum
119868=1
1003816
1003816
1003816
1003816
(Pred minus Exp)100381610038161003816
1003816
Root mean squareerror RMSE = radic 1
119873
119873
sum
119894=1
(Actual minus Predicted)2
Average absolutepercentage relativeError
AAPRE = 1119873
[
119873
sum
119894=1
1003816
1003816
1003816
1003816
119864
119894
1003816
1003816
1003816
1003816
]
Maximum error 119864max = Max 100381610038161003816
1003816
119864
119894
1003816
1003816
1003816
1003816
and Min 100381610038161003816
1003816
119864
119894
1003816
1003816
1003816
1003816
119864
119894=
Pred minus ExpExp
lowast 100
Standard deviation SD = 1119873
119889minus 1
lowast
119873
sum
119894=1
119864
119894
2
and 12 show the result from the error analysis In additionto the estimated errors the coefficients of correlations are
10 Journal of Petroleum Engineering
0
10
20
30
40
50
60
70
80
30 50 70
Cum
pro
duct
ion
(MM
STB)
Oil viscosity degraded ()
Box-Behnken Central compositeD-optimal Full factorialSimulation
(a)
0
10
20
30
40
50
60
70
80
30 50 70
Cum
pro
duct
ion
(MM
STB)
Oil viscosity degraded ()
Box-Behnken Central compositeD-optimal Full factorialSimulation
(b)
30
32
34
36
38
40
42
44
Cum
pro
duct
ion
(MM
STB)
30 50 70Oil viscosity degraded ()
Box-BehnkenD-optimalSimulation
(c)
10000 12500 15000 17500 20000 22500
Expe
cted
pro
duct
ion
(STB
)
Days
70 degraded50 degraded30 degraded
3E + 07
2E + 07
2E + 07
3E + 07
4E + 07
4E + 07
5E + 07
(d)
Figure 6 Comparison of the predictions using (a) FRFRSMs (b) PBRSMs and (c) OVAATRSMs (d) the simulated reserves upon reductionof OVISC by 30 50 and 70
Table 10 Summary of the statistical analysis of RSMs from fractional factorial screening
Performance index Box-Behnken Full factoriallowast D-optimal Central compositeRMSE 1185877 1814203 1816590 3020953
AAD 845652 1413333 1533333 2276923
AD minus6522 minus6667 7407 minus15385
119864max 09 15 14 21
SD 01 03 03 08
AAPRE 03 04 05 07
119877-square () 996 994 993 979
Adj 119877-square () 995 992 989 973
Pred 119877-square () 994 988 982 957
Exp runs 460 320 310 470
lowast2- level full factorial was used
Journal of Petroleum Engineering 11
Table 11 Summary of the statistical analysis of RSMs from Placket-Burman screening
Performance index Box-Behnken Full factorial D-optimal Central compositeRMSE 1253281 1242645 2182697 6085815
AAD 907143 941667 1841667 4485714
AD minus7143 minus5953 00 minus9524
119864max 08 11 15 51
SD 02 02 05 35
AAPRE 03 03 06 14
119877-square () 996 997 991 924
Adj 119877-square () 995 996 989 899
Pred 119877-square () 992 995 985 844
Exp runs 290 840 240 250
Table 12 Summary of the statistical analysis of RSMs fromOVAATscreening
Performance index D-optimal Box-BehnkenRMSE 3458238 2823816AAD 2811765 2152459AD 5882 minus8197
119864max 21 23SD 11 07AAPRE 09 06119877-square () 972 982Adj 119877-square () 963 977Pred 119877-square () 951 967Exp runs 370 620
also indicated Box-Behnken method exhibited the least esti-mation error with highest values of correlation coefficientsCCD on the other hand showsmaximum estimated error andleast correlation coefficients Again this was performed onpredictions within the actual parameter range of values
5 Representative Model
As shown in Table 13 all models were ranked using thefollowing criteria number of uncertainties associated withthe different screening methods result from error analysisresult from the ldquoblindrdquo test and coefficients of correlationThe decision to select ldquobestrdquo model was based on scenarioobjectives
51 Objective 1 If it is desired to develop risk curvesfrom where P90P50P10 values for the response can bedetermined alongside its representative models the analysisfavours the selection of Box-Behnken method There arehowever three possible response surfaces depending on thescreening method These are response surface equations (4)(with 5 factors 46 runs) (8) (with 4 factors 29 runs) and(13) (with 7 factors 62 runs) For practical purposes responsesurface equation (8) is desirable with fewer number of factorsand experimental runs
52 Objective 2 If it is desired to utilized the proxy equa-tion to simulate and evaluate future development strategiessuch as the needs for acquiring additional informationundertaking stimulation or any of EOR such as in situcombustion a more efficient model capable of estimatingreservoir performance within acceptable margin of error isdesired Both central composite (CCD) and full factorialmethods are adequate
However in this analysis full factorialmethod performedfar better than the CCD FFD tends to be impractical forlarge number of uncertainties We have demonstrated in thisstudy that a 2-level factorial experiment can be used forconstructing response surface of quality as comparable as thatfrom 3-level full factorial However we highly recommendedconsideration for resolution of the factorial fractions to beused
6 Monte Carlo Simulation
The Monte Carlo technique [20] was used to combine theuncertain attributes and allows generating values for modelinput variables 2000 iterations were made while assumingthe following distribution functions triangular for OVISCuniform for PORO log normal for PERMX and PERMZnormal for SWC triangular for AQUIPV and triangular forKRWThe risk curves generated were in terms of cumulativeoil production
Figure 7 shows risk curves from various RSMs for theuncertainty assessment It is clearly shown that the P10and P90 values differ according to the assumed responsesurface methods Full factorial method gives the highestP10 (384MMSTB) value and minimum P90 (28MMSTB)value CCD is characterized by lowest P10 (354MMSTB)and highest P90 (32MMSTB) Both Box-Behnken andD-optimal methods give approximately equal values ofP90 (36MMSTB) and P10 (30MMSTB) These figuresrequire additional evaluation framework for ranking differentprospects regarding different outcomes so that feasible deci-sions when comparing risky capital investment can be madeinstead of decisions based on ldquobest guessrdquo
The costs and benefits of performing 46 and 62experiments instead of the desired 29 PB experiments
12 Journal of Petroleum Engineering
Table 13 Summary table for model ranking
Ranking measures Box-Behnken Response surface methods Full factorialCentral composite D-optimal
Fractional factorial screening InfeasiblePlacket-Burman screening
OVAAT screening Infeasible InfeasibleError analysis Best Average Average BetterBlind test Fail Fail
Correlation 119877-squares
PassInfeasible not practicable due to large number of experimental runs
0
01
02
03
04
05
06
07
08
09
1
25 30 35 40 45 50
Perc
entil
e
Reserves (MMSTB)
Central compositeFull factorial
D-optimalBox-Behnken
384MMSTB36MMSTB
354MMSTB
Figure 7 Impact of different RSMs on uncertainty assessment
were determined by constructing multiple risk curveswith equal or about the same P50 (mean) values for allmodels
Figure 8(a) shows a good agreement of risk curves ofBox-Behnken associatedwith Placket-Burman and fractionalfactorial screening designs The same applied to full factorialrisk curves shown in Figure 8(c) However the risk curveassociated with screening using the one variable at-a-timeexhibits wider variability from others and tends to be moreoptimistic which is perhaps due to different occurrenceprobability and larger number of factors involved in theregression analysis
The risk curves obtained by CCD developed fromPlacket-Burman and fractional factorial are a little at variancefrom each other due to combination that possesses dissimilaroccurrence probability
In summary both fractional screening design and PBdesign tend to give approximate result Based on the analysisthere is no significant added advantage in performing 46experiments as required by fractional factorial screeningmethod PB with fewer experimental runs is therefore desir-able
7 Forecast Distribution
It was found that 2000 equiprobable realisations iterativelybuilt in Excel were enough to stabilize the resulting forecastdistributions One critical measure used to generate eachrealisation of the model is that the deterministic reservevalue was fairly maintained at simulation base case valuethroughout the process Cumulative probability distributionfor the forecast reserves is shown in Figure 9 The impactof the major uncertain parameters was quantified It clearlyappears in Figure 10 that the oil viscosity and water sat-uration uncertainties are the most influential parametersThe other three parameters (porosity horizontal and verticalpermeability) have less importanceThe spread in productionprofiles (P10ndashP90 range) from the deterministic forecast(P50) volume as shown in Figure 11 indicates occurrence ofuncertainty in the forecast The extreme quantities to a largeextent are investment indicators
8 Summary
(i) The major objective of this study was to investi-gate the implications of various experimental designassumptions usually made while performing uncer-tainty analysis after reservoir simulation for reservoirmanagement
(ii) The three families of screening designs considered arefractional factorial Placket-Burman and one variableat-a-time
(iii) The four response surface methods considered forthe regression modeling are full factorial centralcomposite Box-Behnken and D-optimal
(iv) A total of 9 response surface models developed werevalidated and subjected to statistical error analysis
(v) The models were ranked using some criteria andbased on case objectives selection of appropriatemodel was made
(vi) The risk curves generated were used to provide infor-mation about the costs and benefits of conductingadditional experiments due to differences in thenumber of factors emanated from using differentscreening methods
Journal of Petroleum Engineering 13
0010203040506070809
1
28 30 32 34 36 38 40 42 44
Perc
entil
es
Reserves (MMSTB)
FOPT_FRFDFOPT_PBDFOPT_OVAAT
(a)
0010203040506070809
1
20 25 30 35 40 45 50
Perc
entil
es
Reserves (MMSTB)
FOPT_FRFDFOPT_PBD
(b)
0010203040506070809
1
29 31 33 35 37 39
Perc
entil
es
Reserves (MMSTB)
FOPT_FRFDFOPT_PBD
(c)
Figure 8 Risk curves for Case 1 (a) Box-Behnken equations (4) (8) and (13) (b) central composite equations (5) and (11) and (c) fullfactorial equations (7) and (9)
(vii) Also the risk curve was employed to identify stochas-tic models associated with the P10P50P90 realiza-tions
9 Conclusion and Recommendations
This study examined three screening designs (Placket-Burman fractional factorial and one variable at-a-time) andfour response surface methodologies (Box-Behnken centralcomposite D-optimal and full factorial) commonly used foruncertainty analysis In all screening methods years of pro-duction forecast played important role on associated numberof ldquoheavy-hittersrdquo One variable at-a-time was identified withlargest number of parameters and hence considered notideal because of the attendant large number of simulationruns Unlike Placket-Burman a low resolution fractionalfactorial in addition to main effects considered significance
of factor interactions requiredmore simulation runs but canprevent exclusion of some factors with minimal main effectbut significant interaction effect Nevertheless the analysisperformed in this study using Monte Carlo simulation showsthat there was no added advantage using fractional factorialin lieu of Placket-Burman for screening
The ldquobestrdquo model for uncertainty quantification must beselected based on the reservoir management objectives Box-Behnken method was adequate to determine P10P50P90and associated models On the other hand to evaluate futuredevelopment strategies such as EOR stimulation and theneeds for acquiring additional information full factorial andcentral composite designs aremore efficient predictors withinacceptable margin of error A full 2-level factorial or highresolution fractional factorial method was equally adequatefor the construction of response surfaces for uncertaintyquantification where 3-level full factorial was not feasible
14 Journal of Petroleum Engineering
0
005
01
015
02
025
03
Prob
abili
ty d
ensit
y
Reserves
26 28 30 32 34 36 38 40
Reserves distribution (MMSTB)
00
167
333
500
667
833
1000
Cum
ulat
ive d
ensit
y (
)
271905409620340595200213165223655682000
Reserves
MinimumMaximumMeanStd Dev1090Values
(a)
0
002
004
006
008
01
012
Prob
abili
ty d
ensit
y
Reserves
20 25 30 35 40 45 50
Reserves distribution (MMSTB)
00
167
333
500
667
833
1000
Cum
ulat
ive d
ensit
y (
)
291509379377340764134983231033574902000
Reserves
MinimumMaximumMeanStd Dev1090Values
(b)
00
167
333
500
667
833
1000
0
002
004
006
008
01
012Cu
mul
ativ
e den
sity
()
Prob
abili
ty d
ensit
y
Reserves distribution (MMSTB)
Reserves
20 25 30 35 40 45 50
207710459520341152358312958093870282000
Reserves
MinimumMaximumMeanStd Dev1090Values
(c)
Figure 9 Reserves distribution for (a) Box-Behnken RSM equation (8) (b) central composite and (c) full factorial response surfacesassociated with Placket-Burman screening method
Journal of Petroleum Engineering 15
029
021
019
0 02 04
PORO
PERMX
PERMZ
SWC
OVISC
Reserves correlation coefficient (Spearman rank)
minus044
minus064
minus08 minus06 minus04 minus02
Coefficient value
Figure 10 Ranking of uncertainty impact on production forecast
12000 14500 17000 19500 22000
Cum
pro
duct
ion
(STB
)
Days
P90
P50P10
Full factorialCentral compositeBox-Behnken
3E + 07
2E + 07
2E + 07
3E + 07
4E + 07
4E + 07
Figure 11 Stochastic model profiles corresponded withP10P50P90 for Box-Behnken central composite and fullfactorial PB associated methods
Conflict of Interests
The authors declare that there is no conflict of interestsregarding the publication of this paper
Acknowledgments
The authors acknowledged Schlumberger for providing thesoftware at AUST for simulation The authors also wishto acknowledge Petroleum Technology Development Fund(PTDF) for supporting this research
References
[1] D E Steagall and D J Schiozer ldquoUncertainty analysis inreservoir production forecasts during appraisal and pilot pro-duction phasesrdquo in Proceedings of the SPE Reservoir SimulationSymposium SPE 66399 Houston Tex USA February 2001
[2] N Almeida D J Schiozer E L Ligero and C MaschioldquoHistory matching using uncertainty analysisrdquo in Proceedingsof the SPE Canadian International Petroleum Conference SPE153604 Calgary Canada June 2003
[3] CH Peng and R Gupta ldquoExperimental design in deterministicmodelling assessing significant uncertaintiesrdquo in Proceedings ofthe SPE Asia Pacific Oil and Gas Conference SPE 80537 JakartaIndonesia September 2003
[4] C Amudo T Graf N R Haris R Dandecar F Ben Amor andR S May ldquoExperimental design and response surface modelsas a basis for stochastic history matchmdasha Niger delta experi-encerdquo in Proceedings of the International Petroleum TechnologyConference (IPTC rsquo08) IPTC 12665 Kuala Lumpa MalaysiaDecember 2008
[5] M D Morris ldquoThree technometrics experimental design clas-sicsrdquo Technometrics vol 42 no 1 pp 26ndash27 2000
[6] G E P Box W G Hunter and J S Hunter Statistics forExperimenters Design Innovation and Discovery John Wileyamp Sons New York NY USA 2nd edition 2005
[7] D C Montgomery Design and Analysis of ExperimentsResponse Surface Method and Designs John Wiley amp SonsHoboken NJ USA 2005
[8] F Moeinikia and N Alizadeh ldquoExperimental Design in reser-voir simulation an integrated solution for uncertainty analysisa case studyrdquo Journal of Petroleum Exploration and ProductionTechnology vol 2 no 2 pp 75ndash83 2012
[9] T TAllenMA Bernshteyn andKKabiri-Bamoradian ldquoCon-structing meta-models for computer experimentsrdquo Journal ofQuality Technology vol 35 no 3 pp 264ndash274 2003
[10] V S Aigbodion S B Hassan E T Dauda and R AMohammed ldquoThe development of mathematical model for theprediction of ageing behavior for Al-Cu-Mgbagasse particulatecompositerdquo Journal of Minerals amp Materials Characteristics ampEngineering vol 9 pp 907ndash917 2010
[11] E Manceau M Mezghani I Zabalza-Mezghani and F Rog-gero ldquoCombination of experimental design and joint modelingmethods for quantifying the risk associated with deterministicand stochastic uncertaintiesmdashan integrated test studyrdquo in Pro-ceedings of the SPE Annual Technical Conference and ExhibitionSPE 71620 pp 2537ndash2547 NewOrleans Lo USAOctober 2001
[12] B Yeten A Castellini B Guyaguler and W H Chen ldquoAcomparison study on experimental design and response surfacemethodologiesrdquo in Proceedings of the SPE Reservoir SimulationSymposium vol 93347 pp 465ndash479 Houston Tex USA Febru-ary 2005
[13] E Fetel and G Caumon ldquoReservoir flow uncertainty assess-ment using response surface constrained by secondary infor-mationrdquo Journal of Petroleum Science and Engineering vol 60no 3-4 pp 170ndash182 2008
[14] S Mohaghegh ldquoVirtual-intelligence applications in petroleumengineering part Imdashartificial neural networksrdquo Journal ofPetroleum Technology vol 52 no 9 pp 64ndash73 2000
[15] K K SalamDAraromi and S S Ikiensikimama ldquoNeuro-fuzzymodeling for the prediction of below-bubble-point viscosityrdquoPetroleum Science and Technology vol 29 no 17 pp 1741ndash17522011
[16] KMursquoazu I AMohammed-Dabo and SMWaziri ldquoDevelop-ment of mathematical model for the prediction of essential oilextraction from Eucalyptus citriodora leavesrdquo Journal of Basicand Applied Scientific Research vol 2 no 3 pp 2298ndash23062012
16 Journal of Petroleum Engineering
[17] A Friedmann D K Chawathe and D K Larue ldquoAssess-ing uncertainty in channelized reservoirs using experimentaldesignsrdquo in Proceedings of the SPE Reservoir Evaluation ampEngineering August 2003 SPE 85117
[18] B Guyagular R N Horne L Rogers and J J RosenzweigldquoOptimization of well placement in a Gulf of Mexico Water-flooding Projectrdquo in Proceedings of the SPE Annual TechnicalConference and Exhibition SPE 63221 Dallas Tex USA Octo-ber 2001
[19] J-P Dejean and G Blanc ldquoManaging uncertainties on produc-tion predictions using integrated statistical methodsrdquo in Pro-ceedings of the SPE Annual Technical Conference and ExhibitionlsquoReservoir Engineeringrsquo vol 56696 Houston Tex USAOctober1999
[20] J M Hammersley andD C HandscombMonte CarloMethodsChapman and Hall London UK 1983
International Journal of
AerospaceEngineeringHindawi Publishing Corporationhttpwwwhindawicom Volume 2014
RoboticsJournal of
Hindawi Publishing Corporationhttpwwwhindawicom Volume 2014
Hindawi Publishing Corporationhttpwwwhindawicom Volume 2014
Active and Passive Electronic Components
Control Scienceand Engineering
Journal of
Hindawi Publishing Corporationhttpwwwhindawicom Volume 2014
International Journal of
RotatingMachinery
Hindawi Publishing Corporationhttpwwwhindawicom Volume 2014
Hindawi Publishing Corporation httpwwwhindawicom
Journal ofEngineeringVolume 2014
Submit your manuscripts athttpwwwhindawicom
VLSI Design
Hindawi Publishing Corporationhttpwwwhindawicom Volume 2014
Hindawi Publishing Corporationhttpwwwhindawicom Volume 2014
Shock and Vibration
Hindawi Publishing Corporationhttpwwwhindawicom Volume 2014
Civil EngineeringAdvances in
Acoustics and VibrationAdvances in
Hindawi Publishing Corporationhttpwwwhindawicom Volume 2014
Hindawi Publishing Corporationhttpwwwhindawicom Volume 2014
Electrical and Computer Engineering
Journal of
Advances inOptoElectronics
Hindawi Publishing Corporation httpwwwhindawicom
Volume 2014
The Scientific World JournalHindawi Publishing Corporation httpwwwhindawicom Volume 2014
SensorsJournal of
Hindawi Publishing Corporationhttpwwwhindawicom Volume 2014
Modelling amp Simulation in EngineeringHindawi Publishing Corporation httpwwwhindawicom Volume 2014
Hindawi Publishing Corporationhttpwwwhindawicom Volume 2014
Chemical EngineeringInternational Journal of Antennas and
Propagation
International Journal of
Hindawi Publishing Corporationhttpwwwhindawicom Volume 2014
Hindawi Publishing Corporationhttpwwwhindawicom Volume 2014
Navigation and Observation
International Journal of
Hindawi Publishing Corporationhttpwwwhindawicom Volume 2014
DistributedSensor Networks
International Journal of
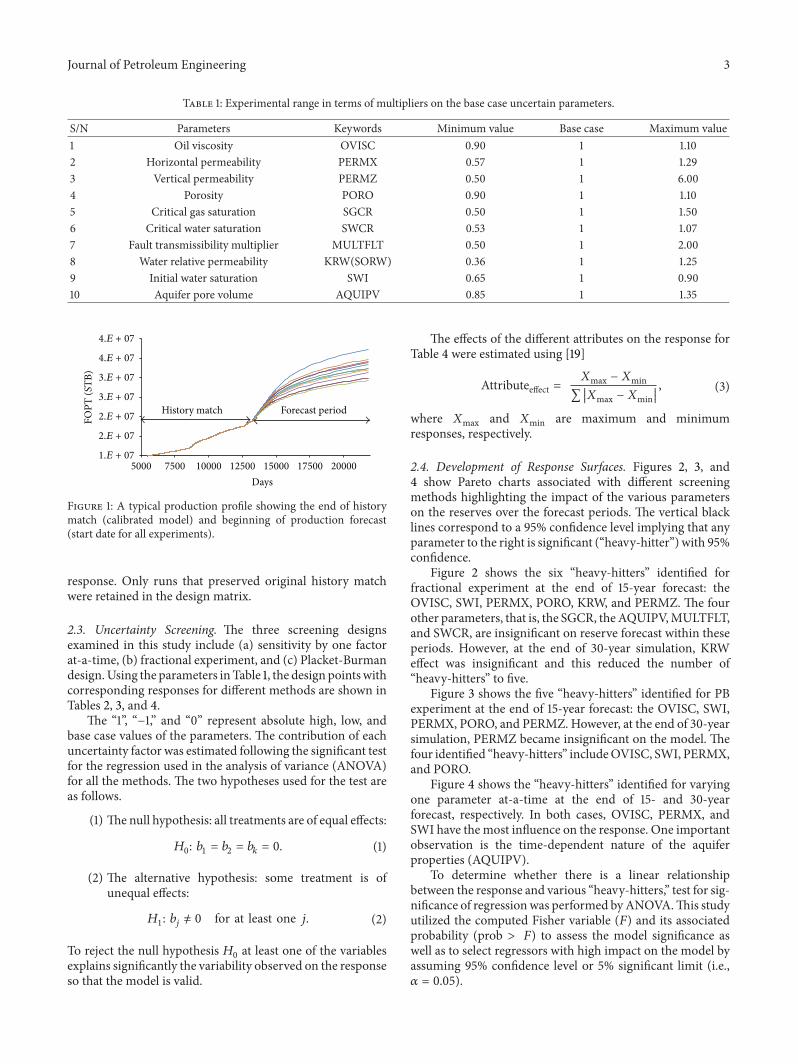
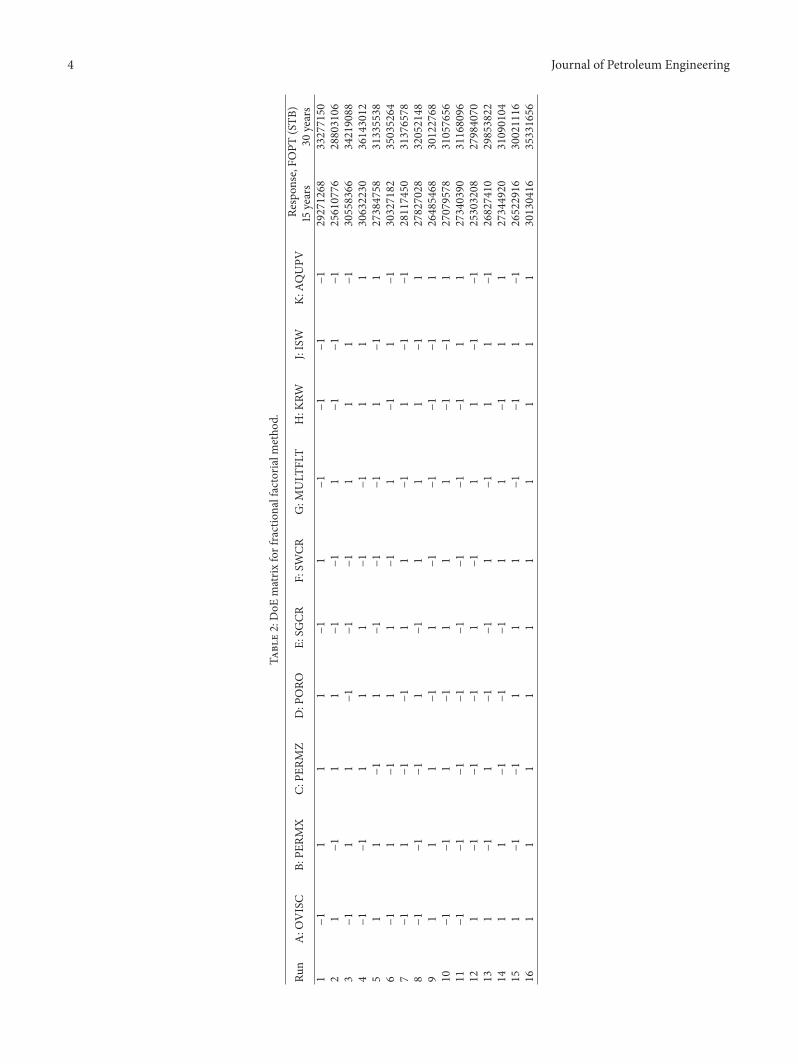
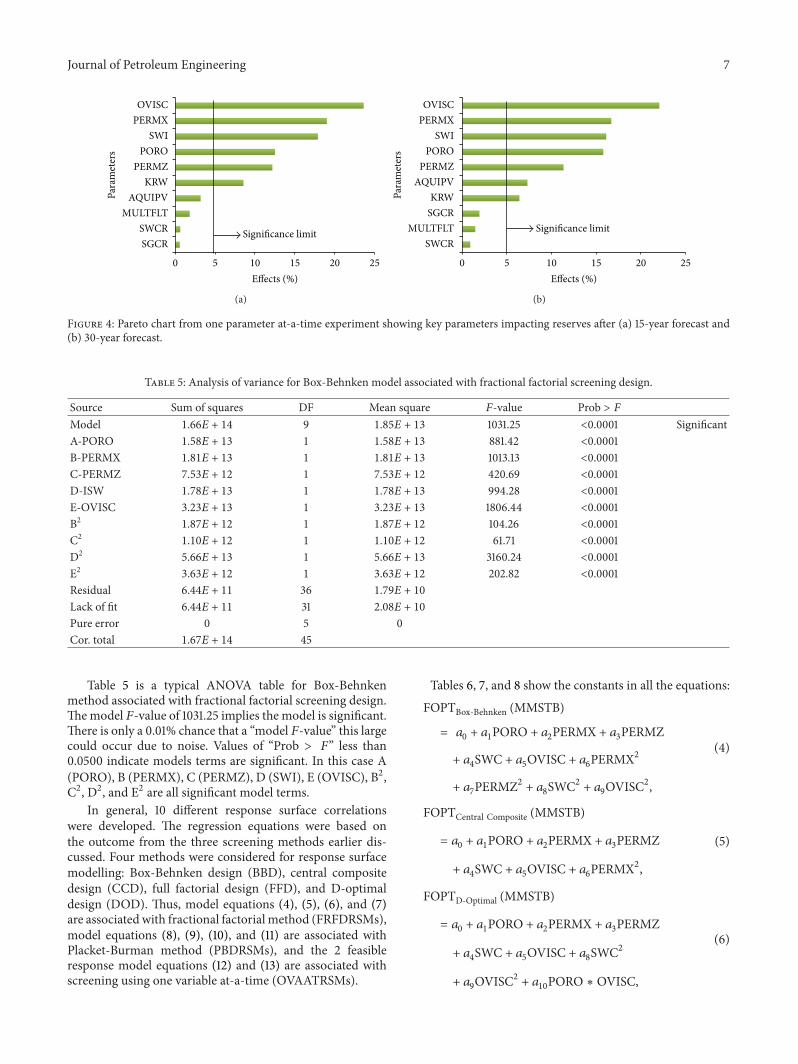
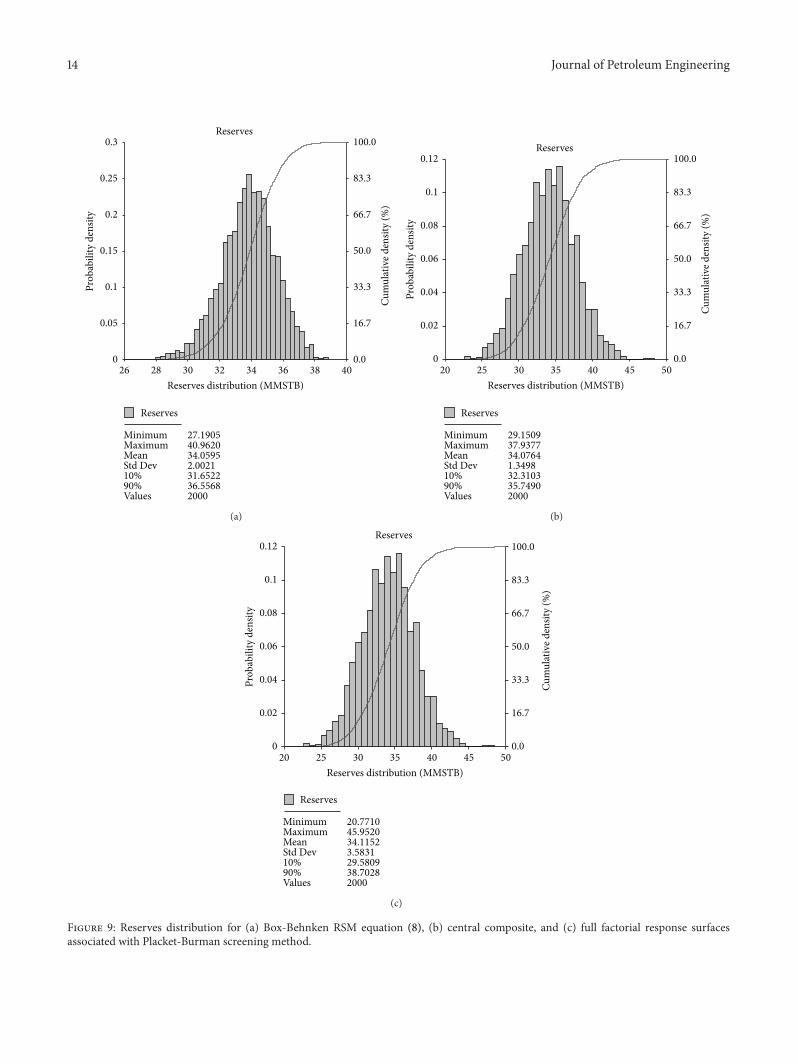

International Journal of
AerospaceEngineeringHindawi Publishing Corporationhttpwwwhindawicom Volume 2014
RoboticsJournal of
Hindawi Publishing Corporationhttpwwwhindawicom Volume 2014
Hindawi Publishing Corporationhttpwwwhindawicom Volume 2014
Active and Passive Electronic Components
Control Scienceand Engineering
Journal of
Hindawi Publishing Corporationhttpwwwhindawicom Volume 2014
International Journal of
RotatingMachinery
Hindawi Publishing Corporationhttpwwwhindawicom Volume 2014
Hindawi Publishing Corporation httpwwwhindawicom
Journal ofEngineeringVolume 2014
Submit your manuscripts athttpwwwhindawicom
VLSI Design
Hindawi Publishing Corporationhttpwwwhindawicom Volume 2014
Hindawi Publishing Corporationhttpwwwhindawicom Volume 2014
Shock and Vibration
Hindawi Publishing Corporationhttpwwwhindawicom Volume 2014
Civil EngineeringAdvances in
Acoustics and VibrationAdvances in
Hindawi Publishing Corporationhttpwwwhindawicom Volume 2014
Hindawi Publishing Corporationhttpwwwhindawicom Volume 2014
Electrical and Computer Engineering
Journal of
Advances inOptoElectronics
Hindawi Publishing Corporation httpwwwhindawicom
Volume 2014
The Scientific World JournalHindawi Publishing Corporation httpwwwhindawicom Volume 2014
SensorsJournal of
Hindawi Publishing Corporationhttpwwwhindawicom Volume 2014
Modelling amp Simulation in EngineeringHindawi Publishing Corporation httpwwwhindawicom Volume 2014
Hindawi Publishing Corporationhttpwwwhindawicom Volume 2014
Chemical EngineeringInternational Journal of Antennas and
Propagation
International Journal of
Hindawi Publishing Corporationhttpwwwhindawicom Volume 2014
Hindawi Publishing Corporationhttpwwwhindawicom Volume 2014
Navigation and Observation
International Journal of
Hindawi Publishing Corporationhttpwwwhindawicom Volume 2014
DistributedSensor Networks
International Journal of