research article forecasting water demand in residential
TRANSCRIPT

Research ArticleForecasting Water Demand in ResidentialCommercial and Industrial Zones in Bogotaacute ColombiaUsing Least-Squares Support Vector Machines
Carlos Pentildea-Guzmaacuten12 Joaquiacuten Melgarejo1 and Daniel Prats1
1 Institute of Water and Environmental Sciences University of Alicante Alicante Spain2Program of Environmental Engineering University of Santo Tomas Bogota Colombia
Correspondence should be addressed to Carlos Pena-Guzman carpeguzgmailcom
Received 8 July 2016 Revised 29 September 2016 Accepted 5 October 2016
Academic Editor Manuel Herrera
Copyright copy 2016 Carlos Pena-Guzman et al This is an open access article distributed under the Creative Commons AttributionLicense which permits unrestricted use distribution and reproduction in any medium provided the original work is properlycited
The Colombian capital Bogota has undergone massive growth in a short period of time Naturally this growth has increased thecityrsquos water demand The prediction of this demand will help understand and analyze consumption behavior thereby allowingfor effective management of the urban water cycle This paper uses the Least-Squares Support Vector Machines (LS-SVM) modelfor forecasting residential industrial and commercial water demand in the city of Bogota The parameters involved in this studyinclude the following monthly water demand number of users and total water consumption bills (price) for the three studied usesResults provide evidence of the modelrsquos accuracy producing 1198772 between 08 and 098 with an error percentage under 12
1 Introduction
Bogota the capital of the South American nation of Colom-bia has undergone significant population growth rate inrecent years with this figure at 131 annually (NationalAdministrative Department of Statistics) Such a growthrate has increased the consumption of natural resources toensure normal urban development Of these resources themost widely used one is water due to the high demandfor water in domestic commercial service and industrialactivities An understanding of water consumption behaviorin addition to the ability to predict its use would helppublic entities effectively plan and manage the developmentof cities especially in light of the importance of water in acityrsquos development By understanding and predicting wateruse positive environmental effects can be generated [1]Furthermore doing so would contribute to urban water cyclemanagement in terms of strategies for the optimal develop-ment of drinking water infrastructure water consumptioncontrol the environment and sanitation [2]
Two important components must be accounted for whenlooking at water demand forecasting and water consumption
behavior on one hand timing and on the other factorsthat influence consumptionThe first component ismeasuredusing three different time scales short medium and longShort-scale measurements refer to hourly daily and weeklyamounts of water and its use which are generally performedwith the real-time control operation andmanagement of thesystem [3] Medium-scale measurements refer tomonths andseasons focusing on the variability of water consumption [4]Long-scale measurements refer to time periods greater thana year These two medium- and long-scale measurementsare usually combined for financial capacity and expansionplanning [5ndash7]
With regard to the most relevant elements that influ-ence demand a number of factors merit mention Theseinclude climate (temperature precipitation evaporation andhumidity) demographic factors (population and populationdensity) study-site infrastructure and system (productivitytechnology etc) and political and administrative factors(application programs education and cost) [8ndash10] Thesefactors determine water consumption which means theyshould be considered input data for forecasting For ashort time scale factors generally studied include climate
Hindawi Publishing CorporationMathematical Problems in EngineeringVolume 2016 Article ID 5712347 10 pageshttpdxdoiorg10115520165712347
2 Mathematical Problems in Engineering
(maximum and minimum temperature) sunshine hoursprice water use working day greenery coverage buildingsize population density and type of use For medium scalethe main factors are season greenery coverage price build-ing size water use population density and type of use As forlong scale pertinent factors include climate or season pricewater use per capita demand population density and type ofuse [5]
According to Kofinas et al [11] models for water demandforecasting can be divided into two types deterministic andstochastic The former is used for short and medium scalesprimary approaches include simple multiple semilog andlog-log regressions [11ndash14] As for the latter these are mostoften used for large-scale models such as autoregressivemoving average autoregressive moving average autoregres-sive integrated moving average Artificial Neural Networks(ANN) fuzzy logic and support vector machines [15ndash19]models
This paper forecasts water demand for residential indus-trial and commercial uses in the city of Bogota usingLeast-Squares Support Vector Machines (LS-SVM)The dataanalyzed herein was recorded on a monthly basis from 2004to 2014 these data include the number of users price (totalbilled) and consumption
In the next section readers are presented with a literaturereview on water demand forecasting using support vectormachine (SVM) support vector regression (SVR) and LS-SVM In the following section water use is studied as afunction of land use also the model along with its variablesis discussed In the final section results and conclusions arepresented
2 Literature Review
This chapter presents a concise review of research that hasrelied on SVM SVR and LS-SVM models especially withregard to water demand forecasting
Chen and Zhang [20] used a LS-SVM model to calculatehourly demands the authors found that the LS-SVM modelperformed better than an artificial Feedforward Neural Net-work Backpropagation (FNN-BP) mainly due to the fact thatLS-SVM is based on structural risk mitigation this type ofmitigation considers the experience risks and confidenceintervals by which the minimization of risk leads to a moreaccurate prediction Ji et al [21] compared four differentalgorithmsmdashteaching-learning-based optimization (TLBO)ameliorated TLBO (ATLBO) grid search and particle swarmoptimization (PSO)mdashto adjust the hyperparameters of LS-SVMfor forecasting hourlywater demand inYanqia inChinathe researchersrsquo results showed that the model with ATLBOwas more accurate with better precision than the other algo-rithms Shabri and Samsudin [22] applied Empirical ModeDecomposition (EMD) to the intrinsic mode function in theANN and LS-SVM they found that the EMD combined withLS-SVM performed best (root-mean-square error (RMSE)= 20 and Mean Absolute Error (MAE) = 164) for monthlyforecasting water demand followed by LS-SVM (RMSE = 21and MAE = 181) and EMD combined with ANN (RMSE =271 and MAE = 186)
Msiza et al [23 24] compared Artificial Neural Network(ANN) to SVR finding that the RNAmodel performed better(with an error rate of 295) though despite a greater errorrate (546) SVM model satisfactorily described demandbehavior Herrera et al [17] predicted hourly water demandin southeast Spain using climate factors such as temperaturewind speed precipitation and atmospheric pressure Theauthors used the following models RNA Projection Pur-suit Regression Multivariate Adaptive Regression SplinesRandom Forests Weighted Pattern-Based Model for waterdemand forecasting and SVR The authors found that SVRpresented less error proposing it as the most appropriatemodel for the forecast of hourly demands Bai et al [25]proposed a variable-structure support vector regression (VS-SVR) and compared it with LS-SVM They found thatVS-SVR was more accurate and improved the forecastingperformance on account of being a dynamic model Brentanet al [26] compared an SVR with a hybrid model (SVR witha Fourier Time Series) for hourly water demand forecastingTheir results showed that SVR described a pattern yet hadproblems with extreme values whereas the hybrid modelperformed better in terms of pattern description and reducederrors considerably
During the same year Wu and Wang [27] assessed theperformance of a support vector machine for annual datafinding that for the dataset evaluated relative errors of091 186 and 093 were detected This according tothe authors demonstrated that the SVM was highly accuratefor demand forecasting Liu and Chang [28] used SVM forforecasting monthly water demand in Shanxi China theauthorsrsquo results showed that SVM prediction proved betterwhen the sample size was relatively small Chen [29] andYanget al [30] optimized SVM with a Genetic Algorithm (GA-SVM) to determine training parameters for SVM For pur-poses of evaluation the authors compared their optimizedmodel to ANN and GreyModel (GM) finding that GA-SVMperformed well relative to ANN and GM Another studydone by Sampathirao et al [31] included a comparison ofthree different approaches ARIMA Box-Cox transforma-tion ARMA Errors Trends and Seasonality (BATS) andSVM Based on their study the authors concluded that theBATSmodelwas best at predictingwater demandwith valuesof 00043 from mean square error (MSE) and 0058 fromRMSE Zhang et al [32] optimized the SVM with AGG(asexual genetic algorithm)This optimization was comparedto Backpropagation Neural Network (BPNN) for forecastingwater demand with results indicating SVPwasmore accuratefor this problem
3 Materials and Methods
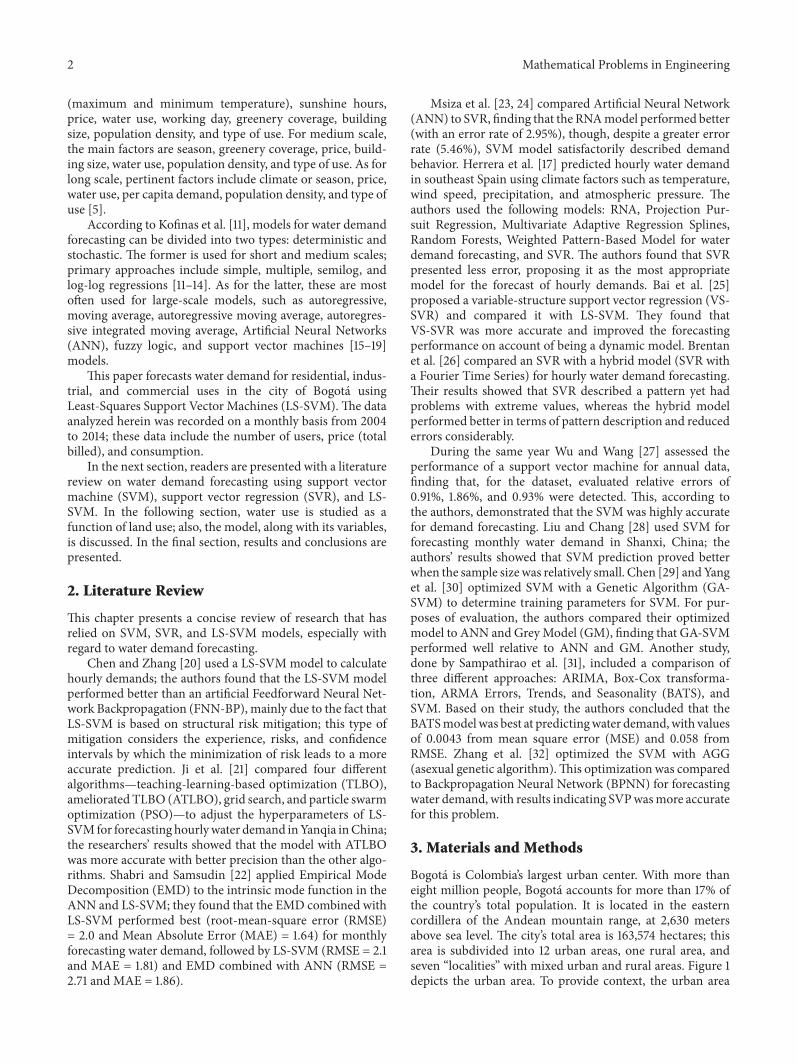
Bogota is Colombiarsquos largest urban center With more thaneight million people Bogota accounts for more than 17 ofthe countryrsquos total population It is located in the easterncordillera of the Andean mountain range at 2630 metersabove sea level The cityrsquos total area is 163574 hectares thisarea is subdivided into 12 urban areas one rural area andseven ldquolocalitiesrdquo with mixed urban and rural areas Figure 1depicts the urban area To provide context the urban area
Mathematical Problems in Engineering 3
Pipe network distributionBogotaacute urban area
N
S
EW
Figure 1 Bogotarsquos main network water supply
only represents 2349 of the cityrsquos total physical space butit contains 9992 of the cityrsquos population
Currently the city uses a socioeconomic stratificationsystem in accordance with domestic laws regarding publicservices This system classifies housing into six brackets rel-ative to its surroundings and construction materials Underthis system the poorest sector of society has its servicessubsidized by those living in richer sectors those living inldquohigherrdquo strata pay more for the same services received bythose living in lower strata [33] With regard to land use alocal resolution organizes territory into areas and providesguidelines on the needs and projects to be carried out
Bogota has identified six different land uses residential(R) industrial (Ind) commercial (Com) special officialand multiuser use R and multiuser categories are furtherdivided into the six aforementioned social strata (R1 R2 R3R4 R5 and R6) All strata obtain drinking water through acity-owned public company
31 Data For forecasting water demand in Bogota werely on the number of users per type of use and strataper month (119880119894) as well as the value billed for monthly
+ 00
6e + 06
0e
0e + 00
3e + 05
00e + 00
15e + 10
2005
2006
2007
2008
2009
2010
2011
2012
2013
2014
2004
Water consumption m3
2005
2006
2007
2008
2009
2010
2011
2012
2013
2014
2004
Total number of users per year
2005
2006
2007
2008
2009
2010
2011
2012
2013
2014
2004
Total billed per year
Figure 2 Behavior of water consumption total number of users peryear and total billed from 2004 to 2014
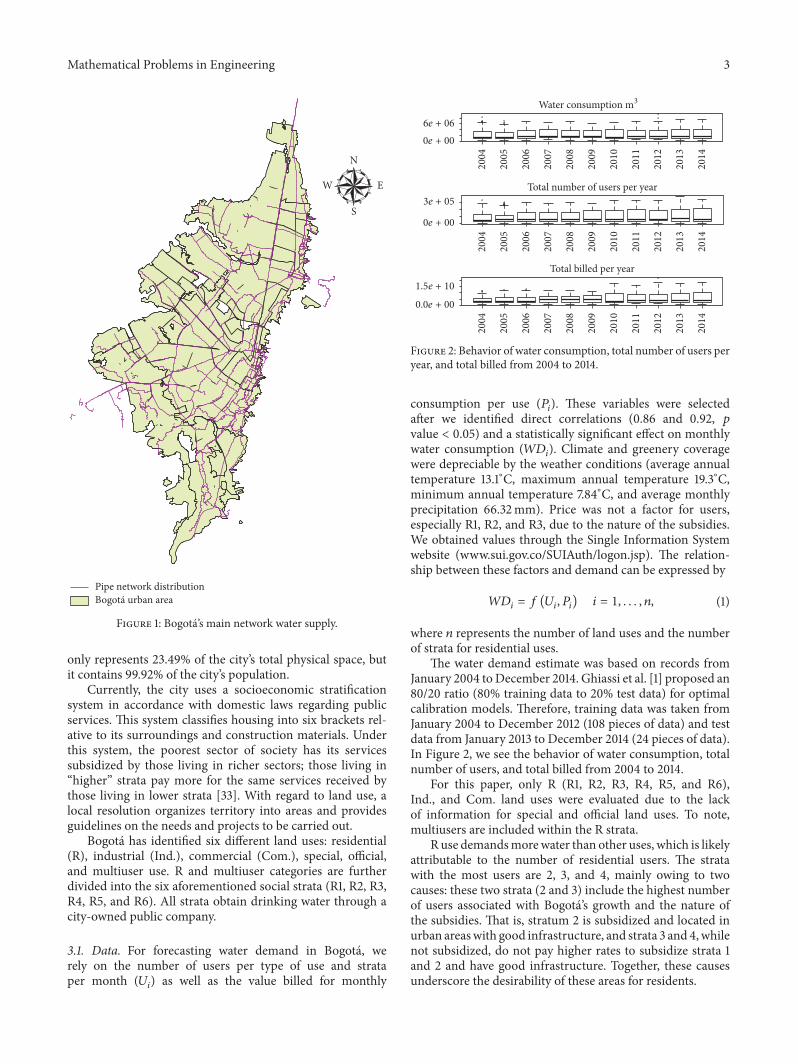
consumption per use (119875119894) These variables were selectedafter we identified direct correlations (086 and 092 119901value lt 005) and a statistically significant effect on monthlywater consumption (119882119863119894) Climate and greenery coveragewere depreciable by the weather conditions (average annualtemperature 131∘C maximum annual temperature 193∘Cminimum annual temperature 784∘C and average monthlyprecipitation 6632mm) Price was not a factor for usersespecially R1 R2 and R3 due to the nature of the subsidiesWe obtained values through the Single Information Systemwebsite (wwwsuigovcoSUIAuthlogonjsp) The relation-ship between these factors and demand can be expressed by
119882119863119894 = 119891 (119880119894 119875119894) 119894 = 1 119899 (1)
where 119899 represents the number of land uses and the numberof strata for residential uses
The water demand estimate was based on records fromJanuary 2004 toDecember 2014 Ghiassi et al [1] proposed an8020 ratio (80 training data to 20 test data) for optimalcalibration models Therefore training data was taken fromJanuary 2004 to December 2012 (108 pieces of data) and testdata from January 2013 to December 2014 (24 pieces of data)In Figure 2 we see the behavior of water consumption totalnumber of users and total billed from 2004 to 2014
For this paper only R (R1 R2 R3 R4 R5 and R6)Ind and Com land uses were evaluated due to the lackof information for special and official land uses To notemultiusers are included within the R strata
R use demandsmorewater than other uses which is likelyattributable to the number of residential users The stratawith the most users are 2 3 and 4 mainly owing to twocauses these two strata (2 and 3) include the highest numberof users associated with Bogotarsquos growth and the nature ofthe subsidies That is stratum 2 is subsidized and located inurban areaswith good infrastructure and strata 3 and 4whilenot subsidized do not pay higher rates to subsidize strata 1and 2 and have good infrastructure Together these causesunderscore the desirability of these areas for residents
4 Mathematical Problems in Engineering
Water consumption m3 Number of users Total billed ($month)
3e + 05
2e + 05
1e + 05
0e + 00
R4R1 R2 R3 R5 R6Ind
Com
Ind R1 R2 R3 R4 R5 R6
Com
Ind R1 R2 R3 R4 R5 R6
Com
0e + 00
2e + 06
4e + 06
6e + 06
8e + 06
00e + 00
50e + 09
10e + 10
15e + 10
20e + 10
Figure 3 Boxplot of water consumption number of users and billed consumption for Bogotarsquos land
The Wilcoxon test showed that strata 5 and 6 stratum 4and Com use and stratum 1 and Ind use presented similarconsumption despite their differences in terms of numberof users For price (amount paidtotal billed) by consumersonly strata 5 and 6 displayed significant relationships (seeFigure 3)
32 LS-SVM Estimator SVM is a classification and regres-sion method with origins in statistical learning theory [34]When it is applied to a regression SVM can be summarizedas follows with a set of data (represented in a 119899-dimensionalplane) that are not linearly divisible data are mapped ontoa space with a larger dimension in order to obtain a linearregression [35]
The LS-SVM model was first proposed by Suykens andVandewalle and it differs from the SVM in how to find thehyperplane SVM employs the principle of structural riskminimization whereas LS-SVM employs a linear system ina double space under the minimum quadratic cost functionThe LS-SVM training process involves the selection of kernelparameters and the regulation of the cost function usingcross-validation or Bayesian techniques [36 37]
The LS-SVM structure can be understood as follows ifthere is a set of data x119894 119910119894119873119894=1 then the following nonlinearfunction is estimated
119910119894 = w119879120593 (x119894) + 119887 (2)
where x isin R119899 represents system inputs 119910 isin R outputs and120593(x119894) R119899 rarr R119899ℎ mapping to a higher dimension (possiblyinfinite) of a featured space As previously mentioned thetraditional SVM solves the problem of finding the best hyper-plane using the principle of structural risk minimization
and the LS-SVM optimizes the problem with the followingequation
minw119887119890
119891 (w119887 119890) = 12w119879w + 120574 12 119873sum119894=1
1198902119894 st 119910119894 = w119879120593 (x119894) + 119887 + 119890119894 119894 = 1 119873
(3)
By applying a Lagrange multiplier in (2) the following equa-tion is obtained
L (w 119887 119890119894 120572119894) = 119891 (119908 119890119894)minus 119873sum119894=1
120572119894 w119879120593 (x119894) + 119887 + 119890119894 minus 119910119894 (4)
where 120574 is the regularization parameter by which the com-plexity of the model is balanced and 120572119894 is the Lagrangemultiplier with eligibility conditions obtained from a set ofthe following set of equations120597L120597119908 = 0 997888rarr
119908 = 119873sum119894=1
120572119894120593 (x119894)120597L120597119887 = 0 997888rarr119873sum119894=1
120572119894 = 0
Mathematical Problems in Engineering 5
Table 1 Statistical performance of LS-SVM and FNN-BPMmodels
Land use LS-SVM FNN-BPRMSE AARE () 1198772 RMSE AARE () 1198772
R1 00081 645 093 00104 855 088R2 00023 354 096 00048 561 093R3 00089 75 092 00119 956 050R4 00194 1158 091 00387 1371 090R5 00078 765 098 01258 1585 097R6 04005 230 08 0598 2587 067Industrial 00043 586 094 00052 63 082Commercial 00012 269 098 00034 447 084
120597L120597119890119894 = 0 997888rarr120572119894 = 120574119890119894120597L120597120572119894 = 0 997888rarr119908119879 = 119873sum
119894=1
120572119894120593 (x119894)119894 = 1 119873(5)
By eliminating 119908 and 119890119894 the following linear system isobtained
[0 1119879
1 Ω + 120574minus1I] [119887120572
] = [0y
] (6)
With I = [1 1 1]119879 y = [1199101 1199102 119910119899]119879 120572 = [1205721 1205722 120572119899]119879 Mercerrsquos condition is applied in the kernel matrixΩ
Ω = 119870 (x x119894) = 120593 (x119894) sdot 120593 (x119895) (7)
The model for regressions is
119910 (x) = 119873sum119894=1
120572119894119870 (x x119894) + 119887 (8)
where 120572 and 119887 are the solution to (6) and (8) and 119870(x x119894)is defined as the kernel function which is a value of theinner product of two vectors x119894 and x119895 in the space of 120593(x119894)and 120593(x119895) which is 119870(x119894 x119895) = 120593(x119894)119879120593(x119895) For this studythe radial basis function (RBF) was selected as the kernelfunction because it offers good performance under generalassumptions of smoothness for that reason this function isespecially useful when no additional data are available TheRBF is expressed as follows [38]
119870 (119909119894 119909119895) = exp(minus 10038161003816100381610038161003816x119894 minus x1198951003816100381610038161003816100381621205902 ) (9)
where 1205902 is the width of the band from the kernelrsquos RBFFigure 4 shows the structure of the LS-SVM where1198831 1198832 119883119899 are the input data and (119910119894) the output
x1
x2
xn
1205721
1205722
120572m
sum yi
b
Bias b
K(x x1)
K(x x2)
K(x xm)
Figure 4 LS-SVM structure
33 Evaluation Model To verify the accuracy of this modelcomparison was done using an artificial Feedforward NeuralNetwork Backpropagation for which a learning rate of 001assorted the number of hidden layers (1 to 10) until the leastmean square error (MSE) was found For this process thesame number of data was used for calibration and evaluationAfter obtaining the demand results three different statisticalmetrics were used (i) RMSE (ii) the absolute average of rela-tive errors (AARE) and (iii) the coefficient of determination(1198772) Mohamed and Al-Mualla used these three metrics formonthly forecasting [39 40]
RMSE = radic 1119899 119899sum119894=1
( 119874119894 minus 119863119894119874119894 )2AARE = 1119899 119899sum
119894=1
10038161003816100381610038161003816100381610038161003816 119874119894 minus 119863119894119874119894 10038161003816100381610038161003816100381610038161003816 times 1001198772 = ( sum119899119894 (119874119894 minus 119863119894) minus (119863119894 minus 119863)radicsum119899119894=1 (119874119894 minus 119874)2 (119863119894 minus 119863)2)
2
(10)
Finally to evaluate the significance of the factors (numberof users and total billed) for each stratum with regard tovalidation a Kruskal-Wallis test was performed
4 Results
Table 1 shows the performance of both LS-SVM and FNN-BPmodels in terms of predicting water demand for all land uses
6 Mathematical Problems in Engineering
R1 R2 R3
R4 R5 R6
Ind Com
minus5
0
5
10
15
20
25
Diff
eren
ce (
)
minus25
minus20
minus15
minus10
minus5
0
5
10
Diff
eren
ce (
)
minus15
minus10
minus5
0
Diff
eren
ce (
)
minus200
minus150
minus100
minus50
0
Diff
eren
ce (
)
minus10
minus8
minus6
minus4
minus2
0
Diff
eren
ce (
)
minus10
minus8
minus6
minus4
minus2
0
Diff
eren
ce (
)
minus10
minus8
minus6
minus4
minus2
0
2
Diff
eren
ce (
)minus20
minus15
minus10
minus5
0
5
10
Diff
eren
ce (
)
Figure 5 Differences () between values predicted by LS-SVM and reported data for user and strata
according to the aforementioned statistical metrics employedin Mohamed and Al-Mualla [39 40]
In the LS-SVM model most results for RMSE valueswere under 2 (except for stratum 6) more informationwill be provided below This indicates that the distributionof errors between the model and the reported data reportedwas very low As for the modelrsquos efficiency (measured asaccurate prediction of the reported data) AARE values wereunder 8 for LS-SVM model (except for strata 4 and 6)which reflects its forecasting ability Finally the coefficientof determination showed values over 09 (except for stratum6) which means that there is a strong relationship betweenthe reported and calculated data another sign of the modelrsquosutility
The FNN-BP model despite its relatively inferior perfor-mance which is reflected in higher RMSE and AARE andlower 1198772 values predicted the behavior of the demand foreach type of use Nonetheless the forecast for strata 1 3 45 and 6 had AARE greater than 8 and 1198772 low in strata 6and 3
The SL-SVM performance is evidence that this model issuitable for predicting water consumption at long and shortscales as presented byChen andZhang [20] at an hourly scaleand Hwang et al [36] at a daily scale
See Figure 5 for the differences between the reported dataand the calculated data in terms of use
For stratum 1 the model presented greater underesti-mates because the economic value of the service is not
Mathematical Problems in Engineering 7
times105 times105 times105
times105 times105 times105
ReportedLS-SVMANN-BP
ReportedLS-SVMANN-BP
ReportedLS-SVMANN-BP
R1 m3month R2 m3month R3 m3month
R4 m3month R5 m3month R6 m3month
5 15 2010
5 15 2010 5 15 2010 5 15 2010
5 15 20105 15 2010
45
50
55
60
65
70
45
50
55
60
65
70
75
6
8
10
12
14
16
18
20
22
14
18
22
26
30
34
2
4
6
8
10
12
14
16
2
4
6
8
10
12
14
16
Figure 6 Reported and forecasted water consumption for residential use (LS-SVM and FNN-BP models)
an important factor in consumption Instead the numberof users is significant (119901 value lt 005) Therefore thisconsumption depends on increases in the number of usersand the cityrsquos economic growth
As for strata 2 3 and 5 both factors affected theresult however forecasting for stratum 5 presented the mostvariability of these three strata In line with these findingsthe number of users represented a greater challenge for theFNN-BP presenting the highest RMSE (1258) and AARE(1585) values For LS-SVM this stratum (R5) produced thehigher values of these two strata (R2 and R3) with RMSE andAARE values of 765 and 78 respectively
For strata 4 and 6 the Kruskal-Wallis test showed that themost important factor turned out to be the number of usersfor this factor the LS-SVM had the lowest efficiencies mostlyin stratum 6 with values of RMSE (40) AARE (23)and 1198772 (08) This is mainly because of underestimationof values obtained in the months of January of 2013 and
January of 2014 During these months sudden changes inconsumption were observed and December showed thehighest consumption (16times 106m3) although January showedthe lowest (02 times 106m3) demonstrating that the model maybe sensitive to substantial changes when consumption inother months does not represent this trend (see Figure 6)Regardless all other months displayed good predictions asseen in Figure 6
For Ind and Com use factors that may influence waterconsumptionwere not taken into account such as economicsproduction or seasons Water consumption for these usesis controlled by governmental entities which means onlytwo factors (number of users and total billed) were con-sidered The Kruskal-Wallis test showed that both factorswere relevant For Ind use the model performed well withdifferences under 10 As for Com use lower RMSE andAARE values were observed clearly identifying the patternof demand for this use It is important to note that Com use
8 Mathematical Problems in Engineering
ReportedLS-SVMANN-BP
ReportedLS-SVMANN-BP
times105 times105Com m3month Ind m3month
8
9
10
11
10 15 205 10 15 205
20
22
24
26
28
30
32
Figure 7 Reported and forecasted data for commercial and industrial (LS-SVM and FNN-BP models) use
tended to exhibit less consumption between the months ofDecember and January though this dip was not as significantin magnitude for Com use as it was for stratum 6 (seeFigure 7)
5 Conclusions
This article presents LS-SVM as a method for forecastingwater demand and explores the effectiveness of this model forlong time scales
The LS-SVM model proves superior to the FNN-BPmodel in terms of accurately calculating water demand asevidenced by RMSE mostly under 1 and coefficient ofdetermination over 09 except for stratum 6 This exceptionis primarily attributable to overestimated values relative tothe real demands for the months of January 2013 and January2014
As for water consumption residential use demands morewater than other uses due to the number of users Strata 23 and 4 have the most users The Wilcoxon test shows thatstrata 5 and 6 stratum 4 and commercial use and stratum 1and industrial use present similar consumption despite theirdifferences in terms of number of users For price (amountpaid) by consumers only strata 5 and 6 display significantrelationships
It is important to note that Bogotarsquos demand is bestunderstood in groups The first group is affected by the priceand the number of users which applies to strata 2 3 and 5 aswell as Ind and Com useThe second group is the number ofusers as in the case of strata 1 4 and 6Therefore the numberof users is the most important factor in water consumptionessentially dictating water consumption behavior in Bogota
The LS-SVM proves least accurate for strata 4 and 6indicating that the model relies heavily on the number ofthe factors influencing water demand Thus more factorsincluded results in improved forecasting
Finally forecasting the behavior of water demand isclearly shown to be an effective tool for city planning andmanagement for it helps identify the need for administrativedecisions in order to regulate the consumption of differentstrata and uses
Competing Interests
The authors declare that there is no conflict of interestsregarding the publication of this paper
References
[1] GGhiassi D K Zimbra andH Saidane ldquoUrbanwater demandforecasting with a dynamic artificial neural network modelrdquoJournal of Water Resources Planning and Management vol 134no 2 pp 138ndash146 2008
[2] L A House-Peters and H Chang ldquoUrban water demand mod-eling review of concepts methods and organizing principlesrdquoWater Resources Research vol 47 no 5 Article IDW05401 2011
[3] J Bougadis K Adamowski andRDiduch ldquoShort-termmunic-ipal water demand forecastingrdquo Hydrological Processes vol 19no 1 pp 137ndash148 2005
[4] J-D Rinaudo ldquoLong-term water demand forecastingrdquo inUnderstanding and Managing Urban Water in Transition QGrafton K A Daniell C Nauges J-D Rinaudo and N W WChan Eds vol 15 of Global Issues in Water Policy pp 239ndash268Springer Amsterdam The Netherlands 2015
Mathematical Problems in Engineering 9
[5] E A Donkor T A Mazzuchi R Soyer and A RobersonldquoUrban water demand forecasting review of methods andmodelsrdquo Journal of Water Resources Planning and Managementvol 140 no 2 pp 146ndash159 2014
[6] W Li and Z Huicheng ldquoUrban water demand forecastingbased on HP filter and fuzzy neural networkrdquo Journal ofHydroinformatics vol 12 no 2 pp 172ndash184 2010
[7] M Nasseri A Moeini and M Tabesh ldquoForecasting monthlyurbanwater demandusing ExtendedKalmanFilter andGeneticProgrammingrdquo Expert Systems with Applications vol 38 no 6pp 7387ndash7395 2011
[8] R B Billings and C V Jones Forecasting UrbanWater DemandAmerican Water Works Association 2011
[9] S Gato N Jayasuriya and P Roberts ldquoTemperature and rainfallthresholds for base use urbanwater demandmodellingrdquo Journalof Hydrology vol 337 no 3-4 pp 364ndash376 2007
[10] M K Tiwari and J Adamowski ldquoUrban water demand fore-casting and uncertainty assessment using ensemble wavelet-bootstrap-neural network modelsrdquo Water Resources Researchvol 49 no 10 pp 6486ndash6507 2013
[11] D Kofinas N Mellios E Papageorgiou and C LaspidouldquoUrban water demand forecasting for the Island of SkiathosrdquoProcedia Engineering vol 89 pp 1023ndash1030 2014
[12] R B Billings and D E Agthe ldquoState-space versus multipleregression for forecasting urban water demandrdquo Journal ofWater Resources Planning and Management vol 124 no 2 pp113ndash117 1998
[13] M S Babel A D Gupta and P Pradhan ldquoA multivariateeconometric approach for domestic water demand modelingan application to Kathmandu NepalrdquoWater Resources Manage-ment vol 21 no 3 pp 573ndash589 2007
[14] A S Polebitski and R Palmer ldquoSeasonal residential waterdemand forecasting for census tractsrdquo Journal of WaterResources Planning and Management vol 136 no 1 pp 27ndash362010
[15] AAltunkaynakM Ozger andM Cakmakci ldquoWater consump-tion prediction of Istanbul City by using fuzzy logic approachrdquoWater Resources Management vol 19 no 5 pp 641ndash654 2005
[16] S Campisi-Pinto J Adamowski and G Oron ldquoForecastingurban water demand via wavelet-denoising and neural networkmodels Case study city of Syracuse Italyrdquo Water ResourcesManagement vol 26 no 12 pp 3539ndash3558 2012
[17] MHerrera L Torgo J Izquierdo and R Perez-Garcıa ldquoPredic-tivemodels for forecasting hourly urbanwater demandrdquo Journalof Hydrology vol 387 no 1-2 pp 141ndash150 2010
[18] J Liu H H G Savenije and J Xu ldquoForecast of water demandin Weinan City in China using WDF-ANNmodelrdquo Physics andChemistry of the Earth vol 28 no 4-5 pp 219ndash224 2003
[19] J S Wong Q Zhang and Y D Chen ldquoStatistical modeling ofdaily urban water consumption in Hong Kong trend changingpatterns and forecastrdquoWater Resources Research vol 46 no 32010
[20] L Chen and T-Q Zhang ldquoHourly water demand forecastmodel based on least squares support vector machinerdquo Journalof Harbin Institute of Technology vol 38 no 9 pp 1528ndash15302006
[21] G Ji J Wang Y Ge and H Liu ldquoUrban water demandforecasting by LS-SVM with tuning based on elitist teaching-learning-based optimizationrdquo in Proceedings of the 26th ChineseControl and Decision Conference (CCDC rsquo14) pp 3997ndash4002June 2014
[22] A Shabri and R Samsudin ldquoEmpirical mode decomposition-least squares support vector machine based for water demandforecastingrdquo International Journal of Advances in Soft Comput-ing and its Applications vol 7 no 2 pp 38ndash53 2015
[23] I S Msiza F V Nelwamondo and T Marwala ldquoArtificialneural networks and support vectormachines forwater demandtime series forecastingrdquo in Proceedings of the IEEE InternationalConference on Systems Man and Cybernetics (SMC rsquo07) pp638ndash643 Montreal Canada October 2007
[24] I S Msiza F V Nelwamondo and T Marwala ldquoWater demandprediction using artificial neural networks and support vectorregressionrdquo Journal of Computers vol 3 no 11 p 1 2008
[25] Y Bai P Wang C Li J Xie and Y Wang ldquoDynamic forecastof daily urban water consumption using a variable-structuresupport vector regression modelrdquo Journal of Water ResourcesPlanning and Management vol 141 no 3 2015
[26] B M Brentan E Luvizotto Jr M Herrera J Izquierdo andR Perez-Garcıa ldquoHybrid regression model for near real-timeurbanwater demand forecastingrdquo Journal of Computational andApplied Mathematics vol 309 pp 532ndash541 2017
[27] SWu andHWang ldquoResearch on the urbanwater consumptionprediction based on gray support vector machinerdquo Journal ofConvergence Information Technology vol 7 no 11 pp 351ndash3582012
[28] J Liu and M Chang ldquoWater demand prediction model basedon support vector machinerdquo Journal of Taiyuan University ofTechnology vol 39 article 299 2008
[29] X Chen ldquoPrediction of urban water demand based on GA-SVMrdquo in Proceedings of the International Conference on FutureComputer and Communication (FCC rsquo09) pp 285ndash288WuhanChina June 2009
[30] H-L Yang S-C Li F-C Zhang and Z-F Wu ldquoMethod andgrid workflow on water consumption forecasting of Ziyang citybased on support vector machine trained by genetic algorithmrdquoRecent Patents on Engineering vol 4 no 1 pp 51ndash55 2010
[31] A K Sampathirao J M Grosso P Sopasakis C Ocampo-Martinez A Bemporad and V Puig ldquoWater demand fore-casting for the optimal operation of large-scale drinking waternetworks the BarcelonaCase Studyrdquo IFACProceedingsVolumesvol 47 no 3 pp 10457ndash10462 2014
[32] L Zhang X Chen B Liu and Z Wang ldquoSVM model of waterdemand prediction based onAGArdquo Journal of ChinaHydrologyvol 28 pp 116ndash120 2008
[33] C U Mallarino Estratificacion Social en Bogota De la PolıticaPublica a la Dinamica de la Segregacion Social UniversitasHumanıstica 2008
[34] V N Vapnik Statistical Learning Theory John Wiley amp Sons1998
[35] D A Lopez-Sarmiento H C Manta-Caro and N E Vera-Parra ldquoLeast square support vector machine classifier vs alogistic regression classifier on the recognition of numericdigitsrdquo Tecno Logicas no 3 pp 37ndash51 2013
[36] S H Hwang D H Ham and J H Kim ldquoForecasting perfor-mance of LS-SVM for nonlinear hydrological time seriesrdquoKSCEJournal of Civil Engineering vol 16 no 5 pp 870ndash882 2012
[37] J A K Suykens and J Vandewalle ldquoLeast squares supportvector machine classifiersrdquo Neural Processing Letters vol 9 no3 pp 293ndash300 1999
[38] J Chai J Du K K Lai and Y P Lee ldquoA hybrid least squaresupport vector machine model with parameters optimizationfor stock forecastingrdquo Mathematical Problems in Engineeringvol 2015 Article ID 231394 7 pages 2015
10 Mathematical Problems in Engineering
[39] M M Mohamed and A A Al-Mualla ldquoWater DemandForecasting in Umm Al-Quwain (UAE) using the IWR-MAINSpecify Forecasting ModelrdquoWater Resources Management vol24 no 14 pp 4093ndash4120 2010
[40] M M Mohamed and A A Al-Mualla ldquoWater demand fore-casting in Umm Al-Quwain using the constant rate modelrdquoDesalination vol 259 no 1ndash3 pp 161ndash168 2010
Submit your manuscripts athttpwwwhindawicom
Hindawi Publishing Corporationhttpwwwhindawicom Volume 2014
MathematicsJournal of
Hindawi Publishing Corporationhttpwwwhindawicom Volume 2014
Mathematical Problems in Engineering
Hindawi Publishing Corporationhttpwwwhindawicom
Differential EquationsInternational Journal of
Volume 2014
Applied MathematicsJournal of
Hindawi Publishing Corporationhttpwwwhindawicom Volume 2014
Probability and StatisticsHindawi Publishing Corporationhttpwwwhindawicom Volume 2014
Journal of
Hindawi Publishing Corporationhttpwwwhindawicom Volume 2014
Mathematical PhysicsAdvances in
Complex AnalysisJournal of
Hindawi Publishing Corporationhttpwwwhindawicom Volume 2014
OptimizationJournal of
Hindawi Publishing Corporationhttpwwwhindawicom Volume 2014
CombinatoricsHindawi Publishing Corporationhttpwwwhindawicom Volume 2014
International Journal of
Hindawi Publishing Corporationhttpwwwhindawicom Volume 2014
Operations ResearchAdvances in
Journal of
Hindawi Publishing Corporationhttpwwwhindawicom Volume 2014
Function Spaces
Abstract and Applied AnalysisHindawi Publishing Corporationhttpwwwhindawicom Volume 2014
International Journal of Mathematics and Mathematical Sciences
Hindawi Publishing Corporationhttpwwwhindawicom Volume 2014
The Scientific World JournalHindawi Publishing Corporation httpwwwhindawicom Volume 2014
Hindawi Publishing Corporationhttpwwwhindawicom Volume 2014
Algebra
Discrete Dynamics in Nature and Society
Hindawi Publishing Corporationhttpwwwhindawicom Volume 2014
Hindawi Publishing Corporationhttpwwwhindawicom Volume 2014
Decision SciencesAdvances in
Discrete MathematicsJournal of
Hindawi Publishing Corporationhttpwwwhindawicom
Volume 2014 Hindawi Publishing Corporationhttpwwwhindawicom Volume 2014
Stochastic AnalysisInternational Journal of
2 Mathematical Problems in Engineering
(maximum and minimum temperature) sunshine hoursprice water use working day greenery coverage buildingsize population density and type of use For medium scalethe main factors are season greenery coverage price build-ing size water use population density and type of use As forlong scale pertinent factors include climate or season pricewater use per capita demand population density and type ofuse [5]
According to Kofinas et al [11] models for water demandforecasting can be divided into two types deterministic andstochastic The former is used for short and medium scalesprimary approaches include simple multiple semilog andlog-log regressions [11ndash14] As for the latter these are mostoften used for large-scale models such as autoregressivemoving average autoregressive moving average autoregres-sive integrated moving average Artificial Neural Networks(ANN) fuzzy logic and support vector machines [15ndash19]models
This paper forecasts water demand for residential indus-trial and commercial uses in the city of Bogota usingLeast-Squares Support Vector Machines (LS-SVM)The dataanalyzed herein was recorded on a monthly basis from 2004to 2014 these data include the number of users price (totalbilled) and consumption
In the next section readers are presented with a literaturereview on water demand forecasting using support vectormachine (SVM) support vector regression (SVR) and LS-SVM In the following section water use is studied as afunction of land use also the model along with its variablesis discussed In the final section results and conclusions arepresented
2 Literature Review
This chapter presents a concise review of research that hasrelied on SVM SVR and LS-SVM models especially withregard to water demand forecasting
Chen and Zhang [20] used a LS-SVM model to calculatehourly demands the authors found that the LS-SVM modelperformed better than an artificial Feedforward Neural Net-work Backpropagation (FNN-BP) mainly due to the fact thatLS-SVM is based on structural risk mitigation this type ofmitigation considers the experience risks and confidenceintervals by which the minimization of risk leads to a moreaccurate prediction Ji et al [21] compared four differentalgorithmsmdashteaching-learning-based optimization (TLBO)ameliorated TLBO (ATLBO) grid search and particle swarmoptimization (PSO)mdashto adjust the hyperparameters of LS-SVMfor forecasting hourlywater demand inYanqia inChinathe researchersrsquo results showed that the model with ATLBOwas more accurate with better precision than the other algo-rithms Shabri and Samsudin [22] applied Empirical ModeDecomposition (EMD) to the intrinsic mode function in theANN and LS-SVM they found that the EMD combined withLS-SVM performed best (root-mean-square error (RMSE)= 20 and Mean Absolute Error (MAE) = 164) for monthlyforecasting water demand followed by LS-SVM (RMSE = 21and MAE = 181) and EMD combined with ANN (RMSE =271 and MAE = 186)
Msiza et al [23 24] compared Artificial Neural Network(ANN) to SVR finding that the RNAmodel performed better(with an error rate of 295) though despite a greater errorrate (546) SVM model satisfactorily described demandbehavior Herrera et al [17] predicted hourly water demandin southeast Spain using climate factors such as temperaturewind speed precipitation and atmospheric pressure Theauthors used the following models RNA Projection Pur-suit Regression Multivariate Adaptive Regression SplinesRandom Forests Weighted Pattern-Based Model for waterdemand forecasting and SVR The authors found that SVRpresented less error proposing it as the most appropriatemodel for the forecast of hourly demands Bai et al [25]proposed a variable-structure support vector regression (VS-SVR) and compared it with LS-SVM They found thatVS-SVR was more accurate and improved the forecastingperformance on account of being a dynamic model Brentanet al [26] compared an SVR with a hybrid model (SVR witha Fourier Time Series) for hourly water demand forecastingTheir results showed that SVR described a pattern yet hadproblems with extreme values whereas the hybrid modelperformed better in terms of pattern description and reducederrors considerably
During the same year Wu and Wang [27] assessed theperformance of a support vector machine for annual datafinding that for the dataset evaluated relative errors of091 186 and 093 were detected This according tothe authors demonstrated that the SVM was highly accuratefor demand forecasting Liu and Chang [28] used SVM forforecasting monthly water demand in Shanxi China theauthorsrsquo results showed that SVM prediction proved betterwhen the sample size was relatively small Chen [29] andYanget al [30] optimized SVM with a Genetic Algorithm (GA-SVM) to determine training parameters for SVM For pur-poses of evaluation the authors compared their optimizedmodel to ANN and GreyModel (GM) finding that GA-SVMperformed well relative to ANN and GM Another studydone by Sampathirao et al [31] included a comparison ofthree different approaches ARIMA Box-Cox transforma-tion ARMA Errors Trends and Seasonality (BATS) andSVM Based on their study the authors concluded that theBATSmodelwas best at predictingwater demandwith valuesof 00043 from mean square error (MSE) and 0058 fromRMSE Zhang et al [32] optimized the SVM with AGG(asexual genetic algorithm)This optimization was comparedto Backpropagation Neural Network (BPNN) for forecastingwater demand with results indicating SVPwasmore accuratefor this problem
3 Materials and Methods
Bogota is Colombiarsquos largest urban center With more thaneight million people Bogota accounts for more than 17 ofthe countryrsquos total population It is located in the easterncordillera of the Andean mountain range at 2630 metersabove sea level The cityrsquos total area is 163574 hectares thisarea is subdivided into 12 urban areas one rural area andseven ldquolocalitiesrdquo with mixed urban and rural areas Figure 1depicts the urban area To provide context the urban area
Mathematical Problems in Engineering 3
Pipe network distributionBogotaacute urban area
N
S
EW
Figure 1 Bogotarsquos main network water supply
only represents 2349 of the cityrsquos total physical space butit contains 9992 of the cityrsquos population
Currently the city uses a socioeconomic stratificationsystem in accordance with domestic laws regarding publicservices This system classifies housing into six brackets rel-ative to its surroundings and construction materials Underthis system the poorest sector of society has its servicessubsidized by those living in richer sectors those living inldquohigherrdquo strata pay more for the same services received bythose living in lower strata [33] With regard to land use alocal resolution organizes territory into areas and providesguidelines on the needs and projects to be carried out
Bogota has identified six different land uses residential(R) industrial (Ind) commercial (Com) special officialand multiuser use R and multiuser categories are furtherdivided into the six aforementioned social strata (R1 R2 R3R4 R5 and R6) All strata obtain drinking water through acity-owned public company
31 Data For forecasting water demand in Bogota werely on the number of users per type of use and strataper month (119880119894) as well as the value billed for monthly
+ 00
6e + 06
0e
0e + 00
3e + 05
00e + 00
15e + 10
2005
2006
2007
2008
2009
2010
2011
2012
2013
2014
2004
Water consumption m3
2005
2006
2007
2008
2009
2010
2011
2012
2013
2014
2004
Total number of users per year
2005
2006
2007
2008
2009
2010
2011
2012
2013
2014
2004
Total billed per year
Figure 2 Behavior of water consumption total number of users peryear and total billed from 2004 to 2014
consumption per use (119875119894) These variables were selectedafter we identified direct correlations (086 and 092 119901value lt 005) and a statistically significant effect on monthlywater consumption (119882119863119894) Climate and greenery coveragewere depreciable by the weather conditions (average annualtemperature 131∘C maximum annual temperature 193∘Cminimum annual temperature 784∘C and average monthlyprecipitation 6632mm) Price was not a factor for usersespecially R1 R2 and R3 due to the nature of the subsidiesWe obtained values through the Single Information Systemwebsite (wwwsuigovcoSUIAuthlogonjsp) The relation-ship between these factors and demand can be expressed by
119882119863119894 = 119891 (119880119894 119875119894) 119894 = 1 119899 (1)
where 119899 represents the number of land uses and the numberof strata for residential uses
The water demand estimate was based on records fromJanuary 2004 toDecember 2014 Ghiassi et al [1] proposed an8020 ratio (80 training data to 20 test data) for optimalcalibration models Therefore training data was taken fromJanuary 2004 to December 2012 (108 pieces of data) and testdata from January 2013 to December 2014 (24 pieces of data)In Figure 2 we see the behavior of water consumption totalnumber of users and total billed from 2004 to 2014
For this paper only R (R1 R2 R3 R4 R5 and R6)Ind and Com land uses were evaluated due to the lackof information for special and official land uses To notemultiusers are included within the R strata
R use demandsmorewater than other uses which is likelyattributable to the number of residential users The stratawith the most users are 2 3 and 4 mainly owing to twocauses these two strata (2 and 3) include the highest numberof users associated with Bogotarsquos growth and the nature ofthe subsidies That is stratum 2 is subsidized and located inurban areaswith good infrastructure and strata 3 and 4whilenot subsidized do not pay higher rates to subsidize strata 1and 2 and have good infrastructure Together these causesunderscore the desirability of these areas for residents
4 Mathematical Problems in Engineering
Water consumption m3 Number of users Total billed ($month)
3e + 05
2e + 05
1e + 05
0e + 00
R4R1 R2 R3 R5 R6Ind
Com
Ind R1 R2 R3 R4 R5 R6
Com
Ind R1 R2 R3 R4 R5 R6
Com
0e + 00
2e + 06
4e + 06
6e + 06
8e + 06
00e + 00
50e + 09
10e + 10
15e + 10
20e + 10
Figure 3 Boxplot of water consumption number of users and billed consumption for Bogotarsquos land
The Wilcoxon test showed that strata 5 and 6 stratum 4and Com use and stratum 1 and Ind use presented similarconsumption despite their differences in terms of numberof users For price (amount paidtotal billed) by consumersonly strata 5 and 6 displayed significant relationships (seeFigure 3)
32 LS-SVM Estimator SVM is a classification and regres-sion method with origins in statistical learning theory [34]When it is applied to a regression SVM can be summarizedas follows with a set of data (represented in a 119899-dimensionalplane) that are not linearly divisible data are mapped ontoa space with a larger dimension in order to obtain a linearregression [35]
The LS-SVM model was first proposed by Suykens andVandewalle and it differs from the SVM in how to find thehyperplane SVM employs the principle of structural riskminimization whereas LS-SVM employs a linear system ina double space under the minimum quadratic cost functionThe LS-SVM training process involves the selection of kernelparameters and the regulation of the cost function usingcross-validation or Bayesian techniques [36 37]
The LS-SVM structure can be understood as follows ifthere is a set of data x119894 119910119894119873119894=1 then the following nonlinearfunction is estimated
119910119894 = w119879120593 (x119894) + 119887 (2)
where x isin R119899 represents system inputs 119910 isin R outputs and120593(x119894) R119899 rarr R119899ℎ mapping to a higher dimension (possiblyinfinite) of a featured space As previously mentioned thetraditional SVM solves the problem of finding the best hyper-plane using the principle of structural risk minimization
and the LS-SVM optimizes the problem with the followingequation
minw119887119890
119891 (w119887 119890) = 12w119879w + 120574 12 119873sum119894=1
1198902119894 st 119910119894 = w119879120593 (x119894) + 119887 + 119890119894 119894 = 1 119873
(3)
By applying a Lagrange multiplier in (2) the following equa-tion is obtained
L (w 119887 119890119894 120572119894) = 119891 (119908 119890119894)minus 119873sum119894=1
120572119894 w119879120593 (x119894) + 119887 + 119890119894 minus 119910119894 (4)
where 120574 is the regularization parameter by which the com-plexity of the model is balanced and 120572119894 is the Lagrangemultiplier with eligibility conditions obtained from a set ofthe following set of equations120597L120597119908 = 0 997888rarr
119908 = 119873sum119894=1
120572119894120593 (x119894)120597L120597119887 = 0 997888rarr119873sum119894=1
120572119894 = 0
Mathematical Problems in Engineering 5
Table 1 Statistical performance of LS-SVM and FNN-BPMmodels
Land use LS-SVM FNN-BPRMSE AARE () 1198772 RMSE AARE () 1198772
R1 00081 645 093 00104 855 088R2 00023 354 096 00048 561 093R3 00089 75 092 00119 956 050R4 00194 1158 091 00387 1371 090R5 00078 765 098 01258 1585 097R6 04005 230 08 0598 2587 067Industrial 00043 586 094 00052 63 082Commercial 00012 269 098 00034 447 084
120597L120597119890119894 = 0 997888rarr120572119894 = 120574119890119894120597L120597120572119894 = 0 997888rarr119908119879 = 119873sum
119894=1
120572119894120593 (x119894)119894 = 1 119873(5)
By eliminating 119908 and 119890119894 the following linear system isobtained
[0 1119879
1 Ω + 120574minus1I] [119887120572
] = [0y
] (6)
With I = [1 1 1]119879 y = [1199101 1199102 119910119899]119879 120572 = [1205721 1205722 120572119899]119879 Mercerrsquos condition is applied in the kernel matrixΩ
Ω = 119870 (x x119894) = 120593 (x119894) sdot 120593 (x119895) (7)
The model for regressions is
119910 (x) = 119873sum119894=1
120572119894119870 (x x119894) + 119887 (8)
where 120572 and 119887 are the solution to (6) and (8) and 119870(x x119894)is defined as the kernel function which is a value of theinner product of two vectors x119894 and x119895 in the space of 120593(x119894)and 120593(x119895) which is 119870(x119894 x119895) = 120593(x119894)119879120593(x119895) For this studythe radial basis function (RBF) was selected as the kernelfunction because it offers good performance under generalassumptions of smoothness for that reason this function isespecially useful when no additional data are available TheRBF is expressed as follows [38]
119870 (119909119894 119909119895) = exp(minus 10038161003816100381610038161003816x119894 minus x1198951003816100381610038161003816100381621205902 ) (9)
where 1205902 is the width of the band from the kernelrsquos RBFFigure 4 shows the structure of the LS-SVM where1198831 1198832 119883119899 are the input data and (119910119894) the output
x1
x2
xn
1205721
1205722
120572m
sum yi
b
Bias b
K(x x1)
K(x x2)
K(x xm)
Figure 4 LS-SVM structure
33 Evaluation Model To verify the accuracy of this modelcomparison was done using an artificial Feedforward NeuralNetwork Backpropagation for which a learning rate of 001assorted the number of hidden layers (1 to 10) until the leastmean square error (MSE) was found For this process thesame number of data was used for calibration and evaluationAfter obtaining the demand results three different statisticalmetrics were used (i) RMSE (ii) the absolute average of rela-tive errors (AARE) and (iii) the coefficient of determination(1198772) Mohamed and Al-Mualla used these three metrics formonthly forecasting [39 40]
RMSE = radic 1119899 119899sum119894=1
( 119874119894 minus 119863119894119874119894 )2AARE = 1119899 119899sum
119894=1
10038161003816100381610038161003816100381610038161003816 119874119894 minus 119863119894119874119894 10038161003816100381610038161003816100381610038161003816 times 1001198772 = ( sum119899119894 (119874119894 minus 119863119894) minus (119863119894 minus 119863)radicsum119899119894=1 (119874119894 minus 119874)2 (119863119894 minus 119863)2)
2
(10)
Finally to evaluate the significance of the factors (numberof users and total billed) for each stratum with regard tovalidation a Kruskal-Wallis test was performed
4 Results
Table 1 shows the performance of both LS-SVM and FNN-BPmodels in terms of predicting water demand for all land uses
6 Mathematical Problems in Engineering
R1 R2 R3
R4 R5 R6
Ind Com
minus5
0
5
10
15
20
25
Diff
eren
ce (
)
minus25
minus20
minus15
minus10
minus5
0
5
10
Diff
eren
ce (
)
minus15
minus10
minus5
0
Diff
eren
ce (
)
minus200
minus150
minus100
minus50
0
Diff
eren
ce (
)
minus10
minus8
minus6
minus4
minus2
0
Diff
eren
ce (
)
minus10
minus8
minus6
minus4
minus2
0
Diff
eren
ce (
)
minus10
minus8
minus6
minus4
minus2
0
2
Diff
eren
ce (
)minus20
minus15
minus10
minus5
0
5
10
Diff
eren
ce (
)
Figure 5 Differences () between values predicted by LS-SVM and reported data for user and strata
according to the aforementioned statistical metrics employedin Mohamed and Al-Mualla [39 40]
In the LS-SVM model most results for RMSE valueswere under 2 (except for stratum 6) more informationwill be provided below This indicates that the distributionof errors between the model and the reported data reportedwas very low As for the modelrsquos efficiency (measured asaccurate prediction of the reported data) AARE values wereunder 8 for LS-SVM model (except for strata 4 and 6)which reflects its forecasting ability Finally the coefficientof determination showed values over 09 (except for stratum6) which means that there is a strong relationship betweenthe reported and calculated data another sign of the modelrsquosutility
The FNN-BP model despite its relatively inferior perfor-mance which is reflected in higher RMSE and AARE andlower 1198772 values predicted the behavior of the demand foreach type of use Nonetheless the forecast for strata 1 3 45 and 6 had AARE greater than 8 and 1198772 low in strata 6and 3
The SL-SVM performance is evidence that this model issuitable for predicting water consumption at long and shortscales as presented byChen andZhang [20] at an hourly scaleand Hwang et al [36] at a daily scale
See Figure 5 for the differences between the reported dataand the calculated data in terms of use
For stratum 1 the model presented greater underesti-mates because the economic value of the service is not
Mathematical Problems in Engineering 7
times105 times105 times105
times105 times105 times105
ReportedLS-SVMANN-BP
ReportedLS-SVMANN-BP
ReportedLS-SVMANN-BP
R1 m3month R2 m3month R3 m3month
R4 m3month R5 m3month R6 m3month
5 15 2010
5 15 2010 5 15 2010 5 15 2010
5 15 20105 15 2010
45
50
55
60
65
70
45
50
55
60
65
70
75
6
8
10
12
14
16
18
20
22
14
18
22
26
30
34
2
4
6
8
10
12
14
16
2
4
6
8
10
12
14
16
Figure 6 Reported and forecasted water consumption for residential use (LS-SVM and FNN-BP models)
an important factor in consumption Instead the numberof users is significant (119901 value lt 005) Therefore thisconsumption depends on increases in the number of usersand the cityrsquos economic growth
As for strata 2 3 and 5 both factors affected theresult however forecasting for stratum 5 presented the mostvariability of these three strata In line with these findingsthe number of users represented a greater challenge for theFNN-BP presenting the highest RMSE (1258) and AARE(1585) values For LS-SVM this stratum (R5) produced thehigher values of these two strata (R2 and R3) with RMSE andAARE values of 765 and 78 respectively
For strata 4 and 6 the Kruskal-Wallis test showed that themost important factor turned out to be the number of usersfor this factor the LS-SVM had the lowest efficiencies mostlyin stratum 6 with values of RMSE (40) AARE (23)and 1198772 (08) This is mainly because of underestimationof values obtained in the months of January of 2013 and
January of 2014 During these months sudden changes inconsumption were observed and December showed thehighest consumption (16times 106m3) although January showedthe lowest (02 times 106m3) demonstrating that the model maybe sensitive to substantial changes when consumption inother months does not represent this trend (see Figure 6)Regardless all other months displayed good predictions asseen in Figure 6
For Ind and Com use factors that may influence waterconsumptionwere not taken into account such as economicsproduction or seasons Water consumption for these usesis controlled by governmental entities which means onlytwo factors (number of users and total billed) were con-sidered The Kruskal-Wallis test showed that both factorswere relevant For Ind use the model performed well withdifferences under 10 As for Com use lower RMSE andAARE values were observed clearly identifying the patternof demand for this use It is important to note that Com use
8 Mathematical Problems in Engineering
ReportedLS-SVMANN-BP
ReportedLS-SVMANN-BP
times105 times105Com m3month Ind m3month
8
9
10
11
10 15 205 10 15 205
20
22
24
26
28
30
32
Figure 7 Reported and forecasted data for commercial and industrial (LS-SVM and FNN-BP models) use
tended to exhibit less consumption between the months ofDecember and January though this dip was not as significantin magnitude for Com use as it was for stratum 6 (seeFigure 7)
5 Conclusions
This article presents LS-SVM as a method for forecastingwater demand and explores the effectiveness of this model forlong time scales
The LS-SVM model proves superior to the FNN-BPmodel in terms of accurately calculating water demand asevidenced by RMSE mostly under 1 and coefficient ofdetermination over 09 except for stratum 6 This exceptionis primarily attributable to overestimated values relative tothe real demands for the months of January 2013 and January2014
As for water consumption residential use demands morewater than other uses due to the number of users Strata 23 and 4 have the most users The Wilcoxon test shows thatstrata 5 and 6 stratum 4 and commercial use and stratum 1and industrial use present similar consumption despite theirdifferences in terms of number of users For price (amountpaid) by consumers only strata 5 and 6 display significantrelationships
It is important to note that Bogotarsquos demand is bestunderstood in groups The first group is affected by the priceand the number of users which applies to strata 2 3 and 5 aswell as Ind and Com useThe second group is the number ofusers as in the case of strata 1 4 and 6Therefore the numberof users is the most important factor in water consumptionessentially dictating water consumption behavior in Bogota
The LS-SVM proves least accurate for strata 4 and 6indicating that the model relies heavily on the number ofthe factors influencing water demand Thus more factorsincluded results in improved forecasting
Finally forecasting the behavior of water demand isclearly shown to be an effective tool for city planning andmanagement for it helps identify the need for administrativedecisions in order to regulate the consumption of differentstrata and uses
Competing Interests
The authors declare that there is no conflict of interestsregarding the publication of this paper
References
[1] GGhiassi D K Zimbra andH Saidane ldquoUrbanwater demandforecasting with a dynamic artificial neural network modelrdquoJournal of Water Resources Planning and Management vol 134no 2 pp 138ndash146 2008
[2] L A House-Peters and H Chang ldquoUrban water demand mod-eling review of concepts methods and organizing principlesrdquoWater Resources Research vol 47 no 5 Article IDW05401 2011
[3] J Bougadis K Adamowski andRDiduch ldquoShort-termmunic-ipal water demand forecastingrdquo Hydrological Processes vol 19no 1 pp 137ndash148 2005
[4] J-D Rinaudo ldquoLong-term water demand forecastingrdquo inUnderstanding and Managing Urban Water in Transition QGrafton K A Daniell C Nauges J-D Rinaudo and N W WChan Eds vol 15 of Global Issues in Water Policy pp 239ndash268Springer Amsterdam The Netherlands 2015
Mathematical Problems in Engineering 9
[5] E A Donkor T A Mazzuchi R Soyer and A RobersonldquoUrban water demand forecasting review of methods andmodelsrdquo Journal of Water Resources Planning and Managementvol 140 no 2 pp 146ndash159 2014
[6] W Li and Z Huicheng ldquoUrban water demand forecastingbased on HP filter and fuzzy neural networkrdquo Journal ofHydroinformatics vol 12 no 2 pp 172ndash184 2010
[7] M Nasseri A Moeini and M Tabesh ldquoForecasting monthlyurbanwater demandusing ExtendedKalmanFilter andGeneticProgrammingrdquo Expert Systems with Applications vol 38 no 6pp 7387ndash7395 2011
[8] R B Billings and C V Jones Forecasting UrbanWater DemandAmerican Water Works Association 2011
[9] S Gato N Jayasuriya and P Roberts ldquoTemperature and rainfallthresholds for base use urbanwater demandmodellingrdquo Journalof Hydrology vol 337 no 3-4 pp 364ndash376 2007
[10] M K Tiwari and J Adamowski ldquoUrban water demand fore-casting and uncertainty assessment using ensemble wavelet-bootstrap-neural network modelsrdquo Water Resources Researchvol 49 no 10 pp 6486ndash6507 2013
[11] D Kofinas N Mellios E Papageorgiou and C LaspidouldquoUrban water demand forecasting for the Island of SkiathosrdquoProcedia Engineering vol 89 pp 1023ndash1030 2014
[12] R B Billings and D E Agthe ldquoState-space versus multipleregression for forecasting urban water demandrdquo Journal ofWater Resources Planning and Management vol 124 no 2 pp113ndash117 1998
[13] M S Babel A D Gupta and P Pradhan ldquoA multivariateeconometric approach for domestic water demand modelingan application to Kathmandu NepalrdquoWater Resources Manage-ment vol 21 no 3 pp 573ndash589 2007
[14] A S Polebitski and R Palmer ldquoSeasonal residential waterdemand forecasting for census tractsrdquo Journal of WaterResources Planning and Management vol 136 no 1 pp 27ndash362010
[15] AAltunkaynakM Ozger andM Cakmakci ldquoWater consump-tion prediction of Istanbul City by using fuzzy logic approachrdquoWater Resources Management vol 19 no 5 pp 641ndash654 2005
[16] S Campisi-Pinto J Adamowski and G Oron ldquoForecastingurban water demand via wavelet-denoising and neural networkmodels Case study city of Syracuse Italyrdquo Water ResourcesManagement vol 26 no 12 pp 3539ndash3558 2012
[17] MHerrera L Torgo J Izquierdo and R Perez-Garcıa ldquoPredic-tivemodels for forecasting hourly urbanwater demandrdquo Journalof Hydrology vol 387 no 1-2 pp 141ndash150 2010
[18] J Liu H H G Savenije and J Xu ldquoForecast of water demandin Weinan City in China using WDF-ANNmodelrdquo Physics andChemistry of the Earth vol 28 no 4-5 pp 219ndash224 2003
[19] J S Wong Q Zhang and Y D Chen ldquoStatistical modeling ofdaily urban water consumption in Hong Kong trend changingpatterns and forecastrdquoWater Resources Research vol 46 no 32010
[20] L Chen and T-Q Zhang ldquoHourly water demand forecastmodel based on least squares support vector machinerdquo Journalof Harbin Institute of Technology vol 38 no 9 pp 1528ndash15302006
[21] G Ji J Wang Y Ge and H Liu ldquoUrban water demandforecasting by LS-SVM with tuning based on elitist teaching-learning-based optimizationrdquo in Proceedings of the 26th ChineseControl and Decision Conference (CCDC rsquo14) pp 3997ndash4002June 2014
[22] A Shabri and R Samsudin ldquoEmpirical mode decomposition-least squares support vector machine based for water demandforecastingrdquo International Journal of Advances in Soft Comput-ing and its Applications vol 7 no 2 pp 38ndash53 2015
[23] I S Msiza F V Nelwamondo and T Marwala ldquoArtificialneural networks and support vectormachines forwater demandtime series forecastingrdquo in Proceedings of the IEEE InternationalConference on Systems Man and Cybernetics (SMC rsquo07) pp638ndash643 Montreal Canada October 2007
[24] I S Msiza F V Nelwamondo and T Marwala ldquoWater demandprediction using artificial neural networks and support vectorregressionrdquo Journal of Computers vol 3 no 11 p 1 2008
[25] Y Bai P Wang C Li J Xie and Y Wang ldquoDynamic forecastof daily urban water consumption using a variable-structuresupport vector regression modelrdquo Journal of Water ResourcesPlanning and Management vol 141 no 3 2015
[26] B M Brentan E Luvizotto Jr M Herrera J Izquierdo andR Perez-Garcıa ldquoHybrid regression model for near real-timeurbanwater demand forecastingrdquo Journal of Computational andApplied Mathematics vol 309 pp 532ndash541 2017
[27] SWu andHWang ldquoResearch on the urbanwater consumptionprediction based on gray support vector machinerdquo Journal ofConvergence Information Technology vol 7 no 11 pp 351ndash3582012
[28] J Liu and M Chang ldquoWater demand prediction model basedon support vector machinerdquo Journal of Taiyuan University ofTechnology vol 39 article 299 2008
[29] X Chen ldquoPrediction of urban water demand based on GA-SVMrdquo in Proceedings of the International Conference on FutureComputer and Communication (FCC rsquo09) pp 285ndash288WuhanChina June 2009
[30] H-L Yang S-C Li F-C Zhang and Z-F Wu ldquoMethod andgrid workflow on water consumption forecasting of Ziyang citybased on support vector machine trained by genetic algorithmrdquoRecent Patents on Engineering vol 4 no 1 pp 51ndash55 2010
[31] A K Sampathirao J M Grosso P Sopasakis C Ocampo-Martinez A Bemporad and V Puig ldquoWater demand fore-casting for the optimal operation of large-scale drinking waternetworks the BarcelonaCase Studyrdquo IFACProceedingsVolumesvol 47 no 3 pp 10457ndash10462 2014
[32] L Zhang X Chen B Liu and Z Wang ldquoSVM model of waterdemand prediction based onAGArdquo Journal of ChinaHydrologyvol 28 pp 116ndash120 2008
[33] C U Mallarino Estratificacion Social en Bogota De la PolıticaPublica a la Dinamica de la Segregacion Social UniversitasHumanıstica 2008
[34] V N Vapnik Statistical Learning Theory John Wiley amp Sons1998
[35] D A Lopez-Sarmiento H C Manta-Caro and N E Vera-Parra ldquoLeast square support vector machine classifier vs alogistic regression classifier on the recognition of numericdigitsrdquo Tecno Logicas no 3 pp 37ndash51 2013
[36] S H Hwang D H Ham and J H Kim ldquoForecasting perfor-mance of LS-SVM for nonlinear hydrological time seriesrdquoKSCEJournal of Civil Engineering vol 16 no 5 pp 870ndash882 2012
[37] J A K Suykens and J Vandewalle ldquoLeast squares supportvector machine classifiersrdquo Neural Processing Letters vol 9 no3 pp 293ndash300 1999
[38] J Chai J Du K K Lai and Y P Lee ldquoA hybrid least squaresupport vector machine model with parameters optimizationfor stock forecastingrdquo Mathematical Problems in Engineeringvol 2015 Article ID 231394 7 pages 2015
10 Mathematical Problems in Engineering
[39] M M Mohamed and A A Al-Mualla ldquoWater DemandForecasting in Umm Al-Quwain (UAE) using the IWR-MAINSpecify Forecasting ModelrdquoWater Resources Management vol24 no 14 pp 4093ndash4120 2010
[40] M M Mohamed and A A Al-Mualla ldquoWater demand fore-casting in Umm Al-Quwain using the constant rate modelrdquoDesalination vol 259 no 1ndash3 pp 161ndash168 2010
Submit your manuscripts athttpwwwhindawicom
Hindawi Publishing Corporationhttpwwwhindawicom Volume 2014
MathematicsJournal of
Hindawi Publishing Corporationhttpwwwhindawicom Volume 2014
Mathematical Problems in Engineering
Hindawi Publishing Corporationhttpwwwhindawicom
Differential EquationsInternational Journal of
Volume 2014
Applied MathematicsJournal of
Hindawi Publishing Corporationhttpwwwhindawicom Volume 2014
Probability and StatisticsHindawi Publishing Corporationhttpwwwhindawicom Volume 2014
Journal of
Hindawi Publishing Corporationhttpwwwhindawicom Volume 2014
Mathematical PhysicsAdvances in
Complex AnalysisJournal of
Hindawi Publishing Corporationhttpwwwhindawicom Volume 2014
OptimizationJournal of
Hindawi Publishing Corporationhttpwwwhindawicom Volume 2014
CombinatoricsHindawi Publishing Corporationhttpwwwhindawicom Volume 2014
International Journal of
Hindawi Publishing Corporationhttpwwwhindawicom Volume 2014
Operations ResearchAdvances in
Journal of
Hindawi Publishing Corporationhttpwwwhindawicom Volume 2014
Function Spaces
Abstract and Applied AnalysisHindawi Publishing Corporationhttpwwwhindawicom Volume 2014
International Journal of Mathematics and Mathematical Sciences
Hindawi Publishing Corporationhttpwwwhindawicom Volume 2014
The Scientific World JournalHindawi Publishing Corporation httpwwwhindawicom Volume 2014
Hindawi Publishing Corporationhttpwwwhindawicom Volume 2014
Algebra
Discrete Dynamics in Nature and Society
Hindawi Publishing Corporationhttpwwwhindawicom Volume 2014
Hindawi Publishing Corporationhttpwwwhindawicom Volume 2014
Decision SciencesAdvances in
Discrete MathematicsJournal of
Hindawi Publishing Corporationhttpwwwhindawicom
Volume 2014 Hindawi Publishing Corporationhttpwwwhindawicom Volume 2014
Stochastic AnalysisInternational Journal of
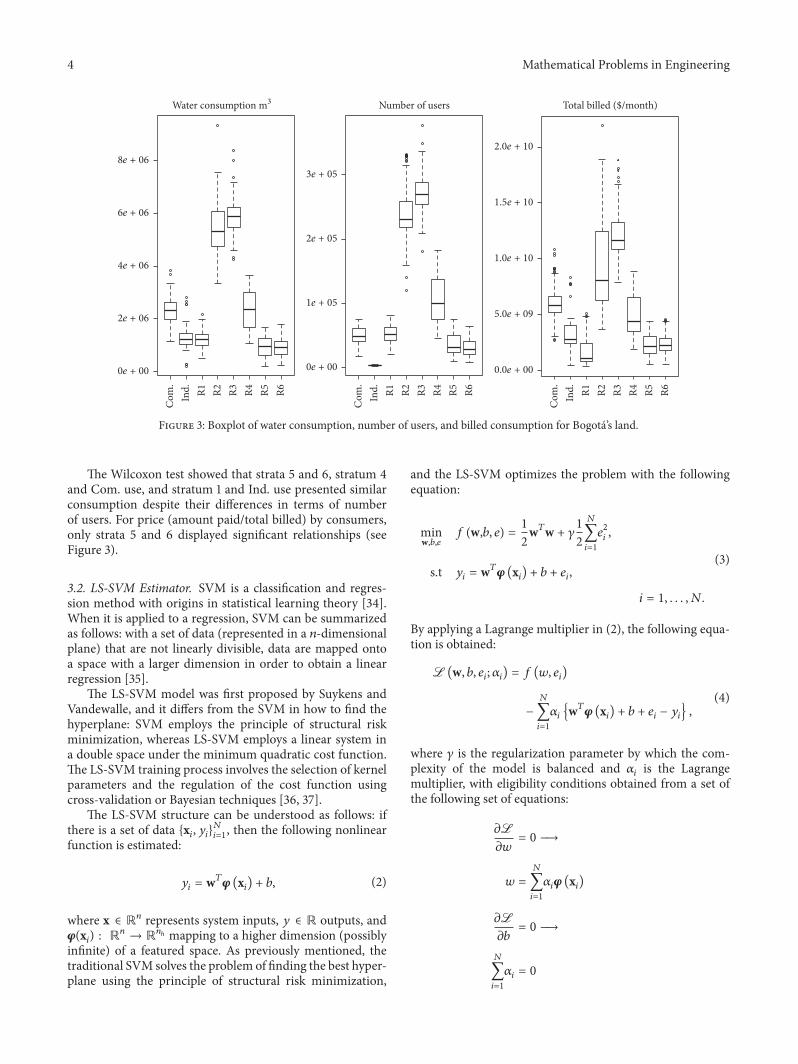
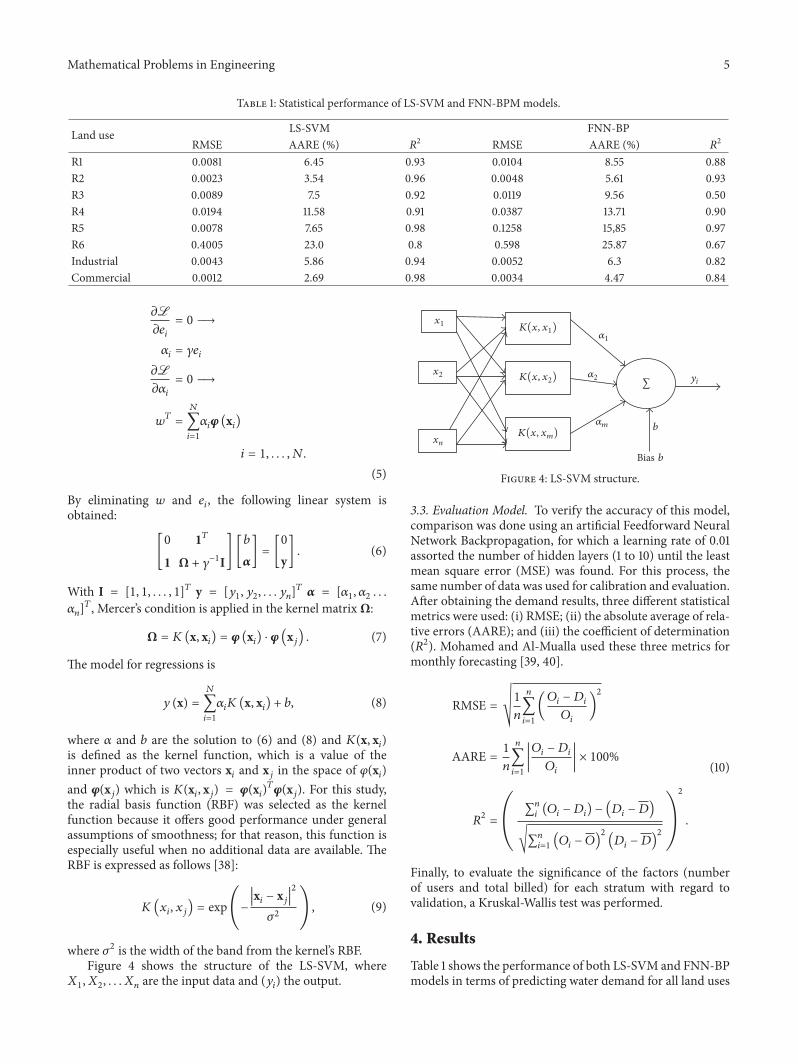
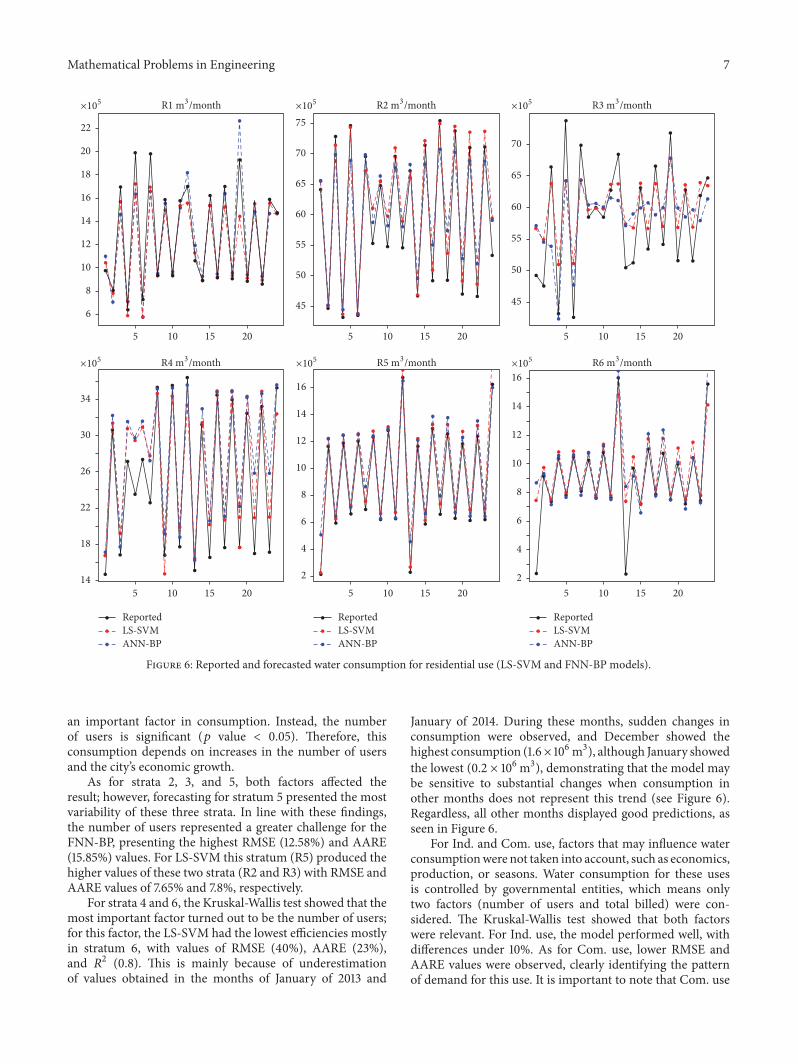