research article genetic profiling of the...
TRANSCRIPT

Research ArticleGenetic Profiling of the Plasmodium falciparum PopulationUsing Antigenic Molecular Markers
Purva Gupta,1 Ruchi Singh,2 Haris Khan,3 Adil Raza,3
Veena Yadavendu,1 R. M. Bhatt,1 and Vineeta Singh1
1 National Institute of Malaria Research (ICMR), Sector 8, Dwarka, New Delhi 110077, India2National Institute of Pathology (ICMR), Safdarjung Hospital Campus, New Delhi 110029, India3 Aligarh Muslim University, Aligarh, India
Correspondence should be addressed to Vineeta Singh; vineetas [email protected]
Received 3 July 2014; Revised 27 August 2014; Accepted 18 September 2014; Published 22 October 2014
Academic Editor: Rashidul Haque
Copyright © 2014 Purva Gupta et al. This is an open access article distributed under the Creative Commons Attribution License,which permits unrestricted use, distribution, and reproduction in any medium, provided the original work is properly cited.
About 50% of malaria infections in India are attributed to Plasmodium falciparum but relatively little is known about the geneticstructure of the parasite populations. The molecular genotyping of the parasite populations by merozoite surface protein (msp1and msp2) and glutamate-rich protein (glurp) genes identifies the existing parasite population in the regions which help inunderstanding the molecular mechanisms involved in the parasite’s drive for survival. This study reveals the genetic profile ofthe parasite population in selected regions across the country with varying degree of endemicity among them. We also report theprevalence of Pfcrt mutations in this parasite population to evaluate the pattern of drug resistance development in them.
1. Introduction
Malaria parasites infect about 650 million people worldwideand P. falciparum alone leads to almost one million deathsper year making it themost virulent parasite causingmalaria.It is pertinent to develop efficient means of controlling P.falciparum in areas to which malaria infections are highlyendemic. Since malaria infections are endemic to India, it isnecessary to characterize the parasite population and knowthe genotypic pattern of the circulating parasite populations[1]. The identification of multiclones in the population notonly helps in assessing the parasite population dynamicsbut also provides insights into the existing population [2].Previous studies have revealed high polymorphism in msp1,msp2, and glurp genes fromdifferent regions towhichmalariais endemic [3]. In a country like India to which malaria isendemic, continuous molecular surveillance of the field iso-lates is required to know the pattern of existing and emergingdrug resistance.This knowledge is the key to effectivemalariacontrol programs.
Genotyping the P. falciparum populations using antigenicgenes msp1, msp2, and glurp has been known to describe
allelic variability within parasite populations and also to dis-tinguish recrudescence from new infections of P. falciparumdisease [4]. Mostly these polymorphic markers (msp1 andmsp2) have been used to assess the multiplicity of infection(MOI) for detecting the number of clones per isolate. Block-2ofmsp1 gene, block-3 or the central repetitive domain ofmsp2gene, and RII repeat region of glurp show large allelic poly-morphism [5]. In msp1 gene three distinct allelic families K1,MAD20, and RO33 have been described whereas msp2 geneconsists of FC27 and IC3D7 families. Several genes of P.falciparum have shown extensive genetic polymorphism ingenetic analysis and therefore have been extensively used asmarkers to study the genetic diversity and MOI [6, 7].
Chloroquine (CQ) is the most widely used antimalarialdrug but P. falciparum has established mechanisms to evadethe drug pressure. It is not very clear how the CQ resistance(CQR) is implemented but point mutations in P. falciparumCQR transporter protein (Pfcrt), encoded by the pfcrt gene,have been shown tomake the parasite less sensitive to CQ [8].
The purpose of the present study was to genotype theparasite population in P. falciparum infections in India usingantigenic polymorphic markers msp1, msp2, and glurp and
Hindawi Publishing Corporatione Scientific World JournalVolume 2014, Article ID 140867, 7 pageshttp://dx.doi.org/10.1155/2014/140867

2 The Scientific World Journal
Aligarh
N
Rajasthan
Ahmedabad
Chennai
RaipurRourkela
Ranchi
India
ArabianSea
Indian
Bayof
Bengal
Ocean
Aligarh (ALG)
Rajasthan (RAJ)Ahmedabad (AHM)
139
1415142022
Chennai (CHE)
Region Total samples collected
Raipur (RAP)Rourkela (RKL)Ranchi (RNC)
Total 107
Figure 1: Map of India showing different regions from where malaria symptomatic samples were collected.The table specifies the number ofsamples collected from each region.
drug resistance gene, namely, Pfcrt, so as to assess the parasitepopulation dynamics in the country.
2. Materials and Methods
2.1. Sample Collection. One hundred and seven symptomaticmalaria blood samples were collected by finger prick methodfrom different regions of India (Figure 1); the details are givenin Table 1. Only after the ethical clearance from the institutethe collection of P. falciparum infected blood samples wasdone. The collection of samples was carried out during theyears 2009–2012.
2.2. P. falciparum Detection and Diagnosis. Microscopy andrapid diagnostic tests (RDT) were used for the first line of
P. falciparum malaria diagnosis and bloodspots of infectedsamples were made on Whatman (number 3) filter paperfor further molecular studies.Themicroscopically confirmedP. falciparum samples were then subjected to genotyping bydifferent polymorphic markers.
2.3. DNA Isolation and PCR Analysis. Genomic DNA of P.falciparum positive samples was isolated by QIAamp DNABlood Mini Kit (Qiagen Inc.) according to manufacturer’sprotocol. Mixed infections of P. vivax and P. falciparum wereconfirmed by nested PCR assay of 18srRNA primers [9].
2.4. Molecular Genotyping. The single P. falciparum infec-tions after the species specific PCR were only considered
The Scientific World Journal 3
Table 1: Summary of the P. falciparum isolates collected from various regions across India.
S. number Region Total samplescollected
Samples positive for P. falciparumby microscopy and RDT
P. falciparummonoinfections byPCR
1 Aligarh (ALG) 13 13 132 Ahmedabad (AHM) 9 9 93 Rajasthan (RAJ) 14 4 44 Chennai (CHE) 15 5 55 Raipur (RAP) 14 14 146 Rourkela (RKL) 20 20 137 Ranchi (RNC) 22 22 22
Total 107 87 80
1 2 3 4 5 6 7 8 9 10 11 12 13
15 16 17 181814
500bp
500bp
200bp
200bp100bp
1000 bp
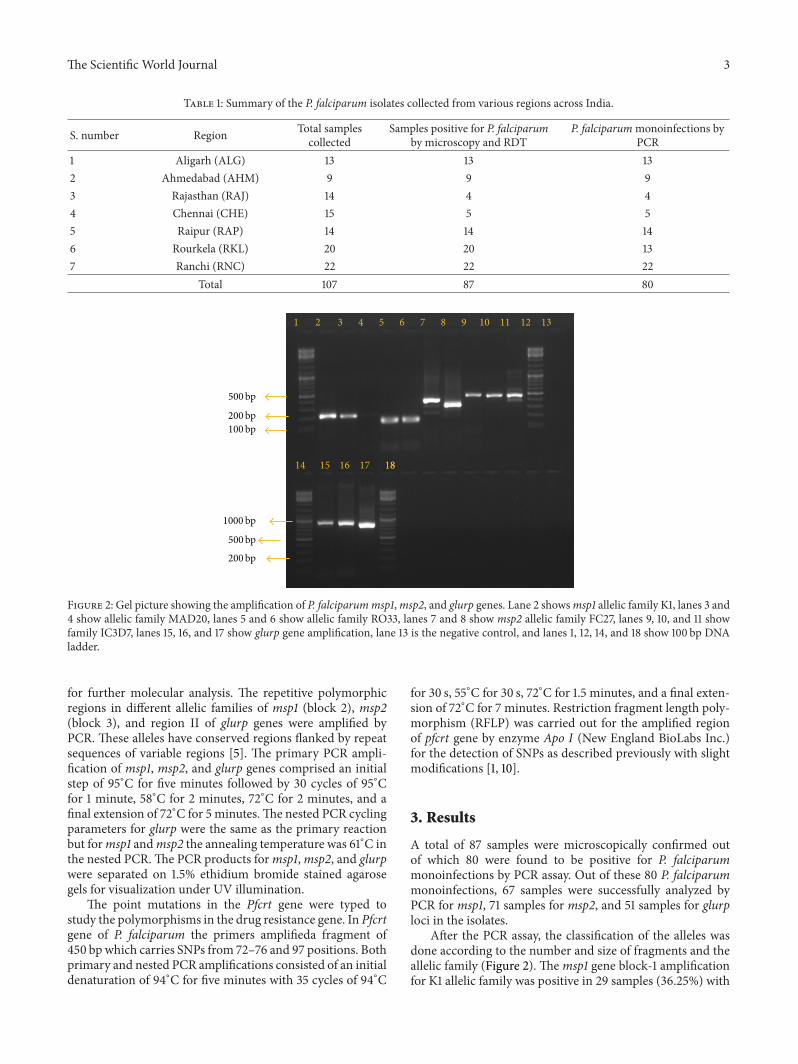
Figure 2: Gel picture showing the amplification of P. falciparummsp1,msp2, and glurp genes. Lane 2 showsmsp1 allelic family K1, lanes 3 and4 show allelic family MAD20, lanes 5 and 6 show allelic family RO33, lanes 7 and 8 show msp2 allelic family FC27, lanes 9, 10, and 11 showfamily IC3D7, lanes 15, 16, and 17 show glurp gene amplification, lane 13 is the negative control, and lanes 1, 12, 14, and 18 show 100 bp DNAladder.
for further molecular analysis. The repetitive polymorphicregions in different allelic families of msp1 (block 2), msp2(block 3), and region II of glurp genes were amplified byPCR. These alleles have conserved regions flanked by repeatsequences of variable regions [5]. The primary PCR ampli-fication of msp1, msp2, and glurp genes comprised an initialstep of 95∘C for five minutes followed by 30 cycles of 95∘Cfor 1 minute, 58∘C for 2 minutes, 72∘C for 2 minutes, and afinal extension of 72∘C for 5 minutes.The nested PCR cyclingparameters for glurp were the same as the primary reactionbut formsp1 andmsp2 the annealing temperature was 61∘C inthe nested PCR.The PCR products formsp1,msp2, and glurpwere separated on 1.5% ethidium bromide stained agarosegels for visualization under UV illumination.
The point mutations in the Pfcrt gene were typed tostudy the polymorphisms in the drug resistance gene. In Pfcrtgene of P. falciparum the primers amplifieda fragment of450 bp which carries SNPs from 72–76 and 97 positions. Bothprimary and nested PCR amplifications consisted of an initialdenaturation of 94∘C for five minutes with 35 cycles of 94∘C
for 30 s, 55∘C for 30 s, 72∘C for 1.5 minutes, and a final exten-sion of 72∘C for 7 minutes. Restriction fragment length poly-morphism (RFLP) was carried out for the amplified regionof pfcrt gene by enzyme Apo I (New England BioLabs Inc.)for the detection of SNPs as described previously with slightmodifications [1, 10].
3. Results
A total of 87 samples were microscopically confirmed outof which 80 were found to be positive for P. falciparummonoinfections by PCR assay. Out of these 80 P. falciparummonoinfections, 67 samples were successfully analyzed byPCR for msp1, 71 samples for msp2, and 51 samples for glurploci in the isolates.
After the PCR assay, the classification of the alleles wasdone according to the number and size of fragments and theallelic family (Figure 2). Themsp1 gene block-1 amplificationfor K1 allelic family was positive in 29 samples (36.25%) with

4 The Scientific World Journal
0
5
10
15
20
25Fr
eque
ncie
s
Allele size (bp)
K1MAD20RO33
msp1 gene
100
–120
140
–160
160
–180
180
–200
200
–220
220
–240
240
–260
300
–320
(a)
0
5
10
15
20
25
Freq
uenc
ies
Allele size (bp)
FC27IC3D7
msp2 gene
280
–300
300
–320
360
–380
380
–400
400
–420
440
–460
500
–520
540
–560
600
–620
640
–660
700
–720
800
–820
1000
–1020
1140
–1160
(b)
0
5
10
15
20
25
700 750 800 850 900 950 1000 1200
Freq
uenc
ies
Allele size (bp)
RII repeat region
glurp gene
(c)
Figure 3: Genetic diversity of P. falciparum bymsp1,msp2, and glurp genes. PCR amplification was represented by groups where PCR productsize differed by 20 bp. (a) Genetic diversity bymsp1 gene. Blue bars denote the K1 allelic family, size ranging from 180 to 300 bp; red bars denotethe MAD20 allelic family, size ranging from 100 to 220 bp; and green bars denote the RO33 allelic family, size ranging from 100 to 200 bp. (b)Genetic diversity bymsp2 gene. Blue bars denote the FC27 allelic family, size ranging from 280 to 800 bp and the red bars denote the IC3D7allelic family, size ranging from 400 to 1150 bp. (c) Genetic diversity by glurp gene. Blue bars denote the RII repeat region of glurp gene, sizeranging from 700 to 1200 bp.
five different allelic sizes ranging from 180 to 300 bp amongwhich 200 bp allelic fragment was predominant. The otherfamily MAD20 in msp1 was found in 32 samples (40.0%)depicting seven different allelic sizes within 100–300 bp and200 bp was found to be the predominant allele size in thisgroup. The RO33 family was detected in 17 samples (21.25%)having four distinct alleles with fragment sizes of 100–200 bpand its predominant allele was found to be 200 bp fragment(Figure 3(a)). The msp2 amplification for FC27 family waspositive in 37 isolates (46.25%) having seven different alleletypes ranging from 280 to 800 bp predominated by 300 bpfragment size. The IC3D7 allelic family was amplified in 45isolates (56.25%) demarcated by nine different alleles span-ning between 400 and 1150 bp fragments where 500 bp
fragment was in majority (Figure 3(b)). For glurp 51 samples(63.75%) were found to be positive for RII repeat region pro-ducing eight different sizes ranging between 700 and 1200 bp,among which 900 bp allele was found to be predominant(25.0%) (Figure 3(c)). The number of genotypes for eachmarker is shown in Tables 2 and 3.
It was seen that 46.25% of the isolates studied weremulticlonal in naturewith two ormore alleles present inmsp1,msp2, and glurp genes. Thirteen multiple alleles were seenin msp1 (16.25%), 28 were found in msp2 (35%), and twomultiple alleles were seen in glurp (2.5%) genes showingmoregenotypic variation inmsp2 than inmsp1 and glurp.Therewasonly one isolate from Rourkela, positive for all the allelicfamilies of msp1 and msp2. There were 21 distinct haplotype

The Scientific World Journal 5
Table 2: Region-wise genetic diversity of P. falciparum bymsp1,msp2, and glurp.
S. number Region Number of samples (𝑛)PCR assay
msp1 msp2 glurpK1 MAD20 RO33 Total FC27 IC3D7 Total
1 Aligarh 13 2 7 3 12 9 5 14 102 Ahmedabad 9 1 2 4 7 7 5 12 83 Rajasthan 4 1 2 2 5 3 1 4 34 Chennai 5 2 4 3 9 3 1 4 35 Raipur 14 8 5 2 15 9 8 17 126 Rourkela 13 9 3 3 15 5 8 13 117 Ranchi 22 6 9 0 15 1 17 18 4
Table 3: Summary of all the isolates positive for each allelic familyfor msp1, msp2, and glurp along with the number of alleles and therange of sizes of alleles.
LociNumber of
samples positiveby PCR
Number ofdistinctalleles
Sizes of alleles(bp)
MSP-1K1 29 5 180–300MAD20 32 7 100–300RO33 17 4 100–200
MSP-2FC27 37 7 280–800IC3D7 45 9 400–1150
GLURP 51 8 700–1200
patterns observed among the parasite population and theprominent genotype pattern was MAD20 formsp1 and FC27formsp2.
MOI is calculated as the number of genotypes for agene divided by the number of isolates with positive PCRamplification. For each region studied MOI of bothmsp1 andmsp2 was calculated whose results are shown in Figure 4.
A fragment of 450 bp in pfcrt gene was amplified for 80 P.falciparum isolates out ofwhich 68 samples showed successfulamplification. Restriction sites for Apo I enzyme are seen atcodon 76 where K76Tmutation was observed in 29.4% of theisolates.
4. Discussion
Though, for parasite genotyping,msp1,msp2, and glurp geneshave been the recommended molecular markers for severaldrug efficacy studies, still the parasite population geneticprofile has not been assessed systematically in a country towhich malaria is endemic like India [6, 11, 12]. The fieldisolates in the present study have been genotyped using thepolymorphic regions of these three genes in order to comparethe diversity and the existing allelic frequencies.
The msp1 and msp2 showed 16 each, and glurp markersshowed eight allelic families in the studied parasite popula-tion.These findings indicate that, for detection of MOI,msp1
00.20.40.60.8
11.21.41.6
MO
I
1.82
ALG AHM RAJ CHE RAP RKL RNC
MOI of msp1 and msp2
msp1msp2
Figure 4: Graph showing comparison of MOI for msp1 andmsp2 genes in different regions of India. ALG: Aligarh, AHM:Ahmedabad, RAJ: Rajasthan, CHE: Chennai, RAP: Raipur, RKL:Rourkela, and RNC: Ranchi.
served as a better marker asMOI formsp1was higher in com-parison to msp2. However it is noticeable that glurp did notindicate the existing genetic pattern with lower frequency ofdiverse alleles [13]. This study shows the complex diversityexisting in the P. falciparum field isolates in areas of thecountry wheremalaria is endemic.The diversity seen in theseisolates is due to the complexity present in the parasitepopulation.
Previously it has been reported that a higher MOI wasfound in severe infections as compared to themild type infec-tions in studies fromUganda [14].These findings were in tan-dem with studies from India, which showed a strong associa-tion between multiple genotype infections, significantly highMOI, and severity of P. falciparum malaria [15, 16]. Findingsfrom Yemen show a regional variation with a higher MOI inisolates from foothills/coastland areas as compared to thosefrom the highlands [17]. Another study from India showeda high proportion of multiclonal isolates and high MOI inregions to which P. falciparum is highly endemic [18]. Find-ings on the genetic pattern of these polymorphic genesmsp1,msp2, and glurp of field isolates are similar to the otherstudies reported elsewhere [3, 4]. Studying the dynamics of

6 The Scientific World Journal
multiclone infections and MOI in relation to the host immu-nity, disease prevalence, genetic structure, and geographicaldistributionwould allowus to knowmore about the virulenceof P. falciparum.
We were able to identify 21 distinct genetic patternsamong the parasite population indicative of the fact that aconsiderable amount of gene flow is ongoing between thedifferent regions with P. falciparum infections. It would beinteresting and of importance to link the genotypic pattern ofthe parasites with the clinical phenotype. The recent data ofmsp1, msp2, and glurp markers for drug efficacy studies arehighly important in areas where malaria is endemic forunderstanding the treatment criteria [19]. These highly poly-morphic surface proteins are vaccine candidate genes andmonitoring these genes to understand their genetic diversityand structure would help us develop vaccines with cross-protection against a range of antigenic variants [13, 20].
The studied drug resistance gene indicates that extensivemapping of this gene should be carried out in more areasin which malaria is endemic. The resistant mutants are theresult of drug pressure and hence control programs should bedevised in such a manner that they help in reducing the drugpressure and enhance the activity of antimalarials. This studyindicates the high complexity and the diversity existing inthe P. falciparum population in several areas of the countrywhere malaria is endemic. The MOI was higher in msp1 inthis reported study, suggesting that the intensity of malariatransmission in these regions is high. This multiplicity ofinfection has definite implications not only in the drugresistant parasite but also in the outcome of the diseasetreatment.The diversity (MOI) in the parasite populationwasseenmore in the rural areas like Rourkela and Ranchi than inurban areas like Ahmedabad and Aligarh. This difference inthe genetic diversity could be attributed to the topographicaland climatic changes in the environmental factors. This kindof study in addition to other molecular methods should beundertaken for monitoring the existing and emerging drugresistance patterns in malaria disease.
Conflict of Interests
The authors declare that they have no competing interestsregarding the publication of this paper.
Acknowledgments
The authors thank the Indian Council of Medical Research(ICMR) for providing them with grants to carry out theirstudy (75/05/92-ECD II). They would also like to acknowl-edge the constant encouragement for research from theDirector,NIMR.Theauthorswould like to sincerely thank thestudy participants. This paper bears the NIMR PublicationScreening Committee Approval no. 041/2014. Purva Gupta isa senior research fellow of ICMR.
References
[1] A. A. Abdel-Muhsin,M. J. Mackinnon, P. Awadalla et al., “Localdifferentiation in Plasmodium falciparumdrug resistance genesin Sudan,” Parasitology, vol. 126, no. 5, pp. 391–400, 2003.
[2] U. Buchholz, R. Kobbe, I. Danquah et al., “Multiplicity of Plas-modium falciparum infection following intermittent preventivetreatment in infants,” Malaria Journal, vol. 9, no. 1, article 244,2010.
[3] F. Mwingira, G. Nkwengulila, S. Schoepflin et al., “Plasmodiumfalciparummsp1, msp2 and glurp allele frequency and diversityin sub-Saharan Africa,”Malaria Journal, vol. 10, article 79, 2011.
[4] P. Gosi, C. A. Lanteri, S. D. Tyner et al., “Evaluation of parasitesubpopulations and genetic diversity of the msp1, msp2 andglurp genes during and following artesunatemonotherapy treat-ment ofPlasmodium falciparummalaria inWesternCambodia,”Malaria Journal, vol. 12, no. 1, article 403, 2013.
[5] G. Snounou, X. Zhu, N. Siripoon et al., “Biased distribution ofmsp1 andmsp2 allelic variants in Plasmodium falciparum popu-lations inThailand,” Transactions of the Royal Society of TropicalMedicine and Hygiene, vol. 93, no. 4, pp. 369–374, 1999.
[6] J. Akter, K. Thriemer, W. A. Khan, D. J. Sullivan, H. Noedl, andR. Haque, “Genotyping of Plasmodium falciparum using anti-genic polymorphic markers and to study anti-malarial drugresistance markers in malaria endemic areas of Bangladesh,”Malaria Journal, vol. 11, article 386, 2012.
[7] K. Congpuong, R. Sukaram, Y. Prompan, and A. Dornae,“Genetic diversity of the msp-1, msp-2, and glurp genes of Plas-modium falciparum isolates along the Thai-Myanmar borders,”Asian Pacific Journal of Tropical Biomedicine, vol. 4, no. 8, pp.598–602, 2014.
[8] P. Mittra, S. Vinayak, H. Chandawat et al., “Progressive increasein point mutations associated with chloroquine resistance inPlasmodium falciparum isolates from India,” The Journal ofInfectious Diseases, vol. 193, no. 9, pp. 1304–1312, 2006.
[9] B. Gupta, P. Gupta, A. Sharma, V. Singh, A. P. Dash, and A. Das,“High proportion of mixed-species Plasmodium infections inIndia revealed by PCR diagnostic assay,” Tropical Medicine andInternational Health, vol. 15, no. 7, pp. 819–824, 2010.
[10] V. Andriantsoanirina, A. Ratsimbasoa, C. Bouchier et al., “Plas-modium falciparum drug resistance in Madagascar: facing thespread of unusual pfdhfr and pfmdr-1 haplotypes and thedecrease of dihydroartemisinin susceptibility,” AntimicrobialAgents and Chemotherapy, vol. 53, no. 11, pp. 4588–4597, 2009.
[11] G. I. Olasehinde, C. S. Yah, R. Singh et al., “Genetic diversity ofPlasmodium falciparum field isolates from south western Nige-ria,” African Health Sciences, vol. 12, no. 3, pp. 355–361, 2012.
[12] W.M. Atroosh, H. M. Al-Mekhlafi, M. A. Mahdy, R. Saif-Ali, A.M. Al-Mekhlafi, and J. Surin, “Genetic diversity of Plasmodiumfalciparum isolates from Pahang, Malaysia based on MSP-1 andMSP-2 genes,”Parasites andVectors, vol. 4, no. 1, article 233, 2011.
[13] L. R. Pratt-Riccio, D. D. S. Perce-da-Silva, J. D. C. Lima-Junioret al., “Genetic polymorphisms in the glutamate-rich protein ofPlasmodium falciparum field isolates from a malaria-endemicarea of Brazil,” Memorias do Instituto Oswaldo Cruz, vol. 108,no. 4, pp. 523–528, 2013.
[14] M. S. Kiwuwa, U. Ribacke, K. Moll et al., “Genetic diversity ofPlasmodium falciparum infections in mild and severe malariaof children from Kampala, Uganda,” Parasitology Research, vol.112, no. 4, pp. 1691–1700, 2013.
[15] R. Rout, B. N. Mohapatra, S. K. Kar, and M. Ranjit, “Geneticcomplexity and transmissibility of Plasmodium falciparumparasites causing severe malaria in Central-East coast India,”Tropical Biomedicine, vol. 26, no. 2, pp. 165–172, 2009.
[16] M. R. Ranjit, A. Das, B. P. Das, B. N. Das, B. P. Dash, and G. P.Chhotray, “Distribution of Plasmodium falciparum genotypes

The Scientific World Journal 7
in clinically mild and severe malaria cases in Orissa, India,”Transactions of the Royal Society of Tropical Medicine andHygiene, vol. 99, no. 5, pp. 389–395, 2005.
[17] N.M. Al-abd,M. A. K.Mahdy, A.M. Q. Al-Mekhlafi et al., “Thesuitability of P. falciparummerozoite surface proteins 1 and 2 asgenetic markers for in vivo drug trials in Yemen,” PLoS ONE,vol. 8, no. 7, Article ID e67853, 2013.
[18] H. Joshi, N. Valecha, A. Verma et al., “Genetic structure of Plas-modium falciparum field isolates in eastern and north-easternIndia,”Malaria Journal, vol. 6, article 60, 2007.
[19] A. Cattamanchi, D. Kyabayinze, A.Hubbard, P. J. Rosenthal, andG. Dorsey, “Distinguishing recrudescence from reinfection in alongitudinal antimalarial drug efficacy study: comparison ofresults based on genotyping of msp-1, msp-2, and glurp,”American Journal of Tropical Medicine and Hygiene, vol. 68, no.2, pp. 133–139, 2003.
[20] P. K. Bharti, M.M. Shukla, Y. D. Sharma, andN. Singh, “Geneticdiversity in the block 2 region of themerozoite surface protein-1of Plasmodium falciparum in central India,” Malaria Journal,vol. 11, article 78, 2012.

Submit your manuscripts athttp://www.hindawi.com
Hindawi Publishing Corporationhttp://www.hindawi.com Volume 2014
Anatomy Research International
PeptidesInternational Journal of
Hindawi Publishing Corporationhttp://www.hindawi.com Volume 2014
Hindawi Publishing Corporation http://www.hindawi.com
International Journal of
Volume 2014
Zoology
Hindawi Publishing Corporationhttp://www.hindawi.com Volume 2014
Molecular Biology International
GenomicsInternational Journal of
Hindawi Publishing Corporationhttp://www.hindawi.com Volume 2014
The Scientific World JournalHindawi Publishing Corporation http://www.hindawi.com Volume 2014
Hindawi Publishing Corporationhttp://www.hindawi.com Volume 2014
BioinformaticsAdvances in
Marine BiologyJournal of
Hindawi Publishing Corporationhttp://www.hindawi.com Volume 2014
Hindawi Publishing Corporationhttp://www.hindawi.com Volume 2014
Signal TransductionJournal of
Hindawi Publishing Corporationhttp://www.hindawi.com Volume 2014
BioMed Research International
Evolutionary BiologyInternational Journal of
Hindawi Publishing Corporationhttp://www.hindawi.com Volume 2014
Hindawi Publishing Corporationhttp://www.hindawi.com Volume 2014
Biochemistry Research International
ArchaeaHindawi Publishing Corporationhttp://www.hindawi.com Volume 2014
Hindawi Publishing Corporationhttp://www.hindawi.com Volume 2014
Genetics Research International
Hindawi Publishing Corporationhttp://www.hindawi.com Volume 2014
Advances in
Virolog y
Hindawi Publishing Corporationhttp://www.hindawi.com
Nucleic AcidsJournal of
Volume 2014
Stem CellsInternational
Hindawi Publishing Corporationhttp://www.hindawi.com Volume 2014
Hindawi Publishing Corporationhttp://www.hindawi.com Volume 2014
Enzyme Research
Hindawi Publishing Corporationhttp://www.hindawi.com Volume 2014
International Journal of
Microbiology