research article linear chromatic adaptation transform...
TRANSCRIPT
Research ArticleLinear Chromatic Adaptation Transform Based onDelaunay Triangulation
Rok Kreslin1 Pilar M Calvo2 Luis G Corzo3 and Peter Peer1
1 Faculty of Computer and Information Science University of Ljubljana Slovenia2 Polytechnical Faculty of San Sebastian University of the Basque Country (UPVEHU) Spain3 Creatio Irizar Group Innovation Center AIE 20216 Ormaiztegi Spain
Correspondence should be addressed to Rok Kreslin rokkreslinfriuni-ljsi
Received 25 September 2013 Revised 13 November 2013 Accepted 2 December 2013 Published 16 January 2014
Academic Editor Yue Wu
Copyright copy 2014 Rok Kreslin et al This is an open access article distributed under the Creative Commons Attribution Licensewhich permits unrestricted use distribution and reproduction in any medium provided the original work is properly cited
Computer vision algorithms that use color information require color constant images to operate correctly Color constancy of theimages is usually achieved in two steps first the illuminant is detected and then image is transformedwith the chromatic adaptationtransform (CAT) Existing CAT methods use a single transformation matrix for all the colors of the input image The methodproposed in this paper requires multiple corresponding color pairs between source and target illuminants given by patches of theMacbeth color checker It uses Delaunay triangulation to divide the color gamut of the input image into small triangles Each colorof the input image is associated with the triangle containing the color point and transformed with a full linear model associatedwith the triangle Full linear model is used because diagonal models are known to be inaccurate if channel color matching functionsdo not have narrow peaks Objective evaluation showed that the proposed method outperforms existing CAT methods by morethan 21 that is it performs statistically significantly better than other existing methods
1 Introduction
One of the pillars of color science is the illuminant of theimage being treated Many real-life applications in the fieldof computer vision require images that are invariant to theilluminant changes In [1] authors discuss a problem of thefluorescent lamp spectral distribution change over time intheir computer vision system for classifying marble platesFace detectors [2 3] and face extractors [4] use predefinedskin colors to segment the image These colors accuratelypresent skin tones only on imageswith standard illuminationColor- and texture-based image search [5] also requiresimages to be described with illuminant invariant descriptors
The mechanism of human vision system that takes careof the illuminant invariance is called color constancy [6] Indigital world it is usually modelled as a two-step process con-sisting of illuminant estimation and image transformation[7] This paper discusses the second step of the process thatis image transformation
Image transformations are done with chromatic adapta-tion transforms (CATs) The conversion from one illuminant
to a different one has mostly been handled by using singlediagonal von Kries-like transformation [8] for all the colorsin the gamut of the input image The main reason for usinga single diagonal model is the fact that usually only onecorresponding color pair under two different illuminants isknown (ie source and target illuminants) thus there is notenough information to construct more complex models Butif there are many known corresponding color pairs there isno need to limit ourselves to one diagonal transformationinstead we can use a higher number of more complextransformations
Diagonal von Kries like transformations scale color chan-nels independently Whether or not human color constancyoperates in the same way is beyond the scope of this paperBut it has been shown [9 10] that diagonal von Kries liketransformations do not accurately model chromatic adap-tation if color channels are not independent of each otherthat is channel color matching functions have wide peaksSensor sharpening [11] has been used to derive new colormatching functions with narrow peaks but some correlation
Hindawi Publishing CorporationMathematical Problems in EngineeringVolume 2014 Article ID 760123 9 pageshttpdxdoiorg1011552014760123
2 Mathematical Problems in Engineering
between different color channels still remains even afterthe sharpening process Full linear transformations can beused to account for the correlation between different colorchannels
The method proposed in this paper uses Delaunay tri-angulation and Macbeth color checker to divide the colorgamut of the input image and it constructs one full lineartransformation for each triangle of the divided color gamutthat is each color in the input image is transformed with thematrix of the triangle that contains the color It is meant tobe used primarily as a preprocessing step of other computervision algorithms operating with color information
Similar approaches have been used to transform col-ors from camera color space to device-independent colorspace It should be noted that our approach addresses thechromatic adaptation and assumes that colors have alreadybeen transformed from camera to device-independent colorspace Granger [12] divided color space based on the huevalues of reference color points and calculated transforma-tion matrix for each one of the subspaces Andersen andHardeberg [13] used patches of the Macbeth color checker todivide color space and associated each subspace with lineartransformation that preserves neutral colors and hue planesBoth of the approaches use two-dimensional chromaticityspace to find subspace that contains specific color but actualtransformation is done using all three channels of the originalcolor space Our approach differs from that in [12 13] bydefining a new way of dividing color space using Delaunaytriangulation and using chromaticity space both to findsubspace and transform color points
The rest of the paper is organised as follows Section 2describes the problem and related work Section 3 providesthe description of the new method Section 4 gives experi-mental evaluation of the newmethod Finally conclusions aredrawn in Section 5
2 Problem and Related Work
Chromatic adaptation is the ability of the human visualsystem to adjust to illumination changes and preserve colorappearance of the objects [14] It allows us to see stablecolors of the objects illuminated by a wide range of differentilluminations Chromatic adaptation transforms (CATs) aremethods used in digital imaging and color science to modelthe described mechanism of the human visual system Theyprovide a means to transform color values under a sourceillumination into color values under a target illumination
A standard model to compute transformation from oneillumination to another one is diagonal von Kries likeadaptation model [8] If (119877 119866 119861) denotes color value undersource illumination then model states that we can model thesame color value under target illumination as
[
[
1198771015840
1198661015840
1198611015840]
]
= [
[
119888119877
0 0
0 119888119866
0
0 0 119888119861
]
]
[
[
119877
119866
119861
]
]
(1)
where 119888119877 119888119866 and 119888
119861represent scaling coefficients for color
channels These scaling coefficients are most often the ratios
of target illumination (119877119905 119866119905 119861119905) and source illumination
(119877119904 119866119904 119861119904) that is 119888
119877= 119877119905119877119904 119888119866= 119866119905119866119904 and 119888
119861= 119861119905119861119904
However differentCATs differ in the color space inwhich thisscaling takes place
Obvious choice is the color space in which image isinitially described such as sRGB color space This process issimple as no additional transformations of the color spacesare required Other commonly used color spaces are derivedas linear transformations of the 119883119884119885 space [15] The processof deriving these linear transformations of the 119883119884119885 space iscalled sensor sharpening [11] Color matching functions ofthe derived color spaces tend to have sharper narrower peaksthus they support better the von Kries like models The basicmodel for transforming color values in derived color spacesis as follows
(1) (119877 119866 119861) value is transformed into (119883 119884 119885) value(2) (119883 119884 119885) value is transformed using
[
[
1198831015840
1198841015840
1198851015840]
]
= Mminus1 sdot [[
119888119877
0 0
0 119888119866
0
0 0 119888119861
]
]
sdotM sdot [
[
119883
119884
119885
]
]
(2)
(3) (1198831015840 1198841015840 1198851015840) value is transformed back to (1198771015840 1198661015840 1198611015840)value
Some commonly used transformations of the 119883119884119885 colorspaceM are as follows
(i) 119883119884119885 M119883119884119885
is the identity matrix in (3) Thismethodrsquos performance is poor [16]
M119883119884119885
= [
[
1 0 1
0 1 0
0 0 1
]
]
(3)
(ii) Bradford a commonly used transformation derivedby comparing 58 samples of color wool under illu-minants D65 and A [17] At the beginning thistransformationwas nonlinear in the blue channel butthis nonlinearity was eliminated later Consider
MBradford =[
[
08951 02664 minus01614
minus07502 17135 00367
00389 minus00685 10296
]
]
(4)
(iii) Sharp a widely used newer transformation derivedfrom the Bradford transform [18] It has more narrowpeaks of color basis functions than the Bradford colorspace thus it supports better von Kries like modelConsider
MSharp =[
[
12694 minus00988 minus01706
minus08364 18006 00357
00297 minus00315 10018
]
]
(5)
(iv) CMCCAT2000 simplified CMCCAT2000 [19] is thesuccessor of the complexCMCCAT97 transformation[20] which was also derived from the Bradford trans-formation CMCCAT2000 also allows modelling of
Mathematical Problems in Engineering 3
the partial adaptation of the observer but partialadaptation is not considered in this paper because weassume a fully adapted observer Consider
MCMCCAT2000 =[
[
07982 03389 minus01371
minus05918 15512 00406
00008 0239 09753
]
]
(6)
All of the described transformations use the diagonalvon Kries like model to model illuminant change But ithas been shown [9 10] that diagonal model is not accurateif color channels are correlated Even after color channelsare transformed using sensor sharpening there is still somecorrelation left We can model the correlation using fulllinear model instead of the diagonal model The reason whyusually the full linear model is not used is that there is notenough information available to determine the coefficientsin particular if we only know the values of the illuminantsBut if we have more color correspondence pairs between twoilluminations there is no need to limit our methods to thediagonal model Instead we can use full linearmodel that alsocaptures correlations between color channels
3 Proposed Method
The algorithm proposed in this paper is based on theassumption that color points whose chromaticity values areclose together in the color gamut of the source illuminationshould warp smoothly to a new color gamut of the targetillumination In order to change the illuminant of anycolor point the color gamut is divided into smaller regionsaccording to some reference points and the transformationto be applied to each region is computedThat is the objectiveis to obtain the transformation matrix to be applied to eachregion in the source color gamut Our method is suitable forcontrolled applicative environment because it assumes thatboth source and target illuminations are known and that theMacbeth color checker is present in the input image or colorvalues of the patches of the Macbeth color checker capturedunder the illuminant of the input image are known
The following subsections explain our transformationbetween the source and the target color gamut outlinethe Delaunay triangulation used to divide the color gamutinto smaller regions and finally describe the proposed CATmethod to change the illuminant
31 Calculation of the Transformation Matrices between Dif-ferent Color Gamuts The function of transformation to beapplied for changing the illuminant can be obtained if somereference points are known in the source color gamut andtheir transformations in the target color gamut are knownas well We describe these reference points in chromatic rgspace The reason why we are using the chromatic rg modelinstead of the nativeRGBmodel is thatwewant similar colorsignoring intensity values to be transformed with the sametransformation matrix
The following equations system in (7) is themathematicalrelation between one chromatic point in the source color
gamut 119883(119909 119910) and the target color gamut 119880(119906 V) This rela-tion can be linear quadratic cubic and so forth dependingon the value of 119896 The quantities 119886 and 119887 are unknown factorsthat can be solved if several points in the source color gamutand their transformation in the target color gamut are knownConsider
119906 = sum119896
119896
sum119894=0
119886(119896(119896+1)+2119894)2
119909119896minus119894119910119894
V = sum119896
119896
sum119894=0
119887(119896(119896+1)+2119894)2
119909119896minus119894119910119894
(7)
Any point within the source color gamut 119883(119909 119910) can betransformed into the corresponding point of the target colorgamut 119880(119906 V) by using the relation in (7)
If a linear relation (119896 = 1) is considered then the systemin (7) becomes
119906 = 1198860+ 1198861sdot 119909 + 119886
2sdot 119910
V = 1198870+ 1198871sdot 119909 + 119887
2sdot 119910
(8)
or in matrix form
U = A sdot Y (9)
where
U = [119906
V] (10)
A = [119886011988611198862
119887011988711198872
] (11)
Y = [
[
1
119909
119910
]
]
(12)
In order to calculate the unknown factors in A 119886119895and
119887119895for 119895 = 0 1 2 as there are six unknown factors and two
equations it is necessary to know at least three points in thesource color gamut and their transformations in the targetcolor gamut If we had chosen a higher order relation (119896 gt 1)
more correspondence points would have to be knownThe known three points in the source color gamut
119883119897(119909119897 119910119897) for 119897 = 1 2 3 describe a triangle They can be
arranged in matrix form as
S = [
[
1 1 1
119909111990921199093
119910111991021199103
]
]
(13)
And the known three points of the transformed trianglein the target color gamut 119880
119897(119906119897 V119897) for 119897 = 1 2 3 can be
arranged in matrix form as
T = [119906111990621199063
V1
V2
V3
] (14)
The equations system to be solved in order to compute theunknown factors in A is
T = A sdot S (15)
4 Mathematical Problems in Engineering
And the solution to this system is
A = T sdot Sminus1 (16)
where Sminus1 can be computed by means of a singular valuesdecomposition (SVD) [21]
Transformation matrix A differs from diagonal modelsused by other CAT methods by also capturing the relationsbetween separate color channels thus it is more accurate ifcolor channels are correlated
Once the transformationmatrixA is known it is possibleto transform any point within the triangle defined by theknown reference three points in the source color gamut tothe target color gamut by using (9)The smaller the triangle inthe source color gamut themore accurate the transformationwill be for the points inside the triangle The transformationis completely accurate when transforming vertices of thetriangle because they have direct mappings from source totarget illuminant So if we reduce the size of the triangle colorpoints that lie inside it becomemore similar to the vertices ofthe triangle which have direct mappings defined This is thereason why it is desirable to divide the color gamut into thesmaller possible triangles according to the reference pointsknown in both color gamuts The method explained in thefollowing subsection is used to obtain the biggest number ofnonoverlapping triangles given a number of reference points
32 Delaunay Triangulation Delaunay triangulation [22] isa well-known method in the field of mesh generation dueto its optimality properties In the plane or the 2D case theDelaunay triangulation Del(119875) of a set of 119899 points 119875 = 119901
119894
for 119894 = 1 119899 inR2 is a collection of triangles Tr(119901119895 119901119896 119901119897)
such that no point in 119875 is inside the circumcircle of anytriangle in Del(119875)
For a set of 119899 points the number of triangles producedby triangulation depends on the spatial distribution of thepoints If 119887 is a number of points forming convex hull of thepoints then the number of triangles119873 is at most
119873 = 2119899 minus 2 minus 119887 (17)
Degeneration of 119873 can occur if all the points lie on thesame line Then there are no triangles defined But consid-ering the domain of color transformation this is unlikely tohappen
The Delaunay triangulation will be used to divide thecolor gamut into smaller regions (triangles) according to thereference points known in both color gamuts We shouldmention that the resulting triangulation is not unique whenfour or more points lie on the same circle Further researchwill be needed to study the effects of different possibletriangulations of the same color points
33 Illuminant Change Method Once the formula for thetransformation matrix for a number of reference points isknown and the way to divide the color gamut into smallertriangles has been established then in order to perform theilluminant change the following steps are to be carried out
+
++
+
Color checker Color rendition chartGretagMacbeth
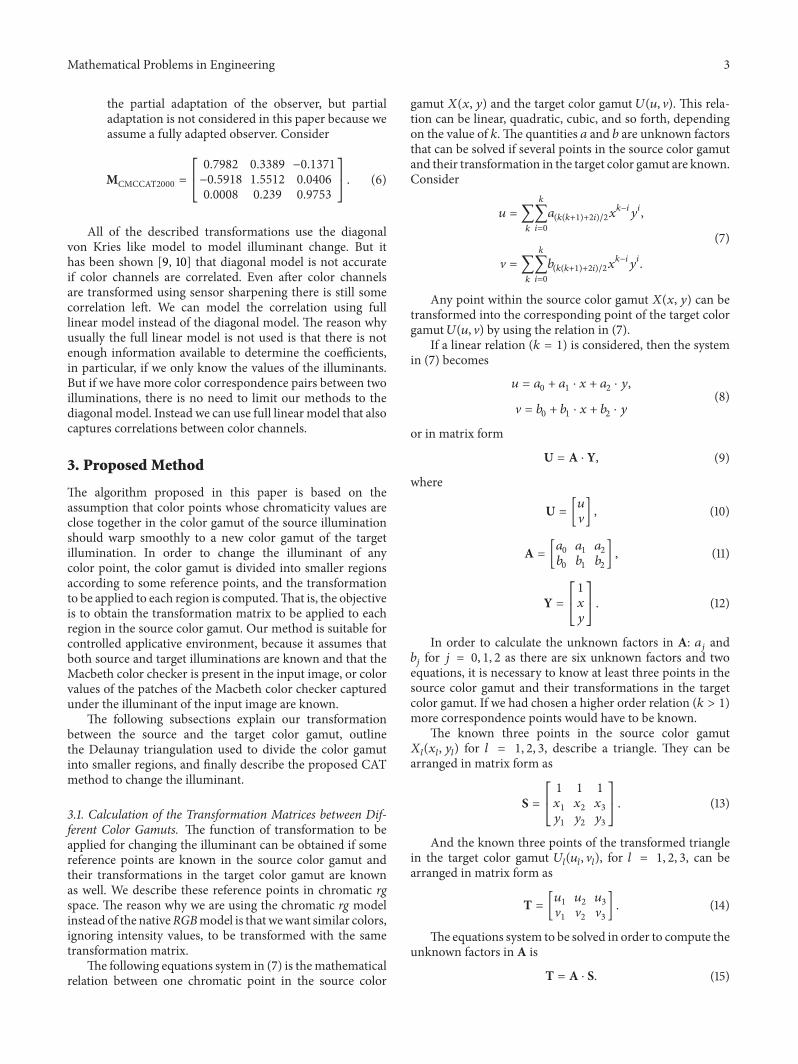
Figure 1 Macbeth color checker Color patches have spectral reflec-tance intended tomimic those of natural objects such as human skinfoliage and flowers
(1) The Macbeth color checker (Figure 1) present in theinput image is used as the reference to achieve colorconstancy Delaunay triangulation is done to dividethe original color gamut by using the mean (119903 119892)
values of the 24 patches of theMacbeth color checkerFigure 2 shows triangulations of the color gamut fortwo different illuminants
(2) Once the triangles are defined the transformationmatrixA of each triangle in the source color gamut iscomputed using (16)Thus there are asmanymatricesA as triangles
(3) For each point of the source color gamut that needs tobe transformed the transformation in the target colorgamut is obtained with (9) that is by applying thetransformation matrix A of the triangle that containsthe point First RGB color point 119862 = (119877 119866 119861)
is converted to rg point 119862119903119892
= (119903 119892) Then thetriangle containing point 119862
119903119892is found and the point
is transformed using the transformation matrix A ofthe triangle containing it resulting in a new rg point1198621015840
119903119892= (1199031015840 1198921015840) The new RGB point 1198621015840 = (1198771015840 1198661015840 1198611015840) is
obtained using
1198771015840= 1199031015840sdot (119877 + 119866 + 119861)
1198661015840= 1198921015840sdot (119877 + 119866 + 119861)
1198611015840= (1 minus 119903
1015840minus 1198921015840) sdot (119877 + 119866 + 119861)
(18)
preserving the sum of channel intensities before andafter the transformation
As far as the points in the source color gamut are insideone of the triangles obtained by Delaunay triangulationusing the patches of the Macbeth color checker the resultingtransformation using the matrices A is valid Neverthelessthe triangles defined by the patches of the Macbeth colorchecker do not cover the whole rg chromaticity space Henceproblems appear when transforming a point in the sourcecolor gamut that is outside any triangle as the illuminant isnot corrected properly for these points
Mathematical Problems in Engineering 5
Non-standard illuminant1
09
08
07
06
05
04
03
02
01
00 02 04 06 08 1
D65 illuminantg
1
09
08
07
06
05
04
03
02
01
0
gr
0 02 04 06 08 1
r
Figure 2 Triangulations of the color gamut for two different illuminants The triangulations are shown in the rg chromaticity space with thepoint colors being the same as patch colors of the Macbeth color checker captured under the same illuminant
In order to handle these points outside the trianglesdefined by the patches of the Macbeth color checker weconsider the vertices of the whole rg chromaticity space asreference points together with the patches of the Macbethcolor checker The vertices of the rg chromaticity space in(119903 119892) are (0 0) (1 0) and (0 1) Note that point (1 1) is notthe vertex of the rg chromaticity space By the definition ofrg space sum of both components cannot be greater thanone [23] The transformed points of these vertices for anyilluminant are the same points as the limits of the rg space arefixed and if an overflow occurs the obtained point is saturatedto the limit
The proposed method has one restriction The trianglesdefined by the values of the Macbeth color checker under asource illuminant may cross or fold over each other whentransformed to a target illuminant Likewise the transforma-tion of the arbitrary color point within certain triangle underthe source illuminant does not guarantee that transformedcolor point will be contained in the corresponding triangleunder the target illuminant Because of these properties theinverse transformation cannot be defined with our proposedmethod However exact inverse transformation is rarelyneeded in the applicative environment described at thebeginning of the paper
4 Experimental Evaluation
To objectively evaluate the performance of our methodwe used color-checker image database [24] It contains 568images captured under different artificial and natural illumi-nations All the images in the database contain a Macbethcolor checker which is an assumption our method impliesThe coordinates of the patches of a Macbeth color checker
are available on the website of the image database [25] fromwhich we also obtained illuminant estimates used by otherCAT methods To speed up evaluation all transformationswere made on the downscaled versions of images (813 times 541)also available on the website of the image database
All the images in the database are described in sRGB colorspace with gamma correction applied CAT methods assumethat linear images are given so inverse gamma correctionwasapplied to produce linear images [26]
Chlin =
Chs1198771198661198611292
Chs119877119866119861 le 004045
(Chs119877119866119861 + 0055
1055)
24
Chs119877119866119861 gt 004045
(19)
where Chlin represents the linearized sRGB value of the colorchannel Ch = 119877 119866 119861
To evaluate the performance of our method we trans-formed the color patches of the Macbeth color checker oneach of the 568 images and compared the transformed valueswith the values of the patches of the Macbeth color checkercaptured under standard D65 illuminant [27] To ensure thatour method is not in a privileged position compared to otherCAT methods we took two precautions as follows
(i) The color value of the patch currently being trans-formed cannot be used when triangulating the sourcecolor gamut and calculating transformationmatricesOtherwise it is the part of the transformation matrix
(ii) Chromaticity values of the patches in the last row oftheMacbeth color checker are very similarThat is thereason why we ignore all the patches of the Macbethcolor checker in the last row except the third patchfrom the left One could also choose any other patchfrom the last row
6 Mathematical Problems in Engineering
Performance of ourmethod is evaluated using the follow-ing steps
(1) Color values of the patches of the Macbeth colorchecker in the input image are calculated
(2) All the color patches from the last row of theMacbethcolor checker except the third one from the left arediscarded
(3) To each of the remaining 19 color patches we apply thefollowing
(a) From the set of color values we temporarilyremove the value of the patch currently beingtransformed
(b) Delaunay triangulation is applied(c) We find the triangle containing the color value
of the patch currently being transformed(d) We use the transformationmatrix of the triangle
to transform the patch value(e) Difference between the transformed value and
the reference value of the patch under standardD65 illumination is computed
(4) The error of the single image is equal to the meandifference of all the transformed color patches
Performance of other CAT methods (sRGB 119883119884119885 Brad-ford Sharp and CMCCAT2000) is evaluated similarly asfollows
(1) Color values of the patches of the Macbeth colorchecker in the input image are calculated
(2) All the color patches from the last row of theMacbethcolor checker except the third one from the left arediscarded
(3) Color values of the 19 remaining patches are trans-formed using the CAT method Differences betweenthe transformed value and the reference value of thepatch under standardD65 illumination are computed
(4) The error of the single image is equal to the meandifference of all the transformed color patches
To compute the difference between the values of trans-formed patches and reference patches perceptual euclidiandistance (PED) is used
PED (119890119905 119890119903) = radic119908
119877(119877119905119877119903)2
+ 119908119866(119866119905119866119903)2
+ 119908119861(119861119905119861119903)2
(20)
where 119890119905= (119877119905 119866119905 119861119905) represents normalised transformed
values 119890119903
= (119877119903 119866119903 119861119903) represents normalised reference
values and 119908119877 119908119866 and 119908
119861represent weight coefficients It
was shown that PED with weight coefficients 119908119877
= 026119908119866= 070 and 119908
119861= 004 finds its roots in human vision
and correlates significantly higher than any other distancemeasures [28]
Mean PED errors of different methods are shown inTable 1 Performance of the evaluated methods is similar
Table 1 Comparison of mean PED error of different CATmethods
Method PED RanksRGB 0047 3XYZ 0048 4Bradford 0047 3Sharp 0046 2CMCCAT2000 0046 2DT-based 0038 1
sRGB XYZ
Brad
ford
Shar
p
CMCC
AT20
00
DT-
base
d
0
PED
01
02
03
04
05
06
MINQ1
Q3Q2
Lmax
Figure 3 Boxplots summarizing PED errors of different CATmethods First boxplot from the left has labels showing five statistics
The only method that stands out is our proposed method(DT-based) that has significantly lower mean PED error thanthe other methods The second best methods (Sharp andCMCCAT2000) havemore than 21 greatermean PED errorThis is an encouraging result for the use of the proposedmethod
Figure 3 shows box plots of PED errors for differentCAT methods Box plot is a tool for visualisation of the datadistribution [7] or in our case a tool for the visualization ofthe distribution of the PED errors It visualizes five statisticsminimal error MIN lower quartile 1198761 median error 1198762upper quartile 1198763 and limited maximal error LMAX whichis not greater than 1198763 + 15(1198763 minus 1198761) Errors greater thanLMAX are shown as outliers
Although the evaluated CAT methods have similar boxplots it can be clearly seen that our proposed method haslower119876111987621198763 and LMAX (MIN = 0 for all the methods)
Mathematical Problems in Engineering 7
Table 2 Results of the Mann-Whitney U test comparing median PED errors of different CAT methods
minus1minus1 minus1
minus1minus1minus1
sRGBsRGB
XYZ
XYZ
Bradford0
0 0 0 0000
1
0
0
0
00
0
0
0001
1
1 1
Bradford
Sharp
Sharp
CMCCAT2000
CMCCAT2000
DT-based
DT-based
1A positive value (1) at location (119894 119895) indicates that the median PED error of the methods 119894 is significantly lower than the median PED error of method 119895 at the95 confidence level A negative value (minus1) indicates the opposite and a zero (0) indicates that there is no significant difference between the two methods
10 15 20 25 30 35 40
Number of triangles
PED
025
02
015
01
005
0
Figure 4 Correlation between the number of triangles and PEDerror Dots represent mean number of triangles produced bytriangulation and mean PED error on every image in the databaseRed line is used to quickly visualize linear least-square trend of thedata and it is not meant to be an accurate model of the relation
This tells us that most PED errors of our proposed methodare lower than corresponding PED errors produced by otherCAT methods
To verify that our proposed method performs better thanother existing methods we conducted statistical test as sug-gested in [7] Mann-Whitney U test [29] is a nonparametricstatistical test that does not imply normal distribution ofunderlying values It is used to show whether median valuesof two samples are statistically significantly different or notTwo values are significantly different if given the confidentiallevel we can conclude that the observation is not the result ofa random process [30]
We compared median PED errors of each pair of eval-uated methods and checked if two values are significantlydifferent Results are presented in Table 2Median PED errorsofmethods sRGB119883119884119885 Bradford Sharp andCMCCAT2000are not significantly different except for the significantlylower error of the Sharp transform compared to the 119883119884119885transform The proposed method has significantly lowermedian PED error compared to all of the other methods We
conclude that under the experimental conditions presentedin this paper our method significantly outperforms otherexisting methods
Surprisingly the sRGB method performs similarly to themethods using sensor sharpening Some authors [11 15] statethat methods based on RGB color model do not perform aswell as sensor sharpened methods We showed differently
Figure 4 showing correlation between the number oftriangles produced by triangulation and mean PED errorconfirms that the number of triangles has significant influ-ence on the performance of the proposed method A highernumber of triangles imply lower triangle areas in whichthe transformation matrix more accurately transforms partof the original color gamut A higher number of knowncorresponding points between the source and the target colorgamut results in more accurate transformation matrices andbetter method performance
Figure 5 shows random image from the color-checkerimage database transformed with conventional119883119884119885methodand our proposed method Original image was shot underartificial light and has strong color cast Both transformationsgreatly reduce this color cast when transforming to D65illuminant By closer examining image transformed with119883119884119885method (zoom in on the image) you can still see yellowcolor cast on the ground On the image transformed with ourmethod this color cast is completely removed
5 Conclusion
This paper tackles the problem of changing the illuminant ofan image andproposes a newmethod to increase the accuracyof the transformThe proposed method uses Delaunay trian-gulation and linear transformations in order to transform theinput imageThe only assumption it relies on is that the colorvalues of the patches of the Macbeth color checker capturedunder the same illuminant as the input imagemust be knownthat is theMacbeth color checkermust be captured under thesame illuminant but not necessarily in the same image
Objective comparison shows that our method performssignificantly better than other state-of-the-art methods
8 Mathematical Problems in Engineering
(a)
(b)
(c)
Figure 5 Visual comparison of original image (a) image transformed with 119883119884119885 transform (b) and image transformed with our method(c) Target illuminant is D65
Conflict of Interests
The authors declare that there is no conflict of interestsregarding the publication of this paper
Acknowledgment
This work was supported by the Ministry of Science ofRepublic of Slovenia Program Computer Vision
Mathematical Problems in Engineering 9
References
[1] L G Corzo J A Penaranda and P Peer ldquoEstimation ofa fluorescent lamp spectral distribution for color image inmachine visionrdquo Machine Vision and Applications vol 16 no5 pp 306ndash311 2005
[2] J Kovac P Peer and F Solina ldquoHuman skin color clustering forface detectionrdquo in EUROCON Computer As A Tool vol 2 pp144ndash148 2003
[3] S Liu W Fu W Zhao J Zhou and Q Li ldquoA novel fusionmethod by static and moving facial capturerdquo MathematicalProblems in Engineering vol 2013 Article ID 503924 6 pages2013
[4] X Li and X Cao ldquoA simple framework for face photo-sketchsynthesisrdquo Mathematical Problems in Engineering vol 2012Article ID 910719 19 pages 2012
[5] Y-K Chan M-H Tsai J-S Wang S-W Guo and J-L WuldquoColor-texture-based image retrieval system using GaussianMarkov random field modelrdquo Mathematical Problems in Engi-neering vol 2009 Article ID 410243 17 pages 2009
[6] M D Fairchild Color Appearance Models John Wiley amp Sons2005
[7] J van de Weijer T Gevers and A Gijsenij ldquoEdge-based colorconstancyrdquo IEEE Transactions on Image Processing vol 16 no9 pp 2207ndash2214 2007
[8] J von Kries ldquoInfluence of adaptation on the effects produced byluminous stimulirdquo in Sources of Color Science D L MacAdamEd pp 109ndash119 MIT Press Cambridge Mass USA 1970
[9] G West and M H Brill ldquoNecessary and sufficient conditionsfor Von Kries chromatic adaptation to give color constancyrdquoJournal ofMathematical Biology vol 15 no 2 pp 249ndash258 1982
[10] D A Forsyth ldquoA novel algorithm for color constancyrdquo Interna-tional Journal of Computer Vision vol 5 no 1 pp 5ndash35 1990
[11] K Barnard F Ciurea and B Funt ldquoSensor sharpening forcomputational color constancyrdquo Journal of the Optical Societyof America A vol 18 no 11 pp 2728ndash2743 2001
[12] E M Granger ldquoScanner calibration techniquerdquo US Patent 6 134029 October 17 2000
[13] C F Andersen and J Y Hardeberg ldquoColorimetric character-ization of digital cameras preserving hue planesrdquo Color andImaging Conference vol 13 no 1 pp 141ndash146 2005
[14] M Ebner Color Constancy John Wiley amp Sons New York NYUSA 2007
[15] S Susstrunk J Holm and G D Finlayson ldquoChromatic adap-tation performance of different RGB sensorsrdquo in Proceedings ofthe ISampTSPIE Electronic Imaging pp 172ndash183 January 2001
[16] J A S Viggiano ldquoComparison of the accuracy of differentwhitebalancing options as quantified by their color constancyrdquoin Sensors and Camera Systems For Scientific pp 323ndash333Industrial and Digital Photography Applications 2004
[17] R W G Hunt and M R Pointer Metamerism and ColourConstancy John Wiley and Sons 2011
[18] G D Finlayson and S Susstrunk ldquoPerformance of a chromaticadaptation transformbased on spectral sharpeningrdquo inProceed-ings of the 8th IS and TSID Color Imaging Conference (CIC rsquo00)pp 49ndash55 November 2000
[19] H Li M Ronnier Luo B Rigg and R W G Hunt ldquoCMC2000 chromatic adaptation transform CMCCAT2000rdquo ColorResearch and Application vol 27 no 1 pp 49ndash58 2002
[20] C Li M R Luo and B Rigg ldquoSimplification of the CMC-CAT97rdquo in Proceedings of the 8th IS and TSID Color ImagingConference (CIC rsquo00) pp 56ndash60 November 2000
[21] A Ben-Israel and T N E Greville Generalized Inverses Theoryand Applications Springer 2003
[22] B Delaunay ldquoSur la sphre vide izvestia akademii nauk sssrrdquoOtdelenIe MatematIcheskIkh I Estestvennykh Nauk vol 6 no 7pp 793ndash800 1934
[23] C Balkenius and B Johansson ldquoFinding colored objects in ascenerdquo Tech Rep LUCS Minor 12 Lund University CognitiveScience (LUCS) Lund Sweden 2007
[24] P V Gehler C Rother A Blake T Minka and T SharpldquoBayesian color constancy revisitedrdquo in Proceedings of the 26thIEEE Conference on Computer Vision and Pattern Recognition(CVPRrsquo 08) June 2008
[25] P Gehler 2008 Bayesian Color Constancy Revisitedhttppeoplekybtuebingenmpgdepgehlercolourindexhtml
[26] IECmultimedia systems and equipmentmdashcolour measurementand managementmdashpart 2-1 Colour managementmdashdefault rgbcolour space mdashsrgb Standard IEC 61966-2-1 1999
[27] D Pascale 2006 RGB coordinates of the Macbeth Col-orChecker httpwwwbabelcolorcomdownloadRGB
[28] A Gijsenij T Gevers and M P Lucassen ldquoA perceptual com-parison of distance measures for color constancy algorithmsrdquoin Proceedings of the European Conference on Computer Vision(ECCVrsquo 08) pp 208ndash221 2008
[29] H B Mann and D R Whitney ldquoOn a test of whether one oftwo randomvariables is stochastically larger than the otherrdquoTheAnnals of Mathematical Statistics vol 18 no 1 pp 50ndash60 1947
[30] R Fisher Statistical Methods For Research Workers Cosmostudy guides Cosmo Publications 1925
Submit your manuscripts athttpwwwhindawicom
Hindawi Publishing Corporationhttpwwwhindawicom Volume 2014
MathematicsJournal of
Hindawi Publishing Corporationhttpwwwhindawicom Volume 2014
Mathematical Problems in Engineering
Hindawi Publishing Corporationhttpwwwhindawicom
Differential EquationsInternational Journal of
Volume 2014
Applied MathematicsJournal of
Hindawi Publishing Corporationhttpwwwhindawicom Volume 2014
Probability and StatisticsHindawi Publishing Corporationhttpwwwhindawicom Volume 2014
Journal of
Hindawi Publishing Corporationhttpwwwhindawicom Volume 2014
Mathematical PhysicsAdvances in
Complex AnalysisJournal of
Hindawi Publishing Corporationhttpwwwhindawicom Volume 2014
OptimizationJournal of
Hindawi Publishing Corporationhttpwwwhindawicom Volume 2014
CombinatoricsHindawi Publishing Corporationhttpwwwhindawicom Volume 2014
International Journal of
Hindawi Publishing Corporationhttpwwwhindawicom Volume 2014
Operations ResearchAdvances in
Journal of
Hindawi Publishing Corporationhttpwwwhindawicom Volume 2014
Function Spaces
Abstract and Applied AnalysisHindawi Publishing Corporationhttpwwwhindawicom Volume 2014
International Journal of Mathematics and Mathematical Sciences
Hindawi Publishing Corporationhttpwwwhindawicom Volume 2014
The Scientific World JournalHindawi Publishing Corporation httpwwwhindawicom Volume 2014
Hindawi Publishing Corporationhttpwwwhindawicom Volume 2014
Algebra
Discrete Dynamics in Nature and Society
Hindawi Publishing Corporationhttpwwwhindawicom Volume 2014
Hindawi Publishing Corporationhttpwwwhindawicom Volume 2014
Decision SciencesAdvances in
Discrete MathematicsJournal of
Hindawi Publishing Corporationhttpwwwhindawicom
Volume 2014 Hindawi Publishing Corporationhttpwwwhindawicom Volume 2014
Stochastic AnalysisInternational Journal of

2 Mathematical Problems in Engineering
between different color channels still remains even afterthe sharpening process Full linear transformations can beused to account for the correlation between different colorchannels
The method proposed in this paper uses Delaunay tri-angulation and Macbeth color checker to divide the colorgamut of the input image and it constructs one full lineartransformation for each triangle of the divided color gamutthat is each color in the input image is transformed with thematrix of the triangle that contains the color It is meant tobe used primarily as a preprocessing step of other computervision algorithms operating with color information
Similar approaches have been used to transform col-ors from camera color space to device-independent colorspace It should be noted that our approach addresses thechromatic adaptation and assumes that colors have alreadybeen transformed from camera to device-independent colorspace Granger [12] divided color space based on the huevalues of reference color points and calculated transforma-tion matrix for each one of the subspaces Andersen andHardeberg [13] used patches of the Macbeth color checker todivide color space and associated each subspace with lineartransformation that preserves neutral colors and hue planesBoth of the approaches use two-dimensional chromaticityspace to find subspace that contains specific color but actualtransformation is done using all three channels of the originalcolor space Our approach differs from that in [12 13] bydefining a new way of dividing color space using Delaunaytriangulation and using chromaticity space both to findsubspace and transform color points
The rest of the paper is organised as follows Section 2describes the problem and related work Section 3 providesthe description of the new method Section 4 gives experi-mental evaluation of the newmethod Finally conclusions aredrawn in Section 5
2 Problem and Related Work
Chromatic adaptation is the ability of the human visualsystem to adjust to illumination changes and preserve colorappearance of the objects [14] It allows us to see stablecolors of the objects illuminated by a wide range of differentilluminations Chromatic adaptation transforms (CATs) aremethods used in digital imaging and color science to modelthe described mechanism of the human visual system Theyprovide a means to transform color values under a sourceillumination into color values under a target illumination
A standard model to compute transformation from oneillumination to another one is diagonal von Kries likeadaptation model [8] If (119877 119866 119861) denotes color value undersource illumination then model states that we can model thesame color value under target illumination as
[
[
1198771015840
1198661015840
1198611015840]
]
= [
[
119888119877
0 0
0 119888119866
0
0 0 119888119861
]
]
[
[
119877
119866
119861
]
]
(1)
where 119888119877 119888119866 and 119888
119861represent scaling coefficients for color
channels These scaling coefficients are most often the ratios
of target illumination (119877119905 119866119905 119861119905) and source illumination
(119877119904 119866119904 119861119904) that is 119888
119877= 119877119905119877119904 119888119866= 119866119905119866119904 and 119888
119861= 119861119905119861119904
However differentCATs differ in the color space inwhich thisscaling takes place
Obvious choice is the color space in which image isinitially described such as sRGB color space This process issimple as no additional transformations of the color spacesare required Other commonly used color spaces are derivedas linear transformations of the 119883119884119885 space [15] The processof deriving these linear transformations of the 119883119884119885 space iscalled sensor sharpening [11] Color matching functions ofthe derived color spaces tend to have sharper narrower peaksthus they support better the von Kries like models The basicmodel for transforming color values in derived color spacesis as follows
(1) (119877 119866 119861) value is transformed into (119883 119884 119885) value(2) (119883 119884 119885) value is transformed using
[
[
1198831015840
1198841015840
1198851015840]
]
= Mminus1 sdot [[
119888119877
0 0
0 119888119866
0
0 0 119888119861
]
]
sdotM sdot [
[
119883
119884
119885
]
]
(2)
(3) (1198831015840 1198841015840 1198851015840) value is transformed back to (1198771015840 1198661015840 1198611015840)value
Some commonly used transformations of the 119883119884119885 colorspaceM are as follows
(i) 119883119884119885 M119883119884119885
is the identity matrix in (3) Thismethodrsquos performance is poor [16]
M119883119884119885
= [
[
1 0 1
0 1 0
0 0 1
]
]
(3)
(ii) Bradford a commonly used transformation derivedby comparing 58 samples of color wool under illu-minants D65 and A [17] At the beginning thistransformationwas nonlinear in the blue channel butthis nonlinearity was eliminated later Consider
MBradford =[
[
08951 02664 minus01614
minus07502 17135 00367
00389 minus00685 10296
]
]
(4)
(iii) Sharp a widely used newer transformation derivedfrom the Bradford transform [18] It has more narrowpeaks of color basis functions than the Bradford colorspace thus it supports better von Kries like modelConsider
MSharp =[
[
12694 minus00988 minus01706
minus08364 18006 00357
00297 minus00315 10018
]
]
(5)
(iv) CMCCAT2000 simplified CMCCAT2000 [19] is thesuccessor of the complexCMCCAT97 transformation[20] which was also derived from the Bradford trans-formation CMCCAT2000 also allows modelling of
Mathematical Problems in Engineering 3
the partial adaptation of the observer but partialadaptation is not considered in this paper because weassume a fully adapted observer Consider
MCMCCAT2000 =[
[
07982 03389 minus01371
minus05918 15512 00406
00008 0239 09753
]
]
(6)
All of the described transformations use the diagonalvon Kries like model to model illuminant change But ithas been shown [9 10] that diagonal model is not accurateif color channels are correlated Even after color channelsare transformed using sensor sharpening there is still somecorrelation left We can model the correlation using fulllinear model instead of the diagonal model The reason whyusually the full linear model is not used is that there is notenough information available to determine the coefficientsin particular if we only know the values of the illuminantsBut if we have more color correspondence pairs between twoilluminations there is no need to limit our methods to thediagonal model Instead we can use full linearmodel that alsocaptures correlations between color channels
3 Proposed Method
The algorithm proposed in this paper is based on theassumption that color points whose chromaticity values areclose together in the color gamut of the source illuminationshould warp smoothly to a new color gamut of the targetillumination In order to change the illuminant of anycolor point the color gamut is divided into smaller regionsaccording to some reference points and the transformationto be applied to each region is computedThat is the objectiveis to obtain the transformation matrix to be applied to eachregion in the source color gamut Our method is suitable forcontrolled applicative environment because it assumes thatboth source and target illuminations are known and that theMacbeth color checker is present in the input image or colorvalues of the patches of the Macbeth color checker capturedunder the illuminant of the input image are known
The following subsections explain our transformationbetween the source and the target color gamut outlinethe Delaunay triangulation used to divide the color gamutinto smaller regions and finally describe the proposed CATmethod to change the illuminant
31 Calculation of the Transformation Matrices between Dif-ferent Color Gamuts The function of transformation to beapplied for changing the illuminant can be obtained if somereference points are known in the source color gamut andtheir transformations in the target color gamut are knownas well We describe these reference points in chromatic rgspace The reason why we are using the chromatic rg modelinstead of the nativeRGBmodel is thatwewant similar colorsignoring intensity values to be transformed with the sametransformation matrix
The following equations system in (7) is themathematicalrelation between one chromatic point in the source color
gamut 119883(119909 119910) and the target color gamut 119880(119906 V) This rela-tion can be linear quadratic cubic and so forth dependingon the value of 119896 The quantities 119886 and 119887 are unknown factorsthat can be solved if several points in the source color gamutand their transformation in the target color gamut are knownConsider
119906 = sum119896
119896
sum119894=0
119886(119896(119896+1)+2119894)2
119909119896minus119894119910119894
V = sum119896
119896
sum119894=0
119887(119896(119896+1)+2119894)2
119909119896minus119894119910119894
(7)
Any point within the source color gamut 119883(119909 119910) can betransformed into the corresponding point of the target colorgamut 119880(119906 V) by using the relation in (7)
If a linear relation (119896 = 1) is considered then the systemin (7) becomes
119906 = 1198860+ 1198861sdot 119909 + 119886
2sdot 119910
V = 1198870+ 1198871sdot 119909 + 119887
2sdot 119910
(8)
or in matrix form
U = A sdot Y (9)
where
U = [119906
V] (10)
A = [119886011988611198862
119887011988711198872
] (11)
Y = [
[
1
119909
119910
]
]
(12)
In order to calculate the unknown factors in A 119886119895and
119887119895for 119895 = 0 1 2 as there are six unknown factors and two
equations it is necessary to know at least three points in thesource color gamut and their transformations in the targetcolor gamut If we had chosen a higher order relation (119896 gt 1)
more correspondence points would have to be knownThe known three points in the source color gamut
119883119897(119909119897 119910119897) for 119897 = 1 2 3 describe a triangle They can be
arranged in matrix form as
S = [
[
1 1 1
119909111990921199093
119910111991021199103
]
]
(13)
And the known three points of the transformed trianglein the target color gamut 119880
119897(119906119897 V119897) for 119897 = 1 2 3 can be
arranged in matrix form as
T = [119906111990621199063
V1
V2
V3
] (14)
The equations system to be solved in order to compute theunknown factors in A is
T = A sdot S (15)
4 Mathematical Problems in Engineering
And the solution to this system is
A = T sdot Sminus1 (16)
where Sminus1 can be computed by means of a singular valuesdecomposition (SVD) [21]
Transformation matrix A differs from diagonal modelsused by other CAT methods by also capturing the relationsbetween separate color channels thus it is more accurate ifcolor channels are correlated
Once the transformationmatrixA is known it is possibleto transform any point within the triangle defined by theknown reference three points in the source color gamut tothe target color gamut by using (9)The smaller the triangle inthe source color gamut themore accurate the transformationwill be for the points inside the triangle The transformationis completely accurate when transforming vertices of thetriangle because they have direct mappings from source totarget illuminant So if we reduce the size of the triangle colorpoints that lie inside it becomemore similar to the vertices ofthe triangle which have direct mappings defined This is thereason why it is desirable to divide the color gamut into thesmaller possible triangles according to the reference pointsknown in both color gamuts The method explained in thefollowing subsection is used to obtain the biggest number ofnonoverlapping triangles given a number of reference points
32 Delaunay Triangulation Delaunay triangulation [22] isa well-known method in the field of mesh generation dueto its optimality properties In the plane or the 2D case theDelaunay triangulation Del(119875) of a set of 119899 points 119875 = 119901
119894
for 119894 = 1 119899 inR2 is a collection of triangles Tr(119901119895 119901119896 119901119897)
such that no point in 119875 is inside the circumcircle of anytriangle in Del(119875)
For a set of 119899 points the number of triangles producedby triangulation depends on the spatial distribution of thepoints If 119887 is a number of points forming convex hull of thepoints then the number of triangles119873 is at most
119873 = 2119899 minus 2 minus 119887 (17)
Degeneration of 119873 can occur if all the points lie on thesame line Then there are no triangles defined But consid-ering the domain of color transformation this is unlikely tohappen
The Delaunay triangulation will be used to divide thecolor gamut into smaller regions (triangles) according to thereference points known in both color gamuts We shouldmention that the resulting triangulation is not unique whenfour or more points lie on the same circle Further researchwill be needed to study the effects of different possibletriangulations of the same color points
33 Illuminant Change Method Once the formula for thetransformation matrix for a number of reference points isknown and the way to divide the color gamut into smallertriangles has been established then in order to perform theilluminant change the following steps are to be carried out
+
++
+
Color checker Color rendition chartGretagMacbeth
Figure 1 Macbeth color checker Color patches have spectral reflec-tance intended tomimic those of natural objects such as human skinfoliage and flowers
(1) The Macbeth color checker (Figure 1) present in theinput image is used as the reference to achieve colorconstancy Delaunay triangulation is done to dividethe original color gamut by using the mean (119903 119892)
values of the 24 patches of theMacbeth color checkerFigure 2 shows triangulations of the color gamut fortwo different illuminants
(2) Once the triangles are defined the transformationmatrixA of each triangle in the source color gamut iscomputed using (16)Thus there are asmanymatricesA as triangles
(3) For each point of the source color gamut that needs tobe transformed the transformation in the target colorgamut is obtained with (9) that is by applying thetransformation matrix A of the triangle that containsthe point First RGB color point 119862 = (119877 119866 119861)
is converted to rg point 119862119903119892
= (119903 119892) Then thetriangle containing point 119862
119903119892is found and the point
is transformed using the transformation matrix A ofthe triangle containing it resulting in a new rg point1198621015840
119903119892= (1199031015840 1198921015840) The new RGB point 1198621015840 = (1198771015840 1198661015840 1198611015840) is
obtained using
1198771015840= 1199031015840sdot (119877 + 119866 + 119861)
1198661015840= 1198921015840sdot (119877 + 119866 + 119861)
1198611015840= (1 minus 119903
1015840minus 1198921015840) sdot (119877 + 119866 + 119861)
(18)
preserving the sum of channel intensities before andafter the transformation
As far as the points in the source color gamut are insideone of the triangles obtained by Delaunay triangulationusing the patches of the Macbeth color checker the resultingtransformation using the matrices A is valid Neverthelessthe triangles defined by the patches of the Macbeth colorchecker do not cover the whole rg chromaticity space Henceproblems appear when transforming a point in the sourcecolor gamut that is outside any triangle as the illuminant isnot corrected properly for these points
Mathematical Problems in Engineering 5
Non-standard illuminant1
09
08
07
06
05
04
03
02
01
00 02 04 06 08 1
D65 illuminantg
1
09
08
07
06
05
04
03
02
01
0
gr
0 02 04 06 08 1
r
Figure 2 Triangulations of the color gamut for two different illuminants The triangulations are shown in the rg chromaticity space with thepoint colors being the same as patch colors of the Macbeth color checker captured under the same illuminant
In order to handle these points outside the trianglesdefined by the patches of the Macbeth color checker weconsider the vertices of the whole rg chromaticity space asreference points together with the patches of the Macbethcolor checker The vertices of the rg chromaticity space in(119903 119892) are (0 0) (1 0) and (0 1) Note that point (1 1) is notthe vertex of the rg chromaticity space By the definition ofrg space sum of both components cannot be greater thanone [23] The transformed points of these vertices for anyilluminant are the same points as the limits of the rg space arefixed and if an overflow occurs the obtained point is saturatedto the limit
The proposed method has one restriction The trianglesdefined by the values of the Macbeth color checker under asource illuminant may cross or fold over each other whentransformed to a target illuminant Likewise the transforma-tion of the arbitrary color point within certain triangle underthe source illuminant does not guarantee that transformedcolor point will be contained in the corresponding triangleunder the target illuminant Because of these properties theinverse transformation cannot be defined with our proposedmethod However exact inverse transformation is rarelyneeded in the applicative environment described at thebeginning of the paper
4 Experimental Evaluation
To objectively evaluate the performance of our methodwe used color-checker image database [24] It contains 568images captured under different artificial and natural illumi-nations All the images in the database contain a Macbethcolor checker which is an assumption our method impliesThe coordinates of the patches of a Macbeth color checker
are available on the website of the image database [25] fromwhich we also obtained illuminant estimates used by otherCAT methods To speed up evaluation all transformationswere made on the downscaled versions of images (813 times 541)also available on the website of the image database
All the images in the database are described in sRGB colorspace with gamma correction applied CAT methods assumethat linear images are given so inverse gamma correctionwasapplied to produce linear images [26]
Chlin =
Chs1198771198661198611292
Chs119877119866119861 le 004045
(Chs119877119866119861 + 0055
1055)
24
Chs119877119866119861 gt 004045
(19)
where Chlin represents the linearized sRGB value of the colorchannel Ch = 119877 119866 119861
To evaluate the performance of our method we trans-formed the color patches of the Macbeth color checker oneach of the 568 images and compared the transformed valueswith the values of the patches of the Macbeth color checkercaptured under standard D65 illuminant [27] To ensure thatour method is not in a privileged position compared to otherCAT methods we took two precautions as follows
(i) The color value of the patch currently being trans-formed cannot be used when triangulating the sourcecolor gamut and calculating transformationmatricesOtherwise it is the part of the transformation matrix
(ii) Chromaticity values of the patches in the last row oftheMacbeth color checker are very similarThat is thereason why we ignore all the patches of the Macbethcolor checker in the last row except the third patchfrom the left One could also choose any other patchfrom the last row
6 Mathematical Problems in Engineering
Performance of ourmethod is evaluated using the follow-ing steps
(1) Color values of the patches of the Macbeth colorchecker in the input image are calculated
(2) All the color patches from the last row of theMacbethcolor checker except the third one from the left arediscarded
(3) To each of the remaining 19 color patches we apply thefollowing
(a) From the set of color values we temporarilyremove the value of the patch currently beingtransformed
(b) Delaunay triangulation is applied(c) We find the triangle containing the color value
of the patch currently being transformed(d) We use the transformationmatrix of the triangle
to transform the patch value(e) Difference between the transformed value and
the reference value of the patch under standardD65 illumination is computed
(4) The error of the single image is equal to the meandifference of all the transformed color patches
Performance of other CAT methods (sRGB 119883119884119885 Brad-ford Sharp and CMCCAT2000) is evaluated similarly asfollows
(1) Color values of the patches of the Macbeth colorchecker in the input image are calculated
(2) All the color patches from the last row of theMacbethcolor checker except the third one from the left arediscarded
(3) Color values of the 19 remaining patches are trans-formed using the CAT method Differences betweenthe transformed value and the reference value of thepatch under standardD65 illumination are computed
(4) The error of the single image is equal to the meandifference of all the transformed color patches
To compute the difference between the values of trans-formed patches and reference patches perceptual euclidiandistance (PED) is used
PED (119890119905 119890119903) = radic119908
119877(119877119905119877119903)2
+ 119908119866(119866119905119866119903)2
+ 119908119861(119861119905119861119903)2
(20)
where 119890119905= (119877119905 119866119905 119861119905) represents normalised transformed
values 119890119903
= (119877119903 119866119903 119861119903) represents normalised reference
values and 119908119877 119908119866 and 119908
119861represent weight coefficients It
was shown that PED with weight coefficients 119908119877
= 026119908119866= 070 and 119908
119861= 004 finds its roots in human vision
and correlates significantly higher than any other distancemeasures [28]
Mean PED errors of different methods are shown inTable 1 Performance of the evaluated methods is similar
Table 1 Comparison of mean PED error of different CATmethods
Method PED RanksRGB 0047 3XYZ 0048 4Bradford 0047 3Sharp 0046 2CMCCAT2000 0046 2DT-based 0038 1
sRGB XYZ
Brad
ford
Shar
p
CMCC
AT20
00
DT-
base
d
0
PED
01
02
03
04
05
06
MINQ1
Q3Q2
Lmax
Figure 3 Boxplots summarizing PED errors of different CATmethods First boxplot from the left has labels showing five statistics
The only method that stands out is our proposed method(DT-based) that has significantly lower mean PED error thanthe other methods The second best methods (Sharp andCMCCAT2000) havemore than 21 greatermean PED errorThis is an encouraging result for the use of the proposedmethod
Figure 3 shows box plots of PED errors for differentCAT methods Box plot is a tool for visualisation of the datadistribution [7] or in our case a tool for the visualization ofthe distribution of the PED errors It visualizes five statisticsminimal error MIN lower quartile 1198761 median error 1198762upper quartile 1198763 and limited maximal error LMAX whichis not greater than 1198763 + 15(1198763 minus 1198761) Errors greater thanLMAX are shown as outliers
Although the evaluated CAT methods have similar boxplots it can be clearly seen that our proposed method haslower119876111987621198763 and LMAX (MIN = 0 for all the methods)
Mathematical Problems in Engineering 7
Table 2 Results of the Mann-Whitney U test comparing median PED errors of different CAT methods
minus1minus1 minus1
minus1minus1minus1
sRGBsRGB
XYZ
XYZ
Bradford0
0 0 0 0000
1
0
0
0
00
0
0
0001
1
1 1
Bradford
Sharp
Sharp
CMCCAT2000
CMCCAT2000
DT-based
DT-based
1A positive value (1) at location (119894 119895) indicates that the median PED error of the methods 119894 is significantly lower than the median PED error of method 119895 at the95 confidence level A negative value (minus1) indicates the opposite and a zero (0) indicates that there is no significant difference between the two methods
10 15 20 25 30 35 40
Number of triangles
PED
025
02
015
01
005
0
Figure 4 Correlation between the number of triangles and PEDerror Dots represent mean number of triangles produced bytriangulation and mean PED error on every image in the databaseRed line is used to quickly visualize linear least-square trend of thedata and it is not meant to be an accurate model of the relation
This tells us that most PED errors of our proposed methodare lower than corresponding PED errors produced by otherCAT methods
To verify that our proposed method performs better thanother existing methods we conducted statistical test as sug-gested in [7] Mann-Whitney U test [29] is a nonparametricstatistical test that does not imply normal distribution ofunderlying values It is used to show whether median valuesof two samples are statistically significantly different or notTwo values are significantly different if given the confidentiallevel we can conclude that the observation is not the result ofa random process [30]
We compared median PED errors of each pair of eval-uated methods and checked if two values are significantlydifferent Results are presented in Table 2Median PED errorsofmethods sRGB119883119884119885 Bradford Sharp andCMCCAT2000are not significantly different except for the significantlylower error of the Sharp transform compared to the 119883119884119885transform The proposed method has significantly lowermedian PED error compared to all of the other methods We
conclude that under the experimental conditions presentedin this paper our method significantly outperforms otherexisting methods
Surprisingly the sRGB method performs similarly to themethods using sensor sharpening Some authors [11 15] statethat methods based on RGB color model do not perform aswell as sensor sharpened methods We showed differently
Figure 4 showing correlation between the number oftriangles produced by triangulation and mean PED errorconfirms that the number of triangles has significant influ-ence on the performance of the proposed method A highernumber of triangles imply lower triangle areas in whichthe transformation matrix more accurately transforms partof the original color gamut A higher number of knowncorresponding points between the source and the target colorgamut results in more accurate transformation matrices andbetter method performance
Figure 5 shows random image from the color-checkerimage database transformed with conventional119883119884119885methodand our proposed method Original image was shot underartificial light and has strong color cast Both transformationsgreatly reduce this color cast when transforming to D65illuminant By closer examining image transformed with119883119884119885method (zoom in on the image) you can still see yellowcolor cast on the ground On the image transformed with ourmethod this color cast is completely removed
5 Conclusion
This paper tackles the problem of changing the illuminant ofan image andproposes a newmethod to increase the accuracyof the transformThe proposed method uses Delaunay trian-gulation and linear transformations in order to transform theinput imageThe only assumption it relies on is that the colorvalues of the patches of the Macbeth color checker capturedunder the same illuminant as the input imagemust be knownthat is theMacbeth color checkermust be captured under thesame illuminant but not necessarily in the same image
Objective comparison shows that our method performssignificantly better than other state-of-the-art methods
8 Mathematical Problems in Engineering
(a)
(b)
(c)
Figure 5 Visual comparison of original image (a) image transformed with 119883119884119885 transform (b) and image transformed with our method(c) Target illuminant is D65
Conflict of Interests
The authors declare that there is no conflict of interestsregarding the publication of this paper
Acknowledgment
This work was supported by the Ministry of Science ofRepublic of Slovenia Program Computer Vision
Mathematical Problems in Engineering 9
References
[1] L G Corzo J A Penaranda and P Peer ldquoEstimation ofa fluorescent lamp spectral distribution for color image inmachine visionrdquo Machine Vision and Applications vol 16 no5 pp 306ndash311 2005
[2] J Kovac P Peer and F Solina ldquoHuman skin color clustering forface detectionrdquo in EUROCON Computer As A Tool vol 2 pp144ndash148 2003
[3] S Liu W Fu W Zhao J Zhou and Q Li ldquoA novel fusionmethod by static and moving facial capturerdquo MathematicalProblems in Engineering vol 2013 Article ID 503924 6 pages2013
[4] X Li and X Cao ldquoA simple framework for face photo-sketchsynthesisrdquo Mathematical Problems in Engineering vol 2012Article ID 910719 19 pages 2012
[5] Y-K Chan M-H Tsai J-S Wang S-W Guo and J-L WuldquoColor-texture-based image retrieval system using GaussianMarkov random field modelrdquo Mathematical Problems in Engi-neering vol 2009 Article ID 410243 17 pages 2009
[6] M D Fairchild Color Appearance Models John Wiley amp Sons2005
[7] J van de Weijer T Gevers and A Gijsenij ldquoEdge-based colorconstancyrdquo IEEE Transactions on Image Processing vol 16 no9 pp 2207ndash2214 2007
[8] J von Kries ldquoInfluence of adaptation on the effects produced byluminous stimulirdquo in Sources of Color Science D L MacAdamEd pp 109ndash119 MIT Press Cambridge Mass USA 1970
[9] G West and M H Brill ldquoNecessary and sufficient conditionsfor Von Kries chromatic adaptation to give color constancyrdquoJournal ofMathematical Biology vol 15 no 2 pp 249ndash258 1982
[10] D A Forsyth ldquoA novel algorithm for color constancyrdquo Interna-tional Journal of Computer Vision vol 5 no 1 pp 5ndash35 1990
[11] K Barnard F Ciurea and B Funt ldquoSensor sharpening forcomputational color constancyrdquo Journal of the Optical Societyof America A vol 18 no 11 pp 2728ndash2743 2001
[12] E M Granger ldquoScanner calibration techniquerdquo US Patent 6 134029 October 17 2000
[13] C F Andersen and J Y Hardeberg ldquoColorimetric character-ization of digital cameras preserving hue planesrdquo Color andImaging Conference vol 13 no 1 pp 141ndash146 2005
[14] M Ebner Color Constancy John Wiley amp Sons New York NYUSA 2007
[15] S Susstrunk J Holm and G D Finlayson ldquoChromatic adap-tation performance of different RGB sensorsrdquo in Proceedings ofthe ISampTSPIE Electronic Imaging pp 172ndash183 January 2001
[16] J A S Viggiano ldquoComparison of the accuracy of differentwhitebalancing options as quantified by their color constancyrdquoin Sensors and Camera Systems For Scientific pp 323ndash333Industrial and Digital Photography Applications 2004
[17] R W G Hunt and M R Pointer Metamerism and ColourConstancy John Wiley and Sons 2011
[18] G D Finlayson and S Susstrunk ldquoPerformance of a chromaticadaptation transformbased on spectral sharpeningrdquo inProceed-ings of the 8th IS and TSID Color Imaging Conference (CIC rsquo00)pp 49ndash55 November 2000
[19] H Li M Ronnier Luo B Rigg and R W G Hunt ldquoCMC2000 chromatic adaptation transform CMCCAT2000rdquo ColorResearch and Application vol 27 no 1 pp 49ndash58 2002
[20] C Li M R Luo and B Rigg ldquoSimplification of the CMC-CAT97rdquo in Proceedings of the 8th IS and TSID Color ImagingConference (CIC rsquo00) pp 56ndash60 November 2000
[21] A Ben-Israel and T N E Greville Generalized Inverses Theoryand Applications Springer 2003
[22] B Delaunay ldquoSur la sphre vide izvestia akademii nauk sssrrdquoOtdelenIe MatematIcheskIkh I Estestvennykh Nauk vol 6 no 7pp 793ndash800 1934
[23] C Balkenius and B Johansson ldquoFinding colored objects in ascenerdquo Tech Rep LUCS Minor 12 Lund University CognitiveScience (LUCS) Lund Sweden 2007
[24] P V Gehler C Rother A Blake T Minka and T SharpldquoBayesian color constancy revisitedrdquo in Proceedings of the 26thIEEE Conference on Computer Vision and Pattern Recognition(CVPRrsquo 08) June 2008
[25] P Gehler 2008 Bayesian Color Constancy Revisitedhttppeoplekybtuebingenmpgdepgehlercolourindexhtml
[26] IECmultimedia systems and equipmentmdashcolour measurementand managementmdashpart 2-1 Colour managementmdashdefault rgbcolour space mdashsrgb Standard IEC 61966-2-1 1999
[27] D Pascale 2006 RGB coordinates of the Macbeth Col-orChecker httpwwwbabelcolorcomdownloadRGB
[28] A Gijsenij T Gevers and M P Lucassen ldquoA perceptual com-parison of distance measures for color constancy algorithmsrdquoin Proceedings of the European Conference on Computer Vision(ECCVrsquo 08) pp 208ndash221 2008
[29] H B Mann and D R Whitney ldquoOn a test of whether one oftwo randomvariables is stochastically larger than the otherrdquoTheAnnals of Mathematical Statistics vol 18 no 1 pp 50ndash60 1947
[30] R Fisher Statistical Methods For Research Workers Cosmostudy guides Cosmo Publications 1925
Submit your manuscripts athttpwwwhindawicom
Hindawi Publishing Corporationhttpwwwhindawicom Volume 2014
MathematicsJournal of
Hindawi Publishing Corporationhttpwwwhindawicom Volume 2014
Mathematical Problems in Engineering
Hindawi Publishing Corporationhttpwwwhindawicom
Differential EquationsInternational Journal of
Volume 2014
Applied MathematicsJournal of
Hindawi Publishing Corporationhttpwwwhindawicom Volume 2014
Probability and StatisticsHindawi Publishing Corporationhttpwwwhindawicom Volume 2014
Journal of
Hindawi Publishing Corporationhttpwwwhindawicom Volume 2014
Mathematical PhysicsAdvances in
Complex AnalysisJournal of
Hindawi Publishing Corporationhttpwwwhindawicom Volume 2014
OptimizationJournal of
Hindawi Publishing Corporationhttpwwwhindawicom Volume 2014
CombinatoricsHindawi Publishing Corporationhttpwwwhindawicom Volume 2014
International Journal of
Hindawi Publishing Corporationhttpwwwhindawicom Volume 2014
Operations ResearchAdvances in
Journal of
Hindawi Publishing Corporationhttpwwwhindawicom Volume 2014
Function Spaces
Abstract and Applied AnalysisHindawi Publishing Corporationhttpwwwhindawicom Volume 2014
International Journal of Mathematics and Mathematical Sciences
Hindawi Publishing Corporationhttpwwwhindawicom Volume 2014
The Scientific World JournalHindawi Publishing Corporation httpwwwhindawicom Volume 2014
Hindawi Publishing Corporationhttpwwwhindawicom Volume 2014
Algebra
Discrete Dynamics in Nature and Society
Hindawi Publishing Corporationhttpwwwhindawicom Volume 2014
Hindawi Publishing Corporationhttpwwwhindawicom Volume 2014
Decision SciencesAdvances in
Discrete MathematicsJournal of
Hindawi Publishing Corporationhttpwwwhindawicom
Volume 2014 Hindawi Publishing Corporationhttpwwwhindawicom Volume 2014
Stochastic AnalysisInternational Journal of
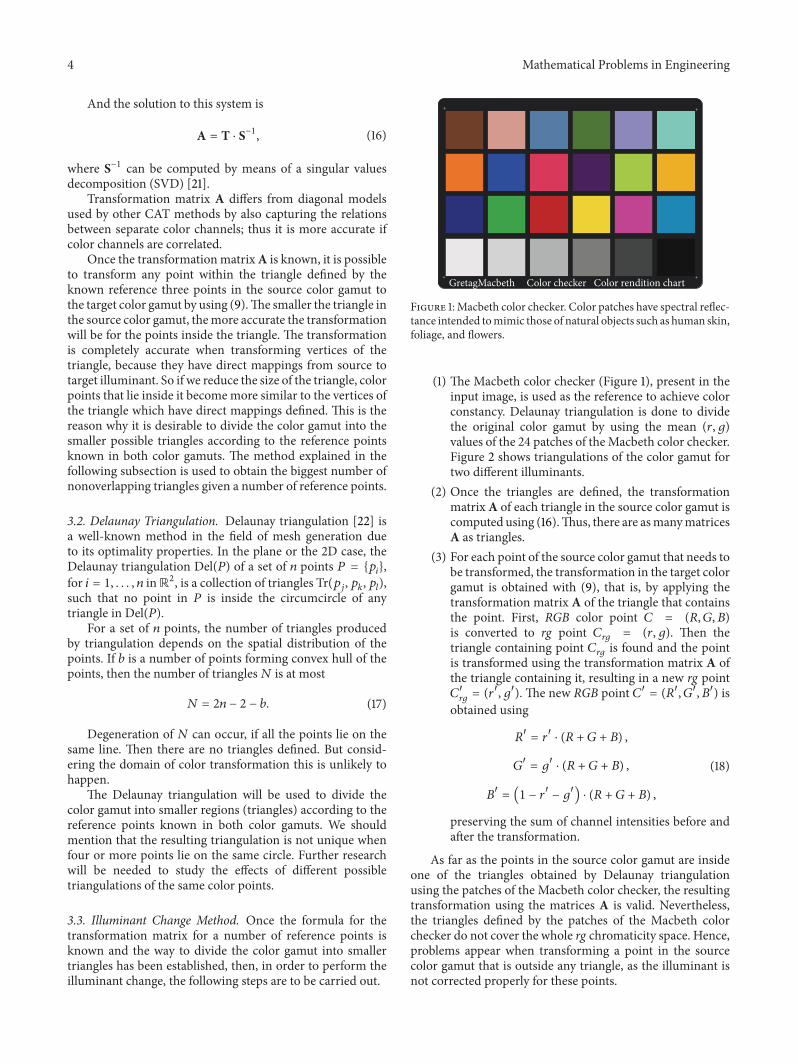
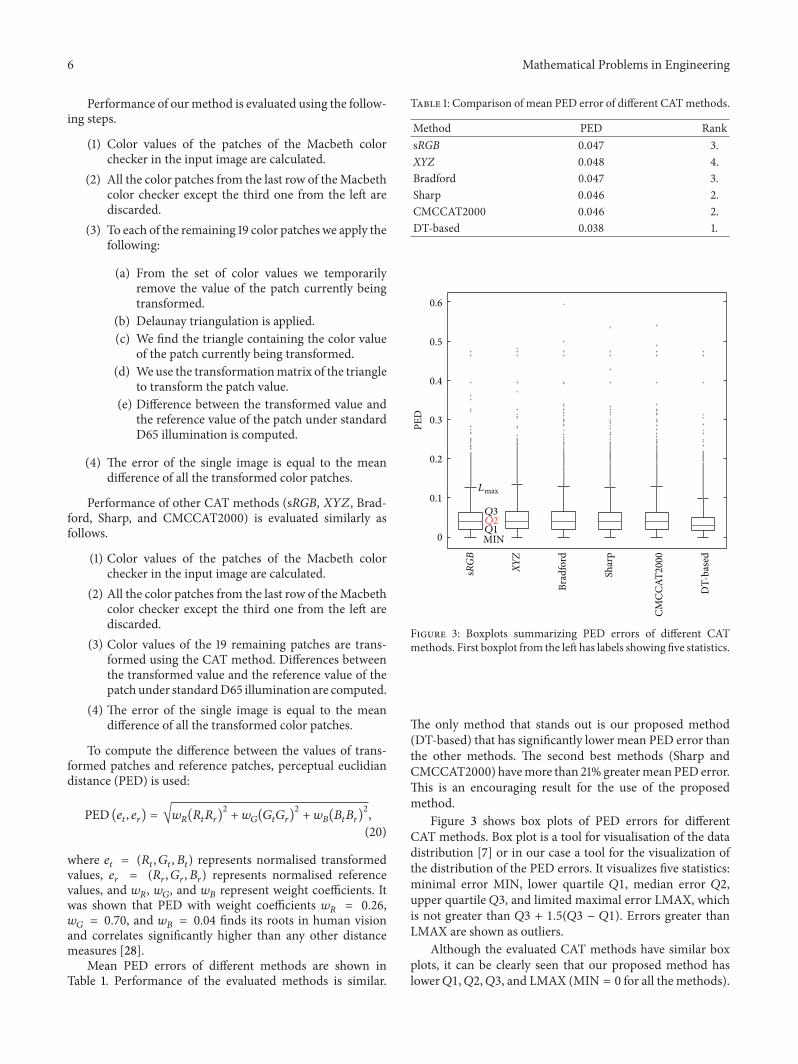
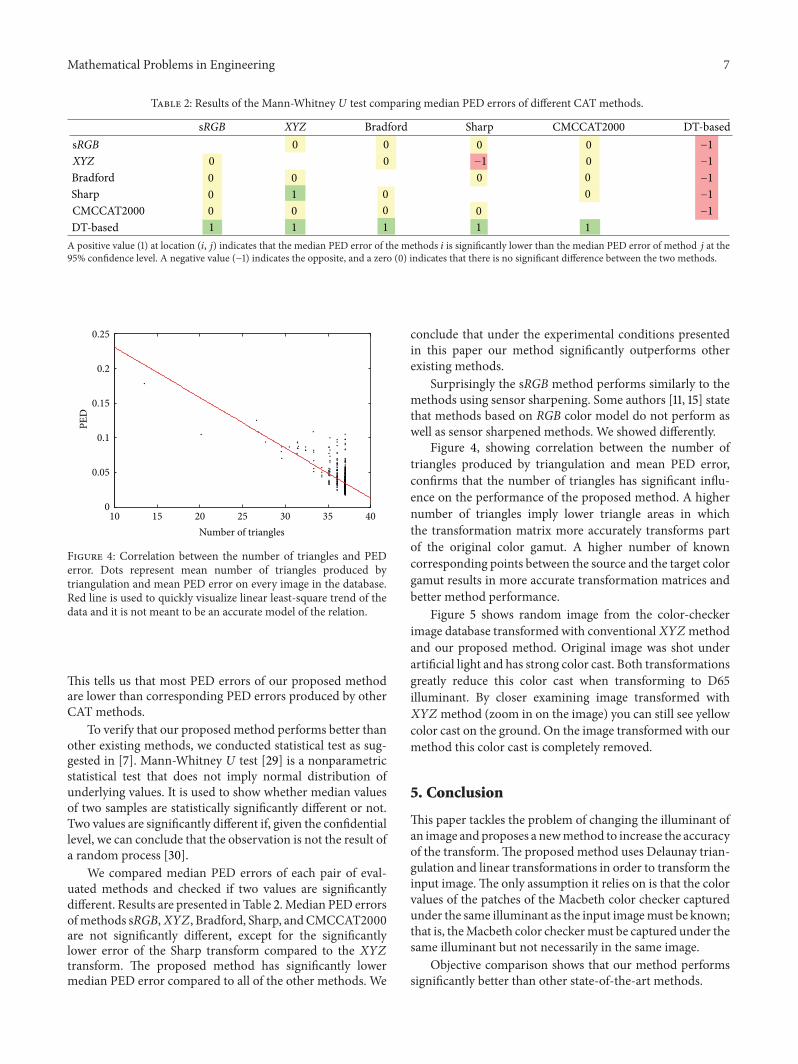
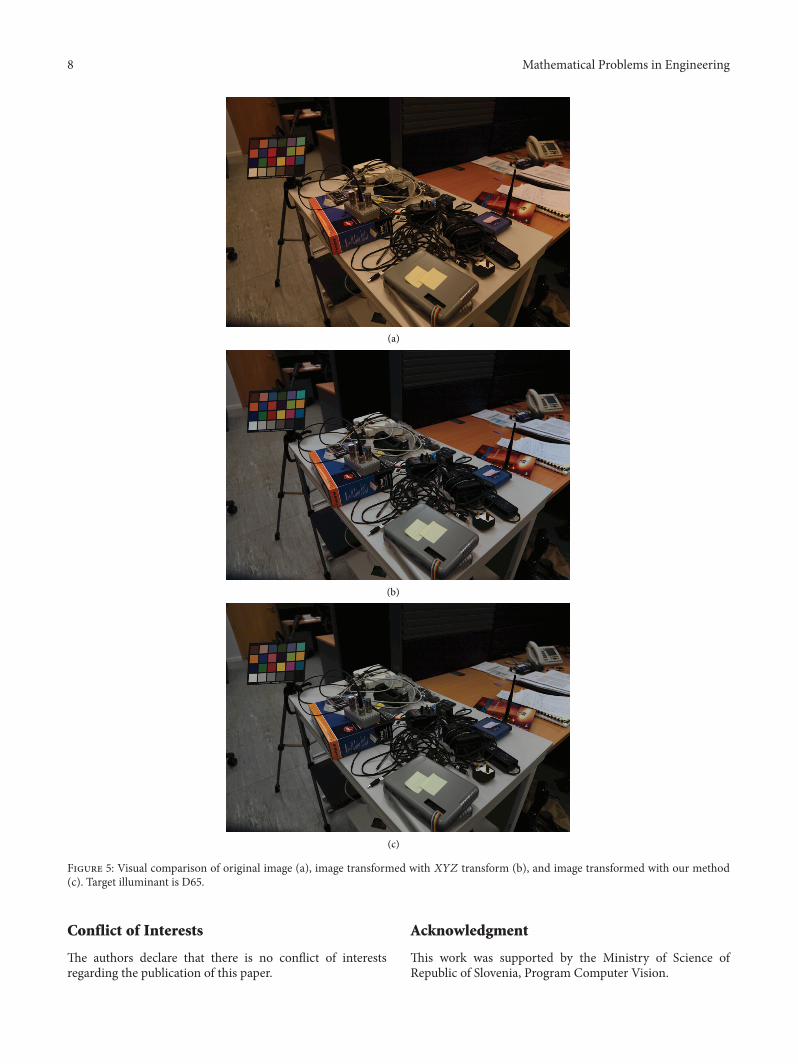