research article nox, soot, and fuel consumption...
TRANSCRIPT

Research ArticleNOx Soot and Fuel Consumption Predictions underTransient Operating Cycle for Common Rail High PowerDensity Diesel Engines
N H Walke1 M R Nandgaonkar2 and N V Marathe1
1The Automotive Research Association of India Pune Maharashtra 411038 India2Department of Mechanical Engineering College of Engineering Pune Pune Maharashtra 411005 India
Correspondence should be addressed to N H Walke walkeedlaraiindiacom
Received 5 December 2015 Revised 21 February 2016 Accepted 28 February 2016
Academic Editor Constantine D Rakopoulos
Copyright copy 2016 N H Walke et al This is an open access article distributed under the Creative Commons Attribution Licensewhich permits unrestricted use distribution and reproduction in any medium provided the original work is properly cited
Diesel engine is presently facing the challenge of controlling NOx and soot emissions on transient cycles to meet stricter emissionnorms and to control emissions during field operations Development of a simulation tool for NOx and soot emissions predictionon transient operating cycles has become the most important objective which can significantly reduce the experimentation timeand cost required for tuning these emissions Hence in this work a 0D comprehensive predictive model has been formulatedwith selection and coupling of appropriate combustion and emissions models to engine cycle models Selected combustion andemissionsmodels are furthermodified to improve their prediction accuracy in the full operating zone Responses of the combustionand emissions models have been validated for load and ldquostart of injectionrdquo changes Model predicted transient fuel consumptionair handling system parameters and NOx and soot emissions are in good agreement with measured data on a turbocharged highpower density common rail engine for the ldquononroad transient cyclerdquo (NRTC) It can be concluded that 0D models can be used forprediction of transient emissions on modern engines How the formulated approach can also be extended to transient emissionsprediction for other applications and fuels is also discussed
1 Introduction
Diesel engine has distinct advantages of better fuel economyhigher torque back-up and high reliability over the otherprime movers For off-road and commercial vehicles mostlydiesel engine is used as the prime mover and it will maintainits dominance for many years to come However theseengines require very complex after-treatment devices to meetstringent emission targets for NOx and soot on transientlegislative cycles as well as on different transient cycles rep-resenting field operations There are differences in NOx andsoot emissions between operation under transient conditionwith speed or load increase and their corresponding steadystate speed-load points [1] Hence to meet transient cycleemissions with low cost after-treatment devices as well asto achieve lower emissions in real operations engines arerequired to be specifically optimised for transient emis-sions For prediction of transient emissions interactions
and responses of different combustion related systems arerequired to be considered hence quasistationary steadystate based models with correction for transient conditionsfail to predict transient emissions [2] Engines optimisedusing steady state emission prediction models may not givelower emissions in transient operating conditions and furtheroptimisations for transient emissions require extensive exper-imentations As such transient soot and NOx predictionmodel will be of great help to reduce experimentation timeand cost Such a prediction tool will also help to achieveoptimumconfiguration whichmay not be otherwise possiblewith only experimentations due to hardware limitationsStudy of pollutants emissions during transient operationwith development of suitable models is the most importantobjective for the future and has received a little attentionso far [3 4] Hence in this work a case study has beentaken to formulate a comprehensive model for NOx and soot
Hindawi Publishing CorporationJournal of CombustionVolume 2016 Article ID 1374768 13 pageshttpdxdoiorg10115520161374768
2 Journal of Combustion
predictions and assessment of themodel prediction results ona transient cycle
While selecting the simulation approach tuning cost andtime become extremely important when a large number ofcycles for complete engine are to be evaluated 3D mod-els demand large amount of computing power and timealso their benefit lowers due to requirement of empiricalcorrelations [5] Hence 0D multizone models are used forthese analyses however themajority of available 0D transientmodels have not included emissions prediction [1] Gen-erally diagnostic models prepared by statistical processingon experimental data are used for analyses of transientemissions Diagnostic combustion model by obtaining ldquorateof heat releaserdquo (RoHR) by statistical parameterization ofWiebersquos function requires change in statistical functionparameters with change in load to predict RoHR [6 7] NOxand soot diagnostic simulationmodels prepared from regres-sion of experimental data [8] or by neural network trainedthermodynamics mimicked model [4] require compensa-tions for transient operations Additionally such a diagnosticmodel will have prediction applicability only for the engineon which that particular empirical model is prepared Empir-ical model also requires large amount of engine test data andregression efforts It is also experienced that the commerciallyavailable software for transient emission analysis requiresextensive efforts for tuning constants to match with theexperimental data throughout the operating zone On thecontrary predictivemodels do not require test data formodelformulation and do not require compensations for transientoperation or for any particular operation zone Hence suchmodels can be used as a design tool however appropriatenessof 0D models as a tool for prediction of transient emissionsof modern engines is required to be assessed
Hence in this work a 0D comprehensive predictivemodel has been formulated with selection and coupling ofappropriate combustion and emissions models to enginecycle models Selected combustion and emissions modelsare further evaluated for their prediction accuracies in thefull operating zone of modern turbocharged high pressurecommon rail engines since modern engines significantlydiffer in power density and fuel injection pressures comparedto the previous generation engines Combustion and sootemission models are modified and model constants aredetermined such that acceptable model prediction accuracyis achieved in the entire operating range with a single set ofconstants
ldquoNonroad transient cyclerdquo (NRTC) applicable for enginesused in agricultural and construction equipment has beenselected for model validation as a case study since this is themost cost sensitive area dependent fully on diesel engines Itis expected that the values identified in the model validationfor most of the constants should be as it is applicable forthe same category of engines (off-road and on-road mediumduty) for analysis of trends Also it is expected that for thesame category of engines due to change in intake exhaustand combustion system configuration values of constantsfor intake system restriction exhaust system restrictionand emission scaling should not be required to be changedsignificantly and for quantitative analysis these constants
Fuel mass consumption model(i) Friction
(ii) Torque equilibrium
Air handling system model(i) Intake system
(ii) Turbocharger(iii) Exhaust system(iv) EGR
Combustion model(i) Compression pressure
(ii) Ignition delay(iii) Gross heat release(iv) Heat loss(v) Combustion pressure
Two-zone model(i) Unburned zone temperature
(ii) Flame temperature(iii) Burned zone temperature
Emissions model(i) NOx model
(ii) Soot model
Denormalised NRTC
(v) Exhaust CO2 and O2
Figure 1 Comprehensive model structure
would require minor adjustments based on few experimentalpoints The constants which would require change in theirvalues are discussed in Section 3
2 Materials and Methodology
21 Model Formulation The formulated comprehensivemodel consists of torque equilibrium friction air handlingcombustion and emissionsmodels Coupling of thesemodelsand submodels used in each of these models are shown in thecomprehensivemodel structure (Figure 1) Fuel consumptionis predicted using torque equilibrium and modified frictionsubmodels Air handling system parameters are predictedusing quasisteady model formulated with a new approachSingle-zone combustion model and two-zone emissionsmodels are used for soot and NOx predictions
211 Fuel Mass Consumption Model Generally fuel con-sumption on a transient cycle is derived from measureddata (eg [8]) However being a predictive tool this modelestimates instantaneous fuel mass consumption from totaltorque required to be produced by the engine with inputof the transient operating cycle This total torque is additionof operating cycle torque demand (120591cycle) frictional torque(120591fr) and torque required for engine acceleration as shown in(1) ldquo120591frrdquo is estimated using modified ldquofriction mean effective
Journal of Combustion 3
pressurerdquo (FMEP) model which is based on FMEP modelin [9] Modified FMEP model uses ldquobrake mean effectivepressurerdquo (BMEP) as one of the model inputs as shown in(3)
fuel =119862IP120587119873(120591cycle + 120591fr + 119866119864 (119889120596119889119905))
30000
(1)
120591fr =FMEP
119898119860pist119903119899cyl
2120587
(2)
FMEP119898= 120572 + 120573
1119898119890120573119891BMEP
+ 120574119906pist (3)
The following are the fuel consumption model constantsderived by experimental investigations
119862IP = 50358 times 10minus5
120572 = 45 times 104
1205731119898= 309 times 10
4
1205731119891= 584 times 10
minus7
120574 = 176 times 104
(4)
212 Air Handling System (AHS) Model AHS parametersare determined as per the flow chart shown in Figure 2 Ina transient operation there will be a time lag in charge airhandling between compressor and turbine This delay is dueto charge air travel through after-cooler connecting pipesand further due to in-cylinder process from IVC to EVOSince considered category of engines has low operating speedrange this lag would not change significantly with changein speed hence this lag is assumed as constant throughoutthe transient cycle Assuming typical air travel path and in-cylinder process lag of 280∘CA (from IVC to EVO) a totallag of 100ms has been considered AHS model is basedon quasisteady cylinder filling and emptying approach Theassumption of quasisteady flow does not usually introduce amajor error if calculation proceeds in a series of very smalltime steps [10] Hence AHS parameters are determined overa very small time step of 10ms Transient cycle speed-torquedemand and fuel mass flow rate data available at 1 s intervalare interpolated and used as inputs to this model
To begin exhaust side calculations ldquoturbine mass flowparameterrdquo (MFPtrb) is calculated using ldquoexhaust manifoldpressurerdquo (119901
119887 trb) from the previous time step ldquoExhaust massflow raterdquo (exh) is calculated with previous time step ldquoairmass flow raterdquo (air) and current time step ldquofuel mass flowraterdquo (fuel) to account for the time lag as described earlierand shown in (5) Turbocharger speed is calculated using(6) considering its angular acceleration in the previous timestep [11 12] ldquo119879
119887 turbrdquo required for ldquoMFPtrbrdquo calculation ispredicted using (8) [13] Considering pressure drop in theexhaust system as a quadratic restriction (see (9)) ldquopressureafter turbinerdquo (119901
119886 trb) is calculated using (10) Turbine mapdata is reversed to calculate ldquoexpansion ratiordquo (ERmap) fromldquoMFPtrbrdquo and corrected turbine speedThis turbine map datais converted to a set of polynomial curve equations to predict
turbine operating parameters [14]With ldquo119901119886 trbrdquo and ldquoERmaprdquo
revised ldquo119901119887 trbrdquo is calculated using (11) Then calculations are
repeated taking this revised ldquo119901119887 trbrdquo as an input till difference
between initial and revised ldquo119901119887 trbrdquo satisfies the convergence
criteria
exh(119894) = air(119894minus1) + fuel(119894) (5)
119873TC(119894) = 119873TC(119894minus1) +119889120596TC(119894minus1)
119889119905
Δ119905 (6)
119889120596TC119889119905
=
120591trb minus 120591cmp
119866TC (7)
119879119887 trb(119894) = 119879im(119894) +
fuel(119894)119876119871119891exh
119888119901exhexh(119894)
(8)
Δ119901exh =2
exh119896es119877exh119879119886 trb119901119886 trb
(9)
Hence
119901119886 trb minus 119901amb =
2
exh119896es119877exh119879119886 trb119901119886 trb
(10)
119901119887 trb = 119901119886 trbERmap (11)
Intake side calculations are initiated taking ldquoairrdquo fromthe previous time step ldquoPressure before compressorrdquo (119901
119887 cmp)is calculated considering ldquopressure drop across air cleanerrdquo(Δ119901ac) as a quadratic restriction (see (12) and (13)) ldquoIntakemanifold pressurerdquo (119901im) is calculated using ldquocorrected engineswept volumerdquo (119881
119904 corr) with the relation shown in (14)assuming that intake manifold pressure is the same as in-cylinder pressure at IVC Then ldquopressure after compressorrdquo(119901119886 cmp) is calculated from ldquo119901imrdquo by adding pressure drop
in the after-cooler (see (16)) With ldquo119901119886 cmprdquo and ldquo119901
119887 cmprdquoldquocompressor pressure ratio by mass flow raterdquo (CRmf ) iscalculated using (17) From the set of compressor mapequations ldquocompressor pressure ratio from maprdquo (CRmap)is calculated for the corresponding corrected mass flowparameter and corrected compressor speed Calculationsare repeated by adjusting ldquoairrdquo till the difference betweenldquoCRmfrdquo and ldquoCRmaprdquo satisfies the convergence criteria ldquoEGRmass flow raterdquo (egr) is determined using the expression forchoked flow through a restriction [8] as shown in (18) Thecontrolling ldquoEGR valve opening areardquo (119860egr) is taken as thelower area from ldquo119860egr1rdquo and ldquo119860egr2rdquo calculated by (19) and(20) respectively
119901119887 cmp = 119901amb minus Δ119901ac (12)
Δ119901ac =2
air119896ac119877air119879amb119901amb
(13)
119901im =air119877air119879im119881119904 corr
(14)
119881119904 corr = 119881119904120578V (1 minus 119903) (15)
4 Journal of Combustion
Yes
Yes
No
No
Yes
No
Yes
No
Calculate the following Turbocharger speed and corrected turbine speed Exhaust manifold temperatureTurbine mass flow parameter
Pressure drop across muffler
Calculate the following Air cleaner restrictionPressure before compressorManifold pressurePressure after compressor
Mass flow parameterCompressor corrected speedPressure ratio from compressor
EGR ratio within convergence limit
Revise EGR ratio
Next time stepEnd of cycle
End
Calculate EGR ratio
convergence limit
Calculatethe following Compressor and turbine torque Equivalence ratio
Initial inputs or from previous time step
Turbine and compressor torqueTurbocharger speedEGR ratio
Current step cycle demand
convergence limit
Current time fuel mass injected Pressure before turbine (pb_trb)
Pressure ratio by mass flow (PRmf)
pb_trb)Pressure after turbine and pressure before turbine (
Expansion ratio from turbine map (ERmap)
Air mass flow rate (mair)
air mass flow rate (mair)
pb_trb within
mair within Revise mair
Revise pb_trb
(mfuel)
Figure 2 AHS model for transient cycle
119901119886 cmp = 119901im + Δ119901int (16)
PRmf =119901119886 cmp
119901119887 cmp
(17)
egr = 119888119889 egr119860egr119901em
radic119879em119877exh119891(
119901im119901em
120574exh) (18)
119860egr1 =1205871198632
egr
4
(19)
119860egr2 = 120587119863egrℎegr (20)
(
119901im119901em
120574exh)
= radic2120574exh120574exh minus 1
((
119901im119901em
)
2120574exh
minus (
119901im119901em
)
(120574exh+1)120574exh
)
If119901im119901em
ge 120585
(21)
Journal of Combustion 5
119891(
119901im119901em
120574exh) = radic120574exh (2
120574exh + 1)
120574exh+1120574exhminus1
If119901im119901em
lt 120585
(22)
120585 = (
2
120574exh + 1)
120574exh120574exhminus1
(23)
Based on the experimental investigations values used forthemodel constants are ldquo119891exhrdquo = 03 ldquo119896esrdquo = 12times 106mminus4 andldquo119896acrdquo = 67 times 105mminus4
Compressor operating efficiency is determined fromcorrected mass flow parameter and corrected compressorspeed using the set of equations representing compressorefficiencymap Similarly turbine operating efficiency is deter-mined from expansion ratio and corrected turbine speedand from the set of turbine efficiency map equations Fromthis data compressor torque turbine torque and turbochargeracceleration are calculated to be used for the next time step
213 Combustion Model Combustion and emission param-eters are calculated at the interval of 01∘CA from IVC toEVO for the operating cycle at one-second time intervalCombustion model starts from prediction of compressionpressure considering a polytropic compression process fromIVC to SOC Hardenburg and Hase correlation as referredby Lakshminarayan and Aghav [15] as well as correlationproposed by Jung and Assanis [16] have been considered forprediction of the ldquopolytropic indexrdquo (119899) of the compressionprocess After investigations with experimental results ithas been observed that predictions by Jung correlation (24)are closer to the measured data However it has also beenobserved that the predicted compression pressure matchesthe experimental data only at one speed Hence to improvethemodel prediction accuracy at other operating speeds Jungcorrelation model is modified by introducing ldquoengine speedrdquo(119873) dependent correction as shown in (25)
119899 = 1338 minus 6 times 10minus5119879cyl + 1 times 10
minus8119879cyl2 (24)
119899 = 14 minus
60
119873
minus 6 times 10minus5119879cyl + 1 times 10
minus8119879cyl2 (25)
For prediction of ldquoignition delayrdquo (120591id) Arrhenius equa-tion with model constants proposed by Wolfer as per Hey-wood [17] and with model constants suggested by Watsonas per Arsie et al [18] and correlation proposed by Hard-enberg and Hase [19ndash21] have been considered On furtherinvestigations with experimental data Hardenberg and Hasecorrelation (26) is selected formodel formulation To accountfor change in cylinder pressure and temperature during theignition delay period time at which combustion starts is
determined by integrating the reciprocals of instantaneousestimates of ldquo120591idrdquo [22] as given in (27)
120591id = (036 + 022119906pist)
sdot Exp[119864119860(
1
119879cylminus
1
17190
)(
212
119901cyl minus 124)
063
]
(26)
int
119905SOC
119905SOI
(
1
120591id) = 1 (27)
For gross heat release (119876119892) predictions Watson model
[9 17 23] as well as Mixing Controlled Combustion (MCC)model [24] has been considered In the investigations ithas been observed that prediction by Watson model iscloser to the experimental data However it has been alsoobserved that themodel predicts cylinder pressure with goodaccuracies only in narrow band of operating loads and itneedsmodifications to improve prediction accuracies at otherloads In the Watson model fuel burn rate is estimated by(28) which is a weighted addition of premixed and diffusioncombustion As shown in (29) the ldquocombustion weightfactorrdquo (120573) varies only with ldquoequivalence ratiordquo (120593) and ldquo120591idrdquohowever there is no consideration for change in ldquodurationof injectionrdquo (119863inj) which varies significantly from full loadto low load Hence the model constant ldquo119887rdquo is converted toa variable dependent on ldquo119863injrdquo as shown in (30) This isbased on the detailed investigations done and explained bythe authors in [25]
119898119891119887(1199051015840)
119898119891119900
= 1205731198911+ (1 minus 120573) 119891
2 (28)
120573 = 1 minus
119886120601119887
120591119888
id (29)
119887 = 095 minus 007119863inj (30)
Watson model constants ldquo119886rdquo and ldquo119888rdquo in (29) are taken as054 and 05 respectively For prediction of heat loss corre-lation proposed by Annand (see (31)) [9 26] is consideredfor model formulation as it considers radiation heat loss inaddition to the convective heat loss
119889119876ht119889120579
= 119860pist [1198861119896119892
119863pistRe1198871 (119879cyl minus 119879119908) + 1198881 (119879
4
cyl minus 1198794
119908)]
sdot (
1
6119873
)
(31)
Annand model parameters in (31) ldquo1198861rdquo ldquo1198871rdquo and ldquo119888
1rdquo
are taken as 05 065 and 3120590 respectively [9] It is a well-known fact that update of cylinder wall temperature isnotably delayed compared with changes in fuelling Thisled many researchers to assume constant wall temperaturethroughout the transient event In the study of a numberof simplifications on a medium duty engine it was shown
6 Journal of Combustion
that assumption of constant wall temperature is justified[9] Claes Ericson et al [8] have also used fixed value ofwall temperature while modelling diesel engine combustionand NOx formation With the same simplified approachldquocylinder wall temperaturerdquo (119879
119908) is taken as 523K constant
throughout the transient cycle
214 Two-Zone and Emissions Models Single-zone modelsare simple for calculations however they cannot predictspatial temperature differences [27] Hence two-zone modelhas been used to calculate burned and unburned zonetemperatures Adiabatic flame temperature is calculated byenthalpy balance assuming perfectly burned gas mixture andflame temperatures are calculated considering radiation loss[13] Thermal NO is predicted at burned zone temperaturesusing basic Zeldovich mechanism which considers tworeactions as given in (32) and (33) [28] As 0Dmodel emissionoutputs are required to be corrected to get the predictionvalues the ldquomodel output NOxrdquo (NOxmodel) is corrected by(34) to get ldquoengine-out NOx predictionrdquo (NOxpredicted)
O + N2
K1larrrarr NO + N (32)
N +O2
K2larrrarr NO +O (33)
NOxpredicted = NOxmodel + 119862NOx (34)
where 119862NOx used is 45 times 10minus6 kgsHiroyasu model is considered for soot modelling upon
investigations of selected soot prediction models [9 16 1829] Hiroyasu sootmodel consists of twoArrhenius equationsfor soot formation and oxidation rates as shown in (35)and (36) respectivelyThe difference between soot formationand oxidation rates gives net soot (see (37)) It has beenobserved that the selected model predicts soot with goodaccuracy only in a very narrow speed-load range Henceto improve prediction accuracy throughout the operatingspeed-load range model constant for soot formation ldquo119860
119891rdquo is
modified as a function of speed [18] ldquo119860119891rdquo is calculated by
(38) based on analysis of experimental data The soot modeloutput (Sootmodel) is corrected by (39) to get ldquoengine-out sootpredictionrdquo (Sootpredicted)
119889119898sf119889119905
= 119860119891119898fuel119901cyl
05 exp(minus119864119891
RTcyl) (35)
119889119898so119889119905
= 119860119900119898sn1198841199002119901cyl
18 exp(minus119864119900
RTcyl) (36)
119889119898sn119889119905
=
119889119898sf119889119905
minus
119889119898so119889119905
(37)
119860119891= 188119890
194times10minus4119873 (38)
Sootpredicted = 119898soot sdot Sootmodel + 119862soot (39)
Activation energies 119864119891and 119864
119900are taken as 82000 Jmol
and 120000 Jmol respectively [30] ldquo119860119900rdquo ldquo119898sootrdquo and ldquo119862sootrdquo
are taken as 1000 28 and 40 times 10minus8 kgs respectively
Inputs
Fuel consumptionSubmodelsCylinder pressureTwo zone temperatures NOxSoot
OutputsCylinder pressureBulk temperatureFlame temperatureBurned zone temperatureNOx emissionsSoot emissions
Manifold pressureEGR ratio
Transient cycleBore stroke 120582 and CRManifold temperatureVolumetric efficiencyIVC EVOSOI DOI (ECU map)
Exhaust CO2 O2
Figure 3 Combustion two-zone and emission models inputsubmodels and output details
CO2concentration is calculated using equation for com-
plete combustion since small concentration of species gener-ated due to incomplete combustion does not have significanteffect on CO
2concentration Equation (40) considers the
number of moles of the hydrocarbon fuel (119899) relative air-fuel ratio (120582) and EGR ratio (119903) while calculating elementalbalance between reactants and products [17] CO
2mole
fraction is calculated by taking ratio of number of CO2moles
to the total number of moles of all combustion products
119899119862119886119867119887+ 119899120582(119886 +
119887
4
) (O2+ 3773N
2)
+ 119899119903 (
119886
(1 minus 119903)
CO2+
119887
2 (1 minus 119903)
H2O
+
3773120582
(1 minus 119903)
(119886 +
119887
4
)N2+
(120582 minus 1)
(1 minus 119903)
(119886 +
119887
4
)O2)
=
119899119886
(1 minus 119903)
CO2+
119899119887
2 (1 minus 119903)
H2O + 3773119899120582
(1 minus 119903)
(119886
+
119887
4
)N2+
119899 (120582 minus 1)
(1 minus 119903)
(119886 +
119887
4
)O2
(40)
Input data submodels used and outputs of the com-bustion and emissions models are shown in Figure 3 Otherdetails of emissions prediction models are explained bythe authors in [31] Experimental values of intake manifoldtemperatures (119879im) are taken as input to the model sincethese temperatures are highly dependent on intercooler andEGR cooler packaging Input data of ldquoSOIrdquo and ldquo119863injrdquo arecalculated by interpolation of ECU map for ldquoSOIrdquo andldquoEnergizing Timerdquo (ET) respectively ldquoSOIrdquo values takenfrom ECU map are corrected by adding 035ms to accountfor lag between ldquoETrdquo and ldquoSOIrdquo [32] EGR valve lift data istaken from EGR valve lift ECU map
22 Experimental Setup Specifications of the engine selectedfor model validation are shown in Table 1 The selected highpower density high fuel injection pressure engine representsthe modern and futuristic engines for agriculture and con-struction equipment applications The test cell equipmentinstrumentation and the data acquisition system used formeasurements are listed in Table 2 Engine dynamometer
Journal of Combustion 7
Table 1 Specifications of the experimentation engine
Engine type DI diesel engineAspiration Turbocharged after-cooledBore times stroke 95 times 110mmCompression ratio 180Fuel injection system Common railEGR High pressureApplication Off-road
Table 2 Test cell instrumentation
Instrument DetailsDynamometer AVL APA 120 dynamometerAir flow meter Sensyflow hot-film mass flow meterFuel consumption meter FEV Coriolis fuel mass flow meterHigh-speed data acquisition AVL IndiComCylinder pressure sensor AVL GH12D PiezoelectricNOx measurement AVL i60 emission systemSmoke measurement AVL 439 Opacimeter
measuring equipment instrumentation and data acquisitionare suitable to run and acquire experimental data under atransient operating cycle
3 Model Validation and Discussions
31 Combustion Model Response For emissions predictionon transient cycle the emissionmodel should have capabilityto predict correct emission trends over load and start ofinjection (SOI) changes Hence before validation of thecomprehensive model on NRTC combustion and emissionsmodels are checked for their responses to load and SOIchanges
Full loads 75 and 50 loads at maximum powerspeed (2000 rpm) and maximum torque speed (1300 rpm)are selected for the load response check Figure 4 showscomparisons of predicted andmeasured cylinder pressures atthese selected speed-load points It can be seen that at all thepoints compression pressures and SOC are predicted withgood accuracies Predicted combustion pressure and pressureduring expansion stroke are also closely matching with themeasured curves for all the speed-load pointsThis shows thatformulated model with modifications can predict cylinderpressure in the complete speed-load range
Comparisons of predicted andmeasured engine-outNOxtrends over the selected load changes are shown in Figure 5The formulated model is able to predict the NOx emissionstrends at both speeds Relative errors (RE) of NOx predictionwith respect to themeasured NOx values are within minus171 to18which is considered as a goodNOx emissions prediction
Similarly comparison of predicted and measured soottrends is also shown in Figure 5 Soot model is also ableto predict the soot emission trends at both speeds RE ofpredicted soot from the measured values are from minus225 to463 At full loads the relative errors are in the range of 20and at part loads they aremore than 20 however deviations
in the absolute values are not significant since soot values arevery low at part loads
To assess model response to change in SOI NOx and sootemissions are predicted with change in SOI from 10∘bTDCto 6∘bTDC Figure 6 shows that predicted mass emissionstrends are fairly matching with the measured results RE ofpredicted NOx from the measured values are from 103to 1803 whereas RE of predicted soot from the measuredvalues are from minus181 to 159 This shows that formulatedmodel is capable of predicting NOx and soot emissions withchanges in SOI
32 Predictions on the Transient Cycle NRTC is consideredas one of the most stringent transient cycles since it hashigher speed-load variations compared to the other legislativetransient cycles as can be seen from the denormalised NRTCfor the experimentation engine (Figure 7) This formulatedmodel has been built inC++The average simulation run timefor the entire NRTC is 610 s Comparison of model predictedresults with measured values on the experimental engine isshown for the first 800 s of the denormalised NRTC
321 Transient Fuel Consumption Figure 8 shows compari-son of predicted ldquofuel mass injectedrdquo with the same outputacquired from engine ECU It can be seen that transientfuel consumption predicted by the model is closely matchingwith the ECU output From this comparison it can beconcluded that the formulated fuel mass flow model predictsfuel consumption under transient operations with very goodaccuracy
Though the fuel consumption model is validated onNRTC it is expected that this model would be able to predictfuel consumption over any transient cycle for this category ofoff-road engines as well as for on-road commercial engineswithout much change in model constants It is also expectedthat prediction of transient fuel consumption with change intype of fuel can be done by tuning value of the ldquofuel massmodel constantrdquo (119862IP) in (1)
322 Transient Air Handling Parameters Comparison ofmodel predicted and measured air mass flow rate over thetransient cycle is shown in Figure 9 It can be seen that modelpredicted air mass flow rate curve is in agreement with thecurve of measured data This shows that formulated AHSmodel is able to capture responses of all related subsystemsin air handling Figure 10 shows comparisons of intake sidepressures with the measured data Curve of model predictedpressure after compressor (gauge) is in agreement with themeasured data and it can be concluded that the predictionmodel is able to properly capture the compressor characteris-tics Intake depression curves of the predicted and measuredvalues are in agreement This shows that response of aircleaner pressure drop is properly captured by the model
Comparisons of predicted and measured exhaust sidepressures are shown in Figure 11 Predicted pressure beforeturbine (gauge) and exhaust back pressure curves of thepredicted results are closelymatching with themeasured datacurvesHence it can be concluded that turbine characteristics
8 Journal of Combustion
MeasuredPredicted
0
20
40
60
80
100
120
140
Cylin
der p
ress
ure (
Pa)times
10minus5
300 350 400 450 500250Crank angle (deg)
1300 069MPa BMEP (50)
MeasuredPredicted
0
20
40
60
80
100
120
140
Cylin
der p
ress
ure (
Pa)times
10minus5
300 350 400 450 500250Crank angle (deg)
1300 139MPa BMEP (100)
MeasuredPredicted
0
20
40
60
80
100
120
140
Cylin
der p
ress
ure (
Pa)times
10minus5
300 350 400 450 500250Crank angle (deg)
2000 080MPa BMEP (75)
MeasuredPredicted
0
20
40
60
80
100
120
140
Cylin
der p
ress
ure (
Pa)times
10minus5
300 350 400 450 500250Crank angle (deg)
1300 103MPa BMEP (75)
MeasuredPredicted
0
20
40
60
80
100
120
140
Cylin
der p
ress
ure (
Pa)times
10minus5
300 350 400 450 500250Crank angle (deg)
2000 rpm053MPa BMEP (50)
MeasuredPredicted
0
20
40
60
80
100
120
140Cy
linde
r pre
ssur
e (Pa
)times10
minus5
300 350 400 450 500250Crank angle (deg)
200 106MPa BMEP (100)rpm rpm
rpm
rpmrpm
Figure 4 Comparisons of predicted and measured cylinder pressures at maximum power and maximum torque speeds
and exhaust system pressure drop are properly captured bythe prediction model
Figure 12 shows comparison of model predicted andmeasured EGR ratios Though trends of predicted and mea-sured values are matching amplitudes of peaks and valleysare more in case of predicted EGR ratio curve compared
to experimental curve This could be due to averaging ofinstantaneous EGR mass flow rates in case of experimentalresults due to volumes in the EGR pipes
In this model value of the ldquoair cleaner restriction con-stantrdquo (119896ac) is selected for dry type air cleaner which iscommonly used on these category engines Also value of
Journal of Combustion 9
00
02
04
06
08
10
Soot
(mg
s)
02 04 06 08 10 12 1400BMEP (MPa)
Predicted (1300 rpm)Measured (1300 rpm)
Predicted (2000 rpm)Measured (2000 rpm)
0
20
40
60
80
100N
Ox
(mg
s)
02 04 06 08 10 12 1400BMEP (MPa)
Predicted (1300 rpm)Measured (1300 rpm)
Predicted (2000 rpm)Measured (2000 rpm)
Figure 5 Comparisons of predicted NOx and soot trends with measured results at maximum power and maximum torque speeds
Predicted NOxMeasured NOx
Predicted sootMeasured soot
06
08
10
12
14
16
18
20
Soot
(mg
s)
0
10
20
30
40
50
60
70
NO
x (m
gs)
7 8 9 106SOI (∘CA bTDC)
Figure 6 Comparisons of predicted NOx and soot mass emissionswith measured results over SOI variations
SpeedTorque
Torq
ue (N
m)
100 200 300 400 500 600 700 8000Time (s)
0
100
200
300
400
0500
1000150020002500
Spee
d (r
pm)
Figure 7 Denormalised NRTC for the experimentation engine(initial 800 s)
Fuel
inje
cted
(mg
strok
e)
PredictedMeasured
0
20
40
60
80
100 200 300 400 500 600 700 8000Time (s)
Figure 8 Comparison of predicted and ECU output of fuel massinjected
Air
mas
s flow
rate
(gs
)
PredictedMeasured
0
20
40
60
80
100 200 300 400 500 600 700 8000Time (s)
Figure 9 Comparison of predicted and measured air mass flowrates
ldquoexhaust system restriction constantrdquo (119896es) is selected forexhaust system with silencer and DOC Change in the ldquo119896esrdquovalue (see (9)) will be required if there is addition of exhaustafter-treatment devices With this change it is expectedthat the formulated model would be able to predict AHSparameters over any transient cycle for this category ofengines as well as for on-road commercial engines It isexpected that with change in ldquo119891exhrdquo value (see (8)) themodelwould be able to predict AHS parameters with different fuels
10 Journal of Combustion
Pressure after compressor (gauge)
Inta
ke d
epre
ssio
n (k
Pa)
Intake depression
PredictedMeasured
PredictedMeasured
0
50
100
150
Pres
sure
after
co
mpr
esso
r (kP
a) g
auge
0
1
2
3
100 200 300 400 500 600 700 8000Time (s)
100 200 300 400 500 600 700 8000Time (s)
Figure 10 Comparisons of intake side predicted and measuredpressures
PredictedMeasured
PredictedMeasured
Pressure before turbine (gauge)
Exha
ust b
ack
pres
sure
(kPa
)
Exhaust back pressure
02468
1012
100 200 300 400 500 600 700 8000Time (s)
100 200 300 400 500 600 700 8000Time (s)
0255075
100125150
Pres
sure
bef
ore
turb
ine (
kPa)
gau
ge
Figure 11 Comparisons of exhaust side predicted and measuredpressures
323 NOx and Soot Emissions Figure 13 shows comparisonof predictedNOxwithmeasurement results Trend of the pre-dicted NOx emissions is matching with the measurementshowever there are differences in the amplitudes ofNOxpeakswhich could be due to peaks in the predictedEGR ratios taken
PredictedMeasured
00
02
04
06
EGR
ratio
(mdash)
100 200 300 400 500 600 700 8000Time (s)
Figure 12 Comparisons of predicted and measured EGR ratios
PredictedMeasured
0
20
40
60
80
NO
x (m
gs)
100 200 300 400 500 600 700 8000Time (s)
Figure 13 Comparison of measured and predicted NOx
PredictedMeasured
100 200 300 400 500 600 700 8000Time (s)
000510152025
Soot
(mg
s)
Figure 14 Comparison of measured and predicted soot
as inputs to this prediction To assess model prediction accu-racy accumulatedNOxmass emissions over the entireNRTC(1200 s) have been evaluated Model predicted accumulatedNOx is 221 times 10minus2 kg as against measured accumulated NOxof 191 times 10minus2 kg The relative error (RE) of the predictedNOx with respect to the measured result is 158 Fromemission trends and the RE in accumulated values it can beconcluded that the formulated model can predict transientNOx emissions with acceptable accuracy
Figure 14 shows comparison of measured and predictedsoot emissions Soot emissions trend predicted by the modelis matching with the experimental values except at very highsoot peaks Accumulatedmodel predicted soot over the entireNRTC (1200 s) is 280 times 10minus4 kg as against accumulatedmeasured soot of 331 times 10minus4 kg The relative error of thepredicted soot with respect to the measurement is minus154
Journal of Combustion 11
PredictedMeasured
048
1216
CO2
()
100 200 300 400 500 600 700 8000Time (s)
Figure 15 Comparison of measured and predicted CO2concentra-
tion
Hence it can also be concluded that the formulated modelpredicts transient soot emissions with reasonable accuracy
Figure 15 shows comparison of predicted and measuredCO2concentration It can be seen that the predicted transient
CO2concentration values are closely matching with mea-
sured transient CO2concentrations Predicted CO
2curve is
closely matching with the curve of measured valuesThe above results show that the comprehensive model
has potential to predict NOx and soot emissions on transientcycle The formulated transient emission model is validatedon NRTC however it is expected that with minor tuningin emission correction parameters in (34) and (39) theformulated model would be able to predict emissions overany transient cycle for this category of engines as well asfor on-road commercial engines Additionally minor tuningof parameters in (30) would be required for NOx and sootpredictions with different fuels
4 Summary and Conclusions
A comprehensive zero-dimensional predictive model hasbeen formulated for soot and NOx emissions predictionunder transient operating cycle Responses of combustionand emissions models have been validated for load andSOI changes and prediction results of the comprehensivemodel have been validated using a turbocharged commonrail engine on NRTC The formulated model has predictedtransient fuel consumption air handling system parametersand soot and NOx emissions with good accuracies
It can be concluded that 0D models can be used forprediction of transient emissions on modern engines toreduce time and cost of experimentationsThough the modelhas been validated on a diesel engine for NRTC it can beextended for other applications and fuelsWithmodificationsin submodels more prediction parameters can be added tothe model to make it an effective design tool
Nomenclature
119860pist Area of piston m2119862119889 egr EGR valve discharge coefficient119862119901exh Exhaust gas specific heat J kg
minus1 Kminus1119863egr EGR valve diameter m119863pist Piston diameter m
1198911 Premixed burning fraction
1198912 Diffusion burning fraction
119866119864 Engine mass moment of inertia kgm2
119866TC Turbocharger mass moment of inertiakgm2
ℎegr EGR valve lift m119896119892 Gas thermal conductivity Wmminus1 Kminus1
Mass flow rate kg sminus1119898119891119887 Cumulative fuel burned kg
119898119891119900 Fuel injected per cycle kg
119898sf 119898sn119898so Mass of soot kg119873TC Turbocharger speed sminus1119899cyl Number of cylinders119901amb Ambient pressure Pa119901cyl Cylinder pressure Pa119876ht Heat loss J119876119892 Gross heat release J
119876119871 Fuel lower calorific value J kgminus1
119903 Engine crank radius (m) EGR ratio (mdash)119879amb Ambient temperature K119879cyl Cylinder gas bulk temperature K∘CA Degree crank angle120572 1205731119898 120573119891 120574 FMEP model constants
120590 Stefan-Boltzmann constant 567 times10minus8Wmminus2 Kminus4
119906pist Mean piston speed m sminus1120591 Torque Nm120591cmp Compressor torque Nm120591trb Turbine torque NmΔ Difference120596 Engine angular speed rad sminus1
120596TC Turbocharger angular speed rad sminus1120582 Relative air-fuel ratiobTDC Before top dead centreDOC Diesel oxidation catalystECU Electronic control unitEGR Exhaust gas recirculationEVO Exhaust valve opening ∘CAIVC Intake valve closure ∘CAMCC Mixing Controlled CombustionNOxmodel NOx predicted by model kg sminus1
NOxpredicted Predicted engine-out NOx kg sminus1SOC Start of combustion ∘CASootmodel Soot predicted by model kg sminus1
Sootpredicted Predicted engine-out soot kg sminus1
Competing Interests
The authors declare that they have no competing interests
Acknowledgments
The authors thank the laboratory staff of Powertrain Engi-neering Department The Automotive Research Association
12 Journal of Combustion
of India for their help in this work The authors also thankthe Director of ARAI for her valuable support
References
[1] C D Rakopoulos A M Dimaratos E G Giakoumis and DC Rakopoulos ldquoExhaust emissions estimation during transientturbocharged diesel engine operation using a two-zone com-bustion modelrdquo International Journal of Vehicle Design vol 49no 1ndash3 pp 125ndash149 2009
[2] C Ericson B Westerberg and R Egnell ldquoTransient emissionpredictions with quasi stationary modelsrdquo SAE Technical Paper2005-01-3852 2005
[3] C D Rakopoulos and E G Giakoumis ldquoReview of thermo-dynamic diesel engine simulations under transient operatingconditionsrdquo SAE Paper 2006-01-0884 SAE International 2006
[4] K Nikzadfar and A H Shamekhi ldquoAn extended mean valuemodel (EMVM) for control-orientedmodeling of diesel enginestransient performance and emissionsrdquo Fuel vol 154 pp 275ndash292 2015
[5] K Ebrahimi M Bazargan and S A Jazayeri ldquoA new phe-nomenological model for combustion and performance studiesof direct injection diesel enginesrdquo SAE Paper 2007-01-1904 SAEInternational 2007
[6] J R Serrano F J Arnau VDolz and P Piqueras ldquoMethodologyfor characterisation and simulation of turbocharged dieselengines combustion during transient operation Part 1 dataacquisition and post-processingrdquo AppliedThermal Engineeringvol 29 no 1 pp 142ndash149 2009
[7] J R Serrano H Climent C Guardiola and P PiquerasldquoMethodology for characterisation and simulation of tur-bocharged diesel engines combustion during transient oper-ation part 2 phenomenological combustion simulationrdquoApplied Thermal Engineering vol 29 no 1 pp 150ndash158 2009
[8] C Ericson B Westerberg M Andersson and R EgnellldquoModelling diesel engine combustion and NO
119909formation for
model based control and simulation of engine and exhaustaftertreatment systemsrdquo SAE Technical Paper 2006-01-06872006
[9] C D Rakopoulos and E G GiakoumisDiesel Engine TransientOperation Springer London UK 2009
[10] N Watson and M S Janota Turbocharging the Internal Com-bustion Engine Macmillan Publishers London UK 1982
[11] C Rakopoulos E Giakoumis D Hountalas and D Rakopou-los ldquoThe effect of various dynamic thermodynamic and designparameters on the performance of a turbocharged diesel engineoperating under transient load conditionsrdquo SAE TechnicalPaper 2004-01-0926 2004
[12] M Jung R G Ford K Glover N Collings U Christen andM J Watts ldquoParameterization and transient validation of avariable geometry turbocharger for mean-value modelling atlow and medium speed-load pointsrdquo SAE Paper 2002-01-2729SAE International 2002
[13] C Ericson NO119909modelling of a complete diesel engineSCR
system [Licentiate thesis] Lund University Lund Sweden 2007[14] A Gambarotta G Lucchetti and I Vaja ldquoReal-time modelling
of transient operation of turbocharged diesel enginesrdquo Proceed-ings of the Institution of Mechanical Engineers Part D Journal ofAutomobile Engineering vol 225 no 9 pp 1186ndash1203 2011
[15] P A Lakshminarayanan and Y V Aghav Modelling DieselCombustion Springer Amsterdam The Netherlands 2010
[16] D Jung andD N Assanis ldquoMulti-zone DI diesel spray combus-tion model for cycle simulation studies of engine performanceand emissionsrdquo SAE Paper 2001-011246 SAE International2001
[17] J B Heywood Internal Combustion Engine FundamentalsMcGraw-Hill 1988
[18] I Arsie F Di Genova C Pianese et al ldquoDevelopment andidentification of phenomenological models for combustion andemissions of common-rail multi-jet diesel enginesrdquo SAE Paper2004-01-1877 SAE International 2004
[19] H Hardenberg and F Hase ldquoAn empirical formula for comput-ing the pressure rise delay of a fuel from its cetane number andfrom the relevant parameters of direct-injection diesel enginesrdquoSAE Technical Paper 790493 1979
[20] P Kirchen and K Boulouchos ldquoDevelopment and validation ofa phenomenological mean value soot model for common-raildiesel enginesrdquo SAE Technical Paper 2009-01-1277 2009
[21] C V N Abbe R Nzengwa R Danwe Z M Ayissi and MObonou ldquoA study on the 0Dphenomenologicalmodel for dieselengine simulation application to combustion of neem methylesther biodieselrdquo Energy Conversion and Management vol 89pp 568ndash576 2015
[22] G Stiesch andGMerker ldquoA phenomenologicalmodel for accu-rate and time efficient prediction of heat release and exhaustemissions in direct-injection diesel enginesrdquo SAE TechnicalPaper 1999-01-1535 1999
[23] P Casolia A Gambarotta N Pompini U Caiazzo E Lan-franco and A Palmisano ldquoDevelopment and validation of acrank-angle model of an automotive turbocharged engine forHIL applicationsrdquo Energy Procedia vol 45 pp 839ndash848 2014
[24] F G Chmela and G C Orthaber ldquoRate of heat releaseprediction for direct injection diesel engines based on purelymixing controlled combustionrdquo SAE Paper 1999-010186 SAEInternational 1999
[25] N H Walke M R Nandgaonkar and N V Marathe ldquoPredic-tion of soot and NOx emissions for common rail diesel enginesoperating under transient conditionsrdquo International Review ofMechanical Engineering vol 8 no 5 pp 884ndash892 2014
[26] W Annand ldquoHeat transfer in the cylinders of reciprocatinginternal combustion enginesrdquo Proceedings of the IMechE vol177 pp 973ndash980 1963
[27] P Tamilporai N Baluswamy P M Jawahar et al ldquoSimulationand analysis of combustion and heat transfer in low heatrejection diesel engine using two zone combustion model anddifferent heat transfer modelsrdquo SAE Technical Paper 2003-01-1067 2003
[28] M Andersson B Johansson A Hultqvist and C Nohre ldquoAreal time NOx model for conventional and partially premixeddiesel combustionrdquo SAE Paper 2006-01-0195 SAE Interna-tional 2006
[29] H Hiroyasu and T Kadota ldquoModels for combustion andformation of nitric oxide and soot in direct injection dieselenginesrdquo SAE Technical Paper 760129 1976
[30] E G Pariotis D T Hountalas and C D Rakopoulos ldquoSen-sitivity analysis of multi-zone modelling for combustion andemissions formation in diesel enginesrdquo SAE Paper 2006-01-1383 SAE International 2006
Journal of Combustion 13
[31] N H Walke M R Nandgaonkar and N V Marathe ldquoPre-diction of combustion pressure NOx and soot for DI Dieselengine by simplified modelrdquo in Proceedings of the ASME 2013International Mechanical Engineering Congress and Exposition(IMECE rsquo13) paper IMECE 2013-62067 pages San Diego CalifUSA November 2013
[32] E C Andrea F Alessandro and S Ezio ldquoNumerical-experimental study and solutions to reduce the dwell timethreshold for fusion-free consecutive injections in a Multijetsolenoid-type CR systemrdquo in Proceedings of the ASME InternalCombustion Engine Division Spring Technical Conference (ICESrsquo06) Paper no ICES2006-1369 pp 317ndash332 Aachen GermanyMay 2006
International Journal of
AerospaceEngineeringHindawi Publishing Corporationhttpwwwhindawicom Volume 2014
RoboticsJournal of
Hindawi Publishing Corporationhttpwwwhindawicom Volume 2014
Hindawi Publishing Corporationhttpwwwhindawicom Volume 2014
Active and Passive Electronic Components
Control Scienceand Engineering
Journal of
Hindawi Publishing Corporationhttpwwwhindawicom Volume 2014
International Journal of
RotatingMachinery
Hindawi Publishing Corporationhttpwwwhindawicom Volume 2014
Hindawi Publishing Corporation httpwwwhindawicom
Journal ofEngineeringVolume 2014
Submit your manuscripts athttpwwwhindawicom
VLSI Design
Hindawi Publishing Corporationhttpwwwhindawicom Volume 2014
Hindawi Publishing Corporationhttpwwwhindawicom Volume 2014
Shock and Vibration
Hindawi Publishing Corporationhttpwwwhindawicom Volume 2014
Civil EngineeringAdvances in
Acoustics and VibrationAdvances in
Hindawi Publishing Corporationhttpwwwhindawicom Volume 2014
Hindawi Publishing Corporationhttpwwwhindawicom Volume 2014
Electrical and Computer Engineering
Journal of
Advances inOptoElectronics
Hindawi Publishing Corporation httpwwwhindawicom
Volume 2014
The Scientific World JournalHindawi Publishing Corporation httpwwwhindawicom Volume 2014
SensorsJournal of
Hindawi Publishing Corporationhttpwwwhindawicom Volume 2014
Modelling amp Simulation in EngineeringHindawi Publishing Corporation httpwwwhindawicom Volume 2014
Hindawi Publishing Corporationhttpwwwhindawicom Volume 2014
Chemical EngineeringInternational Journal of Antennas and
Propagation
International Journal of
Hindawi Publishing Corporationhttpwwwhindawicom Volume 2014
Hindawi Publishing Corporationhttpwwwhindawicom Volume 2014
Navigation and Observation
International Journal of
Hindawi Publishing Corporationhttpwwwhindawicom Volume 2014
DistributedSensor Networks
International Journal of
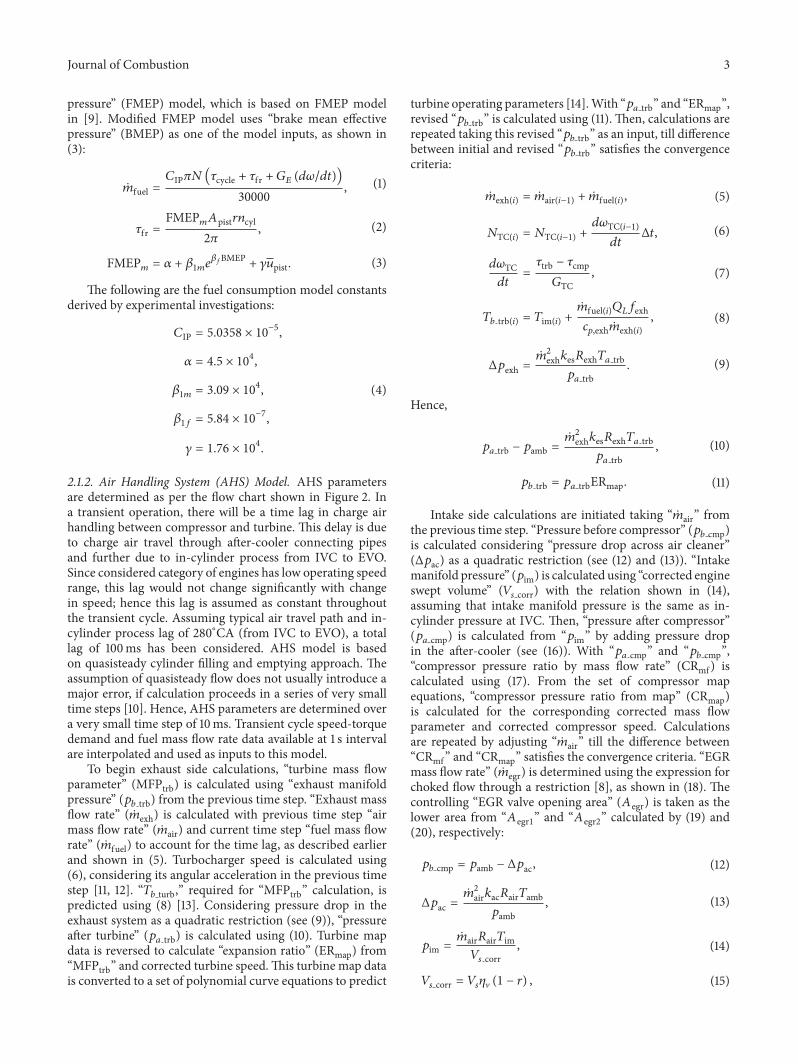

International Journal of
AerospaceEngineeringHindawi Publishing Corporationhttpwwwhindawicom Volume 2014
RoboticsJournal of
Hindawi Publishing Corporationhttpwwwhindawicom Volume 2014
Hindawi Publishing Corporationhttpwwwhindawicom Volume 2014
Active and Passive Electronic Components
Control Scienceand Engineering
Journal of
Hindawi Publishing Corporationhttpwwwhindawicom Volume 2014
International Journal of
RotatingMachinery
Hindawi Publishing Corporationhttpwwwhindawicom Volume 2014
Hindawi Publishing Corporation httpwwwhindawicom
Journal ofEngineeringVolume 2014
Submit your manuscripts athttpwwwhindawicom
VLSI Design
Hindawi Publishing Corporationhttpwwwhindawicom Volume 2014
Hindawi Publishing Corporationhttpwwwhindawicom Volume 2014
Shock and Vibration
Hindawi Publishing Corporationhttpwwwhindawicom Volume 2014
Civil EngineeringAdvances in
Acoustics and VibrationAdvances in
Hindawi Publishing Corporationhttpwwwhindawicom Volume 2014
Hindawi Publishing Corporationhttpwwwhindawicom Volume 2014
Electrical and Computer Engineering
Journal of
Advances inOptoElectronics
Hindawi Publishing Corporation httpwwwhindawicom
Volume 2014
The Scientific World JournalHindawi Publishing Corporation httpwwwhindawicom Volume 2014
SensorsJournal of
Hindawi Publishing Corporationhttpwwwhindawicom Volume 2014
Modelling amp Simulation in EngineeringHindawi Publishing Corporation httpwwwhindawicom Volume 2014
Hindawi Publishing Corporationhttpwwwhindawicom Volume 2014
Chemical EngineeringInternational Journal of Antennas and
Propagation
International Journal of
Hindawi Publishing Corporationhttpwwwhindawicom Volume 2014
Hindawi Publishing Corporationhttpwwwhindawicom Volume 2014
Navigation and Observation
International Journal of
Hindawi Publishing Corporationhttpwwwhindawicom Volume 2014
DistributedSensor Networks
International Journal of