research article open access genomes-based phylogeny · pdf fileresearch article open access...
TRANSCRIPT

RESEARCH ARTICLE Open Access
Genomes-based phylogeny of the genusXanthomonasLuis M Rodriguez-R1,5, Alejandro Grajales2, Mario L Arrieta-Ortiz1, Camilo Salazar3,4, Silvia Restrepo1 andAdriana Bernal1*
Abstract
Background: The genus Xanthomonas comprises several plant pathogenic bacteria affecting a wide range ofhosts. Despite the economic, industrial and biological importance of Xanthomonas, the classification andphylogenetic relationships within the genus are still under active debate. Some of the relationships betweenpathovars and species have not been thoroughly clarified, with old pathovars becoming new species. A change inthe genus name has been recently suggested for Xanthomonas albilineans, an early branching species currentlylocated in this genus, but a thorough phylogenomic reconstruction would aid in solving these and otherdiscrepancies in this genus.
Results: Here we report the results of the genome-wide analysis of DNA sequences from 989 orthologous groupsfrom 17 Xanthomonas spp. genomes available to date, representing all major lineages within the genus. Thephylogenetic and computational analyses used in this study have been automated in a Perl package designatedUnus, which provides a framework for phylogenomic analyses which can be applied to other datasets at thegenomic level. Unus can also be easily incorporated into other phylogenomic pipelines.
Conclusions: Our phylogeny agrees with previous phylogenetic topologies on the genus, but revealed that thegenomes of Xanthomonas citri and Xanthomonas fuscans belong to the same species, and that of Xanthomonasalbilineans is basal to the joint clade of Xanthomonas and Xylella fastidiosa. Genome reduction was identified in thespecies Xanthomonas vasicola in addition to the previously identified reduction in Xanthomonas albilineans. Lateralgene transfer was also observed in two gene clusters.
BackgroundXanthomonas is a genus in the gamma division of Pro-teobacteria primarily constituted by pathogens to plantsof considerable economic importance. These pathogensaffect a wide variety of crops, including Citrus spp.(lime, orange, lemon and pomelo, among others), Oryzaspp. (rice), crucifers (cabbage, broccoli, cauliflower, rad-ish and Arabidopsis thaliana) and Manihot esculenta(cassava), with individual members showing a highdegree of host specificity [1]. Xanthomonas is amongthe few bacterial genera in which large DNA-DNAhybridization, RFLP and REP-PCR datasets are available[2-6] and have been employed for the taxonomical reso-lution of the group [7]. In addition, the availability of
more than ten genomes within the genus [8,9] hasallowed recent studies of comparative genomics andgenome evolution [10,11].The genus Xanthomonas has been subject to numer-
ous taxonomical and phylogenetic studies, starting withthe description of Bacterium vesicatorium as the causalagent of bacterial spot on pepper and tomato [12] andits reclassification as Xanthomonas campestris [13,14].Xanthomonas was first described as a monotypic genus,and later divided in two groups, A and B [15,16]. A sub-sequent study [6] classified 183 reported strains into 20different species mainly based on DNA-DNA hybridiza-tion data. Since then, a general classification has beenestablished based on polyphasic analysis [6,17], whileother analyses helped to clarify the classification in spe-cific clades, mainly using Multi Locus Sequence Analysis(MLSA) and Amplified Fragment Length Polymorphism(AFLP) [18,19]. This allowed the development of several
* Correspondence: [email protected] of Mycology and Plant Pathology, Biological SciencesDepartment, Universidad de Los Andes, Cra 1 No 18A-12, Bogotá, ColombiaFull list of author information is available at the end of the article
Rodriguez-R et al. BMC Microbiology 2012, 12:43http://www.biomedcentral.com/1471-2180/12/43
© 2012 Rodriguez-R et al; licensee BioMed Central Ltd. This is an Open Access article distributed under the terms of the CreativeCommons Attribution License (http://creativecommons.org/licenses/by/2.0), which permits unrestricted use, distribution, andreproduction in any medium, provided the original work is properly cited.

typing and characterization tools (e.g., [11,18-24]), whichhave revealed the diversity and complexity of the genus[23,24], while showing the limitations of single locusanalyses [25]. However, during the last decade the tax-onomy of this genus has still been subject to consider-able debate. Genus-wide reclassifications have beenproposed [26,27], and frequent sub-specific reclassifica-tions and proposals for new species have been published[19-21,28-30].A remarkable example of these conflicts is the classifi-
cation of X. fuscans aurantifolii [26,27], also known asX. axonopodis pv. “aurantifolii“ [2,6,18,31]. This taxonwas originally identified as part of the DNA hybridiza-tion homology group “X. axonopodis“ [6], but after itsdifferentiation from other xanthomonads by DNAsequence-based molecular techniques, production ofwater-soluble brown pigment and host range, it wasdesignated as X. fuscans [26]. However, when thesetraits/methods were examined, none of them could indi-vidually differentiate X. fuscans from other pathovarswithin X. axonopodis [18,31]. DNA-DNA reassociationassays, in turn, have differentiated X. fuscans from X.axonopodis, X. campestris and X. citri [2,26,27]. Addi-tional host-range evidence has also been used to supportthe designation X. fuscans, separated from X. axonopodisand X. citri. Phaseolus vulgaris and Citrus spp. areinfected by X. fuscans pvs. fuscans and aurantifolii,respectively, but are not infected by either X. axonopodisor X. campestris. Citrus spp., on the other hand, is alsoinfected by X. citri [1]. However, host range is usually acriterion to separate pathovars and not species. Thisexample underscores the importance of a solid taxo-nomic classification with a phylogenetic basis.Molecular phylogenetics has played an important role
in the classification of the genus. Single locus analyses,including the use of 16S-23S rDNA spacers, the 16SrRNA gene and the DNA gyrase gyrB [32-35], generallyagree with standing nomenclature but with low resolu-tion below the species level. MLSA including sequencesof protein-coding genes dnaK, fyuA and rpoD [31], hassignificantly extended previous results. In general,MLSA results suggest that X. citri and X. fuscans areclosely related species and should be considered as asingle species based on their 98.34% similarity in theproteins encoded by dnaK, fyuA, gyrB and rpoD [31].Recently, a phylogenomic approach was applied toresolve the phylogenetic relationships within the genus[11], although this work did not explore the phyloge-netic distances between strains, and did not includesequences from X. axonopodis species. The generalstructure of the genus agreed with the standingnomenclature.The use of genomic sequences as the basis for species
delimitation has been explored as a new standard in
bacteria in replacement of DNA-DNA hybridization[36,37], particularly based on metrics such as the ANI(Average Nucleotide Identity) [38]. The correspondencebetween DNA-DNA hybridization and sequence similar-ity has been exploited in Xanthomonas for the establish-ment of clades and species [31], but full genomicsequences have not been used so far for the resolutionof the “X. axonopodis“ clade (this is, including closerelatives such as X. fuscans and X. euvesicatoria). Phylo-genomic methods extend the analysis of primarysequence data from one or few loci (usually no morethan twenty) to hundreds or thousands of loci at thesame time, alleviating the problem of incongruencebetween characters [39,40]. Here, we present a phylo-geny of the genus based on seventeen complete anddraft genomes, including five genomes from the “X. axo-nopodis“ clade. We identified the orthologous genes andperformed the phylogenetic inferences using a newlibrary called Unus, which is briefly described here.
ResultsThe automated selection of orthologous genes isconsistent with manual selectionIn order to compare a typical literature-based selectionof genes for phylogenetic reconstruction in bacteria withthe Unus automated method, using 989 genes in thegenomes listed in Table 1, we evaluated the presence ofthe housekeeping genes used by AMPHORA [41]. Wefound that several of these genes were absent in thedraft genomes Xfa1, Xfa0 and Xvm0. In addition, in-paralogs (i.e., duplicated genes) were detected in thegenome of XooK for several ribosomal proteins (largesubunit; rplA, rplC, rplD, rplE, rplF, rplN) and weretherefore discarded. This is possibly due to errors in thegenome sequence, given that these genes are usuallypresent as a single copy. Importantly, the absence of rplgenes in the XooK genome suggests that ribosomal pro-teins (from both the small and the large subunits) werelocated at mis-assembled regions of the genomesequence. Genes employed in the genus-wide analysisand used by AMPHORA include dnaG, nusA, pgk,pyrG, rplM, rplP, rplS, rplT, rpmA, rpoB, rpsB, rpsC,rpsE, rpsI, rpsK, rpsM and rpsS. Also, five out of theseven genes used by Pieretti et al. [42] (gyrB, recA,dnaK, atpD and glnA) were found in the constructedOrthology Groups (OG), while other two (groEL andefp) seemed to be absent in the draft genome of Xfa1.This underscores the importance of a flexible selectioncriterion of orthologous genes in a determined group oftaxa, especially with unfinished genomes. A previousMLSA conducted by Young and collaborators [31]employed four protein-coding genes included in the pre-vious lists plus the tonB-dependent receptor fyuA, alsopresent in our selection. Another MLSA recently
Rodriguez-R et al. BMC Microbiology 2012, 12:43http://www.biomedcentral.com/1471-2180/12/43
Page 2 of 14

performed by Bui Thi Ngoc et al. [21] used the genesatpD, dnaK, efP and gyrB, all of which were present inour dataset. These data suggest that the automatedselection using Bit Score Ratio (BSR) is in agreementwith the classical selection of genes for phylogenetic stu-dies. Therefore, some of the genes selected in this studycan be used for future phylogenetic reconstructions.The COG classification for the employed genes (Addi-
tional file 1) was compared among sets of genesobtained from automated selections at different taxono-mical levels within the genus (Figure 1). COG categoriesrelated to central metabolism and ribosomal proteins
presented a tendency to increase in representation (rela-tive to other COG categories), as genomes from a widertaxonomical range were included (blue bars in Figure 1).Together, these categories covered 27% of the COG-classified genes and included genes that are frequentlyused for phylogenetic reconstruction. On the otherhand, a reduction in the relative representation whenincluding a wider taxonomical range of genomes wasobserved for categories related to peripheral metabolismand poorly characterized proteins (red bars in Figure 1).These categories covered 36.9% of the COG-classifiedgenes and included clade-specific genes (without
Table 1 Genomes used in this study
(Sub)species Pathovar Strain Abbr. Caused disease Databaseentry
Reference
X. campestris (Pammel 1895) Dowson 1939 emend.Vauterin et al 1995
campestris BCCM/LMG8004 *(1)
Xcc8 Crucifer black rot NCBIGI:66766352
[43]
X. campestris (Pammel 1895) Dowson 1939 emend.Vauterin et al 1995
campestris ATCC 33913T
*(2)XccA Cabbage black rot NCBI
GI:21166373[44]
X. campestris (Pammel 1895) Dowson 1939 emend.Vauterin et al 1995
campestris B100 *(3) XccB Brassica black rot NCBIGI:188989396
[45]
X. campestris (Pammel 1895) Dowson 1939 emend.Vauterin et al 1995
armoraciae 756 C *(4) Xca7 Brassica leaf spot JCVI CMR org:Xca
Unpublished
X. citri subsp. citri (ex Hasse 1915) Gabriel et al 1989 N/A 306 Xci3 Citrus canker A NCBIGI:21240774
[44]
X. fuscans subsp. aurantifolii Schaad et al 2007 *(5) N/A ICPB 11122 Xfa1 Citrus canker B NCBIGI:292601741
[11]
X. fuscans subsp. aurantifolii Schaad et al 2007 *(5) N/A ICPB10535 *(6)
Xfa0 Citrus canker C NCBIGI:292606407
[11]
X. euvesicatoria Jones et al 2006 N/A 85-10 Xeu8 Pepper and tomatobacterial spot
NCBIGI:78045556
[46]
X. axonopodis Starr and Garces 1950 emend. Vauterin etal 1995
manihotis CIO 151 *(7) XamC Cassava BacterialBlight
Not in publicdatabases
Unpublished
X. vasicola Vauterin et al 1995 vasculorum NCPPB 702 *(8)
XvvN Sugarcane gummingdisease
NCBIGI:257136567
[47]
X. vasicola Vauterin et al 1995 musacearum*(9)
NCPPB 4381*(10)
XvmN Banana bacterial wilt NCBIGI:257136682
[47]
X. vasicola Vauterin et al 1995 musacearum*(9)
unknown Xvm0 Banana bacterial wilt JCVI CMR org:ntxv01
Unpublished
X. oryzae (ex Ishiyama 1922) Swings et al 1990 emend.van der Mooter and Swings 1990
oryzae KACC 10331*(11)
XooK Rice bacterial blight NCBIGI:58579623
[48]
X. oryzae (ex Ishiyama 1922) Swings et al 1990 emend.van der Mooter and Swings 1990
oryzae MAFF311018 *(12)
XooM Rice bacterial blight NCBIGI:84621657
[49]
X. oryzae (ex Ishiyama 1922) Swings et al 1990 emend.van der Mooter and Swings 1990
Oryzae PXO99A *(13) XooP Rice bacterial blight NCBIGI:188574270
[50]
X. oryzae (ex Ishiyama 1922) Swings et al 1990 emend.van der Mooter and Swings 1990
oryzicola BLS 256 XocB Rice bacterial streak NCBIGI:94721236
Unpublished
X. albilineans (Ashby 1929) Dowson 1943 emend. vander Mooter and Swings 1990
N/A GPE PC73 *(14)
XalG Sugarcane leaf scald NCBIGI:283472039
[42]
The (Sub)species column contains the accepted name of the bacterium. Alternative names may exist. The listed diseases may be known with different names orin additional hosts. The diseases names and hosts stand as designated in the publication of the genome (rightmost column) or in [8] where unpublished. *(1)Spontaneous rifampicilin-resistant strain derived from NCPPB 1145 (StrainInfo 23435). *(2) Type strain of the species, StrainInfo 23352. *(3) Smr derivative of thewild-type strain DSM 1526 [51], StrainInfo 157307. *(4) Wild-type isolate by Anne Alvarez [52]. *(5) In this study we show that this name should be considered alater heterotypic synonym of X. citri as previously suggested [18,31]. *(6) IBSF 338, StrainInfo 545646. *(7) CIO, CIAT-ORSTROM (now IRD) Xanthomonas collection,Biotechnology Research Unit, Cali, Colombia [53]. *(8) CFBP 7169 or LMG 8710, StrainInfo 26110. *(10) Isolated from banana by Valentine Aritua, not registered inStrainInfo. *(11) CFBP 7088, StrainInfo 559506. *(12) StrainInfo 373786. *(13) 5-azacytidine-resistant derivative of PXO99, collected by Mew and collaborators [54]. *(14) CFBP 7063, StrainInfo 843129.
Rodriguez-R et al. BMC Microbiology 2012, 12:43http://www.biomedcentral.com/1471-2180/12/43
Page 3 of 14

detectable orthologs in distant relatives) as well as genesabsent in X. albilineans, which presents a notable gen-ome size reduction [42]. Pieretti and collaborators iden-tified 131 ancestral genes potentially lost bypseudogenization or short deletions in X. albilineansand 480 potentially lost by both X. albilineans andXylella fastidiosa [42]. Most of the COG-classified genesputatively lost in X. albilineans or both X. albilineansand Xylella fastidiosa (56.2% and 56%, respectively) canbe classified within these COG categories. The sametendency to increase in relative representation whenincreasing the number of taxa was displayed by geneswithout an assigned COG category (data not shown).The only category significantly impacted by discardingthe in-paralogs was category L (replication, recombina-tion and repair). This category covers 8.2% of the COG-classified genes, and 83.2% of those discarded by paral-ogy, suggesting frequent duplications of genes impli-cated in these processes. Putative transposases andinactive derivatives represent 76% of the discardedgenes.
Phylogeny of the genus XanthomonasOur phylogenetic analysis was based on 989 OG(1,084,777 bp, Additional file 2), which included all mar-kers used in previous Xanthomonas phylogenetic ana-lyses. Both, the Maximum Likelihood tree and theBayesian consensus tree reconstructed the same well-supported topology, with bootstrap supports of 100% forall the nodes (out of 1,001 replicates). The same rela-tionships were also obtained with Maximum Parsimony(bootstrap support of 100% with 1,000 replicates).
A total of four clades were obtained in the phyloge-nomic reconstruction. The first clade includes X. oryzae,the second comprises X. vasicola, the third one groupstogether X. fuscans, X. euvesicatoria and X. axonopodis,and the fourth clade contains X. campestris (Figure 2a).These results agree with previous phylogenies of thegenus [11,17,35,42]. In order to further advance on theknowledge of the ancestral relationships of the genusXanthomonas, and in particular the species Xylella fasti-diosa, we performed a new analysis including threeadditional genomes in the Xanthomonadaceae family:Xylella fastidiosa str. 9a5c (GenBank entry AE003849.1),also a plant pathogen, but strictly transmitted by insectvectors; Pseudoxanthomonas suwonensis str. 11-1 (Gen-Bank entry CP002446.1), a bacterium isolated fromenvironmental samples but more commonly found incontaminated ones; and Stenotrophomonas maltophiliastr. R551-3 (GenBank entry NC_011071.1), a commonsoil colonizer which has also been reported as a humanopportunistic pathogen. These species are hereaftertermed Xyf9, Pxs1 and StmR, respectively. This newanalysis was based on a collection of 228 genes automa-tically compiled by the Unus library using Bit ScoreRation (BSR). The resulting phylogeny revealed that thegenus Xanthomonas is not monophyletic, with Xylellafastidiosa as its sister clade. X. albilineans should beplaced in an independent genus in order for the taxon-omy to match the phylogeny of the group (Figure 2b),as previously noted [42]. This result differs from thatpresented by Pieretti and collaborators, based on sevenhousekeeping genes [42], where X. albilineans and X.fastidiosa form a single clade ancestral to all otherXanthomonas.
Genome evolution: gains and lossesThe high number of pseudogenes and lost regions in X.albilineans suggests a reductive genome evolution inthis species [42]. This information, together with theposition of the taxon in previous phylogenies [11,42]and the reduced size of the close relative Xylella fasti-diosa [55], could indicate either a reduced genome asthe ancestral condition in the Xanthomonas genus orindependent genome reductions in Xylella fastidiosaand X. albilineans. Pieretti and collaborators providestrong evidence supporting the latter hypothesis [42].However, the enrichment of phage-related regions inthe Xylella genomes, as well as the presence of multipleInsertion Sequences (IS) in Xanthomonas reveal veryactive mobile elements in the Xanthomonadales order[56]. To determine whether this reductive tendencyextends to other genomes of the genus, we employedGenoPlast [57] for the detection of ancestral genomicgains and losses. The results (Figure 3 and Additionalfile 3) revealed that all the tip nodes in the X. oryzae
Figure 1 Enrichment of COG categories in several OG sets. Theordinates axis shows the COG categories. The subordinate axisaccounts for the difference between the representation of thecategory in the OG set and the representation of the category inthe reference genome Xeu8. Each bar represents a category in agiven OG set. Sets from lighter to darker are: Xeu8 genes discardingin-paralogs; X. axonopodis clade, including Xeu8, XamC, Xci3, Xfa0and Xfa1; No-XalG, including all the genomes in the study butXalG; Xanthomonas, including all the genomes in the genusXanthomonas. Error bars indicate one positive and one negativestandard deviation calculated as described in the methods.Categories increasing in representation at wider taxonomical rangesare hued blue. Categories decreasing in representation at widertaxonomical ranges are hued red. Other categories are hued green.
Rodriguez-R et al. BMC Microbiology 2012, 12:43http://www.biomedcentral.com/1471-2180/12/43
Page 4 of 14

species present net genomic losses compensated bygenomic gains in ancestors of the species (i.e., internalnodes 20 and 24, as labeled in Additional file 3). Inter-estingly, the three genomes of the species X. vasicolapresented large genomic gains (between 12.78% and
15.19% of the regions) after genomic losses exhibited bythe most recent ancestral node of the species (11.47% ofthe regions). This level of genomic losses is almost twiceas large as that exhibited by X. albilineans (5.92%), sug-gesting that the X. vasicola genomes are very dynamic,
Figure 2 Genome-based phylogeny of Xanthomonas. Consensus phylogenetic tree of strains of (a) Xanthomonas based on the 989 OGs, withX. albilineans as an outgroup and (b) Xanthomonas and some genomes from the close relatives Pseudoxanthomonas, Xylella andStenotrophomonas based on 228 identified using the BSR automated method. Branch lengths are according to the ML-based inference. Allnodes were inferred to have a bootstrap value of 100% in 100 samplings. All nodes were inferred to have posterior probability of 1.0 based on1,001 trees sampled from the posterior distribution in the Bayesian inference, with identical topology. Numbers above each branch indicate thebranch length estimated as the proportion of expected changes per site.
Rodriguez-R et al. BMC Microbiology 2012, 12:43http://www.biomedcentral.com/1471-2180/12/43
Page 5 of 14

while maintaining a genome size comparable to otherspecies in the genus.
Gene clusters and detection of putative gene transfer byorthology groupsIn order to identify the distribution of OGs among taxawithin Xanthomonas, a second set was constructedusing OrthoMCL [58]. Figure 4 depicts the general dis-tribution, clustering by patterns of presence/absenceamong genomes, regardless of their relatedness. In gen-eral, the patterns presented by most of the OGs aremonophyletic, as expected (blue columns in Figure 4).However, a few paraphyletic patterns were unexpectedlyenriched. Further inspection revealed that most of theOGs in two of the most enriched paraphyletic patternsare clustered in the genomes and preserve synteny. Weexplored these patterns, and found two clusters of con-tiguous genes with paraphyletic distributions, suggestinghorizontal transference of genetic material.The first cluster (Figure 5a) is present in Xci3, Xeu8,
Xcc8 and XccB, but absent in other genomes of X. cam-pestris, in X. axonopodis and in X. fuscans. Similar geneswere also found in Pseudomonas aeruginosa, Salmonellaenterica and other species of the genera Pseudomonas,Salmonella and Acidovorax (Additional file 4). Thiscluster is mainly composed of putative secreted andmembrane proteins, with few characterized orthologs. InXanthomonas, only three of those genes have been char-acterized. The first two code for VirD4 and VirB4,which are proteins implicated in protein secretion bythe Type IV secretion system in several bacteria, includ-ing Helicobacter, Agrobacterium and Bartonella [59,60].The third codes for RadC, a protein involved in DNArepair. The gene at the locus XCV2366_1 from Xeu8
presents homology with the oxidoreductase DbsA, animportant protein for oxidative folding of disulphide-bonded proteins in Gram-negative bacteria [61]. Onlynine out of the nineteen genes in this cluster present aG+C content at least one standard deviation distantfrom the average for the coding regions within the Xeu8genome (64.66 ± 3.91%). The values of Codon Adapta-tion Index (CAI) for the seventeen genes in the clusterwere similar to the values obtained for other regions ofthe genome. The distribution of this cluster along thegenus suggests flow of genetic material between differ-ent pathovars of Xanthomonas. However, G+C contentand CAI analyses failed to relate this cluster to LGT.Furthermore, LGT regions predicted by AlienHunter[62] do not cover more than one gene in this region inany of the analysed genomes (data not shown). Interest-ingly, in all the genomes, predicted LGT regions sur-round the cluster at distances from one to eight Kbp.The second cluster (Figure 5b) is present in XamC
and Xfa0 but not in Xfa1, despite the high genome-widesimilarity presented between Xfa1 and Xfa0 (Figure 2a).The classification of putative homologs of the genes inthis cluster (see methods) revealed that it is mainlycomposed of sequences similar to proteins in Escheri-chia coli, Siphoviridae, Stenotrophomonas sp. SKA14,Salmonella enterica and Pseudomonas aeruginosa (Addi-tional file 5). Moreover, members of the Siphoviridaeviral family are known to be Pseudomonas and Xantho-monas phages, suggesting the presence of virus-mediated LGT. We cannot attribute the pattern to themixture of chromosomal and plasmidic DNA in draftgenomes (XamC and Xfa0), because none of thesequences presented similarity with genes in Xanthomo-nas plasmids. Note that the gene at the locus
Figure 3 Genomic gains and losses in the genus Xanthomonas. Gains (red) and losses (blue) predicted in genomic regions along branchesof the phylogenetic tree of Xanthomonas. The width of red and blue lines are proportional to the average detected genomic gains and losses,respectively, and a 95% confidence interval is presented as red and blue lines above and below solid regions, respectively.
Rodriguez-R et al. BMC Microbiology 2012, 12:43http://www.biomedcentral.com/1471-2180/12/43
Page 6 of 14

XAUC_17260_1 (Xfa0:1726 in Figure 5b) was originallyannotated as yapH, but its product is a large protein of1231 aa in Xfa0 and 1482 aa in XamC, putatively xeno-logous with a component of a phage tail (groupCOG4733 in the COG database). Two genes in the clus-ter (XamCg00977 and XamCg00978) presented a G+Ccontent more than one standard deviation below themean of the coding sequences in the XamC genome (i.e., 64.82 ± 3.31%), and a low CAI with respect to thewhole predicted coding sequences (0.516 and 0.486,respectively). The other seven genes in the cluster pre-sented average features, which would have precludedtheir identification as units potentially under LGT.
DiscussionThe results of the genome-based phylogenetic recon-struction suggest that certain changes should be
considered in the nomenclature of the Xanthomonasgenus. For instance, X. fuscans was recently proposed asa new species [27], but here we show that it should beconsidered as a later heterotypic synonym of X. citri, aspreviously suggested [18,31]. Other clades in the stand-ing bacterial nomenclature [63] within the Xanthonomo-nas genus were consistent with the phylogeneticreconstruction. Nevertheless, we observed a paralogy inthe genus Xanthomonas when Xylella fastidiosa wasincluded with X. albilineans outside the Xanthomonasgroup. Our results suggest that X. albilineans, probablyalong with other early-branching Xanthomonas, should
Figure 5 Clusters of genes identified by patterns of orthology.The patterns presented in Figure 5 were used for the identificationof two clusters of genes potentially displaying cases of LGT.Dendrograms on the left are derived from Figure 3a (branchlengths do not represent inferred distances). Detected orthologs areonly present in the genomes in bold. Arrows in black representgenes in an OG of the highlighted pattern and grey arrowsrepresent other genes nearby in the genome. Blue lines linkinggenes indicate inferred orthology. Gene numbers correspond to thelast part of the original gene names. Numbers in colours other thanblack indicate genes with products putatively secreted (red) or withtransmembrane domains (green). The clusters are (a) one includinga wrongly annotated pathogenicity-related gene (yapH) and aphage gene (F-hk97); and (b) one possibly related to the type IVsecretion system.
Figure 4 Groups of orthology among seventeen Xanthomonasgenomes. A cladogram of phylogenetic relationships inferred hereis shown on the left. Coloured boxes represent groups of orthologsas detected by OrthoMCL. Each column represents a pattern ofpresence/absence, and the width of the boxes is proportional tothe number of genes showing the given pattern. The colour code isas follows: blue for monophyletic patterns involving all the strainson each species (the pattern including all the genomes colouredlight blue); green for evolutionary changes below the species level;and red for patterns involving strains from more than one speciesand excluding at least one strain of these species. Patterns areordered by number of genes: columns decrease in number ofgenes from left to right.
Rodriguez-R et al. BMC Microbiology 2012, 12:43http://www.biomedcentral.com/1471-2180/12/43
Page 7 of 14

be considered for a new genus designation. However,the relationships between X. albilineans, Xylella and theother Xanthomonas remain unclear. Another shared fea-ture between Xylella fastidiosa and X. albilineans is thereduced genome. The reductions in these genomes werepreviously shown to be due to independent events [42].Here we show evidence suggesting that reductive gen-ome evolution could also affect other clades in thegenus such as X. vasicola.The phylogenetic relationship between X. albilineans,
Xylella fastidiosa and the rest of the taxa in the genusXanthomonas is not clear. The genome of X. albilineansis part of the “early-branching species” [7], a group ofspecies including X. albilineans and X. sacchari pre-viously found to be basal in the phylogeny of the genus[7,35]. The species is also a member of the “hyacinthii“group, a group of species with major differences in the16S-23S rDNA Intergenic Spacer (ITS) with respect tothe other members of the genus [32]. Pieretti and colla-borators [42] suggested that Xylella and X. albilineansform a monophyletic clade, which is basal to the rest ofXanthomonas. This is based on a Maximum Likelihoodanalysis with seven housekeeping genes. Our analyseswith over two hundred genes suggest that X. albilineansis basal to Xylella and the rest of taxa in the genusXanthomonas. Neither of the analyses obtains a goodsupport value for these nodes. The most straightforwardexplanation for this is that certain regions of the gen-ome support one topology and certain others supportthe second one. This could be due to a considerablenumber of LGT in these genomes. Alternatively, itcould be due to the large amount of changes accumu-lated in Xylella fastidiosa, as revealed by the length ofthe corresponding branch (Figure 2b).The phylogenetic tree presented in Figure 2a displays
identical topology and similar relative branch lengths asinferred by different optimality criteria (Maximum Like-lihood, Bayesian Inference, Maximum Parsimony). Thetree supports monophyly in the species X. campestris, X.oryzae and X. vasicola. The clade “X. axonopodis“ con-tains the species X. fuscans, X. citri, X. axonopodis andX. euvesicatoria. However, the lower coverage in termsof sequenced genomes of these species makes it difficultto support any further observation beyond the closerelatedness within the clade with respect to otherspecies.Interestingly, the phylogeny displays a close relation-
ship between the species X. fuscans and X. citri. Inorder to compare their similarity in the same frameworkof MLSA performed for other species of Xanthomonas(e.g., [31]), we constructed a matrix containing 989 lociemployed for the phylogenetic inference (Table 2).According to the resulting matrix, a similarity thresholdof 99% can differentiate bacteria recognized as belonging
to the different pathovars (except in X. vasicola, forwhich pathovars vasculorum and musacearum display asimilarity above 99%, possibly due to non-chromosomalsequences). All the species with currently acceptednames [63] have similarities above 97%. This value (inaccordance with previous MLSA calibrations [31]) alsodifferentiate species outside the X. axonopodis clade, butfails to differentiate X. fuscans and X. citri, suggestingthat the two pathovars conform a single species as pre-viously suggested [18,31]. This is also supported by thelikelihood distances between these two taxa (Figure 2a,Table 2). Accordingly, we recommended that the speciesX. fuscans be regarded as a heterotypic synonym of X.citri.Several robust methods for the identification of
orthology, multiple sequence alignments and phyloge-netic inferences have recently been developed (reviewedin [64]). However, a common flexible framework fortheir joint application in specialized phylogenetic studiesand MLSA in general is still required. The BioPerllibraries, including the Bio::Phylo package [65,66], pro-vide valuable tools for the automation of analyses, butthe connections between different steps are often notautomated, making them time-consuming. Unus allowsthe execution of complete workflows in phylogenomicswithin a single interface, and its current functionalitiesand limitations underscore the need for a fully struc-tured platform in the field, such as those available forother branches of genomics.We compared the automatically selected OGs for the
phylogenetic assessment with several lists of genesmanually compiled. These comparisons indicated that,depending on the genome coverage and annotation ofthe drafts employed, our analyses broadly agree in theselection of OGs with those utilized previously for phy-logenetic inference. Furthermore, the functional distri-bution of the automatically selected genes exhibits theexpected behaviour at different taxonomical levels.Selections on broader taxonomical levels exhibit a largerrepresentation of genes implicated in central-metabo-lism, while the proportion of clade-specific genes aug-ments in narrower taxonomical levels.The analysis of the distribution of COG categories
shows that central metabolism and ribosomal proteinsare favoured when comparing distant genomes, as theyare in phylogenetic studies based on one or few loci.Genes in these categories are better suited than genes inother COG categories or unclassified genes because oftwo characteristics that are important for phylogeneticassessment. Firstly, genes implicated in central-metabo-lism and ribosomal genes are usually of single-copy.Genes with in-paralogs are normally avoided in phyloge-netic inferences given the difficulty in identifying corre-sponding genes in sets of paralogy [67], despite some
Rodriguez-R et al. BMC Microbiology 2012, 12:43http://www.biomedcentral.com/1471-2180/12/43
Page 8 of 14
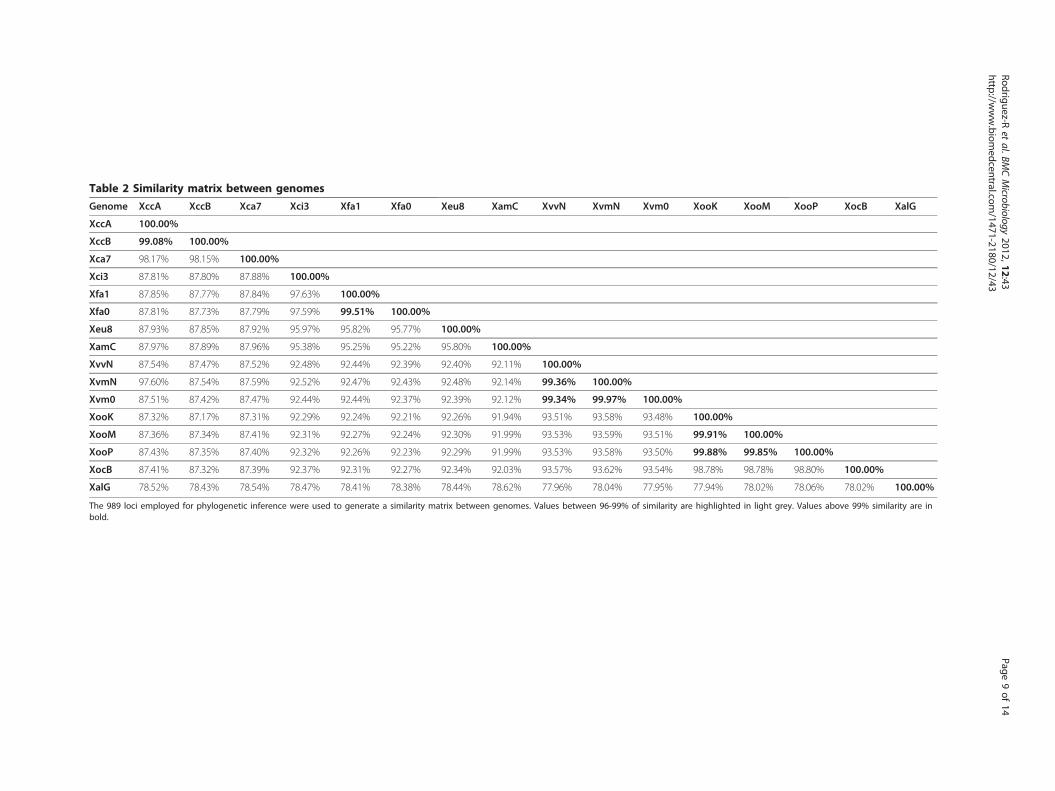
Table 2 Similarity matrix between genomes
Genome XccA XccB Xca7 Xci3 Xfa1 Xfa0 Xeu8 XamC XvvN XvmN Xvm0 XooK XooM XooP XocB XalG
XccA 100.00%
XccB 99.08% 100.00%
Xca7 98.17% 98.15% 100.00%
Xci3 87.81% 87.80% 87.88% 100.00%
Xfa1 87.85% 87.77% 87.84% 97.63% 100.00%
Xfa0 87.81% 87.73% 87.79% 97.59% 99.51% 100.00%
Xeu8 87.93% 87.85% 87.92% 95.97% 95.82% 95.77% 100.00%
XamC 87.97% 87.89% 87.96% 95.38% 95.25% 95.22% 95.80% 100.00%
XvvN 87.54% 87.47% 87.52% 92.48% 92.44% 92.39% 92.40% 92.11% 100.00%
XvmN 97.60% 87.54% 87.59% 92.52% 92.47% 92.43% 92.48% 92.14% 99.36% 100.00%
Xvm0 87.51% 87.42% 87.47% 92.44% 92.44% 92.37% 92.39% 92.12% 99.34% 99.97% 100.00%
XooK 87.32% 87.17% 87.31% 92.29% 92.24% 92.21% 92.26% 91.94% 93.51% 93.58% 93.48% 100.00%
XooM 87.36% 87.34% 87.41% 92.31% 92.27% 92.24% 92.30% 91.99% 93.53% 93.59% 93.51% 99.91% 100.00%
XooP 87.43% 87.35% 87.40% 92.32% 92.26% 92.23% 92.29% 91.99% 93.53% 93.58% 93.50% 99.88% 99.85% 100.00%
XocB 87.41% 87.32% 87.39% 92.37% 92.31% 92.27% 92.34% 92.03% 93.57% 93.62% 93.54% 98.78% 98.78% 98.80% 100.00%
XalG 78.52% 78.43% 78.54% 78.47% 78.41% 78.38% 78.44% 78.62% 77.96% 78.04% 77.95% 77.94% 78.02% 78.06% 78.02% 100.00%
The 989 loci employed for phylogenetic inference were used to generate a similarity matrix between genomes. Values between 96-99% of similarity are highlighted in light grey. Values above 99% similarity are inbold.
Rodriguez-Ret
al.BMCMicrobiology
2012,12:43http://w
ww.biom
edcentral.com/1471-2180/12/43
Page9of
14

efforts to include them in phylogenetic analyses (e.g.,[68]). Secondly, these genes are often present even ingenomes from loosely related organisms. Although phy-logenetic reconstructions based on gene content haveproven successful (e.g., [69]), it is hard to achieve highresolution below species and it is not possible withincomplete draft genomes.Additional genes suitable for phylogenetic analyses
were detected through automated identification oforthologs, allowing a higher resolution among closelyrelated taxa. These genes are usually not included inMLSA, although they can add important informationabout relationships within the group. For closely relatedbacteria (such as the X. oryzae pv. oryzae strains), theimportance of such additional information resides onthe low variability among genomes. Therefore, theoption to select orthologs without a priori knowledge ofthe genes that will be included, allows for flexibility interms of data availability, as well as the obtention ofoptimized phylogenetic resolution at any taxonomiclevel under study.A previous study [42] suggested a reductive evolution
in the genome of X. albilineans, revealed by the smallgenome (3.77 Mbp) and the high putative pseudogeniza-tion. We present evidence supporting the hypothesisthat the reductive genome evolution occurs along thegenus, and is not restricted to the species X. albilineans.In our analyses, the species X. albilineans effectivelyrevealed large genomic reductions, but even largerreductions were presented by the species X. vasicola,with recent genomic gains only detected on tip nodes,suggesting a reductive evolution tendency followed bythe acquisition of genomic regions. The genomic gainson tip nodes can be partly explained by the inclusion ofnon-chromosomal material in the draft genomes of X.vasicola, although this result was not found in otherdraft genomes in the study that have non-chromosomalmaterial, such as XamC. An alternative explanation isthat genomic gains have arisen by recent geneticexchange with other bacteria, as previously suggestedfor X. vasicola [47]. However, the large ancestral lossescannot be explained by means of the incompleteness ofthe genomes, and may reflect an ancestral genomicreduction in the species. The size of the regionsinvolved in such events, and whether they affectrestricted functional categories of genes or randomregions, is still to be determined.We identified two clusters of genes with paraphyletic
distribution, suggesting lateral gene transfer. One of theclusters, present in X. campestris and the “X. axonopo-dis“ clade, exhibits interesting functional relationshipswith the Type IV Secretion System (T4SS), while mostof the genes are annotated as coding for either putativesecreted or membrane proteins. Identification of LGT
events based only on intrinsic features such as the G+Ccontent and the CAI would fail to identify both clusters,showcasing the usefulness the phylogenetic distributionof orthologs as a complement for the prediction of puta-tive LGT events.
ConclusionsCurrently, phylogenomic methods are finding a privi-leged place in phylogenetic inference and evolutionarystudies, yet common frameworks for the flexible auto-mation of workflows are not widely available. Here weused Unus, a package developed to facilitate the execu-tion of phylogenetic workflows, to explore the phyloge-netic structure of the genus Xanthomonas. Werecovered a strongly supported phylogeny in accordancewith previous results and high resolution in the closelyrelated genomes of X. oryzae. The results also provideevidence for the reconsideration of the X. fuscans spe-cies, clarify relationships between X. citri, X. axonopodisand X. euvesicatoria, and show that the genus Xantho-monas is not a monophyletic clade. Our results allowedus to identify several interesting features in the evolu-tion of Xanthomonas, including two large putative lat-eral gene transfer events, which would have been hardto detect by means of G+C content deviation or CodonAdaptation Index. We also detected evidence of an evo-lutionary tendency towards a reduction in genome sizein at least two clades of the genus.
MethodsXanthomonas genomesSeventeen Xanthomonas genomes were used in thisstudy (Table 1). The names employed follow the list ofprokaryotic names with standing nomenclature (LPSN)[63], although several additional names may exist in thescientific literature. Whenever possible, the strains havebeen tracked to the corresponding StrainInfo entry [70],in order to ease the resolution of strains deposited indifferent collections. Gene and gene product predictionswere downloaded together with the genomes fromNCBI (when available) and JCVI websites, except for thegenome of X. axonopodis pv. manihotis str. CIO151(unpublished), for which coding sequences (CDS) werepredicted using Glimmer 3 [71] trained with the X.euvesicatoria str. 85-10 CDS [46]. All the genomes arereferred to as stated in the abbreviation column inTable 1.
Generation of Unus, a new library for the execution ofphylogenomic workflowsUnus is a Perl library that enables the easy execution ofphylogenomic workflows including the detection ofgroups of orthologous genes, batch alignment ofsequences, generation of files in a variety of formats and
Rodriguez-R et al. BMC Microbiology 2012, 12:43http://www.biomedcentral.com/1471-2180/12/43
Page 10 of 14

integration of accessory tests for recombination andmodels of evolution. The various possible workflows theuser can go though in order to obtain a phylogenomicinference of the group of bacteria of interest aredepicted in Figure 6. Fourteen Perl modules integratingthe Unus package are available for download and codebrowsing at http://github.com/lmrodriguezr/Unus/. Fig-ure 6 summarizes the different pipelines implementedwith Unus and alternative programs that can be used.
Detection of orthologous groupsFor the detection of Orthologous Groups (OG), we usedthe distribution of the Bits Score Ratio (BSR), a BLAST-based metric [72] essentially as previously described[10]. Briefly, the BSR is defined as the proportion of theBit Score of the alignment of the query sequence andthe subject sequence, and the Bit Score of the alignmentof the query sequence with itself (i.e., the maximum BitScore for a given query). The histogram is usually bimo-dal (Additional file 6), and Unus detects the valley ofthe distribution as the threshold to accept a hit for eachpaired comparison. To avoid spurious results in distri-butions with shallow valleys or with no evident valley,the threshold for three distributions was set as the aver-age threshold (as calculated for the other paired com-parisons). This method accounts for the problemspreviously observed when considering the best hit only[73,74], as in widely used methods such as the BLASTReciprocal Best Match (RBM), also implemented forcomparison (see Additional file 7 for the annotatedpseudo-code).
Phylogenetic inferenceMultiple sequence alignments were performed usingMUSCLE [75] on each detected OG. Alignments were
discarded when a strong signal of recombination wasdetected in the Phi test [76], i.e., p-value ≤ 0.01 underthe null model of no recombination. Phylogenetic infer-ence based on whole genomes used Maximum Likeli-hood (ML) optimality criterion, as implemented inRAxML v7.2.6 [77,78] with the GTRCAT option, whichtakes the GTR model of nucleotide substitution, plus anapproximation of the Gamma model of rate heterogene-ity into account. Branch support was assessed usingbootstrap sampling as previously reported [11]. Analyseswere performed with each gene in a separate partitionto which an independent model of evolution wasapplied. The resulting ML phylogeny was comparedwith the consensus topology obtained from BayesianInference (BI) [79,80], with exploration of parametersusing the Metropolis-Coupled Monte Carlo MarkovChain (MC3) algorithm with one million generations, asimplemented in MrBayes v3.1.2, sampling a tree every1,000 generations. The log-likelihood scores of sampledpoints were plotted against generation time to deter-mine when the chain became stationary. All samplepoints prior to this (300,000 trees) were discarded asburn-in samples. Data remaining after discarding burn-in samples were used to generate a majority rule con-sensus tree, where percentage of samples recovering anyparticular clade represented the posterior probability ofthat clade. Probabilities ≥ 95% were considered indica-tive of significant support. Branch lengths of the consen-sus tree were estimated by maximum likelihood [81].We performed additional phylogenetic reconstructionsusing Maximum Parsimony (MP) using the PAUP*package v4.0b10 [82]. MP trees were obtained in anequal weighted heuristic search with tree-bisection-reconnection (TBR) branch swapping. The consensustree was calculated using majority rule. Bootstrap (1,000replicates, heuristic search TBR branch swapping) wasused to assess support for each node. A similarity matrixof all the concatenated sequences was prepared usingthe DNADIST program of the PHYLIP package [77]using Kimura distance [83], in order to compare the dis-tances within the “X. axonopodis“ clade with previousMLSA.
Detection of genomic gains and lossesThe genomic gains and losses were identified and quan-tified using GenoPlast [57] with 10,000 burn-in itera-tions followed by 100,000 additional iterations, 10iterations between sampling and two independent runswith identical parameters. Analyses were performedassuming a single phylogenetic tree obtained by MLinference. The input multiple alignment was conductedwith progressive Mauve [84], and post-processed withthe tools for developers of Mauve [85] to first obtain abinary matrix of presence/absence by region, and
Figure 6 Workflows executable with the Unus libraries. Theworkflow on the left depicts the multiple steps allowed by theUnus library. Each step has multiple alternative methods or formatslisted on the right side of the diagram.
Rodriguez-R et al. BMC Microbiology 2012, 12:43http://www.biomedcentral.com/1471-2180/12/43
Page 11 of 14

afterwards a matrix of presence/absence patterns counts.GenoPlast processes this matrix for the calculation ofprobabilities of ancestral events of genomic gains andlosses and implements a model-based method to inferthe patterns of genome content evolution by Bayesianinference, assuming a Poisson distribution of genomicgains and losses. The phylogeny inferred here was usedas scaffold.
Assignation of COG functional categoriesHomology with entries in the Cluster of OrthologousGroups of proteins (COG) database [86] was determinedby BLAST searches [72] against the COG sequencesdatabase. The BLAST search was performed using thedefault filtering algorithm and a minimum quality ofalignments defined by a score of at least 250 bits, anidentity of 50% of the aligned region or more, and analigned region comprising 50% of the query gene ormore. BLAST results were parsed and filtered using acustom Perl script with the above criteria. The Perlscript also mapped the hits to the corresponding COGcategory, reporting the category or categories for eachquery sequence. Each set was analysed 1,000 times ran-domly sampling 75% of the query sequences to calculatethe Standard Deviation (SD; Figure 1). For the charac-terization of OGs, each comprising one gene per gen-ome, only genes present in the genome of X.euvesicatoria str. 85-10 were used as representative ofthe OG.
Taxonomical distribution of homologous sequencesBLAST searches against the non-redundant proteindatabase of the NCBI (NR) [87] were performed inorder to identify the homologs of one or more genes inother organisms, with default parameters and Expectvalue below 10-10. The BLAST result was subsequentlyparsed with a custom Perl script to extract the organ-isms, subsequently building a cumulative counts tableand mapping these organisms to any fixed taxonomicallevel using the NCBI’s Taxonomy database [87].
Additional material
Additional file 1: COG distribution of different taxonomical ranges.Raw data graphically presented in Figure 2. Each row corresponds to oneCOG functional category. Each taxonomical range is represented in twocolumns, the average and the standard deviation.
Additional file 2: Concatenated sequence alignment and partitions.ZIP file containing the input alignment in Phylip format (Suppl_file_2.phylip) and the coordinates of the partitions (Suppl_file_2.raxcoords) asemployed for the ML phylogenetic analysis in RAxML. Unus automaticallygenerated these files.
Additional file 3: Leaf and ancestral nodes in the GenoPlast eventsmatrix. Each row corresponds to one node, and each columncorresponds to a pattern of regions, as defined by Mauve developers’
tools. The first two additional columns contain the node identifier andthe node content.
Additional file 4: Species counts in similar sequences of cluster 1.Species counts within the BLAST hits in NCBI’s NR using the genes ofXeu8 in the cluster as query.
Additional file 5: Species counts in similar sequences of cluster 2.Species counts within the BLAST hits in NCBI’s NR using the genes ofXamC in the cluster as query.
Additional file 6: Distribution of the BLAST Bit Score (BSR) forseveral paired comparisons. The genes of Xeu8 were used as referenceto build histograms of BSR values here displayed in logarithmic scale(blue). In purple, is the distribution by larger windows of values. Ingreen, is the automatically selected threshold based on the valley of thedistribution. Discontinuous purple shows the average threshold, whilegrey indicates four extreme points of the distribution used to evaluateits topology.
Additional file 7: Supplementary methods. A supplementary textdescribing methods for the construction of OGs using the Bit Score Ratiowith static (BSR-Manual) and dynamic thresholds (BSR-Auto), and theBLAST Reciprocal Best Match (RBM).
AcknowledgementsThis project was funded by the Colombian administrative department ofScience, Technology and Innovation (Colciencias) and the Vice-chancellor’sOffice of Research at the Universidad de Los Andes. We would like to thankAndrew Crawford, Ralf Koebnik and two anonymous reviewers for criticalreading of the manuscript. We also thank Boris Szurek, Valérie Verdier,Kostantinos Konstantinidis, Catalina Arévalo and Camilo López for commentsand discussion on the conception and development of this study.
Author details1Laboratory of Mycology and Plant Pathology, Biological SciencesDepartment, Universidad de Los Andes, Cra 1 No 18A-12, Bogotá, Colombia.2Division of Invertebrate Zoology, American Museum of Natural History,Central Park West at 79th Street, 10024-5192 New York, NY, USA.3Smithsonian Tropical Research Institute, Roosvelt Ave. Tupper Building,Panama 0843-03092, Panama. 4University of Cambridge, The Old Schools,Trinity Lane, Cambridge CB2 1TN, UK. 5Department of Biology, GeorgiaInstitute of Technology, 311 Ferst Drive, 30332 Atlanta, GA, USA.
Authors’ contributionsLMR participated in the design and coordination of the study, acquired data,carried out the analysis and drafted the manuscript. AG participated in thedesign and coordination of the study, acquired data and critically revisedthe manuscript. MLA participated in the design and coordination of theanalyses. CS participated in the design and coordination of the study andcritically revised the manuscript, while SR participated in the design andcoordination and critically revised the manuscript. AB conceived the study,participated in the design and coordination of the study, drafted andcritically revised the manuscript. All authors read and approved the finalmanuscript.
Received: 18 July 2011 Accepted: 23 March 2012Published: 23 March 2012
References1. Hayward AC: The host of Xanthomonas. In Xanthomonas. Edited by:
Swings J-G, Civerolo EL. London: Chapman 1993:52-54.2. Egel DS, Graham JH, Stall RE: Genomic relatedness of Xanthomonas
campestris strains causing diseases of Citrus. Appl Environ Microbiol 1991,57:2724-2730.
3. Louws FJ, Fulbright DW, Stephens CT, de Bruijn FJ: Specific genomicfingerprints of phytopathogenic Xanthomonas and Pseudomonaspathovars and strains generated with repetitive sequences and PCR.Appl Environ Microbiol 1994, 60:2286-2295.
4. Rademaker JLW, Hoste B, Louws FJ, et al: Comparison of AFLP and rep-PCR genomic fingerprinting with DNA-DNA homology studies:
Rodriguez-R et al. BMC Microbiology 2012, 12:43http://www.biomedcentral.com/1471-2180/12/43
Page 12 of 14

Xanthomonas as a model system. Int J Syst Evol Microbiol 2000,50:665-677.
5. Simões THN, Gonçalves ER, Rosato YB, Mehta A: Differentiation ofXanthomonas species by PCR-RFLP of rpfB and atpD genes. FEMSMicrobiol Lett 2007, 271:33-39.
6. Vauterin L, Hoste B, Kersters K, Swings J: Reclassification of Xanthomonas.Int J Syst Evol Microbiol 1995, 45:472.
7. Parkinson NM, Aritua V, Heeney J, et al: Phylogenetic analysis ofXanthomonas species by comparison of partial gyrase B genesequences. Int J Syst Evol Microbiol 2007, 57:2881-2887.
8. Koebnik R: The Xanthomonas Resource.[http://www.xanthomonas.org/].9. Ryan RP, Vorhölter F-J, Potnis N, et al: Pathogenomics of Xanthomonas:
understanding bacterium-plant interactions. Nature reviews. Microbiology2011, 9:344-355.
10. Blom J, Albaum SP, Doppmeier D, et al: EDGAR: a software framework forthe comparative analysis of prokaryotic genomes. BMC Bioinforma 2009,10:154.
11. Moreira LM, Almeida NF, Potnis N, et al: Novel insights into the genomicbasis of citrus canker based on the genome sequences of two strains ofXanthomonas fuscans subsp. aurantifolii. BMC Genomics 2010, 11:238.
12. Doidge EM: A tomato canker. Ann Appl Biol 1921, 7:407-430.13. Dowson WJ: On the systematic position and generic names of the gram
negative bacterial plant pathogens. Zentralblatt fur Bakteriologie,Parasitenkunde, Infektionskrankheiten und Hygiene 1939, 177-193, Abteilung.
14. Dye DW: Genus IX. Xanthomonas. Dowson (1939). In A ProposedNomenclature and Classification for Plant Pathogenic Bacteria Edited by:Young JM, Dye DW, Bradbury JF, Panagopoulos GC, Robbs CF 1978,153-177, N Z J Agric Res 21;.
15. Stall RE, Beaulieu C, Egel DS, et al: Two genetically diverse groups ofstrains are included in Xanthomonas campestris pv. vesicatoria. Int J SystBacteriol 1994, 44:47-53.
16. Vauterin L, Swings J, Kersters K, et al: Towards an improved taxonomy ofXanthomonas. Int J Syst Bacteriol 1990, 40:312-316.
17. Rademaker JLW, Louws FJ, Schultz MH, et al: A comprehensive species tostrain taxonomic framework for Xanthomonas. Phytopathology 2005,95:1098-111.
18. Ah-You N, Gagnevin L, Grimont PAD, et al: Polyphasic characterization ofxanthomonads pathogenic to members of the Anacardiaceae and theirrelatedness to species of Xanthomonas. Int J Syst Evol Microbiol 2009,59:306-318.
19. Young JM, Wilkie JP, Park D-S, Watson DRW: New Zealand strains of plantpathogenic bacteria classified by multi-locus sequence analysis; proposalof Xanthomonas dyei sp. nov. Plant Pathol 2010, 59:270-281.
20. Aritua V, Parkinson NM, Thwaites R, et al: Characterization of theXanthomonas sp. causing wilt of enset and banana and its proposedreclassification as a strain of X. vasicola. Plant Pathol 2008, 57:170-177.
21. Bui Thi Ngoc L, Vernière C, Jouen E, et al: Amplified fragment lengthpolymorphism and multilocus sequence analysis-based genotypicrelatedness among pathogenic variants of Xanthomonas citri pv. citriand Xanthomonas campestris pv. bilvae. Int J Syst Evol Microbiol 2010,60:515-525.
22. Rademaker JLW, Norman DJ, Forster RL, et al: Classification andidentification of Xanthomonas translucens isolates, including thosepathogenic to ornamental asparagus. Phytopathology 2006, 96:876-884.
23. Valverde A, Hubert T, Stolov A, et al: Assessment of genetic diversity ofXanthomonas campestris pv. campestris isolates from Israel by variousDNA fingerprinting techniques. Plant Pathol 2007, 56:17-25.
24. Vicente JG, Everett B, Roberts SJ: Identification of isolates that cause a leafspot disease of brassicas as Xanthomonas campestris pv. raphani andpathogenic and genetic comparison with related pathovars.Phytopathology 2006, 96:735-745.
25. Sawada H, Kunugi Y, Watauchi K, Kudo A, Sato T: Bacterial spot, a newdisease of grapevine (Vitis vinifera) caused by Xanthomonas arboricola.Jpn J Phytopathol 2011, 77:7-22.
26. Schaad NW, Postnikova E, Lacy GH, et al: Reclassification of Xanthomonascampestris pv. citri (ex Hasse 1915) Dye 1978 forms A, B/C/D, and E as X.smithii subsp. citri (ex Hasse) sp. nov. nom. rev. comb. nov., X. fuscanssubsp. aurantifolii (ex Gabriel 1989) sp. nov. nom. rev. comb. nov., andX. alfalfae subsp. citrumelo (ex Riker and Jones) Gabriel et al., 1989 sp.nov. nom. rev. comb. nov.; X. campestris pv. malvacearum (ex Smith1901) Dye 1978 as X. smithii subsp. smithii nov. comb. nov. nom. nov.; X.
campestris pv. alfalfae (ex Riker and Jones, 1935) Dye 1978 as X. alfalfaesubsp. alfalfae (ex Riker et al., 1935) sp. nov. nom. rev.; and “var.fuscans” of X. campestris pv. phaseoli (ex. Smith, 1987) Dye 1978 as X.fuscans subsp. fuscans sp. nov. Syst Appl Microbiol 2005, 28:494-518.
27. Schaad NW, Postnikova E, Lacy GH, et al: Emended classification ofxanthomonad pathogens on citrus. Syst Appl Microbiol 2006, 29:690-695.
28. Ah-You N, Gagnevin L, Chiroleu F, et al: Pathological variations withinXanthomonas campestris pv. mangiferaeindicae support its separationinto three distinct pathovars that can be distinguished by AmplifiedFragment Length Polymorphism. Phytopathology 2007, 97:1568-1577.
29. Fargier E, Manceau C: Pathogenicity assays restrict the speciesXanthomonas campestris into three pathovars and reveal nine raceswithin X. campestris pv. campestris. Plant Pathol 2007, 56:805-818.
30. Jones JB, Lacy GH, Bouzar H, Stall RE, Schaad NW: Reclassification of thexanthomonads associated with bacterial spot disease of tomato andpepper. Syst Appl Microbiol 2004, 27:755-762.
31. Young JM, Park D-S, Shearman HM, Fargier E: A multilocus sequenceanalysis of the genus Xanthomonas. Syst Appl Microbiol 2008, 31:366-377.
32. Gonçalves ER, Rosato YB: Phylogenetic analysis of Xanthomonas speciesbased upon 16S-23S rDNA intergenic spacer sequences. Int J Syst EvolMicrobiol 2002, 52:355-361.
33. Hauben L, Vauterin L, Swings J, Moore ER: Comparison of 16S ribosomalDNA sequences of all Xanthomonas species. Int J Syst Bacteriol 1997,47:328-335.
34. Moore ER, Krüger AS, Hauben L, et al: 16S rRNA gene sequence analysesand inter- and intrageneric relationships of Xanthomonas species andStenotrophomonas maltophilia. FEMS Microbiol Lett 1997, 151:145-153.
35. Parkinson NM, Cowie C, Heeney J, Stead DE: Phylogenetic structure ofXanthomonas determined by comparison of gyrB sequences. Int J SystEvol Microbiol 2009, 59:264-274.
36. Deloger M, El Karoui M, Petit M-A: A genomic distance based on MUMindicates discontinuity between most bacterial species and genera. JBacteriol 2009, 191:91-99.
37. Richter M, Rosselló-Móra R: Shifting the genomic gold standard for theprokaryotic species definition. Proc Natl Acad Sci USA 2009,106:19126-19131.
38. Konstantinidis KT, Tiedje JM: Genomic insights that advance the speciesdefinition for prokaryotes. Proc Natl Acad Sci USA 2005, 102:2567-2572.
39. Rokas A, Williams BL, King N, Carroll SB: Genome-scale approaches toresolving incongruence in molecular phylogenies. Nature 2003,425:798-804.
40. Philippe H, Delsuc F, Brinkmann H, Lartillot N: Phylogenomics. Annu RevEcol Evol Syst 2005, 36:541-562.
41. Wu M, Eisen JA: A simple, fast, and accurate method of phylogenomicinference. Genome Biol 2008, 9:R151.
42. Pieretti I, Royer M, Barbe V, et al: The complete genome sequence ofXanthomonas albilineans provides new insights into the reductivegenome evolution of the xylem-limited Xanthomonadaceae. BMCGenomics 2009, 10:616.
43. Qian W, Jia Y, Ren S, et al: Comparative and functional genomic analysesof the pathogenicity of phytopathogen Xanthomonas campestris pv.campestris. Genome Res 2005, 15:757-767.
44. da Silva A, Ferro J, Reinach F, et al: Comparison of the genomes of twoXanthomonas pathogens with differing host specificities. Nature 2002,417:459-463.
45. Vorhölter F, Schneiker S, Goesmann A, et al: The genome of Xanthomonascampestris pv. campestris B100 and its use for the reconstruction ofmetabolic pathways involved in xanthan biosynthesis. J Biotechnol 2008,134:33-45.
46. Thieme F, Koebnik R, Bekel T, et al: Insights into genome plasticity andpathogenicity of the plant pathogenic bacterium Xanthomonascampestris pv. vesicatoria revealed by the complete genome sequence. JBacteriol 2005, 187:7254-7266.
47. Studholme DJ, Kemen E, MacLean D, et al: Genome-wide sequencing datareveals virulence factors implicated in banana Xanthomonas wilt. FEMSMicrobiol Lett 2010, 310:182-192.
48. Lee B, Park Y, Park D, et al: The genome sequence of Xanthomonas oryzaepathovar oryzae KACC10331, the bacterial blight pathogen of rice.Nucleic Acids Res 2005, 33:577-586.
49. Ochiai H, Inoue Y, Takeya M, et al: Genome sequence of Xanthomonasoryzae pv. oryzae suggests contribution of large numbers of effector
Rodriguez-R et al. BMC Microbiology 2012, 12:43http://www.biomedcentral.com/1471-2180/12/43
Page 13 of 14

genes and Insertion Sequences to its race diversity. JARQ 2005,39:275-287.
50. Salzberg S, Sommer D, Schatz M, et al: Genome sequence and rapidevolution of the rice pathogen Xanthomonas oryzae pv. oryzae PXO99A.BMC Genomics 2008, 9:204.
51. Hötte B, Rath-Arnold I, Pühler A, Simon R: Cloning and analysis of a 35.3-kilobase DNA region involved in exopolysaccharide production byXanthomonas campestris pv. campestris. J Bacteriol 1990, 172:2804-2807.
52. Kamoun S, Kado CI: Phenotypic switching affecting chemotaxis, xanthanproduction, and virulence in Xanthomonas campestris. Appl EnvironMicrobiol 1990, 56:3855-3860.
53. Restrepo S, Duque MC, Verdier V: Characterization of pathotypes amongisolates of Xanthomonas axonopodis pv. manihotis in Colombia. PlantPathol 2000, 49:680-687.
54. Mew TW, Cruz Vera CM, Medalla ES: Changes in race frequency ofXanthomonas oryzae pv. oryzae in response to rice cultivars planted inthe Philippines. Plant Dis 1992, 76:1029-1032.
55. Simpson AJ, Reinach FC, Arruda P, et al: The genome sequence of theplant pathogen Xylella fastidiosa. The Xylella fastidiosa Consortium of theOrganization for Nucleotide Sequencing and Analysis. Nature 2000,406:151-159.
56. Monteiro-Vitorello CB, de Oliveira MC, Zerillo MM, et al: Xylella andXanthomonas Mobil’omics. OMICS 2005, 9:146-159.
57. Didelot X, Darling ACE, Falush D: Inferring genomic flux in bacteria.Genome Res 2009, 19:306-317.
58. Li L, Stoeckert CJ, Roos DS: OrthoMCL: identification of ortholog groupsfor eukaryotic genomes. Genome Res 2003, 13:2178-2189.
59. Atmakuri K, Cascales E, Christie PJ: Energetic components VirD4, VirB11and VirB4 mediate early DNA transfer reactions required for bacterialtype IV secretion. Mol Microbiol 2004, 54:1199-1211.
60. Kuldau GA, De Vos G, Owen J, McCaffrey G, Zambryski P: The virB operonof Agrobacterium tumefaciens pTiC58 encodes 11 open reading frames.Mol Gen Genet MGG 1990, 221:256-266.
61. Hu SH, Peek JA, Rattigan E, Taylor RK, Martin JL: Structure of TcpG, theDsbA protein folding catalyst from Vibrio cholerae. J Mol Biol 1997,268:137-146.
62. Langille MGI, Hsiao WWL, Brinkman FSL: Evaluation of genomic islandpredictors using a comparative genomics approach. BMC Bioinforma2008, 9:329.
63. Euzéby JPM: List of Prokaryotic names with Standing in Nomenclature.[http://www.bacterio.cict.fr/index.html].
64. Barton NH, Briggs DEG, Eisen JA, Goldstein DB, Patel NH: PhylogeneticReconstruction. Evolution New York: Cold Spring Harbo Laboratory Press;2007.
65. Stajich JE, Block D, Boulez K, et al: The Bioperl toolkit: Perl modules forthe life sciences. Genome Res 2002, 12:1611-1618.
66. Vos RA, Caravas J, Hartmann K, Jensen MA, Miller C: Bio::Phylo-phyloinformatic analysis using Perl. BMC Bioinforma 2011, 12:63.
67. Fitch WM: Uses for evolutionary trees. Philos Trans R Soc Lond B Biol Sci1995, 349:93-102.
68. Simmons MP, Donovan Bailey C, Nixon KC: Phylogeny reconstructionusing duplicate genes. Mol Biol Evol 2000, 17:469-473.
69. Huson DH, Steel M: Phylogenetic trees based on gene content.Bioinformatics (Oxford, England) 2004, 20:2044-2049.
70. Dawyndt P, Vancanneyt M, De Meyer H, Swings J: Knowledgeaccumulation and resolution of data inconsistencies during theintegration of microbial information sources. IEEE Trans Knowl Data Eng2005, 17:1111-1126.
71. Delcher AL, Bratke KA, Powers EC, Salzberg SL: Identifying bacterial genesand endosymbiont DNA with Glimmer. Bioinformatics (Oxford, England)2007, 23:673-679.
72. Altschul SF, Madden TL, Schäffer AA, Zhang J: Gapped BLAST and PSI-BLAST: a new generation of protein database. Nucleic Acids Res 1997,25:3389-3402.
73. Koski LB, Golding GB: The closest BLAST hit is often not the nearestneighbor. J Mol Evol 2001, 52:540-542.
74. Moreno-Hagelsieb G, Latimer K: Choosing BLAST options for betterdetection of orthologs as reciprocal best hits. Bioinformatics (Oxford,England) 2008, 24:319-324.
75. Edgar RC: MUSCLE: multiple sequence alignment with high accuracy andhigh throughput. Nucleic Acids Res 2004, 32:1792-1797.
76. Bruen TC, Philippe H, Bryant D: A simple and robust statistical test fordetecting the presence of recombination. Genetics 2006, 172:2665-2681.
77. Felsenstein J: PHYLIP (Phylogeny Inference Package) version 3.5c. 1993.78. Stamatakis A: RAxML-VI-HPC: maximum likelihood-based phylogenetic
analyses with thousands of taxa and mixed models. Bioinformatics(Oxford, England) 2006, 22:2688-2690.
79. Rannala B, Yang Z: Probability distribution of molecular evolutionarytrees: a new method of phylogenetic inference. J Mol Evol 1996,43:304-311.
80. Yang Z, Rannala B: Bayesian phylogenetic inference using DNAsequences: a Markov Chain Monte Carlo Method. Mol Biol Evol 1997,14:717-724.
81. Ronquist F, Huelsenbeck JP: MrBayes 3: Bayesian phylogenetic inferenceunder mixed models. Bioinformatics (Oxford, England) 2003, 19:1572-1574.
82. Swofford DL: PAUP*. 2002.83. Kimura M: A simple method for estimating evolutionary rates of base
substitutions through comparative studies of nucleotide sequences. JMol Evol 1980, 16:111-1120.
84. Darling ACE, Mau B, Perna NT: progressiveMauve: multiple genomealignment with gene gain, loss and rearrangement. PLoS One 2010, 5:e11147.
85. Darling ACE, Mau B, Blattner FR, Perna NT: Mauve: multiple alignment ofconserved genomic sequence with rearrangements. Genome Res 2004,14:1394-1403.
86. Tatusov RL, Fedorova ND, Jackson JD, et al: The COG database: anupdated version includes eukaryotes. BMC Bioinforma 2003, 4:41.
87. Sayers EW, Barrett T, Benson DA, et al: Database resources of the NationalCenter for Biotechnology Information. Nucleic Acids Res 2009, 37:D5-D15.
doi:10.1186/1471-2180-12-43Cite this article as: Rodriguez-R et al.: Genomes-based phylogeny of thegenus Xanthomonas. BMC Microbiology 2012 12:43.
Submit your next manuscript to BioMed Centraland take full advantage of:
• Convenient online submission
• Thorough peer review
• No space constraints or color figure charges
• Immediate publication on acceptance
• Inclusion in PubMed, CAS, Scopus and Google Scholar
• Research which is freely available for redistribution
Submit your manuscript at www.biomedcentral.com/submit
Rodriguez-R et al. BMC Microbiology 2012, 12:43http://www.biomedcentral.com/1471-2180/12/43
Page 14 of 14