research article open access namibias ... - biomed central
TRANSCRIPT

Smith Gueye et al. BMC Public Health 2014, 14:1190http://www.biomedcentral.com/1471-2458/14/1190
RESEARCH ARTICLE Open Access
Namibia’s path toward malaria elimination: a casestudy of malaria strategies and costs along thenorthern borderCara Smith Gueye1,4*, Michelle Gerigk1, Gretchen Newby1, Chris Lourenco1,2, Petrina Uusiku3 and Jenny Liu1
Abstract
Background: Low malaria transmission in Namibia suggests that elimination is possible, but the risk of importedmalaria from Angola remains a challenge. This case study reviews the early transition of a program shift frommalaria control to elimination in three northern regions of Namibia that comprise the Trans-Kunene MalariaInitiative (TKMI): Kunene, Omusati, and Ohangwena.
Methods: Thirty-four key informant interviews were conducted and epidemiological and intervention data wereassembled for 1995 to 2013. Malaria expenditure records were collected for each region for 2009, 2010, and 2011,representing the start of the transition from control to elimination. Interviews and expenditure data were analyzedacross activity and expenditure type.
Results: Incidence has declined in all regions since 2004; cases are concentrated in the border zone. Expendituresin the three study regions have declined, from an average of $6.10 per person at risk per year in 2009 to anaverage of $3.61 in 2011. The proportion of spending allocated for diagnosis and treatment declined while that forvector control increased. Indoor residual spraying is the main intervention, but coverage varies, related toacceptability, mobility, accessibility, insecticide stockouts and staff shortages. Bed net distribution was scaled upbeginning in 2005, assisted by NGO partners in later years, but coverage was highly variable. Distribution of rapiddiagnostic tests in 2005 resulted in more accurate diagnosis and can help explain the large decline in casesbeginning in 2006; however, challenges in personnel training and supervision remained during the expenditurestudy period of 2009 to 2011.
Conclusions: In addition to allocating sufficient human resources to vector control activities, developing a greateremphasis on surveillance will be central to the ongoing program shift from control to elimination, particularly inlight of the malaria importation challenges experienced in the northern border regions. While overall programresources may continue on a downward trajectory, the program will be well positioned to actively eliminate theremaining foci of malaria if greater resources are allocated toward surveillance efforts.
Keywords: Malaria, Malaria elimination, Namibia, Program operations, Costs
* Correspondence: [email protected] Global Health Group, San Francisco, CA, USA4UCSF Global Health Sciences, 550 16th Street, 3rd Floor, UCSF Mail Stop1224, San Francisco, CA, 94158USAFull list of author information is available at the end of the article
© 2014 Smith Gueye et al.; licensee BioMed Central Ltd. This is an Open Access article distributed under the terms of theCreative Commons Attribution License (http://creativecommons.org/licenses/by/4.0), which permits unrestricted use,distribution, and reproduction in any medium, provided the original work is properly credited. The Creative Commons PublicDomain Dedication waiver (http://creativecommons.org/publicdomain/zero/1.0/) applies to the data made available in thisarticle, unless otherwise stated.

Smith Gueye et al. BMC Public Health 2014, 14:1190 Page 2 of 16http://www.biomedcentral.com/1471-2458/14/1190
BackgroundWhile many countries in sub-Saharan Africa continueto scale-up malaria control measures [1], countries inSouthern Africa are progressing toward elimination.Elimination is defined as the “reduction to zero of theincidence of infection caused by human malaria para-sites in a defined geographical areas as a result of deli-berate efforts” [1]. Since 2000, Namibia, South Africa,and Swaziland have all reduced malaria case incidenceby more than 75%, and Botswana has relatively low malariaincidence as well [1]. However, pockets of transmissionremain, primarily in northern border areas where malariareceptivity remains high and vulnerability is greater due tocontinuous population movement from neighboring en-demic countries [2,3]. Human migration from endemic tolower transmission areas can place destination countries atrisk for malaria outbreaks or resurgence. Yet little is knownabout the types of program strategies and resource alloca-tions required to reduce transmission in these vulnerableand highly porous border areas.This case study aims to fill this evidence gap by exami-
ning the Namibia National Vector-borne Diseases ControlProgramme’s (NVDCP) strategies and activities during theearly phases of its transition from malaria control to eli-mination, from 2000 to 2013. Malaria programs in threeregions with moderate transmission that experience mala-ria importation from Angola—Kunene, Omusati, andOhangwena—are described through archival record re-trieval, literature review, and key informant interviews.Program implementation processes, intervention cover-age, and epidemiological data are compared in order toidentify the main technical, operational, and financial bar-riers encountered in regions with substantial cross-borderchallenges, and to highlight potential solutions. Alongwith broader implications for national malaria controlprograms in other countries on their way to eliminatingmalaria, insights for furthering Namibia’s malaria elimin-ation strategy are discussed.
MethodsThis case study employed a mixed method approach,including historical record review, key informant inter-views, and extraction of expenditure data from programaccounts.
Ethics statementApproval for this study was obtained from institutional re-view boards of the University of California, San Francisco(12–09421) and the Namibia Ministry of Health andSocial Services (P/Bag 13198).
Sample selectionThree regions in Namibia—Kunene, Omusati, andOhangwena—were purposefully chosen because of their
relatively higher malaria transmission patterns and loca-tion bordering Angola. As each region is unique in itstopography, climate and malaria epidemiology, the threeregions together provide a range in setting for the pro-grammatic and expenditure analysis. These regions arealso a part of the Trans-Kunene Malaria Initiative (TKMI),a joint program between the Ministries of Health ofNamibia and Angola. Expenditure data were collected forthree consecutive years in each region: 2009, 2010, and2011, representing the program’s early transition frommalaria control to controlled low-endemic malaria.
Data collectionFrom March to April 2013, researchers visited the threestudy regions and conducted thirty-four key informant in-terviews. Key informants were purposefully selected basedon current or past experience in working with local mal-aria programs in the selected regions. Key informants alsoreferred interviewers to other potential study participantsat the conclusion of each interview. Potential study partic-ipants were either approached in-person if they werepresent in the health office or contacted through phone toset up meetings. Key informants included program direc-tors, nurses, and environmental health assistants at dif-ferent government levels, and representatives from privatesector program collaborators. Interviews and data collec-tion began at the national level, followed by visits to re-gional and district hospitals and health centers.After obtaining informed verbal consent, interviews
were conducted in English and audio-recorded. The inter-viewers followed a semi-structured questionnaire focusedon program strategies, activities, history, epidemiologicaltrends, and organizational structure. A second semi-structured questionnaire was used to elicit informationabout program expenditures and sources of financial re-cords for program activities. At the end of each interview,key informants were asked to identify other individualswith knowledge of the covered topics.Data on malaria epidemiology, malaria control interven-
tion coverage, and demographics for 1995 to 2013 werecollated from the NVDCP weekly surveillance system,Health Information System database, and NIP database.There were many gaps in epidemiological data, particu-larly for the number of indigenous and imported cases, asthe surveillance system was not yet designed to capturethis information. Population at risk (PAR) estimates andsurveillance and vector control intervention coverage werealso not available in many cases. Expenditure records werecollected for all malaria activities for the years 2009, 2010,and 2011 from district, regional, and national offices. Onlyexpenditures for the government-run program were cap-tured, which included any external funding provided tothe government (e.g., from GFATM grants) that was usedfor malaria control activities. Activities conducted by

Smith Gueye et al. BMC Public Health 2014, 14:1190 Page 3 of 16http://www.biomedcentral.com/1471-2458/14/1190
private sector organizations or NGOs and household out-of-pocket spending were not included. All available datasources were accessed and triangulated when possible. Toaccount for differences in service delivery needs acrossregions, yearly expenditures were divided by the totalpopulation (the entire population of all three regions isclassified as at risk by the NVDCP).
Data analysisInterview transcriptions were analyzed using a codingscheme developed to identify common themes, includingrisk groups, program strategies and interventions, fi-nancial and human resources, cross border activities,community involvement, challenges, and success factors.Expenditure data were analyzed across two dimensions:
(1)malaria activity: diagnosis and treatment, preventionand vector control, surveillance, information andeducation campaigns, and program management andmonitoring and evaluation (M/M&E); and
(2)expenditure type: personnel, commodities, services,and capital equipment.
All expenditures were adjusted to 2011 prices and con-verted to US dollars. For additional details, see Appendix A.Information from interviews was then combined with ex-penditure data to understand the context in which malariaactivities were carried out, enabling the identification ofprogram strengths and constraints.
ResultsNamibia’s malaria control effortsMore than 65% of Namibia’s population lives in the tennorthern regions considered malaria endemic, where lowor moderate malaria transmission occurs [4]. Across thecountry, the climate varies from arid and semi-arid tosubtropical, with temperatures between 5°C and 40°C.Malaria occurs seasonally with periodic focal outbreaks,primarily influenced by rainfall patterns [5]. The mainvector in Namibia is Anopheles arabiensis, which is com-mon in areas with lower rainfall [6]. Anopheles funestusand Anopheles gambiae are also present, but have beengreatly reduced in recent years [7]. Breeding areas forAn. arabiensis are “iishanas”, or flat, low-lying areas thatcollect water during the rainy season and dry out duringdrought periods. An. arabiensis tends to feed at night,biting humans indoors as well as cattle outdoors [8]. Thisdiversity in feeding behavior can make An. arabiensismore difficult to control using traditional vector controlinterventions. Plasmodium falciparum (Pf ) accounts for97% of all malaria cases [7].Malaria in Namibia has recently undergone an epi-
demiologic transition [9]. Malaria control interventionshave reduced endemic malaria transmission to a state of
controlled low-endemic malaria (CLM), a level at which“malaria no longer constitutes a major public health bur-den, but at which transmission would continue to occureven in the absence of importation” [10]. Between 2001and 2011, reported cases from health facilities declinedfrom 562,703 to 14,406, and deaths attributed to malariafell from 1,747 to 36—reductions of 97.4% and 98.0%,respectively. Substantial improvements in health andeconomic development also occurred during this period.Gross domestic product per capita has nearly tripledfrom US$1,830 in 2001 to US$5,380 in 2011, while lifeexpectancy has increased from 57.3 to 62.3 years, andinfant mortality has declined from 71.7 to 45.6 deathsper 1,000 live births [11].Despite the overall reduction of malaria, there remains
low to moderate transmission in the northern regions bor-dering Angola [12]. Figure 1 describes the spatial limits ofPf transmission and predictions of receptivity. Of the threestudy regions, Ohangwena has the highest transmissionreceptivity potential, followed by Omusati and Kunene[13]. While the western coast of Kunene is unsuitable formalaria transmission, the northeastern area has stablecontrolled low-endemic transmission (PfPR2–10 < 1%) andthe southeast has hypoendemic 1 transmission (PfPR2-101to <5%). Most of Omusati has hypoendemic 1 transmission,while the border area between Omusati and Ohangwenahas hypoendemic 2 transmission (PfPR2–10 5 to <10%).The eastern parts of Ohangwena have mesoendemictransmission (PfPR2-1010 to 30%). See Appendix A formethods used to generate Figure 1.Established in 1991, the NVDCP is based in both
Windhoek, the capital of Namibia, and Oshakati, in thenorthern malaria endemic area. The Directorate of SpecialProgrammes (DSP) is a directorate of the Ministry ofHealth and Social Services (MoHSS) that oversees all acti-vities related to HIV/AIDS, tuberculosis, and vector-bornediseases, including malaria. Figure 2 depicts the organi-zational structure of the NVDCP. At the regional level,malaria services are managed by the Environmental HealthUnit and DSP focal persons. At the district level, malariaactivities (i.e. indoor residual spraying (IRS), diagnosis andtreatment, and community outreach) are executed by thePrimary Health Care supervisors and EnvironmentalHealth Officers (EHOs). At health centers and clinics, nursesprovide case management services and distribute long-lasting insecticide-treated nets (LLINs). In some areas,non-governmental organizations (NGOs) help conduct in-formation, education and communication (IEC) campaignsand distribute LLINs. All public health facilities receiveclinical supplies from the Central Medical Store, which ishoused separately under the Directorate of Tertiary HealthCare and Clinical Support Services [14]. The National Insti-tute of Pathology (NIP), which is state owned, conducts ma-laria microscopy in 37 laboratories throughout the country.

Figure 1 P. falciparum transmission and predictions of receptive PfPR2–10. Map of Namibia showing the spatial limits of P. falciparumtransmission and predictions of receptive P. falciparum parasite rate (for age range 2–10 years, or PfPR2–10) at health district within the stablelimits. The receptive risks were computed as the maximum mean population adjusted PfPR2–10 predicted for the years 1969, 1974, 1979, 1984 and1989 for each health district [13].
Smith Gueye et al. BMC Public Health 2014, 14:1190 Page 4 of 16http://www.biomedcentral.com/1471-2458/14/1190
The NVDCP is financially supported by the govern-ment and the Global Fund to Fight AIDS, Tuberculosisand Malaria (GFATM). Since January 2005, Namibia hasreceived $18.8 million USD in GFATM disbursements[15,16] allocated to malaria programme activities. Thecurrent grant beginning July 2010 has been extended toJune 2016 and will disburse an additional $7.3 millionUSD. In April 2010, the NVDCP launched a campaignto move the country to pre-elimination/elimination inthe next five to 10 years [17] with a goal of reducing in-cidence to less than 1 per 1,000 total population in everydistrict by 2016 and achieving national elimination, orzero local malaria cases, by 2020 [18].
Kunene regionKunene is relatively remote and sparsely populated. Be-cause the climate is mostly dry with only sporadic rainfall[19], the environment is not particularly receptive to mos-quito breeding. However, vector larvae have been found innatural springs in the north near the Namibian-Angolanborder, which is demarcated by the Kunene River anddoes not have any official border posts. Of three districts(Khorixas, Opuwo, and Outjo), Opuwo is the northern-most, the most populated, and has the highest malariaburden: 138 (88%) of the cases in 2011 in Kunene werereported from Opuwo. Kunene has fewer malaria casesthan other northern regions, and the number of cases has

Figure 2 Malaria program organization. Within the Government Republic of Namibia Ministry of Health and Social Services, the NationalVector-borne Diseases Control Programme is part of the Directorate of Special Programmes (DSP). At the national level, the program supervisesmalaria activities at the regional and district level, providing them with trainings and supplies for vector control. The Central Medical Storeprovides all medicines and clinical supplies required to carry out malaria case management. Regional DSP Programme Administrators andEnvironmental Health Officers organize and support activities at the regional and district levels.
Smith Gueye et al. BMC Public Health 2014, 14:1190 Page 5 of 16http://www.biomedcentral.com/1471-2458/14/1190
declined, from 11,111 in 2001 to 729 in 2009 (API = 9.64)and further to 138 in 2011 (API = 1.52; see Figure 3, re-ported malaria cases).From 2009 to 2011, total annual expenditures on
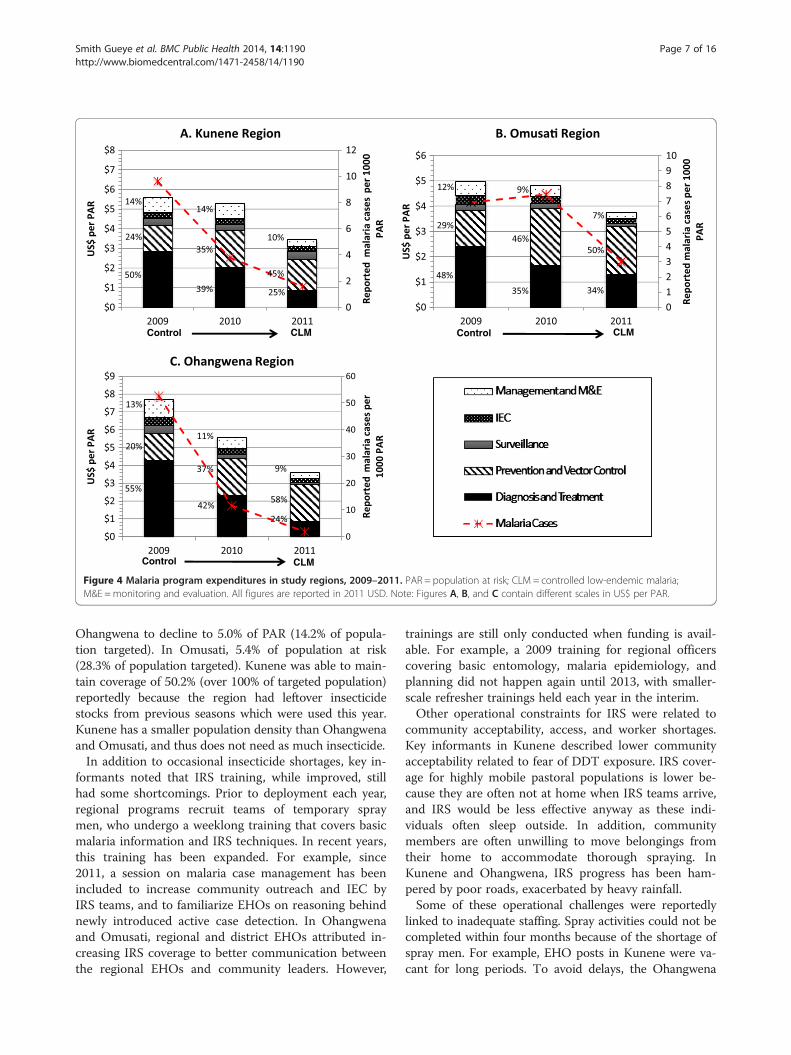
malaria in Kunene declined by 28.0%, from US$ 5.61 perpopulation at risk per year (PPY) to US$ 3.46 PPY in2011 (see Figure 4, Panel A). Expenditures in the studyinclude both government funding and the governmentfunding provided from the GFATM grants. In 2009,diagnosis and treatment accounted for half of the totalexpenses (50.4%), followed by vector control and preven-tion (23.5%). By 2011, spending on diagnosis and treat-ment declined to 24.8%, most likely due to the decreasein treatment expenditures, but spending on vector con-trol increased to 45.4%. Spending on personnel declinedfrom 73.8% in 2009 to 66.5% in 2011, largely due to lesstime spent on diagnosis and treatment by health workers(see Table 1). Conversely, because of expanded IRS acti-vity, spending on consumables increased from 9.3% to20.6% over the same time period.
Omusati regionOmusati, to the east of Kunene, is smaller in territory butmore densely populated, particularly in the northern partof the region. Rainfall is more consistent in Omusati than
Kunene [20]. Of four districts in Omusati, outpatient mal-aria cases in 2011 were highest in Outapi (130 cases),where an official border crossing exists, followed byTsandi (113 cases), Oshikuku (35 cases), and Okahao (23cases).Malaria cases in Omusati declined from over 100,000 in
2001 to 5,256 in 2008 (see Figure 3). Between 2009 and2011, cases dropped by 60.2%, from 1,689 (API = 6.93) to729 (API = 2.77). Over the same time period, malaria pro-gram expenditures declined by 28.9%, from US$4.99 PPYto US$ 3.77 PPY, respectively (Figure 4, Panel B). Over thisthree-year period, the proportion of expenditures for diag-nosis and treatment declined (from 48.2% to 34.0%) whilethe proportion for vector control and prevention in-creased (from 28.5% to 50.4%). These reductions werelinked to a reduced proportional spending on personnel(from 73.6% to 50.8%), and increased proportional spen-ding for consumables (from 18.1% to 47.2%; see Table 1).
Ohangwena regionOf the three study regions, Ohangwena has the highestpopulation density. While the area receives a consider-able amount of precipitation relative to the other regions[21], rainfall is variable and droughts are common. Ma-laria cases declined from 97,338 in 2001 to 14,682 in

0
100
200
300
400
500
600
700
800
2001 2002 2003 2004 2005 2006 2007 2008 2009 2010 2011
Repo
rted
Mal
aria
Cas
es p
er 1
000/
PAR
Caprivi
Kavango
Kunene
Ohangwena
Omusa�
Omaheke, Otjozondjupa,Oshana, Oshikoto
RDTs introduced
Trans-KuneneMalaria Ini�a�ve
begins
Global Fund disbursements start. ACTs are 1st line treatment. LLINs distributed to vulnerablegroups.
Figure 3 Reported malaria cases from health facilities, 2001–2011. Source: Health Information System, MoHSS Note: Region populations for2002–2004 were not available. Calculated by taking difference between 2005 and 2001 populations, dividing by 4 and adding amount to eachyear. Note: Based on regional names and boundaries as of July 2013. The selected study regions are shown in color. Neighboring regions areshown for comparison. PAR = population at risk; ACT = artemisinin combination therapy; LLIN = long-lasting insecticide-treated nets; RDT = rapiddiagnostic test.
Smith Gueye et al. BMC Public Health 2014, 14:1190 Page 6 of 16http://www.biomedcentral.com/1471-2458/14/1190
2008 (see Figure 3). From 2009 to 2011, total cases de-creased by 77.6% (13,755 cases in 2009, API = 52.64; 451cases in 2011, API = 1.69). Key informants believed thatmost cases originated in Angola: 87% of the region’smalaria cases were reported from Engela District, wherethe official border post is located.From 2009 to 2011, malaria program expenditures
dropped by 56.3% from US$ 7.71 PPY to US$ 3.60 PPY,the largest observed across all study regions (Figure 4,Panel C). Similar to the other regions, the proportion ofspending over the three-year period declined for diagno-sis and treatment (from 55.3% to 23.6%) and increasedfor vector control and prevention (from 20.0% to 57.6%).Expenditures for personnel also declined (from 82.4% to58.9%) while expenditures for consumables increased(from 8.7% to 30.4%), mostly spent on insecticides (seeTable 1).
Cross-regional comparison of major malaria controlinterventionsA summary of the major technical, operational, and re-source allocation challenges of the main malaria in-terventions elicited from key informants is provided inTable 2.
Indoor residual sprayingIRS, primarily with Dichloro-diphenyl-trichloroethane(DDT), has been the main malaria control interventionin Namibia since the 1960s [13]. Currently, DDT is
mainly used on traditional structures (huts made ofsticks and reeds) and deltamethrin is used on moderncement block structures. IRS is typically conducted fromOctober to January, timed to start just before the onsetof the rainy season, which lasts from November to April.IRS is coordinated and carried out by EHOs at regionaland district levels who supervise spray teams comprisedof temporary laborers, using insecticides and equipmentprovided by the national program. The national programalso conducts supervisory visits during trainings and inthe field, and conducts bioassay and susceptibility stu-dies on the effectiveness of insecticides. Nationally, IRScoverage (i.e. percentage of the PAR that lives in aninsecticide-treated structure) was 15.6% in 2008, and48.9% of the population targeted for IRS were consideredcovered in that year. PAR is considered to be the totalpopulation in areas deemed at risk for malaria, which inthe sampled regions includes the total population of theregions. In 2011, IRS coverage per PAR was 41.1% andthe programme provided IRS coverage for 88.9% of thetargeted population. The 2008 decline in coverage wascaused by delayed procurement of insecticides.In Kunene, 47.8% of the population was covered by IRS
in 2011 (78.8% of population covered of those targeted).Spraying was concentrated in Opuwo District because ithad more people and vector breeding sites. IRS coveragein Ohangwena was 38.4% (over 100% for populationtargeted), and in Omusati was 28.2% (93.1% of targeted).The insecticide shortage in 2008 caused IRS coverage in
2009 2010 2011
A. Kunene Region
012345678910
$0
$1
$2
$3
$4
$5
$6
2009 2010 2011
Repo
rted
mal
aria
case
s per
100
0 PA
R
US$
per P
AR
B. Omusa� Region
$0
$1
$2
$3
$4
$5
$6
$7
$8
$0
$1
$2
$3
$4
$5
$6
$7
$8
$9
2009 2010 2011
0
0
2
4
6
8
1
12
Repo
rted
mal
aria
case
spe
r100
0PA
R
0
10
20
30
40
50
60Re
port
edm
alar
iaca
sesp
er
1000
PAR
US$
per P
ARUS
$pe
rPAR
C. Ohangwena Region
50%
24%
14%14%
35%
39% 25%
45%
10%
48%
35% 34%
29%46%
50%
12% 9%
7%
55%
42%24%
20%
37%
58%
13%
11%
9%
CLM
CLM
CLMControl Control
Control
Figure 4 Malaria program expenditures in study regions, 2009–2011. PAR = population at risk; CLM = controlled low-endemic malaria;M&E =monitoring and evaluation. All figures are reported in 2011 USD. Note: Figures A, B, and C contain different scales in US$ per PAR.
Smith Gueye et al. BMC Public Health 2014, 14:1190 Page 7 of 16http://www.biomedcentral.com/1471-2458/14/1190
Ohangwena to decline to 5.0% of PAR (14.2% of popula-tion targeted). In Omusati, 5.4% of population at risk(28.3% of population targeted). Kunene was able to main-tain coverage of 50.2% (over 100% of targeted population)reportedly because the region had leftover insecticidestocks from previous seasons which were used this year.Kunene has a smaller population density than Ohangwenaand Omusati, and thus does not need as much insecticide.In addition to occasional insecticide shortages, key in-
formants noted that IRS training, while improved, stillhad some shortcomings. Prior to deployment each year,regional programs recruit teams of temporary spraymen, who undergo a weeklong training that covers basicmalaria information and IRS techniques. In recent years,this training has been expanded. For example, since2011, a session on malaria case management has beenincluded to increase community outreach and IEC byIRS teams, and to familiarize EHOs on reasoning behindnewly introduced active case detection. In Ohangwenaand Omusati, regional and district EHOs attributed in-creasing IRS coverage to better communication betweenthe regional EHOs and community leaders. However,
trainings are still only conducted when funding is avail-able. For example, a 2009 training for regional officerscovering basic entomology, malaria epidemiology, andplanning did not happen again until 2013, with smaller-scale refresher trainings held each year in the interim.Other operational constraints for IRS were related to
community acceptability, access, and worker shortages.Key informants in Kunene described lower communityacceptability related to fear of DDT exposure. IRS cover-age for highly mobile pastoral populations is lower be-cause they are often not at home when IRS teams arrive,and IRS would be less effective anyway as these indi-viduals often sleep outside. In addition, communitymembers are often unwilling to move belongings fromtheir home to accommodate thorough spraying. InKunene and Ohangwena, IRS progress has been ham-pered by poor roads, exacerbated by heavy rainfall.Some of these operational challenges were reportedly
linked to inadequate staffing. Spray activities could not becompleted within four months because of the shortage ofspray men. For example, EHO posts in Kunene were va-cant for long periods. To avoid delays, the Ohangwena

Table 1 Population, malaria cases, and program expenditures for selected regions, 2009-2011
Control Control/Controlled low-endemic malaria Controlled low-endemic malaria
2009 2010 2011
Kunene Ohangwena Omusati Kunene Ohangwena Omusati Kunene Ohangwena Omusati
Total population 75,632 261,323 243,657 76,598 265,992 245,788 88,300 245,100 242,900
Reported1 malaria cases 729 13,755 1,689 292 3,078 1,828 138 451 729
Expenditures (US$2011) $424,155 $2,015,576 $1,216,671 $405,194 $1,486,757 $1,183,450 $305,546 $881,399 $915,354
Expenditures/total population $ 5.61 $ 7.56 $ 4.99 $ 5.29 $ 5.48 $ 4.81 $3.46 $4.02 $3.77
Expenditure type:
Personnel 73.8% ($4.14)2 84.2% ($6.37) 73.6% ($3.67) 64.2% ($3.40) 71.7% ($3.93) 62.3% ($3.00) 66.5% ($2.30) 58.9% ($2.37) 50.8% ($1.92)
Consumables 9.3% ($0.52) 6.7% ($0.51) 18.1% ($0.90) 17.8% ($0.94) 18.8% ($1.03) 32.3% ($1.55) 20.6% ($0.71) 30.4% ($1.22) 47.2% ($1.77)
Services 15.8% ($0.89) 8.4% ($0.63) 7.1% ($0.36) 15.2% ($0.81) 7.5% ($0.41) 4.3% ($0.21) 7.2% ($0.25) 8.1% ($0.33) 0.9% ($0.03)
Capital 1.1% ($0.06) 0.7% ($0.05) 1.1% ($0.06) 2.7% ($0.14) 2.0% ($0.11) 1.1% ($0.05) 5.7% ($0.20) 2.6% ($0.10) 1.2% ($0.05)1Reported from health facilities.2Total cost per person at risk for particular expenditure type.
Smith
Gueye
etal.BM
CPublic
Health
2014,14:1190Page
8of
16http://w
ww.biom
edcentral.com/1471-2458/14/1190

Table 2 Technical, operational, and resource allocation challenges of key malaria interventions elicited from keyinformant interviews
Issues discussed Operational Technical Resource allocation
Indoor residual spraying ● Access and weather difficulties ● Does not cover mobilepopulation
● Insufficient spray men
● Homeowner/community refusals ● Delayed insecticide procurementin 2008
● Late staff payments ● Not as effective against outdoorbiting/resting vectors
● Turnover/retraining ● Irregular trainings
● No documented strategy ontargeting populations
● Lack of some IRS equipment
Long-lasting insecticide-treated nets ● Unclear/outdated targeting ● Does not cover mobilepopulation
● Insufficient supplies of LLINs andresource mechanism fordistribution
● High turnover of communityvolunteers
● Not as effective against outdoorbiting/resting vectors
● LLINs misused by recipients ● Insufficient IEC for proper use ofLLINs
Diagnosis & treatment ● No official change in policy(until 2012)
● Trainings not organized or timedto coincide with newcommodity rollout
● No concentrated strategy acrossregions ● Insufficient IEC for dispelling
myths and emphasizing need forprompt diagnosis and treatment● Some malaria patients reluctant
to provide accurate contact orplace of origin information.
● Some health workers perceiveRDTs to be too time-consuming
Surveillance/Reporting ● No analysis/feedback ● Reporting systems not linkedacross health system levels orregions
● Lack of personnel
● Private sector not included
Smith Gueye et al. BMC Public Health 2014, 14:1190 Page 9 of 16http://www.biomedcentral.com/1471-2458/14/1190
program recently attempted simultaneous IRS in differentdistricts using smaller teams. Late payment of temporaryspray men was an issue mentioned by key informants inall three regions, particularly in Omusati, and may haveresulted in decreased morale and lower quality of IRS.The Omusati program also lacked equipment (e.g. tents)at times. In 2011, Omusati recruited 10 more spray menwith GFATM funding to alleviate staffing shortages.The timing of the spray season was another factor. IRS
was planned to begin in October and end in January,overlapping with the rainy season. However, heavy rainsand flooding made it difficult to reach certain areas, andolder vehicles tended to break down in rough terrain.To avoid delays, the spray season was shifted in 2011 tostart in September and end in December, but it has notyet been determined whether IRS coverage and qualityhave improved as a result.
Long-lasting insecticide-treated netsLLINs have been a main vector control method sincethe mid-2000s. Distribution of ITNs (targeting womenonly) began in 1993 in northern Namibia. A 2005 policychange instituted broader targeting of at-risk groups, in-cluding children under five years of age and pregnantwomen. From 2005 to 2011, over 625,000 LLINs were
distributed at health facilities, outreach sites, antenatalclinics, and via mass campaigns to villages.LLIN coverage (estimated at one net for two people
for three years in at-risk populations targeted for LLINsby region, which are different across regions) variedacross regions and years. Coverage in Kunene steadilyincreased from 6.1% in 2005 to 53.5% in 2009, but de-clined thereafter and was only 26.0% in 2011. Since2005, coverage in Ohangwena increased from 9.0% to apeak of 43.9% in 2010, but declined to 30.5% in 2011.Similarly, coverage in Omusati increased from 10.3%(2005) to 52.8% (2010) before declining to 31.6% (2011).LLIN distribution was augmented in 2008 to compen-sate for lower IRS coverage.In some regions, international and local NGOs helped
to distribute LLINs and increase coverage. In Ohangwena,NGOs targeted entire villages and mobilized communityvolunteers to assist in delivery. This method appears tohave been effective for mass distribution, but was ham-pered by high turnover of volunteers. Some communitiesrefused to participate or use LLINs, even after meetingswith local leaders. Starting in 2005, with support fromGFATM, additional NGOs have distributed free and subsi-dized LLINs via social marketing [22]. Even though LLINaccess has increased, challenges for further improving

Smith Gueye et al. BMC Public Health 2014, 14:1190 Page 10 of 16http://www.biomedcentral.com/1471-2458/14/1190
coverage remain. In Omusati, key informants reportedinsufficient supplies of LLINs for at-risk populations. InKunene, because LLINs have been misused (e.g. drapedon the outside of a structure), key informants stated thatmore education and involvement of traditional commu-nity leaders was needed.In 2012, the NVDCP set a new goal to achieve 95%
LLIN coverage of the entire population, shifting from justvulnerable populations to all those living in regions withany risk of malaria transmission by 2014 [15]. In 2013, amass distribution of 87,900 LLINs was targeted to villageswith the highest malaria caseloads in Zambezi, Kavango,and Omusati. By registering LLINs to each household, theprogram will be able to track recipients for future distribu-tions and net replacement.
Diagnosis/treatment: RDT and ACT rolloutMalaria diagnosis and treatment is available for free toboth citizens and foreigners in all health facilities. Begin-ning in 2005, national guidelines called for clinical diag-nosis with parasite confirmation using microscopy or aRapid Diagnostic Test (RDT). RDTs were procured byGFATM and distributed for the first time in 2005, andwere available in 90% of district health facilities by 2006.In 2011, a new RDT with improved sensitivity and speci-ficity to Pf and the ability to test for multiple parasitespecies was procured. Many key informants attributedthe decrease in cases beginning in 2006 to more accur-ate malaria diagnosis.Implementation of RDTs, however, faced some train-
ing challenges. In all three regions, key informants re-ported that some health workers were still using clinicaldiagnosis, and felt that RDT procedures took too muchtime. When the new type of RDT was procured in 2011,trainings for health workers were delayed and somenurses continued to follow directions for the previousbrand. Overall it was felt that there was a lack of over-sight for proper use of diagnostic procedures at healthfacilities. To address these issues, the NVDCP rede-signed the case management training and new trainingswere rolled out in the endemic regions, including newjob aids such as algorithm charts and RDT quick re-ference guides. In addition, a mentorship programsupported RDT usage by health workers [23]. As thecountry moves toward elimination, the NVDCP aims toachieve 100% confirmed diagnosis of all suspected cases.RDTs will also be included in the quality assurancesystem.Other activities during the study period attempted to
further improve case management. The Omusati pro-gram created a malaria task force to discuss cases inmonthly meetings. In Ohangwena, patients waiting forcare were given health education. Education was alsoseen as important in Omusati, where key informants
called for more IEC and community outreach to increaseawareness and knowledge.Prior to 2005, chloroquine was the first line treatment
for Pf, and sulfadoxine pyramethamine (SP), or oralquinine for pregnant women, was the second line treat-ment. However, increasing resistance to chloroquine ledto a treatment policy change to artemisinin combinationtherapy (ACTs) in 2005, which was rolled out nation-wide in 2006. By 2009, 94% of all health facilities inNamibia offered malaria treatment with ACTs.Stockouts of commodities seem to be limited. In 2009,
only 2% of all health facilities reported having stockoutsof ACTs [24]. Only in Ohangwena did key informantsreport stockouts of SP and RDTs, which they attributedto a lack of inventory monitoring and proper forecasting.Facilities alleviated stockouts by requesting commoditiesfrom nearby hospital pharmacies. In all three regions,diagnosis and treatment costs declined from over half oftotal malaria expenditures to 24.8% in Kunene, 23.6% inOhangwena, and 34.0% in Omusati. The decline is likelydue to increased laboratory case confirmation, and re-duced treatment of non-malaria febrile illness, thus pro-curement and expenditures for malaria treatment wentdown. However, challenges still exist: for example, inOmusati, healthcare providers reported that malaria pa-tients tended to be admitted at later stages of illness,especially those patients traveling from Angola, and re-quired more intensive care.
Surveillance/reportingThe NVDCP has relied upon passive case detection in thepublic sector to identify new malaria infections. Expendi-tures on surveillance activities were similar in Ohangwenaand Omusati, remaining relatively steady from about 4-5%from 2009 to 2011. The percentage of program expendi-tures for surveillance in Kunene increased from 6.8% in2009 to 11.5% in 2011, suggesting an initial program re-structuring toward malaria elimination.Namibia’s nationwide Health Information System (HIS)
collects data on inpatient and outpatient cases and deathsfrom regional and district public facilities, relying on dataentered by a designated HIS officer at each level of gov-ernment. Because reporting was often infrequent, delayed,and lacked adequate case information, the NVDCP intro-duced a parallel weekly surveillance system in 2010 inwhich district DSP focal persons compiled surveillanceforms with additional key indicators (e.g. number of feverstested, patient age, local or non-local case origination).However, the DSP focal person is also responsible forreporting on HIV/AIDS and tuberculosis, which, accor-ding to key informants, requires a disproportionateamount of time. Moreover, even though these data flowfrom districts to regional and national levels, they are notanalyzed and information that could facilitate intervention

Smith Gueye et al. BMC Public Health 2014, 14:1190 Page 11 of 16http://www.biomedcentral.com/1471-2458/14/1190
targeting does not flow back down to district programs.Vector control data is also kept separate from casedata, preventing comprehensive analysis of all programactivities.Across all regions, spending on M/M&E declined bet-
ween 2009 and 2011. The percentage of spending inKunene dropped from 13.9% to 10.4%, respectively, whilethat in Ohangwena (13.4% to 8.7% respectively) and Omu-sati (11.6% to 6.7% respectively) decreased by a slightlylarger degree. Key informants cited insufficient personneland time for completing M&E activities, relegating recordkeeping to a lower priority and resulting in incompletereporting of patient register data. Management and super-vision activities were also constrained; quarterly super-visory visits by regional officials to health facilities usuallyonly occurred once a year.
Cross borderHigher malaria caseloads in the regions adjacent toAngola are partially attributable to the fluid movement ofpeople across the border. Angolans are believed to crossinto Namibia to access healthcare because of poorlyequipped and staffed facilities in Angola, resulting fromthe long running civil war. Crossing the border is easy andlegal—a border resident card grants access to areas within60km of the border without a passport to residents alongthe border in both countries [25]. While Ohangwena andOmusati have official border crossing posts, the border isporous and can be crossed at any point.According to key informants, most malaria cases in the
three study regions are believed to originate from Angola,but official statistics do not exist for the study period.Angolan patients may provide incorrect contact informa-tion, possibly to pay a lower hospital admission fee, whichmakes case follow up and active case detection notfeasible although still very important. In addition, manyAngolan villages have the same names as Namibian vil-lages, so nurses may incorrectly assume that patients livein Namibia. Thus, key informants reported the need tosynchronize malaria program activities with their Angolancounterparts. However, key informants in all regions re-ported communication difficulties due to language bar-riers and a lack of awareness of the Angolan guidelines formalaria case confirmation and management.The Trans-Kunene Malaria Initiative (TKMI) aims to
address these issues and increase coordination betweenthe Namibian and Angolan malaria programs. TKMI is acollaboration between the governments of Namibia andAngola that aims to reduce malaria cases in five borderregions: Ohangwena, Omusati and Kunene in Namibia;and Cunene and Namibe in Angola. In Namibia, TKMIwould facilitate national elimination by helping to re-duce malaria importation. In Angola, TKMI would helpto strengthen malaria control in the south of the
country, laying the groundwork for increased control ofmalaria in the north where transmission is even higher.The Namibian and Angolan Ministers of Health jointly
developed a concept paper in 2009 and signed a Memo-randum of Understanding on April 25, 2011 [26]. The firstTKMI stakeholder meeting took place in April 2011,which established the national coordinating structures inboth countries, and the first joint activities – LLIN distri-bution and synchronized IRS – took place later that year.Comprised of representatives from both country’s mal-
aria programs (at district and regional/provincial levels),NGOs, immigration or military divisions, and regionaltechnical advisory bodies, the Management and Coordin-ation Committee is responsible for providing oversight,accountability and coordination. Trade and law enforce-ment bodies are responsible for issuing TKMI identitycards that help vehicles move quickly through borderposts. This committee also directs the operations and thedevelopment of the Technical Committee, which is re-sponsible for ground operations and the development ofoperational and research plans, including behavior changecommunication campaigns, surveillance/monitoring andevaluation, data management and reporting, and GIS andmapping. In addition, the Technical Committee is taskedwith developing proposals for resource mobilization andwork tools, such as strategic frameworks, guidelines,policies, assessments, and surveys.On August 14, 2012 Angolan and Namibian Ministers
of Health met and signed the Ondjiva Declaration onthe Trans-Kunene Malaria Initiative during the secondannual stakeholder meetings [27], which emphasized theneed for resource mobilization and formation of part-nerships at regional, provincial and district levels inorder to accelerate universal coverage along the com-mon border through IRS, LLIN distribution, case man-agement, and social mobilization.Although TKMI was formalized in 2009, imple-
mentation did not occur until 2011. TKMI activitieshad occurred only in Ohangwena until expansion intoOmusati in 2013, and have primarily focused on LLINdistribution carried out by an NGO partner; distributionhas been slower on the Angolan side. In addition, IRSworkers have traveled to Angola to observe their vectorcontrol activities, and Angolan workers have partici-pated in IRS trainings in Ohangwena. In Kunene andOmusati, activities have not yet been synchronized withAngola and many key informants were not aware of theexistence of TKMI.Monitoring of cross-border activities—the responsibi-
lity of the regional program, with little to no involve-ment of district programs—has been hampered by a lackof resources and personnel. One position for an En-vironmental Health Assistant at the Oshikango bordercrossing in Ohangwena was only filled in 2013; similar

Smith Gueye et al. BMC Public Health 2014, 14:1190 Page 12 of 16http://www.biomedcentral.com/1471-2458/14/1190
positions in Omusati have yet to be filled. There is cur-rently no such dedicated position in Kunene.
DiscussionFrom 2001 to 2011, total reported malaria cases inNamibia declined by 97.4% and API declined from 421.6to 10.8. NVDCP key informants have attributed some ofthis reduction to the introduction of RDTs for more ac-curate malaria diagnosis and reporting. In the threestudy regions—Kunene, Ohangwena and Omusati—declines in malaria program spending from 2009 to 2011mirrored similar decreases in regional APIs over thesame time period. The sharpest decline in API (96.5%)and spending (53.3%) occurred in Ohangwena; the smal-lest decreases in API (56.7%) and spending (24.4%) wereobserved for Omusati.IRS and LLIN distribution remain the primary vector
control strategies of the NVDCP and accounted for a largeand increasing proportion of malaria program expendi-tures. By 2011, vector control and prevention accountedfor 45% to 58% of total malaria program expenditures inthe three study regions. Total population coverage of IRSwas fairly low, but the programme covered the majority ofthe target population. LLIN coverage averaged 32% acrossthe study regions in 2011. Key informants cited a varietyof operational constraints, including the misunderstan-ding, misuse, or refusal of LLINs, and for IRS, lack oftraining, shortages of personnel, logistical difficulties du-ring the rainy season, and low community acceptability.To improve IRS implementation, the NVDCP plans tointroduce Geographic Information Systems (GIS) softwarethat enable better tracking of structures sprayed [18]. Be-cause of the primary vector’s tendency to feed and restboth indoors and out, the effectiveness of IRS and LLINsmust be closely monitored. Insecticide susceptibility testscarried out in 2002–2004 indicated that An. arabiensisis still highly sensitive to both DDT and deltamethrin(resulting in 98-100% mortality) [28]. However, alternativevector control methods such as personal protective gearor cattle spraying may need to be explored [29].While Namibia has a national goal for elimination by
2020, the relatively low spending on surveillance acti-vities suggests that the transition of the program fromcontrol to elimination is still in the early stages: by 2011,spending on surveillance was 4% to 12% of total expen-ditures across study regions. Passive case detection inthe public sector is the primary method, and active casedetection is in the planning stages [18]. Experiences inother countries (e.g. Sri Lanka, the Philippines) suggestthat the proportion of expenditures on surveillance willincrease while other costs, such as vector control, willdecline, as malaria elimination progresses [30,31]. InNamibia, major surveillance challenges remain, inclu-ding reporting delays and inconsistent case investigation
practices. To achieve zero transmission, case originsshould be determined through comprehensive investiga-tions followed by reactive case detection to find otherinfections, including asymptomatic infections that wouldnot otherwise be identified [3,32]. These surveillancemethods are needed to better target clusters of infectionand high-risk populations. The GFATM Rolling Con-tinuation Channel (RCC) Phase II Grant in Namibia isallocated mostly to surveillance service delivery, com-prising 49% of the new grant [33]. New surveillanceguidelines were drafted at the end of 2013 that seek toaddress these gaps in the program.To date, the NVDCP has not clearly defined the groups
targeted for malaria control activities. For example, forIRS the current goal is to achieve 95% coverage in themoderate endemic regions and 100% in identified foci inthe low transmission regions [18], without further guide-lines for at-risk populations. Given numerous operationalconstraints documented and the relatively low coverage ofvector control interventions, the program may benefitfrom evidence-based targeting of at-risk populations,leading to more efficient use of resources [31,34]. Inthe three study regions, mobile populations along thenorthern border zone and pastoral populations who donot benefit from standard IRS or LLINs have not beeneffectively targeted for malaria surveillance and case man-agement. New technical solutions may be helpful, inclu-ding LLINs better suited for mobile individuals, anexample of which is the usage of long-lasting insecticidetreated hammocks in the forests of Cambodia [35]. Im-proved screening methodologies, such as network-basedsampling, could be more effective and efficient in iden-tifying infections in mobile populations [36]. Additionalcommunity engagement could help to foster acceptabilityof vector control measures and willingness to participatein malaria screening.Across the study regions, references to improved human
resources management were common, particularly withrespect to staffing shortages, inadequate training, and moreregular supervision. The percentage of spending on per-sonnel decreased across from an average of 68% in 2009 to59% in 2011. In contrast, expenditure studies in other eli-minating countries show a trend toward a greater pro-portion of spending on personnel during the CLM phase[30,31], through the elimination phase, and into preventionof reintroduction after elimination is achieved [31]. Ad-ditional capacity building may improve the quality of diag-nosis and treatment and IRS. The program is currentlyadding new team members for surveillance, clinical mal-aria, and vector control. In addition to needs for greaterhuman resources, greater communication and coordi-nation across program levels and partners is needed; manyregional- and district-level key informants were not awareof TKMI, the major cross-border initiative with Angola.

Smith Gueye et al. BMC Public Health 2014, 14:1190 Page 13 of 16http://www.biomedcentral.com/1471-2458/14/1190
Namibia lies between diverse malaria transmissionzones—Angola to the north is considered endemic whileSouth Africa to the south and Botswana to the east havevery low transmission. Of a number of southern Africanregional malaria initiatives designed to address cross-bordertransmission, only one, the Lubombo Spatial DevelopmentInitiative (LSDI, involving Swaziland, South Africa, andMozambique) has reported some successes [37]. Namibia iscurrently involved in three regional initiatives: theTKMI, the Trans-Zambezi Malaria Initiative (TZMI,involving Angola, Botswana, Namibia, Zambia, andZimbabwe) [38] and the Elimination Eight (E8, invol-ving the eliminating countries of Botswana, Namibia,South Africa, and Swaziland, and their northern neighborsAngola, Mozambique, Zambia, and Zimbabwe) [39]. Des-pite securing commitments from all participating countries,TZMI and E8 have not yet coordinated any border-focusedactivities, and coordinated activities for TKMI have onlyjust recently begun in 2011. Given the high level of politicalcommitment to these regional initiatives, it is hopeful thatthey will contribute to the reduction of malaria importationinto Namibia and help the NVDCP to reach malariaelimination.
LimitationsThe results of this case study should be interpreted inlight of several caveats. Results are based on a small, se-lect sample of regions and cannot be generalized to re-flect the program strategies, activities, or expendituresfor other regions or for the country as a whole. Whenthere was a NVDCP representative present during inter-views, key informants may have responded to questionsdifferently than if unsupervised. Costs incurred by part-ner organizations or private sector health facilities werenot included in the expenditure data, nor were house-hold expenditures on malaria.
ConclusionsAs Namibia moves toward malaria elimination, there aremany operational constraints that must be addressed. Inaddition to allocating sufficient human resources to vec-tor control activities, developing a greater emphasis onsurveillance is central to the ongoing program shift fromcontrol to elimination, particularly in light of the malariaimportation challenges experienced in the northern borderregions. Steps toward building more robust surveillance isalready underway, enabled by additional GFATM fundingand matching domestic financing resources [22]. Buildingskills and processes for case management and its super-vision was a priority in 2012 and 2013. The NVDCP plansto increase the number and capacity of surveillanceofficers and clinical mentors in malarious regions, developsurveillance guidelines to standardize case investigation,active case detection, and reporting indicators, and
improve the M&E structure by linking the different datacapture systems and conducting data analysis [18]. Whileoverall program resources may continue on a downwardtrajectory, the program will be well positioned to activelyeliminate the remaining foci of malaria if greater resourcesare allocated toward surveillance efforts.
Appendix AMap of P. falciparum transmission and predictions ofreceptive PfPR2–10Three previously described criteria were used to definethe limits of stable malaria transmission in Namibia [40].These were: the suitability of ambient temperature; arid-ity; and medical intelligence. The resulting map classifiedareas in Namibia into those that are unsuitable for trans-mission (dark grey), those that support unstable transmis-sion (light grey) and areas of stable transmission (the restof the country).In 2011, village-level data on mass blood examinations
undertaken between 1967–1992 were assembled frommonthly and annual reports of the parasitology depart-ment at the National Institute of Tropical Diseases(NITD) at Tzaneen, South Africa. Information on villagename, month and year of the survey, number of peopleexamined, number positive for P. falciparum, and the agerange of the surveyed community were extracted. Thelongitude and latitude of all survey locations were sub-sequently identified using a variety of digital place namedatabases, gazetteers, and a settlement database mappedusing Global Positioning Systems (GPS) receivers. Model-based Bayesian geostatistical methods were used to mapcontinuous surfaces of malaria risk at 5 × 5 km spatialresolution for the years 1969, 1974, 1979, 1984 and 1989within the limits of stable transmission [9]. These werethen combined to generate a single map of maximummean PfPR2–10 at each grid location. The mean maximumPfPR2–10 was computed for each health district and usedto classify these geographic units by PfPR2–10 receptiverisks [13].
Research team and reflexivityThe following authors (along with their credentials andpositions at the time the research was undertaken) con-ducted the key informant interviews:
� CL (MHP) is a malaria program health specialistthat supports the NVDCP;
� MG (BA) is a research assistant with past experienceworking with Namibia’s Ministry of Health andSocial Service and NVDCP
CL underwent a four-day training prior to the com-mencement of research activities. All interview guides,data tracking forms, and data processing procedures

Smith Gueye et al. BMC Public Health 2014, 14:1190 Page 14 of 16http://www.biomedcentral.com/1471-2458/14/1190
were pre-tested in the Oshikoto region before being ad-ministered in the study regions. CL subsequently trainedMG in study and interview protocols when data collec-tion activities were launched.With assistance from NVDCP national-level manage-
ment, interviewers were introduced to potential key in-formants at regional- and district-level offices in theselected provinces. The NVDCP also provided letters ofintroduction authorizing the research to take place andto facilitate introductions to local program offices. Re-searchers introduced themselves and explained the ob-jectives of the study to each potential study participant.For key informants who provided verbal informed con-sent to participate in the study, interviewers noted theircurrent and former position in relation to the malariaprogram.
Study designThe design of the case study was based on a groundedtheory approach to elicit success factors and challengesthat the malaria control program has encountered in itstransition from malaria control to elimination. In this ef-fort, financial resources were identified as one key dimen-sion of understanding the constraints (or lack thereof)under which program choices were made. At each officeor site visit, additional data regarding program expendi-tures, epidemiological indicators, or intervention coveragewere collected for the selected sample years. Each inter-view was conducted by at least two researchers; all wereconducted in English and audio-recorded. Interviewslasted from 30 minutes to three hours, depending on theparticipant’s degree of knowledge and experience. Writtennotes taken during the interview were then combined withaudio recordings for later data analysis.A coding scheme was developed to categorize inter-
view content into themes, which were pre-defined basedon past research experience in conducting other casestudies in this series. After discussions with GN and JL,interview content was reviewed and categorized by MG.
Expenditure calculationsPersonnel expenditures reflect salary amounts for eachemployee; information on benefits was not comprehen-sively available. Percent time spent on malaria activitieswas estimated based on the estimated malaria burden ineach district from 2009 to 2011 (i.e. the proportion of re-ported malaria cases among reported febrile patients) perstandard operating procedures of the NVDCPa combinedwith first-hand knowledge of the job responsibilities foreach employee (e.g. medical director, nurse, spray man).Time allocations across activity types (e.g. M&E, surveil-lance) were estimated based on a combination of Ministryof Health and Social Services national policy guidelines,terms of references, and key informant responses.
Expenditures for consumables used in diagnosis andtreatment were calculated based on a standard formula ofsupplies required to perform one blood smear at prevailingpurchase prices and the number of blood smears con-ducted. Drug quantities were obtained from the CentralMedical Store and regional pharmacists. Omusati drugquantities were incorporated within Oshana region’s drugexpenditures, so a ratio of Omusati malaria cases toOshana cases was applied to calculate Omusati’s costs forRDTs, artemether lumefantrine, quinine, and sulfadoxinepyrimethamine. Insecticides and other equipment usedduring vector control activities were obtained from theNVDCP and regional environmental health officers. LLINsand spray equipment were assumed to have a greater thanone year useful life; thus, straight line depreciation was uti-lized with a 3% discount rate and a three year and five yearuseful life, respectively. When calculating coverage ofLLINs, each net was assumed to cover two persons forthree years.Expenditures for health office utilities and mainten-
ance were collected at regional administrative offices.For months where no receipt of expenditure could befound, either on its own or within another month’s bill,an average was calculated and added to the a Fever is anindicator that is recorded in each health facility registryand is used as a proxy for total healthcare burden per fa-cility, per health district. This proportion is used tomeasure performance regionally, nationally, and for ex-ternal evaluation with donors like the Global Fund.yearly amount. The estimated commercial value of realestate was not captured, as reliable estimates could notbe obtained from key informants and records were notavailable at health offices. Values of capital equipmentfor furniture, computers, and microscopes were notavailable in all regions, but estimates of vehicles used byprogram activities were estimated based on useful lifeyears remaining and current resale value. For each re-gion, a vehicle master list was obtained that includedyear, make, and model, as well as the region’s main pur-pose for each vehicle. Assuming the year of the vehicleto be the purchased year, current value was depreciatedto find a base year cost. From there, straight line depre-ciation using a 3% discount rate and useful life of tenyears was applied to find the depreciated yearly value foreach sample year. To determine the number of hoursthe vehicle was used specifically for malaria control, theaverage personnel time spent on malaria was used as anestimate of percent time spent on malaria, and activityallocation was determined by the vehicle’s main purpose.
AbbreviationsACT: Artemisinin combination therapy; API: Annual parasite index;CLM: Controlled low-endemic malaria; DDT: Dichloro-diphenyl-trichloroethane; DSP: Directorate of Special Programmes; E8: Elimination 8;EHO: Environmental Health Officer; GFATM: Global Fund to Fight AIDS,

Smith Gueye et al. BMC Public Health 2014, 14:1190 Page 15 of 16http://www.biomedcentral.com/1471-2458/14/1190
Tuberculosis and Malaria; GIS: Geographic Information Systems; HIS: Healthinformation system; HIV/AIDS: Human immunodeficiency virus/Acquiredimmunodeficiency syndrome; IEC: Information, education, and communication;IRS: Indoor residual spraying; ITN: Insecticide-treated net; LLIN: Long-lastinginsecticide-treated net; M/M&E: Management/Monitoring and Evaluation;MoHSS: Ministry of Health and Social Services; NGO: Non-governmentalorganization; NIP: National Institute of Pathology; NVDCP: National Vector-borneDiseases Control Programme; PAR: Population at risk; Pf: Plasmodium falciparum;PfPR2–10: Plasmodium falciparum parasite rate (for age range 2–10 years);PPY: Per population at risk per year; RDT: Rapid diagnostic test; SP: Sulfadoxinepyramethamine; TKMI: Trans-Kunene Malaria Initiative; TZMI: Trans-ZambeziMalaria Initiative.
Competing interestsCSG, JL, and GN work at the Global Health Group (GHG) of the University ofCalifornia, San Francisco (UCSF), CA, USA. The Global Health Group exists in partto support global, regional, and country efforts to achieve evidence-basedmalaria elimination. The Global Health Group is a sponsor of the secretariat ofthe Elimination 8, a southern Africa regional malaria initiative. CL is an employeeof the Clinton Health Access Initiative (CHAI) who is seconded to the NamibiaNational Vector-borne Diseases Control Programme to provide technicalassistance to their malaria program and is part of the Southern Africa MalariaElimination Support Team, a collaboration that is jointly supported by the UCSFGHG and CHAI. PU is the Director of the NVDCP’s malaria program. The findingsand conclusions in this paper are those of the authors and do not necessarilyrepresent the views of their employing organizations or of the sources offunding.
Authors’ contributionsCSG and JL conceived of the idea and designed the study methods andinstruments. CL and MG collected the data. CSG, MG, GN, and JL analyzedthat data and wrote the manuscript. CL and PU provided comments onmanuscript drafts. All authors read and approved the final manuscript.
AcknowledgmentsThe Global Health Group’s Malaria Elimination Initiative is supported bygrants from the Bill and Melinda Gates Foundation. The authors declare thatno funding bodies had any role in study design, data collection and analysis,decision to publish, or preparation of the manuscript. The correspondingauthor, CSG, confirms that she had final responsibility for the decision tosubmit for publication. The authors also wish to acknowledge with thanksDr. Abdisalan Noor for developing Figure 1 for this manuscript.
Author details1UCSF Global Health Group, San Francisco, CA, USA. 2Clinton Health AccessInitiative, Boston, MA, USA. 3Namibia National Vector-borne Diseases ControlProgramme, Windhoek, Namibia. 4UCSF Global Health Sciences, 550 16thStreet, 3rd Floor, UCSF Mail Stop 1224, San Francisco, CA, 94158USA.
Received: 24 March 2014 Accepted: 10 November 2014Published: 20 November 2014
References1. World Health Organization: World Malaria Report 2012. Geneva; 2012.
http://www.who.int/malaria/publications/world_malaria_report_2012/en/].Accessed 23 October 2013.
2. Bousema T, Griffin JT, Sauerwein RW, Smith DL, Churcher TS, Takken W,Ghani A, Drakeley C, Gosling R: Hitting hotspots: spatial targeting ofmalaria for control and elimination. PLoS Med 2012, 9:e1001165.
3. Sturrock HJW, Hsiang MS, Cohen JM, Smith DL, Greenhouse B, Bousema T,Gosling RD: Targeting asymptomatic malaria infections: activesurveillance in control and elimination. PLoS Med 2013, 10:e1001467.
4. Government Republic of Namibia National Planning Commission: Namibia2011 Population and Housing Census, Preliminary Report. Windhoek; 2012.
5. DaSilva J, Garanganga B, Teveredzi V, Marx SM, Mason SJ, Connor SJ:Improving epidemic malaria planning, preparedness and response inSouthern Africa. Malar J 2004, 3(1):37.
6. Coetzee M, Craig M, le Sueur D: Distribution of African malaria mosquitoesbelonging to the Anopheles gambiae complex. Parasitol Today 2000,16(2):74–77.
7. Government Republic of Namibia Ministry of Health and Social ServicesNational Vector-borne Diseases Control Programme: Malaria Annual Report2012/2013. Windhoek: Ministry of Health and Social Services, GovernmentRepublic of Namibia; 2013.
8. Coetzee M: Malaria and dengue vector biology and control in Southernand Eastern Africa. In Bridging Laboratory and Field Research for GeneticControl of Disease Vectors. Edited by Knols BGJ, Louis C. The Netherlands:Springer; 2006:101–109.
9. Noor AM, Alegana VA, Kamwi RN, Hansford CF, Ntomwa B, Katokele S, SnowRW, Yukich J: Malaria control and the intensity of Plasmodium falciparumtransmission in Namibia 1969–1992. PLoS One 2013, 8(5):e63350.
10. Cohen JM, Moonen B, Snow RW, Smith DL: How absolute is zero? Anevaluation of historical and current definitions of malaria elimination.Malar J 2010, 9:213.
11. The World Bank: World Development Indicators 2012: Namibia.Washington, DC;2012. http://data.worldbank.org/country/namibia. Accessed 15 July 2013.
12. Alegana VA, Atkinson PM, Wright JA, Kamwi R, Uusiku P, Katokele S, SnowRW, Noor AM: Estimation of malaria incidence in northern Namibia in2009 using Bayesian conditional-autoregressive spatial-temporal models.Spat Spatiotemporal Epidemiol 2013, 7:25–36.
13. Noor AM, Uusiku P, Kamwi RN, Katokele S, Ntomwa B, Alegana VA,Snow RW: The receptive versus current risks of Plasmodium falciparumtransmission in Northern Namibia: implications for elimination. BMCInfect Dis 2013, 13:184.
14. Government Republic of Namibia Ministry of Health and Social Services:Central Medical Store About Us. Windhoek; 2013. http://www.cms-namibia.com/AboutUs/AboutUs/tabid/1944/language/en-US/Default.aspx. Accessed23 October 2013.
15. The Global Fund to Fight AIDS, Tuberculosis and Malaria: NMB-202-G03-M-Namibia. http://portfolio.theglobalfund.org/en/Grant/Index/NMB-202-G03-M-00. Accessed 23 October 2013.
16. The Global Fund to Fight AIDS, Tuberculosis and Malaria: NMB-607-G06-M-Namibia. http://portfolio.theglobalfund.org/en/Grant/Index/NMB-607-G06-M.Accessed 21 October 2013.
17. Southern African Regional Network Secretariat: Roll Back Malaria PressRelease. Oshakati; 2012. https://tis.sadc.int/english/sarn/news-and-events/press-release/namibia-commemorates-2012-world-may-day/. Accessed 25November 2014.
18. Government Republic of Namibia Ministry of Health and Social ServicesNational Vector-borne Diseases Programme: Malaria Strategic Plan 2010–2016.Windhoek; 2010.
19. Integrated Environmental Consultants Namibia (IECN): Let’s Act To Adapt:Dealing with Climate Change. Kunene: 2011. http://www.met.gov.na/AAP/TechnicalStudies/CCALeadershipTraining/Documents/Kunene%20toolkit-web.pdf. Accessed 29 October 2013.
20. Integrated Environmental Consultants Namibia (IECN): Natse Otweya: Dealingwith Climate Change. Omusati; 2008. http://www.met.gov.na/AAP/Downloads/Natse%20Otweya%20Book%20Insides.pdf. Accessed 29 October 2013.
21. Integrated Environmental Consultants Namibia (IECN): Let’s Act To Adapt:Dealing with Climate Change. Ohangwena, Oshana and Oshikoto Regions;2011. http://www.met.gov.na/AAP/TechnicalStudies/CCALeadershipTraining/Documents/Ohangwena,%20Oshana%20and%20Oshikoto%20Toolkit-web.pdf. Accessed 19 February 2014.
22. The Society for Family Health: Maternal and Child Health, Malaria.http://www.sfh.org.na/the-malaria-prevention-programme/. Accessed 25November 2014.
23. Lourenco C, Uusiku P, Haidula L, Kandula D, Ward A, Cohen J: ImprovingMalaria Diagnosis and Appropriate Treatment Through AdaptableTraining Interventions in Namibia [abstract]. In American Society of TropicalMedicine and Hygiene. 2013.
24. Government Republic of Namibia Ministry of Health and Social Services:Namibia Health Facility Census (HFC) 2009. Windhoek; 2011. http://www.measuredhs.com/pubs/pdf/SPA16/SPA16.pdf. Accessed 23 October 2013.
25. International Organization of Migration: Namibia to Introduce Border ResidentCards. Tanzania; 2013. https://www.iom.int/cms/en/sites/iom/home/news-and-views/press-briefing-notes/pbn-2013/pbn-listing/namibia-to-introduce-border-resi.html. Accessed 23 October 2013.
26. World Health Organization Regional Office for Africa: WHO Namibia andAngola Welcomes Historical Cross Border Agreement to Close the net onMalaria. Ondjiva; 2011. http://www.afro.who.int/en/media-centre/pressreleases/item/2921-who-namibia-and-angola-welcomes-historical-

Smith Gueye et al. BMC Public Health 2014, 14:1190 Page 16 of 16http://www.biomedcentral.com/1471-2458/14/1190
cross-border-agreement-to-close-the-net-on-malaria.html. Accessed24 November 2013.
27. Roll Back Malaria: Annual Trans-Kunene Malaria Initiative (TKMI) StakeholdersMeeting. Gaborone, Botswana; 2012. http://www.rbm.who.int/countryaction/docs/sarn/TKMIstakeholdersMeeting2012.pdf. Accessed 24 November 2013.
28. Ntomwa BN, Usuku P, Govere JN, Manga L, Koekemoer LL, Hunt RH,Coetzee M: Distribution of members of the Anopheles gambiae Giles s.l.complex in Namibia and susceptibility to insecticides used for malariacontrol. Afr Entomol 2006, 14(2):404–406.
29. Mahande AM, Mosha FW, Mahande JM, Kweka EJ: Role of cattle treatedwith deltamethrine in areas with a high population of Anophelesarabiensis in Moshi, Northern Tanzania. Mal J 2007, 6:109.
30. Abeyasinghe RR, Galappaththy GNL, Smith Gueye C, Kahn JG, FeachemRGA: Malaria control and elimination in Sri Lanka: documenting progressand success factors in a conflict setting. PLoS One 2012, 7(8):e43162.
31. Liu JX, Newby G, Brackery A, Smith Gueye C, Candari CJ, Escubil LR,Vestergaard LS, Baquilod M: Determinants of malaria programexpenditures during elimination: case study evidence from selectprovinces in the Philippines. PLoS One 2013, 8(9):e73352.
32. Moonen B, Cohen JM, Snow RW, Slutsker L, Drakeley C, Smith DL,Abeyasinghe RR, Rodriguez MH, Maharaj R, Tanner M, Targett G:Operational strategies to achieve and maintain malaria elimination.Lancet 2010, 376(9752):1592–1603.
33. The Global Fund to Fight AIDS, Tuberculosis and Malaria: RCC Phase IIMalaria: CCM Request for Renewal-Namibia. http://portfolio.theglobalfund.org/en/Country/Index/NAM. Accessed 19 February 2014.
34. Snow RW, Guerra CA, Mutheu JJ, Hay SI: International funding for malariacontrol in relation to populations at risk of stable Plasmodium falciparumtransmission. PLoS Med 2008, 5(7):e142.
35. Sochantha T, Van Bortel W, Sovannaroth S, Marcotty T, Speybroeck N,Coosemans M: Personal protection by long-lasting insecticidal hammocksagainst the bites of forest malaria vectors. Trop Med Int Health 2010,15(3):336–341.
36. Koita K, Novotny J, Kunene S, Zulu Z, Ntshalintshali N, Gandhi M, Gosling R:Targeting imported malaria through social networks: a potential strategyfor malaria elimination in Swaziland. Malar J 2013, 12(1):219.
37. Lubombo Spatial Development Initiative, Maputo Province: Annual Report2009. Mozambique; 2009.
38. The Global Fund to Fight AIDS, Tuberculosis and Malaria: Zambezi RegionLaunches Effort to Eliminate Malaria. Zambia; 2013. http://www.theglobalfund.org/en/mediacenter/newsreleases/2013-04-25_Zambezi_Region_Launches_Effort_to_Eliminate_Malaria/. Accessed 24 November 2013.
39. Malaria Elimination Group: Elimination 8 Concept Paper. Windhoek; 2009.http://www.malariaeliminationgroup.org/sites/default/files/Elimination_8_Ministerial_Meeting_Concept_Paper.pdf. Accessed 14November 2013.
40. Snow RW, Amratia P, Kabaria CW, Noor AM, Marsh K: The changing limitsand incidence of malaria in Africa: 1939–2009. Adv Parasitol 2012,78:169–262.
doi:10.1186/1471-2458-14-1190Cite this article as: Smith Gueye et al.: Namibia’s path toward malariaelimination: a case study of malaria strategies and costs along thenorthern border. BMC Public Health 2014 14:1190.
Submit your next manuscript to BioMed Centraland take full advantage of:
• Convenient online submission
• Thorough peer review
• No space constraints or color figure charges
• Immediate publication on acceptance
• Inclusion in PubMed, CAS, Scopus and Google Scholar
• Research which is freely available for redistribution
Submit your manuscript at www.biomedcentral.com/submit