research article power prediction and technoeconomic...
TRANSCRIPT

Research ArticlePower Prediction and Technoeconomic Analysisof a Solar PV Power Plant by MLP-ABC and COMFAR III,considering Cloudy Weather Conditions
M. Khademi,1 M. Moadel,2 and A. Khosravi3
1Department of Applied Mathematics, Islamic Azad University, South Tehran Branch, No. 209, North Iranshahr Street,Tehran 11365-4435, Iran2Department of Energy Systems Engineering, Islamic Azad University, South Tehran Branch, No. 209, North Iranshahr Street,Tehran 11365-4435, Iran3Islamic Azad University, South Tehran Branch, No. 209, North Iranshahr Street, Tehran 11365-4435, Iran
Correspondence should be addressed to M. Khademi; [email protected]
Received 4 December 2015; Revised 24 January 2016; Accepted 31 January 2016
Academic Editor: Pouria Ahmadi
Copyright © 2016 M. Khademi et al. This is an open access article distributed under the Creative Commons Attribution License,which permits unrestricted use, distribution, and reproduction in any medium, provided the original work is properly cited.
The prediction of power generated by photovoltaic (PV) panels in different climates is of great importance. The aim of this paper isto predict the output power of a 3.2 kWPVpower plant using theMLP-ABC (multilayer perceptron-artificial bee colony) algorithm.Experimental data (ambient temperature, solar radiation, and relative humidity) was gathered at five-minute intervals from TehranUniversity’s PV Power Plant from September 22nd, 2012, to January 14th, 2013. Following data validation, 10665 data sets, equivalentto 35 days, were used in the analysis. The output power was predicted using the MLP-ABC algorithm with the mean absolutepercentage error (MAPE), the mean bias error (MBE), and correlation coefficient (𝑅2), of 3.7, 3.1, and 94.7%, respectively. Theoptimized configuration of the network consisted of two hidden layers. The first layer had four neurons and the second had twoneurons. A detailed economic analysis is also presented for sunny and cloudy weather conditions using COMFAR III software. Adetailed cost analysis indicated that the total investment’s payback period would be 3.83 years in sunny periods and 4.08 years incloudy periods. The results showed that the solar PV power plant is feasible from an economic point of view in both cloudy andsunny weather conditions.
1. Introduction
Photovoltaic cells collect sunlight and convert it to electricalenergy, which is the most convenient way to utilize solarenergy.The performance of a PV panel is strongly dependenton the availability of solar irradiance at the required location,PV panel temperature, and other environmental conditions.Thus, reliable knowledge and understanding of the PVpanels’performance under different operating conditions are of greatimportance for accurate prediction of their energy output andcorrect site selection [1].
In recent years, large numbers of research projects havebeen carried out relating to the prediction of a solar PV sys-tem’s efficiency and optimizing the effective parameters withthe use of artificial intelligence techniques [2]. Some studies
have been done in order to investigate the environmentalfactors which affect the current-voltage (I-V) characteristicsof PV modules based on the simultaneous measurement ofthe open-circuit voltage 𝑉oc as a function of a slowly varyinglight intensity [3]. Bayrakci et al. [4] analyzed the effect oftemperature on the performance of PV modules. There arealso some power efficiency models [5] that can predict thereal dynamic or average performance of a PV system undervariable climatic conditions [6].
The main disadvantage of mathematical modeling isthe dependency of the model’s parameters on operatingconditions; that is, a given set of operating conditions needsa corresponding set of parameters. This weak point largelylimits the application of the model. Additionally, there isno specific mathematical model for the prediction of PV
Hindawi Publishing CorporationInternational Journal of Chemical EngineeringVolume 2016, Article ID 1031943, 8 pageshttp://dx.doi.org/10.1155/2016/1031943
2 International Journal of Chemical Engineering
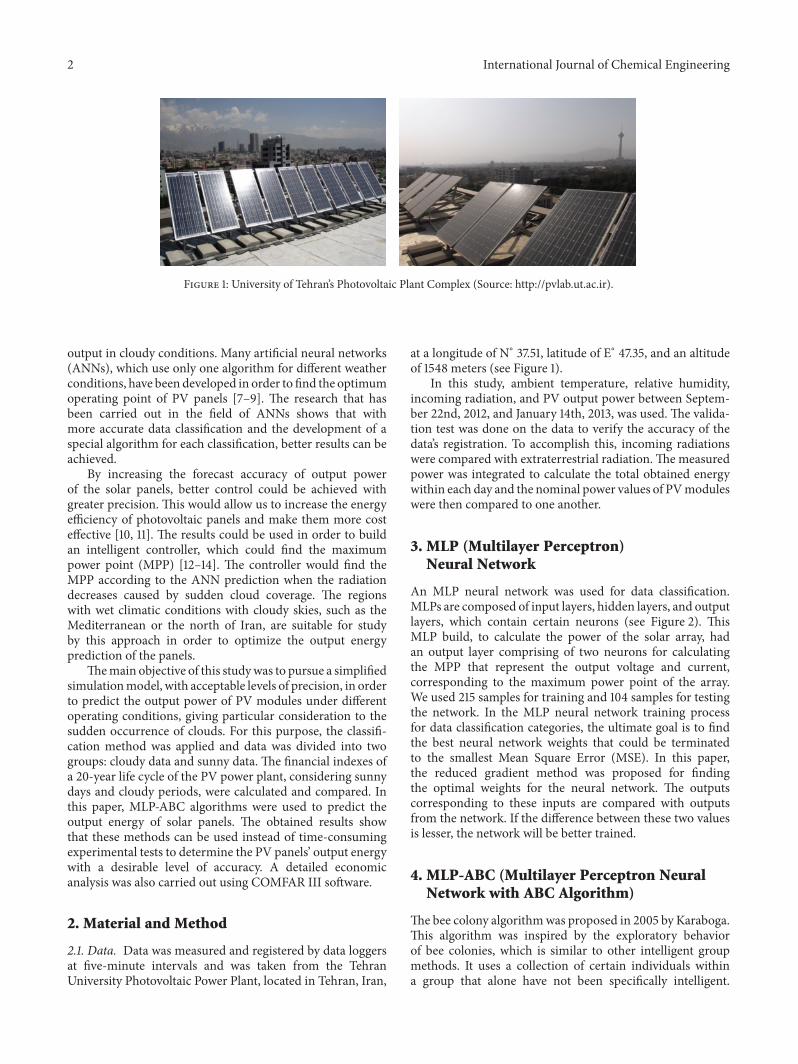
Figure 1: University of Tehran’s Photovoltaic Plant Complex (Source: http://pvlab.ut.ac.ir).
output in cloudy conditions. Many artificial neural networks(ANNs), which use only one algorithm for different weatherconditions, have been developed in order to find the optimumoperating point of PV panels [7–9]. The research that hasbeen carried out in the field of ANNs shows that withmore accurate data classification and the development of aspecial algorithm for each classification, better results can beachieved.
By increasing the forecast accuracy of output powerof the solar panels, better control could be achieved withgreater precision. This would allow us to increase the energyefficiency of photovoltaic panels and make them more costeffective [10, 11]. The results could be used in order to buildan intelligent controller, which could find the maximumpower point (MPP) [12–14]. The controller would find theMPP according to the ANN prediction when the radiationdecreases caused by sudden cloud coverage. The regionswith wet climatic conditions with cloudy skies, such as theMediterranean or the north of Iran, are suitable for studyby this approach in order to optimize the output energyprediction of the panels.
Themain objective of this studywas to pursue a simplifiedsimulationmodel, with acceptable levels of precision, in orderto predict the output power of PV modules under differentoperating conditions, giving particular consideration to thesudden occurrence of clouds. For this purpose, the classifi-cation method was applied and data was divided into twogroups: cloudy data and sunny data. The financial indexes ofa 20-year life cycle of the PV power plant, considering sunnydays and cloudy periods, were calculated and compared. Inthis paper, MLP-ABC algorithms were used to predict theoutput energy of solar panels. The obtained results showthat these methods can be used instead of time-consumingexperimental tests to determine the PV panels’ output energywith a desirable level of accuracy. A detailed economicanalysis was also carried out using COMFAR III software.
2. Material and Method
2.1. Data. Data was measured and registered by data loggersat five-minute intervals and was taken from the TehranUniversity Photovoltaic Power Plant, located in Tehran, Iran,
at a longitude of N∘ 37.51, latitude of E∘ 47.35, and an altitudeof 1548 meters (see Figure 1).
In this study, ambient temperature, relative humidity,incoming radiation, and PV output power between Septem-ber 22nd, 2012, and January 14th, 2013, was used. The valida-tion test was done on the data to verify the accuracy of thedata’s registration. To accomplish this, incoming radiationswere compared with extraterrestrial radiation.The measuredpower was integrated to calculate the total obtained energywithin each day and the nominal power values of PVmoduleswere then compared to one another.
3. MLP (Multilayer Perceptron)Neural Network
An MLP neural network was used for data classification.MLPs are composed of input layers, hidden layers, and outputlayers, which contain certain neurons (see Figure 2). ThisMLP build, to calculate the power of the solar array, hadan output layer comprising of two neurons for calculatingthe MPP that represent the output voltage and current,corresponding to the maximum power point of the array.We used 215 samples for training and 104 samples for testingthe network. In the MLP neural network training processfor data classification categories, the ultimate goal is to findthe best neural network weights that could be terminatedto the smallest Mean Square Error (MSE). In this paper,the reduced gradient method was proposed for findingthe optimal weights for the neural network. The outputscorresponding to these inputs are compared with outputsfrom the network. If the difference between these two valuesis lesser, the network will be better trained.
4. MLP-ABC (Multilayer Perceptron NeuralNetwork with ABC Algorithm)
Thebee colony algorithmwas proposed in 2005 by Karaboga.This algorithm was inspired by the exploratory behaviorof bee colonies, which is similar to other intelligent groupmethods. It uses a collection of certain individuals withina group that alone have not been specifically intelligent.

International Journal of Chemical Engineering 3
No
No
Data in cloudy condition
Yes
Normalization: normalize data and select the desired input parameters
ANN: train MLP-ABC algorithm.And find the best model (this model is special to
cloudy condition)
Start
Enter: radiation, temperature, humidity, wind, current, and voltage
Calculate: extraterrestrial radiation clearness index
Is generated daily power greater than the nominal power?And
does solar radiation less than extraterrestrial radiation?
Yes
Conclusion: compare Model 1 and Model 2
ANN: train MLP-ABC algorithm.And find the best model (this model is special to sunny condition)
ANN: train MLP-ABC algorithm.And find the best model (this model uses all
confirmed data)
Extract test data (15% of all data)
Economic analysis: compare incoming energy in sunny and cloudy condition and calculate the rate of energy loss in cloudy weather
Prep
roce
ssin
g al
gorit
hmA
NN
algo
rithm
Econ
omic
Omit the day
Is clearness index lower than 0.3?And
is solar radiation decrease in a time step and then increase?
Data in sunny condition
Error determination and plotting: calculate RMSE, MBE, and for test dataR2
Figure 2: Data selection method, preparation for feed-forward neural network, and output result.
Both employed and scot bees work together to find thebest solution to the problems. The first one works on thecurrent solution and those around it hoping for an improvedresult. In the case of no acceptable result, an employed beebecomes a scot and tries to look for another solution in areasfarther away. The ABC algorithm is used to solve continuousoptimization problems and find the optimum of a functionor a combination of multiple scalar functions [15]. The mainsteps of the ABC algorithm are used as per Aryan et al. [16].
MLP finds its best weights via a gradient descentapproach, in which they are computed by backpropagationof errors (different between the network outputs and thedesired ones) through the network. However, since it is
a problem of optimization, ABC can be utilized instead ofthe backpropagation approach. In MLP-ABC, weights arecomputed by collection of bee agents. They look for theoptimum combination of weights in the solution space thatresults in the best network for the problem.
In order to apply the MLP-ABC model, input parametersare air temperature (∘C), irradiance (W/m2), and relativehumidity (%) and the output is power. The model consists oftwo hidden layers. The first layer has four neurons and thesecond has two neurons.
4.1. The Underlying Assumption and Data Selection. Deter-mining the cloudiness of the sky requires complex and costly

4 International Journal of Chemical Engineering
Table 1: The statistical classification of cloud database.
Criteria Power (W) Solar radiation(W/m2)
Ambient temperature(∘C) Relative humidity (%)
Average 841 99.8 17.05 44.73Maximum 2724 499.7 30.40 99.9Minimum 0 5.03 −5.1 21.35Standard deviation 718.7 86.3 7.83 18.16
devices. However, as it is well known, the incoming solarradiation is directly related to the level of cloudiness. Theclearness index (𝐾
𝑡) is the criteria (amount of the total
solar radiation on a horizontal surface at the surface ofthe Earth, divided by the corresponding irradiance availableoutside of the atmosphere) for determining the sudden cloudappearances. The key point is that the clear index changesduring a sunny day. For instance, the color index is 0.25 atthe 7:00 solar time, but it becomes 0.65 at the 12:00 solar time.The average of𝐾
𝑡was therefore calculated for different times
in a day. It is assumed that in any given moment, whenever𝐾𝑡becomes 40% lower than the long-term average of𝐾
𝑡, it is
considered that cloud coverage is occurring.As a more precise criterion, if, in a short time period (less
than 5 minutes), the irradiance decreases and then increases,this time period is supposed to be the shade effect on thephotovoltaic panel. This assumption may lead to errors indetermining the correct time of sudden clouds. Dust, fleetingshadows, and other factors could also cause such situations.To minimize this error, both of the above criteria wereused simultaneously. This means that whenever𝐾
𝑡decreases
while the amount of radiation fluctuates, the conditions areconsidered to be cloudy. With regard to this fact, 3,090sets of data demonstrated cloudy conditions. However, sincethe aim was to predict the effect of cloudy conditions ondecreasing irradiance and output of the panel, the assumptionis acceptable.
Table 1 indicates the statistical classification of clouddatabases. Daily data analysis indicates that in days ofclear sky with neither cloud nor dust, solar radiation at12:00 (which is considered as the maximum irradiance thatcould be achieved) varies between 850W and 1100W. Thedata during cloudy days shows the maximum irradianceas 499.7W, which indicates the impact of clouds on theincidental radiation. Consequently, when the irradiance isassociated with abnormal fluctuation, it could be consideredthe result of cloud occurrence over the panel. The idea of thisresearch is not only to forecast the output power and energyof PV panels, but also to build a control system for theseconditions. It could be a great help to optimize output powerof PV panels when sudden cloud coverage occurs.
5. Data Preparation
The data was normalized between 0 and 1 for better networklearning by the following equation:
𝐹 (𝑥) =𝑋 − 𝑋min𝑋max − 𝑋min
, (1)
Table 2: Comparison of results between two conditions (COMFAR’sreport).
Economic index Model #1 Model #2Total fixed investment ($) 150000000 150000000Net present value (NPV) ($)(discounting rate: 4%) 10641,71 9914,05
Internal rate of return (IRR) 35,13% 32,25%Break-even ratio (%) 17.40% 18.29%Normal payback period 3.83 years 4.08 yearsDynamic payback period 4.07 years 4.36 years
where 𝐹(𝑥) indicates the normalized value and 𝑥 indicatesthe actual value. The data was gathered over approximatelyfour months. However, after applying data preprocessing,only 6,895 collections of “sunny” data and 3,090 collectionsof “cloudy” data remained for creating the MLP-ABC and680 pieces of data for the testing of the networks. The meanabsolute percentage error (MAPE) was used to compare themodels. It is a measure of the accuracy of a method forconstructing fitted time series values in statistics, specificallyin trend estimation [17]. It usually expresses accuracy as apercentage which is defined as follows:
MAPE = 1𝑁
𝑁
∑
𝑖=1
(𝑋𝑖−𝑥𝑖)
𝑥𝑖
. (2)
Mean bias error (MBE) and correlation coefficient (𝑅2) werecalculated by the following:
MBE =𝑁
∑
𝑖=1
(𝑋𝑖−𝑥𝑖)
𝑥𝑖
,
𝑅2=
∑𝑁
𝑖=1(𝑥𝑖− 𝑋) (𝑋
𝑖− 𝑋)
(√∑𝑁
𝑖=1(𝑥𝑖− 𝑋)) × (√∑
𝑁
𝑖=1(𝑋𝑖− 𝑋))
.
(3)
6. Economic Analysis
In this case study, the lifetime economic analyses of PVpanelsusing MLP-ABC algorithms for sunny and cloudy periodswere compared.
Net present value (NPV), internal rate of return (IRR),payback period (PBP), and the balance sheet of the projectwere prepared according to accepted standards based on a 20-year useful life. The details can be found in the full version ofCOMFAR’s report; however, a brief summary is presented inTable 2.

International Journal of Chemical Engineering 5
Sales revenueTotal costsFixed costs
×105
0
100
200
300
400
500
600
700
Am
ount
($)
100.00 80.00 60.00 40.00 20.00 0.00120.00Capacity utilization (%)
Figure 3: Break-even analysis for Model #1.
Sales revenueTotal costsFixed costs
×105
0
100
200
300
400
500
600
700
Am
ount
($)
100.00 80.00 60.00 40.00 20.00 0.00120.00Capacity utilization (%)
Figure 4: Break-even analysis for Model #2.
A useful tool in tracking the cash flow of a business isa break-even analysis. This point is important to determinethe price of power in order for the PV to still generate acontribution. The break-even analysis of the investment isperformed to determine how many years it takes to generateenough contribution to cover the fixed and variable costs [18].As the goal is to lower the break-even point and generateprofit, it is important to understand this concept. Figures 3and 4 show the break-even analysis for cloudy periods andsunny days, respectively. In this study, the best efficiencypoints (BEP) for sunny and cloudy periods are 17.40% and18.29%, respectively.
The internal rate of return, or discounted cash flow rateof return, offers analysts a way to quantify the rate of returnprovided by an investment. The COMFAR report shows that
Table 3: The generated error in PV panels’ power prediction usingMLP-ABC.
Model number Model MAPE (%) 𝑅2 (%) MBE (W)
1Sunny andcloudy
(separately)3.7 94.7 3.1
2 All conditionstogether 4.7 83.1 9.5
the project is sufficiently feasible as it generates an IRR of35.13% for sunny days. This is considered an attractive rate ofreturn.The project IRR remains attractive even for the cloudydays as 32.25%. Ultimately, IRR gives an investor the meansto compare alternative investments based on their yield.
The panels’ output power under cloudy conditions wasmeasured and recorded. The effective clouds on the panelwere divided into two categories: (1) clouds that cover the skyand have an effect on the panel for more than 2 hours and (2)parts of clouds that shade the panels for only a moment orseveral minutes (see Figure 5).
7. Results and Discussion
This study proposes an analysis to exhibit what happens whenclouds pass over a solar power plant. The economic analysis,which is presented throughout this study, demonstratesthe economic losses caused by sudden cloud coverage andshadows over the panel.
In this research, the effect of cloudy sky conditionson the energy produced by the panels is investigated. Theenergy generated by the panels during cloudy and sunnyclimatic conditions was separately predicted by artificialneural methods (MLP-ABC).
Two separatemodels were developed in different ways forthe cloudy and sunny weather conditions. Error calculationand the evaluation of results showed that the first modelfor different conditions could significantly reduce errors(Table 3).
As mentioned, a more accurate output energy predictionof PV panels could increase the precision of energy supplyplanning and the design accuracy of control systems. Figures6, 7, 8, and 9 show the output power prediction of PV panelsusing the referred methods.
Figures 6 and 8 show the comparison between thepredicted power by Model 1 and the measured power. Asshown, this model also tracks the fluctuations of the clouds.Looking on a precise level, small fluctuations have occurredin the measured data where the power gets close to itsmaximum level. The developed model faces some difficultiesin tracking these fluctuations. However, these fluctuations arenot caused by cloud or external factors, and their value is verylow. Thus, it is reasonable to ignore it.
Comparisons between Figures 7 and 9 show the effect ofprivatization data in order to reduce errors for sunny andcloudy conditions. The method that was demonstrated inthe economic analysis section was used to determine theenergy loss. Data was collected from September 22nd, 2012,to January 14th, 2013.

6 International Journal of Chemical Engineering
Start
Enter: data in cloudy condition and data in sunny condition
Do overcast conditions take more than 2 hours?
Clouds that cover the skyPieces of clouds shade on the panels for a moment
Calculate: average of power on sunny condition, one hour before and after desired time
Calculate: average of power on sunny condition, three days before and after desired time
End: consider as the power if the panel is not affectedby the cloud
YesNo
Figure 5: The method of determining the amount of power generated if the panel is not affected by clouds.
500 1000 1500 2000 2500 30000Measured power (W)
0
500
1000
1500
2000
2500
3000
Pred
icte
d po
wer
(W)
Figure 6: Output power prediction for Model #1, which selectssunny and cloudy data randomly.
8. Conclusions
In this paper, the output energy of a 3.2 kW PV solarpower plant was predicted using anMLP-ABC algorithm andthe results were compared with the experimental data. Theambient temperature, irradiance on the horizontal surface,and PV power (by multiplying current and voltage) werecollected in the photovoltaic laboratory of Tehran Universitybetween September 22nd, 2012, and January 14th, 2013. 10,665
0
500
1000
1500
2000
2500
3000
0
500
1000
1500
2000
2500
3000
Pow
er (W
)
1 45 89 133 177 221 265 309 353 397 441 485 529 573 617
Data number
Measured powerPredicted power
Figure 7: Output power prediction for Model #1, which selectssunny and cloudy data randomly.
pieces of data were measured at five-minute intervals (overapproximately 35 days) after preprocessing.
To improve the performance of the neural network,the sunny days were separated from the cloudy days. Forclearness index values less than 0.3, the day was considered as

International Journal of Chemical Engineering 7
500 1000 1500 2000 2500 30000Measured power (W)
0
500
1000
1500
2000
2500
3000
Pred
icte
d po
wer
(W)
Figure 8: Output power prediction for Model #2, which selectssunny and cloudy data separately.
Pow
er (W
)
1 45 89 133 177 221 265 309 353 397 441 485 529 573 617Number
Measured powerPredicted power
3000
2500
2000
1500
1000
500
0
Figure 9: Output power prediction for Model #2, which selectssunny and cloudy data separately.
sunny and if radiation fluctuation over a short time intervaloccurred, it was considered as cloudy time.
The output energy was predicted by two methods. Inthe first method, all sunny and cloudy data were used andacceptable results were obtained (MAPE = 4.7%, 𝑅2 = 83.1%,MBE = 9.5). In the second method, forecasting precision wasimproved significantly by separating the sunny and cloudydata (MAPE = 3.7%, 𝑅2 = 94.7%, MBE = 3.1).
The hypothesis was that neural network data classi-fications improve this model’s performance. It has beenconcluded that with the weather forecast and the separationof different weather conditions, output power prediction canbe done more accurately.
Within the period of this study, the solar power plant pro-duced approximately 5237 kWh/year of electricity in sunnyweather conditions and 924 kWh/year in cloudy weatherconditions, with the energy loss due panel shading around293 kWh/year.
The results show that the project is feasible because ofIRRs of 35.13% and 32.25% (for sunny and cloudy periods,resp.). These are considered to be attractive rates of return incapital markets. The investment has a payback period of 3.83years in Model #1 and 4.08 years in Model #2.
Conflict of Interests
The authors declare that there is no conflict of interestsregarding the publication of this paper.
Acknowledgments
This paper is based up on a research work supported bythe Research Council of the Islamic Azad University SouthTehran Branch (Contract no. 812). The authors are alsograteful to Dr. Farzad Jafarkazemi for his academic advicesand Alireza Nikookar and Ahmad Razeghi for their technicalsupport.
References
[1] A. S. Joshi, I. Dincer, and B. V. Reddy, “Performance analysis ofphotovoltaic systems: a review,” Renewable and SustainableEnergy Reviews, vol. 13, no. 8, pp. 1884–1897, 2009.
[2] M. M. Farzad Jafarkazemi, M. Khademi, and A. Razeghi,“Performance prediction of flat-plate solar collectors usingMLPandANFIS,” Journal of Basic andApplied Scientific Research, vol.3, no. 2, pp. 196–200, 2013.
[3] W. Zhou, H. Yang, and Z. Fang, “A novel model for photovoltaicarray performance prediction,” Applied Energy, vol. 84, no. 12,pp. 1187–1198, 2007.
[4] M. Bayrakci, Y. Choi, and J. R. S. Brownson, “Temperaturedependent power modeling of photovoltaics,” Energy Procedia,vol. 57, pp. 745–754, 2014.
[5] W. G. J. H. M. van Sark, “1.02—introduction to photovoltaictechnology,” in Comprehensive Renewable Energy, A. Sayigh,Ed., pp. 5–11, Elsevier, Oxford, UK, 2012.
[6] K. Ishaque and Z. Salam, “A review of maximum power pointtracking techniques of PV system for uniform insolation andpartial shading condition,” Renewable and Sustainable EnergyReviews, vol. 19, pp. 475–488, 2013.
[7] A. Mellita and M. Benghanem, “Sizing of stand-alone photo-voltaic systems using neural network adaptive model,” Desali-nation, vol. 209, no. 1–3, pp. 64–72, 2007.
[8] A. Mellit and S. A. Kalogirou, “Artificial intelligence techniquesfor photovoltaic applications: a review,” Progress in Energy andCombustion Science, vol. 34, no. 5, pp. 574–632, 2008.
[9] A. Mellit and S. A. Kalogirou, “MPPT-based artificial intelli-gence techniques for photovoltaic systems and its implementa-tion into field programmable gate array chips: review of currentstatus and future perspectives,” Energy, vol. 70, pp. 1–21, 2014.
[10] H. Belmili, M. Haddadi, S. Bacha, M. F. Almi, and B. Bendib,“Sizing stand-alone photovoltaic-wind hybrid system: techno-economic analysis and optimization,” Renewable and Sustain-able Energy Reviews, vol. 30, pp. 821–832, 2014.
[11] E. Izgi, A. Oztopal, B. Yerli, M. K. Kaymak, and A. D. Sahin,“Short-mid-term solar power prediction by using artificialneural networks,” Solar Energy, vol. 86, no. 2, pp. 725–733, 2012.
8 International Journal of Chemical Engineering
[12] J. Ma, K. L. Manb, T. O. Tingb, N. Zhangb, S.-U. Guanb, and P.W.H.Wonga, “DEM: direct estimationmethod for photovoltaicximum power point tracking,” Procedia Computer Science, vol.17, pp. 537–544, 2013.
[13] P. Bhatnagar and R. K. Nema, “Maximum power point trackingcontrol techniques: state-of-the-art in photovoltaic applica-tions,” Renewable and Sustainable Energy Reviews, vol. 23, pp.224–241, 2013.
[14] L. L. Jiang, D. R. Nayanasiri, D. L. Maskell, and D. M.Vilathgamuwa, “A hybrid maximum power point tracking forpartially shaded photovoltaic systems in the tropics,” RenewableEnergy, vol. 76, pp. 53–65, 2015.
[15] A. Abraham and B. Nath, “Hybrid heuristics for optimaldesign of artificial neural networks,” in Developments in SoftComputing, vol. 9 of Advances in Soft Computing, pp. 15–22,Springer, Berlin, Germany, 2001.
[16] H. Aryan, M. Khademi, and M. Pedram, “Prediction of photo-voltaic panels output power by usingMLP, RNN and neuroevo-lutionmodels,”Advances in Natural and Applied Sciences, vol. 8,no. 14, pp. 74–81, 2014.
[17] D. T. Larose, Discovering Knowledge in Data, an Introduction toData Mining, John Wiley & Sons, 2005.
[18] O. Ekren, B. Y. Ekren, and B. Ozerdem, “Break-even analysisand size optimization of a PV/wind hybrid energy conversionsystem with battery storage—a case study,” Applied Energy, vol.86, no. 7-8, pp. 1043–1054, 2009.

International Journal of
AerospaceEngineeringHindawi Publishing Corporationhttp://www.hindawi.com Volume 2014
RoboticsJournal of
Hindawi Publishing Corporationhttp://www.hindawi.com Volume 2014
Hindawi Publishing Corporationhttp://www.hindawi.com Volume 2014
Active and Passive Electronic Components
Control Scienceand Engineering
Journal of
Hindawi Publishing Corporationhttp://www.hindawi.com Volume 2014
International Journal of
RotatingMachinery
Hindawi Publishing Corporationhttp://www.hindawi.com Volume 2014
Hindawi Publishing Corporation http://www.hindawi.com
Journal ofEngineeringVolume 2014
Submit your manuscripts athttp://www.hindawi.com
VLSI Design
Hindawi Publishing Corporationhttp://www.hindawi.com Volume 2014
Hindawi Publishing Corporationhttp://www.hindawi.com Volume 2014
Shock and Vibration
Hindawi Publishing Corporationhttp://www.hindawi.com Volume 2014
Civil EngineeringAdvances in
Acoustics and VibrationAdvances in
Hindawi Publishing Corporationhttp://www.hindawi.com Volume 2014
Hindawi Publishing Corporationhttp://www.hindawi.com Volume 2014
Electrical and Computer Engineering
Journal of
Advances inOptoElectronics
Hindawi Publishing Corporation http://www.hindawi.com
Volume 2014
The Scientific World JournalHindawi Publishing Corporation http://www.hindawi.com Volume 2014
SensorsJournal of
Hindawi Publishing Corporationhttp://www.hindawi.com Volume 2014
Modelling & Simulation in EngineeringHindawi Publishing Corporation http://www.hindawi.com Volume 2014
Hindawi Publishing Corporationhttp://www.hindawi.com Volume 2014
Chemical EngineeringInternational Journal of Antennas and
Propagation
International Journal of
Hindawi Publishing Corporationhttp://www.hindawi.com Volume 2014
Hindawi Publishing Corporationhttp://www.hindawi.com Volume 2014
Navigation and Observation
International Journal of
Hindawi Publishing Corporationhttp://www.hindawi.com Volume 2014
DistributedSensor Networks
International Journal of