research article predicting increased blood pressure...
TRANSCRIPT
Research ArticlePredicting Increased Blood Pressure Using Machine Learning
Hudson Fernandes Golino,1 Liliany Souza de Brito Amaral,2
Stenio Fernando Pimentel Duarte,3 Cristiano Mauro Assis Gomes,1 Telma de Jesus Soares,2
Luciana Araujo dos Reis,3 and Joselito Santos3
1 Laboratorio de Investigacao da Arquitetura Cognitiva, Universidade Federal de Minas Gerais, 30000-000 Belo Horizonte,Minas Gerais, MG, Brazil
2 Instituto Multidisciplinar de Saude, Universidade Federal da Bahia, 40000-000 Bahia, BA, Brazil3 Nucleo de Pos-Graduacao, Pesquisa e Extencao, Faculdade Independente do Nordeste, Sao Luıs Avenue, 1305,45000-000 Candeias, Vitoria da Conquista, BA, Brazil
Correspondence should be addressed to Hudson Fernandes Golino; [email protected]
Received 16 August 2013; Revised 12 October 2013; Accepted 16 November 2013; Published 23 January 2014
Academic Editor: Yuichiro Yano
Copyright © 2014 Hudson Fernandes Golino et al. This is an open access article distributed under the Creative CommonsAttribution License, which permits unrestricted use, distribution, and reproduction in any medium, provided the original work isproperly cited.
The present study investigates the prediction of increased blood pressure by body mass index (BMI), waist (WC) and hipcircumference (HC), and waist hip ratio (WHR) using a machine learning technique named classification tree. Data were collectedfrom 400 college students (56.3% women) from 16 to 63 years old. Fifteen trees were calculated in the training group for each sex,using different numbers and combinations of predictors.The result shows that for women BMI,WC, andWHR are the combinationthat produces the best prediction, since it has the lowest deviance (87.42), misclassification (.19), and the higher pseudo 𝑅2 (.43).This model presented a sensitivity of 80.86% and specificity of 81.22% in the training set and, respectively, 45.65% and 65.15% in thetest sample. For men BMI, WC, HC, andWHC showed the best prediction with the lowest deviance (57.25), misclassification (.16),and the higher pseudo 𝑅2 (.46). This model had a sensitivity of 72% and specificity of 86.25% in the training set and, respectively,58.38% and 69.70% in the test set. Finally, the result from the classification tree analysis was compared with traditional logisticregression, indicating that the former outperformed the latter in terms of predictive power.
1. Introduction
Obesity (body mass index > 29.9 kg/m2) has been considereda global public health problem due to its high prevalenceand high morbidity [1]. In fact, the prevalence of obesityhas increased substantially, both in developed and in underdevelopment countries. In the United States, for example, itis estimated that 35.5% of women and 32.2% of adult menpresent obesity [2]. The Brazilian Institute of Geography andStatistics (IBGE) indicates that 50.1% of men and 48% ofwomen have overweight (25 kg/m2 ≤ BMI < 29.9 kg/m2),while 12.4% of men and 16.9% of women are suffering fromobesity in Brazil [3].
Thehigh risk attributed to obesity is related particularly toits association with increased risk factors for cardiovascular
disease, notably hypertension [4, 5]. In order to adoptearly preventive/therapeutic actions to minimize the risk ofcardiovascular events in obese individuals, methods that canpredict hypertension using low cost procedures are necessary,especially in underdeveloped and in developing countries.
Body mass index (BMI), waist circumference (WC), hipcircumference (HC), and waist-hip ratio (WHR) are amongthe most practical and cost effective measures for evaluationof obesity, with the advantage that both WC and WHRpresent positive correlations with the amount of visceral fat,and together effectively predict cardiovascular risk [6, 7].Furthermore, these anthropometric measures are predictorsofmetabolic factors andmultiple health risks [8, 9]. Yong et al.[9] used theROCcurve analysis to verify the predictive powerof WC, WHR, and BMI on blood pressure in 722 Chinese
Hindawi Publishing CorporationJournal of ObesityVolume 2014, Article ID 637635, 12 pageshttp://dx.doi.org/10.1155/2014/637635

2 Journal of Obesity
adults.WC presented a cutoff of 89.05 cm formen (sensibility= 70%, specificity = 42%,𝑃 < 0.001) and 90.90 cm for women(sensibility = 60%, specificity = 67%, 𝑃 < 0.001). Waist-hipratio was not a significant predictor for men (𝑃 = 0.369) orwomen (𝑃 = 0.070), with a cutoff of 0.92 cm for the first(sensibility = 67%, specificity = 54%) and 0.85 cm for thesecond (sensibility = 83%, specificity = 40%). Finally, BMIpresented a cutoff of 23 kg/m2 for men (sensibility = 76%,specificity = 49%, 𝑃 < 0.001) and 23.3 kg/m2 for women(sensibility = 75%, specificity = 59%, 𝑃 < 0.001). Althoughless employed in the study of health conditions related toobesity, hip circumference is pointed as a variable that canincrease the predictive power of the other anthropometricvariables and should be included in the obesity studies [10].It seems that the combination of multiple anthropometricvariables increases the sensibility of the prediction [11, 12].
From the usual methods employed to study the rela-tionship between anthropometric variables and obesity, thereceiver-operating characteristic (ROC) curve analysis is thetechnique used to provide and to verify the quality of thecutoff points. This statistical method is highly recommendedin epidemiological studies [13] because it can describe theaccuracy of a variable to classify people into relevant clinicalgroups. However, the ROC curve methodology is not aninformative technique to evaluate the contribution of an addi-tional variable to the model [14]. The use of the ROC curveanalysis became limited to investigate incremental validity,that is, the improvement in the prediction or in the amountof variance explained when an additional variable entersthe model. Thus, in order to discover the strength of anycombination of WC, HC, andWHR to predict hypertension,it is necessary to employ a statistical method that can providesensitive information about incremental validity.
Health researches could benefit from employing machinelearning techniques to verify the combination of variablesthat best predict a given outcome, as well as to verify theircutoff values. Machine learning is a relatively new sciencefield focused on the construction and study of systemsthat can automatically learn from data [14], generating highaccurate predictive models. Although incipient, machinelearning methods are already in use in the health literature,as in the sustained weight loss study [15], in the evaluationof program cost effectiveness [16], in the obesity prediction[17], in the classification of prostate cancer levels [18], and inthe classification of electronic patient records [19]. In 2013,TheMicrosoftResearchMachine Learning Summit presentednew applications of the machine learning techniques inhealth science, including applications to analyze clinical [20],genetic [21], and medical image data [22].
Among the techniques of machine learning, the clas-sification and regression tree (CART) is of special interestfor health studies, since it is useful: (1) to discover whichvariable, or combination of variables, better predicts a givenoutcome (e.g., presence of increased blood pressure,) and (2)to identify the cutoff values for each variable that maximallypredicts the chosen outcome.
CART is a type of supervised learning technique [14]for recursively partitioning a feature space into several parts
(or nodes), based on the relationship between an outcomevariable and one or more predictors. The recursive binarypartition is used to achieve a solution that divide the featurespace into more pure nodes, that is, into a classificationwith the highest amount of cases with the same condition(e.g., hypertension). In sum, CART works as follows: (1)iteratively split variables into groups; (2) split the data whereit is maximally predictive and (3) maximize the amount ofhomogeneity in each group [23].
Twomain indexes, misclassification and deviance, can beused to indicate the quality of the prediction. Hastie et al. [14]explain how both work: In a nodem, representing region 𝑅
𝑚,
with𝑁𝑚observations, let
𝑝𝑚𝑘=1
𝑁𝑚
∑
𝑥𝑖∈𝑅𝑚
𝐼 (𝑦𝑖= 𝑘) (1)
the proportion of class 𝑘 observations in node𝑚. We classifythe observations in node𝑚 to class (𝑚) = arg max
𝑘𝑝𝑚𝑘, the
majority class in node𝑚. Differentmeasures of node impurity(⋅ ⋅ ⋅ ) include the following:
Misclassification error: (1/𝑁𝑚) ∑𝑖∈𝑅𝑚𝐼(𝑦𝑖= 𝑘(𝑚)) = 1 −
𝑝𝑚𝑘.Cross entropy or deviance: −∑𝐾
𝑘=1𝑝𝑚𝑘
log𝑝𝑚𝑘
(p. 309).Misclassification is the index indicating the total amount
of wrong predictions made or its rate (number of wrongpredictions/total number of cases). Deviance is an index thatis sensible to both the misclassification and the purity of thefeature space partitions. As pointed by Hastie et al. [14] andbyGolino et al. deviance is a better index to compare differentmodels than misclassification, since it is more sensitive tonode purity.
The present study has as the main goal to introduce andto apply themachine learning technique named classificationand regression tree (CART) in the context of increased bloodpressure. The machine learning field is a set of innovativetechniques that provides state-of-the-art predictions in termsof accuracy. CART is becoming popular in different sciencefields since its interpretability is straightforward; the result ofthe prediction is easily understandable by experts of the field;it is applicable to a wide range of problems, can use any kindof variable as predictor, is a nonparametric technique, and issensible to the impact of additional variables in the predictivemodel. Through the application of the CART analysis weexpect to contribute with future studies focusing on theprediction of increased blood pressure by any kind of variable(e.g., genes, daily life habits, biomarkers, etc.). Additionally,we are going to compare the results from the CART analysiswith traditional logistic regression analysis, in terms ofstrength of the prediction (pseudo-𝑅2 and AUC). In thepresent study we will analyze which variable, or combinationof variables (BMI, WC, HC, and WHR), better predictsincreased blood pressure (prehypertension or hypertension)andwhich cutoff values aremaximally predictive of it. Fifteenmodels, or trees, with different number and combination ofpredictors will be compared for each sex, in a training sample.Then, the best tree will be tested in a testing sample for crossvalidation.

Journal of Obesity 3
2. Materials and Methods
2.1. Sample and Measures. The data was collected in a con-venience sample composed of 400 undergraduate students(56.3% women) aged between 16 and 63 years old (mean =23.14 and standard deviation = 6.03), from a private universityof Vitoria da Conquista, Bahia, Brazil. All participants signedan informed consent agreeing to participate in the research.Weight was measured using a digital scale (Model B530,Plebal Plenna Ltda., SP, Brazil), to the closest 0.1 Kg. Heightwas measured using a stiff tape placed vertically on a flatwall, on subjects standing erect and head in the Frankfurtplane [24]. BMI was calculated using these measurements.WC was measured at the midpoint between the lower borderof the rib cage and the iliac crest, and HC was measured atthe greater gluteal curvature, both using a 1.5 meters’ tape(ISP Eletromedica, Brazil), and recorded to the closest 0.1 cm.Blood pressure was measured using a manually inflatableblood pressure monitor (HEM-403INT, Omron Healthcare,Japan). All anthropometric measurements were repeatedthree times (the mean value was used in the data analysis)and were taken by previously trained research assistants.
2.2. Data Analysis. The systolic blood pressure was assessedand the subjects with increased blood pressure were iden-tified. The data were first split into two subsets, onefor each sex. Then, each subset was randomly split intotwo sets (training and testing) with almost the samenumber of people for cross-validation. The dataset isfreely available in a web repository for reproducible pur-poses [25, 26]: (1) women’s dataset can be downloadedat http://dx.doi.org/10.6084/m9.figshare.845664; (2) men’sdataset can be downloaded at http://dx.doi.org/10.6084/m9.figshare.845665. All analyses were made using the tree pack-age [27] from the R software. In the current study the treeclassification procedure was fitted by binary recursive par-titioning using as outcome the presence of increased bloodpressure: at least prehypertension (systolic blood pressure >120.0mmHg) for women and hypertension (systolic bloodpressure > 140.0mmHg) for men. We are not investigatingsystolic hypertension in the weman sample because only 8%of thempresented a systolic blood pressure equal to or greaterthan 140mmHg. When the prevalence of one category ofthe outcome variable is very low, the classification tree fitsa model that only predicts more abundant category. Thisproblem is typical of the machine learning methods, whichsuffer in the presence of unbalanced datasets [28]. Geurts etal. [28] suggest to undersample the majority class in orderto solve the problem, but we decided not to follow theiradvice, since our dataset contains only 18womenwith systolichypertension. To balance the data, by undersampling themajority class (no systolic hypertension), we would havecreated another issue: a very low sample size that wouldpreclude the cross-validation. So, we decided to investigateprehypertension in the women sample, since 42% of thempresented systolic blood pressure greater than 120mmHg.The predictive variables included in the models were BMI,WC, HC, and WHR.
Fifteen random trees were calculated (grown) from thetraining set for each sex, in order to identify which variables,or which combination of variables, were suitable to predictthe presence of increased blood pressure. Each random treehad one or more predictors, as can be seen in Table 2.The quality of each model or tree was verified using themisclassification error rate and deviance. A pseudo 𝑅2 wascalculated for each model, using the following formulae:
Pseudo𝑅2 = 1 − (DevianceSSY) , (2)
where SSY represents the response sum of squares.All the ethical principles contained in the Declaration of
Helsinki were followed in the current study, as well as all theBrazilian specific laws.
3. Results and Discussion
None of the variables employed in the current study pre-sented a normal distribution, as pointed by the Shapiro-Wilk’s test of normality (see Table 1). Men presented a highervalue of systolic blood pressure (median = 130mmHg), BMI(median = 24 kg/m2), WC (median = 84 cm), HC (median =103 cm), and WHR (median = 0.83) than women. The lattershowed the following medians: a SBP of 117mmHg, a BMI of22 kg/m2, aWCof 76 cm, aHC of 100 cm, and aWHRof 0.76.
Systolic blood pressure presented a moderate correlationwith all the anthropometric variables. Only 10.89% of SBP’svariance was explained by BMI, 12.25% was explained byWC, 6.25% by HC, and 9.61% by WHR. Increased bloodpressure was found in 42% of women (SBP > 120mmHg)and in 47% of men (SBP > 140mmHg). Table 2 shows thedeviance, misclassification, and pseudo-𝑅2 for each of thefifteen models investigated in the training sample. Waistcircumference alone was the worst predictor for the womensample (tree 2), since it presented a deviance of 149.30,a misclassification error rate of 0.40, and a pseudo-𝑅2 ofonly 0.03. Tree 13 presented the best model, with the lowestdeviance (87.42), a misclassification error rate of 0.19, and apseudo-𝑅2 of 0.43. Comparing the variables alone, bodymassindex was the best predictor, explaining 32% of the varianceof increased systolic blood pressure for women, against only3% for waist circumference and hip circumference and 9%of waist-hip ratio. When added to BMI as predictors, WCand HC worsen the prediction, decreasing the percentage ofexplained variance from 32% to 29% and themisclassificationfrom 0.27 to 0.26 and increasing the deviance from 104.50to 109.50 and 108.90, respectively. All combinations of threevariables provided a better prediction than the variables aloneor combined two by two. Tree 11, for example, had BMI, WCandHCas predictors of increased blood pressure and resultedin a bettermodel then tree 1 (BMI alone), decreasing deviancefrom 104.50 to 94.24, misclassification from 0.26 to 0.22 andincreasing the percentage of explained variance from 32% to39%. So,WC andHC together with BMI have an incrementalvalidity that adds 4% of explanation to the predictive model.However, the best model, represented by tree 13, showed thatWC and WHR combined with BMI add 11% of variance

4 Journal of Obesity
Table 1: Descriptive statistics for SBP, BMI,WC,HC, andWHR; prevalence of obesity for woman andman; test of normality and correlations.
Woman Man Normalitytest Spearman’s correlation
Mean SD Median 𝑁 (%) Mean SD Median 𝑁 (%)Shapiro-Wilk’sW
SBP BMI WC HC WHR
SBP 118.66 15.91 117.00 132.35 14.44 130.00 0.96∗∗∗ 1 0.33∗ 0.35∗ 0.25∗ 0.31∗
BMI 22.76 4.08 22.00225
(56.3%)
24.46 4.34 24.00175
(43.8%)
0.93∗∗∗ 0.33∗ 1 0.80∗ 0.81∗ 0.46∗
WC 76.95 9.47 76.00 86.06 11.47 84.00 0.95∗∗∗ 0.35∗ 0.80∗ 1 0.73∗ 0.77∗
HC 100.71 8.79 100.00 102.93 8.93 103.00 0.98∗∗ 0.25∗ 0.81∗ 0.73∗ 1 0.20∗
WHR 0.76 0.07 0.76 0.83 0.07 0.83 0.94∗∗∗ 0.31∗ 0.46∗ 0.77∗ 0.20∗ 1SBP > 120mmHg
No 130(58%) SBP > 140mmHg
128(73%)
Yes 95(42%)
47(39%)
∗Significant at the 0.01 level.∗∗Significant at the 0.05 level.∗∗∗Significant at the 0.001 level.SBP: systolic blood pressure, BMI: body mass index, WC: waist circumference, HC: hip circumference, WHR: waist-hip ratio. Notice that the endpoint forwomen is SBP greater than 120mmHg (prehypertension), while for men is SBP greater than 140mmHg (hypertension).
Table 2: Predictors, deviance, misclassification, and pseudo-𝑅2 by tree.
Tree PredictorsWomen Men
Deviance Misclassificationerror rate
Pseudo-𝑅2
Deviance Misclassificationerror rate
Pseudo-𝑅2
1 BMI 104.50 0.27 0.32 89.35 0.26 0.162 WC 149.30 0.40 0.03 92.96 0.27 0.133 HC 148.90 0.41 0.03 89.59 0.26 0.164 WHR 139.50 0.33 0.09 95.09 0.29 0.115 BMI +WC 109.50 0.26 0.29 71.07 0.21 0.336 BMI + HC 108.10 0.26 0.29 80.17 0.25 0.257 BMI +WHR 104.60 0.23 0.32 79.9 0.23 0.258 WC + HC 149.30∗ 0.40 0.03 82.19 0.23 0.239 WC +WHR 115.90 0.26 0.24 69.54 0.24 0.3510 HC +WHR 118.60 0.29 0.23 76 0.21 0.2911 BMI +WC + HC 94.24 0.22 0.39 72.66 0.23 0.3212 WC + HC +WHR 99.17 0.23 0.35 61.5 0.17 0.4213 BMI +WC +WHR 87.42 0.19 0.43 64.98 0.19 0.3914 BMI + HC +WHR 101.10 0.22 0.34 61.93 0.16 0.4215 BMI+WC + HC +WHR 89.46 0.19 0.42 57.25 0.16 0.46∗HC dropped out.Notice that the endpoint for women is systolic blood pressure greater than 120mmHg (prehypertension), while for men is greater than 140mmHg(hypertension).
explanation to the predictive model, compared to BMI alone(tree 1), decrease the percentage ofmisclassification from26%to 19%, and decrease deviance from 104.50 to 87.42. So, WCand WHR have a considerable impact on the prediction ofincreased blood pressure in women when combined withBMI, presenting incremental validity over the latter.
Considering the men’s result, waist-hip ratio alone (tree4) presented the worst prediction model, with deviance of
95.09, misclassification error rate of 0.29, and pseudo-𝑅2of 0.11. Tree 15 presented the best model, with the lowestdeviance (57.25), a misclassification error rate of 0.16, anda pseudo-𝑅2 of 0.46. Comparing the variables alone, bodymass index was the best predictor, explaining 16% of thevariance of increased systolic blood pressure for men, witha deviance of 89.35 and a misclassification of 0.26, a resultslightly better than tree 3 in which HC alone explained the
Journal of Obesity 5
|BMI <27.275
WHR <68.5
WC <75.5WHR <78.5
BMI <19.12
BMI <21.385
WHR <72.5
WC <71.5
BMI <23.27
WC <77.5
WHR <79.5
BMI <24.5 BMI <24.505
WHR <80
BMI <29.615
PRE
PREPRE
PRE
PRE
PRE RegularRegular
RegularRegularRegular
Regular
Regular
Regular
Regular
PRE
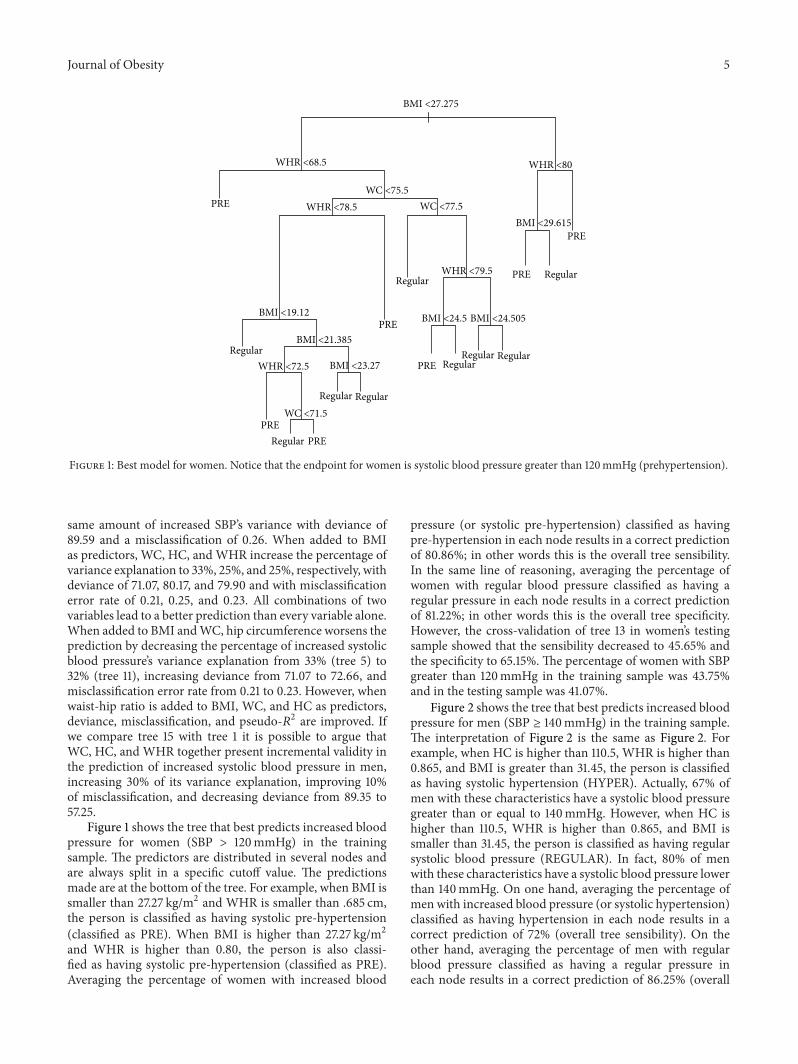
Figure 1: Best model for women. Notice that the endpoint for women is systolic blood pressure greater than 120mmHg (prehypertension).
same amount of increased SBP’s variance with deviance of89.59 and a misclassification of 0.26. When added to BMIas predictors, WC, HC, and WHR increase the percentage ofvariance explanation to 33%, 25%, and 25%, respectively, withdeviance of 71.07, 80.17, and 79.90 and with misclassificationerror rate of 0.21, 0.25, and 0.23. All combinations of twovariables lead to a better prediction than every variable alone.When added to BMI andWC, hip circumference worsens theprediction by decreasing the percentage of increased systolicblood pressure’s variance explanation from 33% (tree 5) to32% (tree 11), increasing deviance from 71.07 to 72.66, andmisclassification error rate from 0.21 to 0.23. However, whenwaist-hip ratio is added to BMI, WC, and HC as predictors,deviance, misclassification, and pseudo-𝑅2 are improved. Ifwe compare tree 15 with tree 1 it is possible to argue thatWC, HC, and WHR together present incremental validity inthe prediction of increased systolic blood pressure in men,increasing 30% of its variance explanation, improving 10%of misclassification, and decreasing deviance from 89.35 to57.25.
Figure 1 shows the tree that best predicts increased bloodpressure for women (SBP > 120mmHg) in the trainingsample. The predictors are distributed in several nodes andare always split in a specific cutoff value. The predictionsmade are at the bottom of the tree. For example, when BMI issmaller than 27.27 kg/m2 and WHR is smaller than .685 cm,the person is classified as having systolic pre-hypertension(classified as PRE). When BMI is higher than 27.27 kg/m2and WHR is higher than 0.80, the person is also classi-fied as having systolic pre-hypertension (classified as PRE).Averaging the percentage of women with increased blood
pressure (or systolic pre-hypertension) classified as havingpre-hypertension in each node results in a correct predictionof 80.86%; in other words this is the overall tree sensibility.In the same line of reasoning, averaging the percentage ofwomen with regular blood pressure classified as having aregular pressure in each node results in a correct predictionof 81.22%; in other words this is the overall tree specificity.However, the cross-validation of tree 13 in women’s testingsample showed that the sensibility decreased to 45.65% andthe specificity to 65.15%. The percentage of women with SBPgreater than 120mmHg in the training sample was 43.75%and in the testing sample was 41.07%.
Figure 2 shows the tree that best predicts increased bloodpressure for men (SBP ≥ 140mmHg) in the training sample.The interpretation of Figure 2 is the same as Figure 2. Forexample, when HC is higher than 110.5, WHR is higher than0.865, and BMI is greater than 31.45, the person is classifiedas having systolic hypertension (HYPER). Actually, 67% ofmen with these characteristics have a systolic blood pressuregreater than or equal to 140mmHg. However, when HC ishigher than 110.5, WHR is higher than 0.865, and BMI issmaller than 31.45, the person is classified as having regularsystolic blood pressure (REGULAR). In fact, 80% of menwith these characteristics have a systolic blood pressure lowerthan 140mmHg. On one hand, averaging the percentage ofmen with increased blood pressure (or systolic hypertension)classified as having hypertension in each node results in acorrect prediction of 72% (overall tree sensibility). On theother hand, averaging the percentage of men with regularblood pressure classified as having a regular pressure ineach node results in a correct prediction of 86.25% (overall

6 Journal of Obesity
|HC <110.5
WC <93.5
WC <83.5
WHR <81.5
BMI <23.3
WHR <80
WHR <77.5
WHR <87.5
HC <105
WHR <86.5
BMI <31.45
Regular
RegularRegular
RegularRegular
Regular
Hyper
Hyper
Hyper
RegularRegular
Hyper
Figure 2: Best model for men. Notice that the endpoint for men is greater than 140mmHg (hypertension).
tree specificity). However, the cross-validation of tree 15 inmen’s testing sample showed that the sensibility decreased to52.38% and the specificity to 69.70%. The percentage of menwith SBP greater than or equal to 140mmHg in the trainingsample was 30% and in the testing sample was 24.13%.
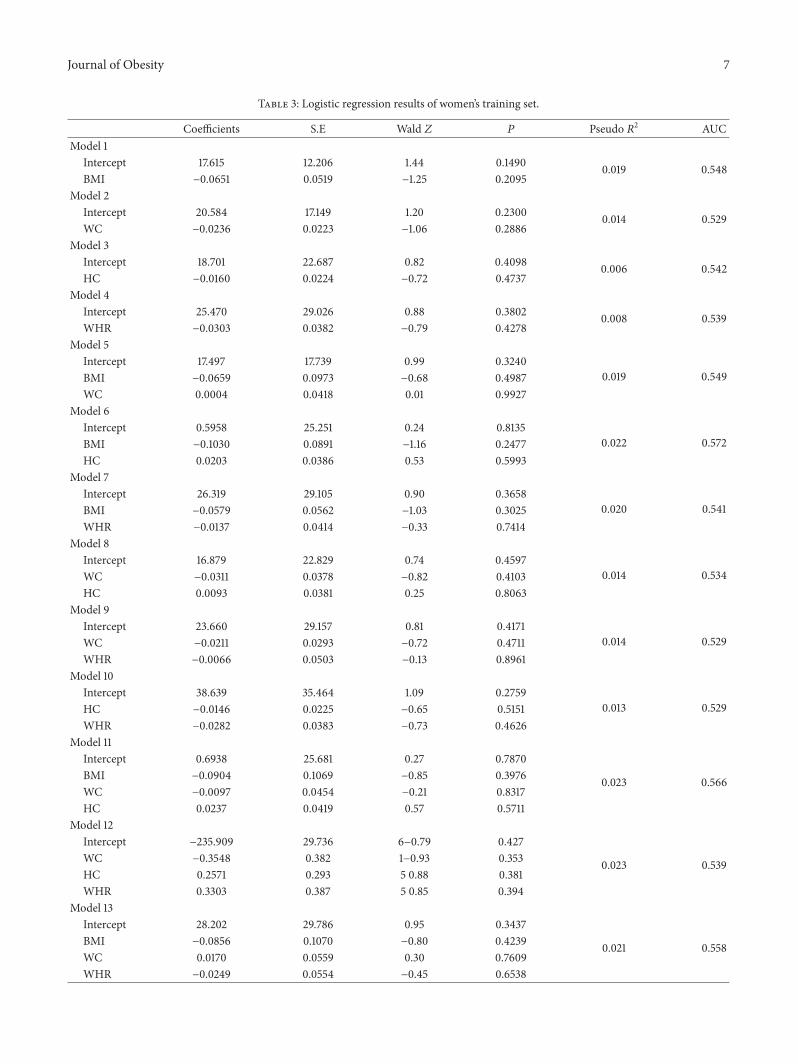
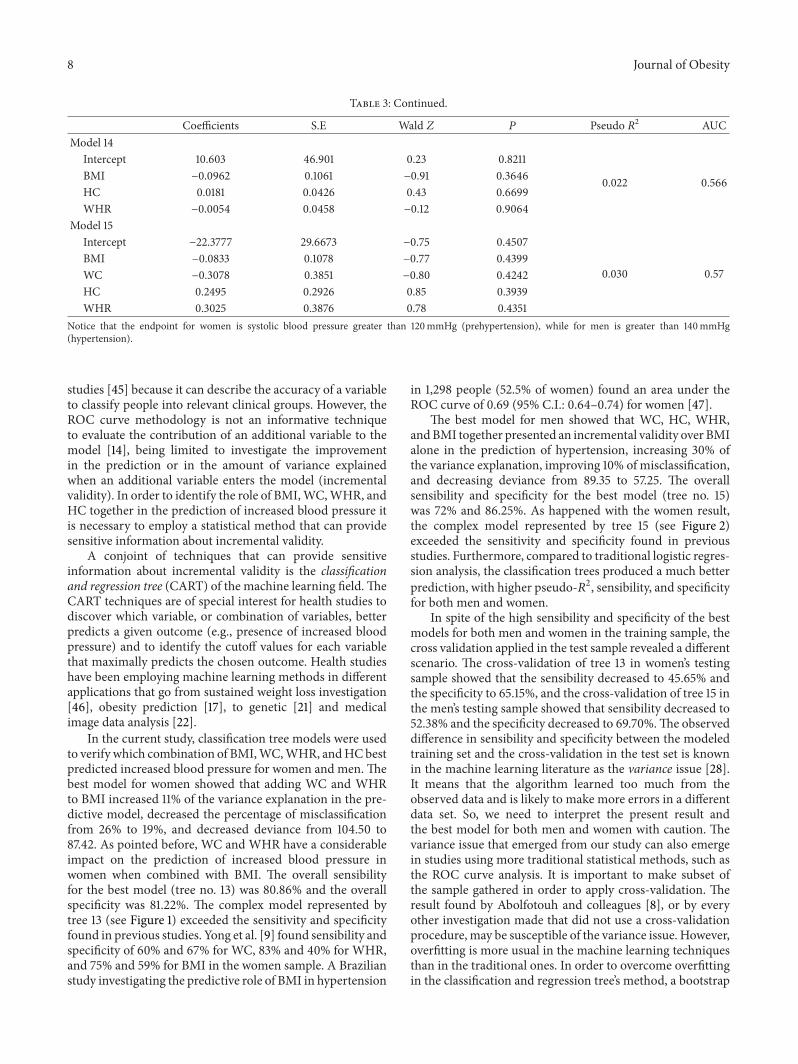
Comparing the strength of the predictions made, it isclear that classification trees outperformed traditional logisticregression. The best predictive model for women generatedusing classification trees had a pseudo-𝑅2 of 0.43, with anoverall tree sensibility of 80.86% and specificity of 81.22%,while the logistic model with higher pseudo-𝑅2 and AUCwas the model 11, presenting 0.023 and 0.566, respectively(see Table 3). The best classification tree for men presenteda pseudo-𝑅2 of 0.466 with an overall sensibility of 72% andspecificity of 86.25%, while the logistic model with higherpseudo-𝑅2 and AUC was the model 12, presenting 0.13 and0.68 respectively (see Table 4).
4. Conclusions
According to the Harvard Obesity Prevention Source [29], itis estimated that 500 million adults are obese and 1.5 billionare overweight or obese worldwide. Obesity is a public healthproblem that affects approximately 1.5 million people eachyear in Brazil [30] and is responsible for a huge amountof money, about U$ 240 million dollars in 2011 [31], todirectly treat it or to treat several related diseases.This chronicnoncommunicable disease had its prevalence increased inboth developed and in development countries, affecting, forexample, 35.5% of women and 32.2% of adult men in theUSA [2] and 12.4% of men and 16.9% of women in Brazil[3]. At least three pathophysiological mechanisms are known
to link obesity to increased blood pressure. The first oneis related to visceral obesity, indicating that mesenteric andomental adipocytes are more active than the subcutaneousones [32], contributing to endothelial dysfunction, whichmay contribute to increasing blood pressure in obese people.The other two mechanisms involve the sympathetic nervoussystem [33, 34] and the imbalance in the homeostasis ofplasma sodium [35–37] that are related to the extracellularvolume increase and, thus, contribute to blood pressureelevation in people with obesity.
Anthropometric variables are among the most practicaland low-cost obesity diagnosticmethods [38], regarding theirlimitations and issues [38, 39]. World Health Organization2008’s report [40] points that bodymass index, waist circum-ference, and waist-hip ratio are related to risk of cardiovascu-lar diseases, hypertension, overall mortality, and other healthproblems.The same report points that additional informationcan be provided by hip circumference in the diagnosis ofobesity, since it is related to gluteofemoral muscle mass andbone structure. Previous studies have pointed to the cutoffvalues of the anthropometric variables that are related toblood pressure [9, 41]. The cut-off values are different acrossethnicities [40, 42], samples, age, and risk factors investigated[43]. All the studies quoted above employed traditional dataanalysis procedures, such as linear or logistic regression andthe ROC curve analysis to verify the predictive role for eachvariable and to discover the best cutoff values for them. Theuse of null-hypothesis significance testing (𝑃 value) requirescaution to verify which variables better predict obesity. Asmaller 𝑃 does not indicate a stronger relationship betweenindependent and dependent variables, and statistical signifi-cance does not indicate practical importance [44]. The ROCcurve analysis is highly recommended in epidemiological
Journal of Obesity 7
Table 3: Logistic regression results of women’s training set.
Coefficients S.E Wald 𝑍 𝑃 Pseudo 𝑅2 AUCModel 1
Intercept 17.615 12.206 1.44 0.1490 0.019 0.548BMI −0.0651 0.0519 −1.25 0.2095
Model 2Intercept 20.584 17.149 1.20 0.2300 0.014 0.529WC −0.0236 0.0223 −1.06 0.2886
Model 3Intercept 18.701 22.687 0.82 0.4098 0.006 0.542HC −0.0160 0.0224 −0.72 0.4737
Model 4Intercept 25.470 29.026 0.88 0.3802 0.008 0.539WHR −0.0303 0.0382 −0.79 0.4278
Model 5Intercept 17.497 17.739 0.99 0.3240
0.019 0.549BMI −0.0659 0.0973 −0.68 0.4987WC 0.0004 0.0418 0.01 0.9927
Model 6Intercept 0.5958 25.251 0.24 0.8135
0.022 0.572BMI −0.1030 0.0891 −1.16 0.2477HC 0.0203 0.0386 0.53 0.5993
Model 7Intercept 26.319 29.105 0.90 0.3658
0.020 0.541BMI −0.0579 0.0562 −1.03 0.3025WHR −0.0137 0.0414 −0.33 0.7414
Model 8Intercept 16.879 22.829 0.74 0.4597
0.014 0.534WC −0.0311 0.0378 −0.82 0.4103HC 0.0093 0.0381 0.25 0.8063
Model 9Intercept 23.660 29.157 0.81 0.4171
0.014 0.529WC −0.0211 0.0293 −0.72 0.4711WHR −0.0066 0.0503 −0.13 0.8961
Model 10Intercept 38.639 35.464 1.09 0.2759
0.013 0.529HC −0.0146 0.0225 −0.65 0.5151WHR −0.0282 0.0383 −0.73 0.4626
Model 11Intercept 0.6938 25.681 0.27 0.7870
0.023 0.566BMI −0.0904 0.1069 −0.85 0.3976WC −0.0097 0.0454 −0.21 0.8317HC 0.0237 0.0419 0.57 0.5711
Model 12Intercept −235.909 29.736 6−0.79 0.427
0.023 0.539WC −0.3548 0.382 1−0.93 0.353HC 0.2571 0.293 5 0.88 0.381WHR 0.3303 0.387 5 0.85 0.394
Model 13Intercept 28.202 29.786 0.95 0.3437
0.021 0.558BMI −0.0856 0.1070 −0.80 0.4239WC 0.0170 0.0559 0.30 0.7609WHR −0.0249 0.0554 −0.45 0.6538
8 Journal of Obesity
Table 3: Continued.
Coefficients S.E Wald 𝑍 𝑃 Pseudo 𝑅2 AUCModel 14
Intercept 10.603 46.901 0.23 0.8211
0.022 0.566BMI −0.0962 0.1061 −0.91 0.3646HC 0.0181 0.0426 0.43 0.6699WHR −0.0054 0.0458 −0.12 0.9064
Model 15Intercept −22.3777 29.6673 −0.75 0.4507
0.030 0.57BMI −0.0833 0.1078 −0.77 0.4399WC −0.3078 0.3851 −0.80 0.4242HC 0.2495 0.2926 0.85 0.3939WHR 0.3025 0.3876 0.78 0.4351
Notice that the endpoint for women is systolic blood pressure greater than 120mmHg (prehypertension), while for men is greater than 140mmHg(hypertension).
studies [45] because it can describe the accuracy of a variableto classify people into relevant clinical groups. However, theROC curve methodology is not an informative techniqueto evaluate the contribution of an additional variable to themodel [14], being limited to investigate the improvementin the prediction or in the amount of variance explainedwhen an additional variable enters the model (incrementalvalidity). In order to identify the role of BMI,WC,WHR, andHC together in the prediction of increased blood pressure itis necessary to employ a statistical method that can providesensitive information about incremental validity.
A conjoint of techniques that can provide sensitiveinformation about incremental validity is the classificationand regression tree (CART) of the machine learning field.TheCART techniques are of special interest for health studies todiscover which variable, or combination of variables, betterpredicts a given outcome (e.g., presence of increased bloodpressure) and to identify the cutoff values for each variablethat maximally predicts the chosen outcome. Health studieshave been employing machine learning methods in differentapplications that go from sustained weight loss investigation[46], obesity prediction [17], to genetic [21] and medicalimage data analysis [22].
In the current study, classification tree models were usedto verify which combination of BMI,WC,WHR, andHCbestpredicted increased blood pressure for women and men.Thebest model for women showed that adding WC and WHRto BMI increased 11% of the variance explanation in the pre-dictive model, decreased the percentage of misclassificationfrom 26% to 19%, and decreased deviance from 104.50 to87.42. As pointed before, WC and WHR have a considerableimpact on the prediction of increased blood pressure inwomen when combined with BMI. The overall sensibilityfor the best model (tree no. 13) was 80.86% and the overallspecificity was 81.22%. The complex model represented bytree 13 (see Figure 1) exceeded the sensitivity and specificityfound in previous studies. Yong et al. [9] found sensibility andspecificity of 60% and 67% for WC, 83% and 40% for WHR,and 75% and 59% for BMI in the women sample. A Brazilianstudy investigating the predictive role of BMI in hypertension
in 1,298 people (52.5% of women) found an area under theROC curve of 0.69 (95% C.I.: 0.64–0.74) for women [47].
The best model for men showed that WC, HC, WHR,andBMI together presented an incremental validity over BMIalone in the prediction of hypertension, increasing 30% ofthe variance explanation, improving 10% of misclassification,and decreasing deviance from 89.35 to 57.25. The overallsensibility and specificity for the best model (tree no. 15)was 72% and 86.25%. As happened with the women result,the complex model represented by tree 15 (see Figure 2)exceeded the sensitivity and specificity found in previousstudies. Furthermore, compared to traditional logistic regres-sion analysis, the classification trees produced a much betterprediction, with higher pseudo-𝑅2, sensibility, and specificityfor both men and women.
In spite of the high sensibility and specificity of the bestmodels for both men and women in the training sample, thecross validation applied in the test sample revealed a differentscenario. The cross-validation of tree 13 in women’s testingsample showed that the sensibility decreased to 45.65% andthe specificity to 65.15%, and the cross-validation of tree 15 inthe men’s testing sample showed that sensibility decreased to52.38% and the specificity decreased to 69.70%.The observeddifference in sensibility and specificity between the modeledtraining set and the cross-validation in the test set is knownin the machine learning literature as the variance issue [28].It means that the algorithm learned too much from theobserved data and is likely to make more errors in a differentdata set. So, we need to interpret the present result andthe best model for both men and women with caution. Thevariance issue that emerged from our study can also emergein studies using more traditional statistical methods, such asthe ROC curve analysis. It is important to make subset ofthe sample gathered in order to apply cross-validation. Theresult found by Abolfotouh and colleagues [8], or by everyother investigation made that did not use a cross-validationprocedure, may be susceptible of the variance issue. However,overfitting is more usual in the machine learning techniquesthan in the traditional ones. In order to overcome overfittingin the classification and regression tree’s method, a bootstrap

Journal of Obesity 9
Table 4: Logistic regression results of men’s training set.
Coefficients S.E Wald 𝑍 𝑃 Pseudo 𝑅2 AUCModel 1
Intercept 3.27 1.41 2.32 0.02 0.05 0.597BMI −0.09 0.05 −1.74 0.08
Model 2Intercept 3.28 1.73 1.89 0.05 0.03 0.591WC −0.02 0.01 −1.42 0.15
Model 3Intercept 7.99 3.05 2.62 0.008 0.09 0.656HC −0.06 0.02 −2.36 0.0183
Model 4Intercept 0.12 3.15 0.04 0.96 0.001 0.498WHR 0.0089 0.03 0.24 0.8120
Model 5Intercept 28.040 17.829 1.57 0.1158
0.05 0.596BMI −0.1416 0.1222 −1.16 0.2463WC 0.0193 0.0442 0.44 0.6628
Model 6Intercept 106.641 42.606 2.50 0.0123
0.10 0.667BMI 0.1117 0.1202 0.93 0.3528HC −0.1213 0.0645 −1.88 0.0601
Model 7Intercept −15.975 33.454 −0.48 0.6330
0.09 0.636BMI −0.1641 0.0710 −2.31 0.0207WHR 0.0797 0.0499 1.60 0.1105
Model 8Intercept 101.735 35.689 2.85 0.0044
0.12 0.672WC 0.0532 0.0404 1.32 0.1883HC −0.1339 0.0587 −2.28 0.0226
Model 9Intercept −49.908 38.546 −1.29 0.1954
0.13 0.677WC −0.1085 0.0399 −2.72 0.0065WHR 0.1836 0.0770 2.38 0.0172
Model 10Intercept 49.970 36.852 1.36 0.1751
0.12 0.678HC −0.0904 0.0339 −2.67 0.0077WHR 0.0633 0.0451 1.40 0.1602
Model 11Intercept 106.368 42.926 2.48 0.0132
0.12 0.671BMI 0.0284 0.1449 0.20 0.8447WC 0.0479 0.0485 0.99 0.3234HC −0.1408 0.0686 −2.05 0.0400
Model 12Intercept −208.656 32.535 2−0.6 4 0.521
0.13 0.680WC −0.2790 0.350 1−0.8 0 0.425HC 0.1460 0.296 7 0.4 9 0.622WHR 0.3697 0.387 9 0.9 5 0.340
Model 13Intercept −55.980 41.837 −1.34 0.1809
0.13 0.681BMI 0.0537 0.1476 0.36 0.7161WC −0.1345 0.0820 −1.64 0.1013WHR 0.2015 0.0916 2.20 0.0279

10 Journal of Obesity
Table 4: Continued.
Coefficients S.E Wald 𝑍 𝑃 Pseudo 𝑅2 AUCModel 14
Intercept 57.797 60.170 0.96 0.3368
0.12 0.679BMI 0.0234 0.1420 0.16 0.8691HC −0.0999 0.0671 −1.49 0.1364WHR 0.0586 0.0530 1.11 0.2687
Model 15Intercept −22.9141 32.9873 −0.69 0.4873
0.139 0.688BMI 0.0614 0.1482 0.41 0.6787WC −0.3231 0.3669 −0.88 0.3785HC 0.1582 0.2985 0.53 0.5960WHR 0.4062 0.3993 1.02 0.3089
procedure named Random Forests [48] can be applied.It bootstraps samples and variables, grows multiple trees,enables greater accuracy, and avoids overfitting, being oneof the best procedures for dealing with the variance issue[28]. Finally, we must address the limitations of the currentstudy. Firstly, it did not employ a representative samplerandomly chosen, relying on a convenience sample. It makesour inferences limited. Secondly, the number of women withhypertension was very low, obligating us to analyze increasedblood pressure in them and hypertension in men, whichcompromised the comparison of the findings between sexes.Those issues should be solved in future researches. Finally,our results cannot be generalized to other ethnics, but themethodology adopted in the current paper could be usedin data gathered in different countries to construct newpredictive models of increased blood pressure.
Using machine learning techniques to discover newrelations in data, to verify incremental validity of additionalpredictors, and tomake accurate predictions for new data setsmay help the health scientists to find new robust diagnosticparameters. The clinical usefulness of the present studyrelies on the possibility of using new algorithms to classifyand predict increased blood pressure, with higher accuracythan usual cutoff points. Although most of the clinicianscan measure both blood pressure and the anthropometricvariables simultaneously, there are several parts of the world,such as many countries from Africa or several places inLatin America, where material resources are scarce. So, theapplication of complex algorithms, as the presented one inthe current paper, can be a help for those professionals thatcan rely only on very simple and cheap instruments, suchas a measure tape. Furthermore, the present study applied anewmethod for prediction of health outcomes, which in spiteof being incipient in the literature, can provide new insightsand discoveries since it outperforms traditional techniques(such as logistic and linear regression), making possibleto compare the impact of new variables on the predictionof the chosen outcome (incremental validity). Traditionaltechniques are based on several assumptions, as the normalityof the distribution, linear relationship between independentand dependent variables, homoscedasticity, and so on. TheMachine learning techniques can handle any kind of variable
(ordinal, continuous, dichotomous, and nominal), with noassumption about distribution, linearity, or homoscedasticity.Moreover, it can be used to extract useful information andto discover new relations in very huge data sets providedby some international databases, such as the World HealthOrganization Global database on noncommunicable diseases(see http://www.who.int/gho/ncd/en/index.html) [49]. Asquoted in the introduction, the data deluge can transformthe society, and machine learning will play a pivotal rolein it. Future researches should overcome the limitations ofthe present study by employing a larger and representativesample, by using strategies to minimize the variance issue,especially the Random Forest [48] approach.
Conflict of Interests
The authors declare that there is no conflict of interestsregarding the publication of this paper.
Acknowledgments
The authors are thankful for the grant received by theFundacao de Amparo a Pesquisa do Estado da Bahia(FAPESB) and for the financial support of the FaculdadeIndependente do Nordeste.
References
[1] P. Hossain, B. Kawar, and M. Nahas, “Obesity and diabetes inthe developing world—a growing challenge,”The New EnglandJournal of Medicine, vol. 356, no. 3, pp. 213–215, 2007.
[2] K. M. Flegal, M. D. Carroll, C. L. Ogden, and L. R. Curtin,“Prevalence and trends in obesity amongUS adults, 1999–2008,”Journal of the American Medical Association, vol. 303, no. 3, pp.235–241, 2010.
[3] IBGE-Instituto Brasileiro de Geografia e Estatıstica, “POF,2008-2009: desnutricao cai e peso das criancas Brasileirasultrapassa padrao internacional,” 2010, http://saladeimprensa.ibge.gov. br/noticias?view=noticia&id=1&busca=1&idnoticia=1699.
[4] G.Gursoy, S. Ulu, Y. Acar et al., “Relation of resistınwıth obesityand some cardiovascular risk factors in hypertensive women,”
Journal of Obesity 11
Journal of Research in Medical Sciences, vol. 17, no. 5, pp. 443–447, 2012.
[5] E. Ugwuja, N. Ogbonna, A. Nwibo, and I. A. Onimawo, “Over-weight and obesity, lipid profile and atherogenic indices amongcivil servants in Abakaliki, south eastern Nigeria,” Annals ofMedical and Health Sciences Research, vol. 3, no. 1, pp. 13–18,2013.
[6] M. Dalton, A. J. Cameron, P. Z. Zimmet et al., “Waist circumfer-ence, waist-hip ratio and body mass index and their correlationwith cardiovascular disease risk factors in Australian adults,”Journal of Internal Medicine, vol. 254, no. 6, pp. 555–563, 2003.
[7] O. Perichart-Perera, M. Balas-Nakash, E. Schiffman-Selechnik,A. Barbato-Dosal, and F. Vadillo-Ortega, “Obesity increasesmetabolic syndrome risk factors in school-aged children froman urban school in Mexico City,” Journal of the AmericanDietetic Association, vol. 107, no. 1, pp. 81–91, 2007.
[8] M. A. Abolfotouh, I. A. Al-Alwan, and M. A. Al-Rowaily,“Prevalence of metabolic abnormalities and association withobesity among Saudi college students,” International Journal ofHypertension, vol. 2012, Article ID 819726, 8 pages, 2012.
[9] L. Yong, T. Guanghui, T. Weiwei, L. Liping, and Q. Xiaosong,“Can bodymass index, waist circumference, waist-hip ratio andwaist-height ratio predict the presence of multiple metabolicrisk factors in Chinese subjects?” BMC Public Health, vol. 11,article 35, 2011.
[10] J. B. Dixon, B. J. G. Strauss, C. Laurie, and P. C. O’Brien,“Smaller hip circumference is associated with dyslipidemia andthe metabolic syndrome in obese women,” Obesity Surgery, vol.17, no. 6, pp. 770–777, 2007.
[11] Y. Wang, E. B. Rimm, M. J. Stampfer, W. C. Willett, and F. B.Hu, “Comparison of abdominal adiposity and overall obesity inpredicting risk of type 2 diabetes amongmen,”American Journalof Clinical Nutrition, vol. 81, no. 3, pp. 555–563, 2005.
[12] M. A. Beydoun, M. T. Kuczmarski, Y. Wang, M. A. Mason, M.K. Evans, and A. B. Zonderman, “Receiver-operating charac-teristics of adiposity for metabolic syndrome: the healthy agingin neighborhoods of diversity across the life span (HANDLS)study,” Public Health Nutrition, vol. 14, no. 1, pp. 77–92, 2011.
[13] L. S. Erdreich and E. T. Lee, “Use of relative operating char-acteristic analysis in epidemiology. A method for dealing withsubjective judgement,” American Journal of Epidemiology, vol.114, no. 5, pp. 649–662, 1981.
[14] T. Hastie, R. Tibshirani, and J. Friedman, The Elements ofStatistical Learning, Springer, Berlin, Germany, 2nd edition,2009.
[15] Y.-C. Lee, W.-J. Lee, Y.-C. Lin et al., “Obesity and the decisiontree: predictors of sustained weight loss after bariatric surgery,”Hepatogastroenterology, vol. 56, no. 96, pp. 1745–1749, 2009.
[16] P. Hertzman, “The cost effectiveness of orlistat in a 1-yearweight-management programme for treating overweight andobese patients in Sweden: a treatment responder approach,”PharmacoEconomics, vol. 23, no. 10, pp. 1007–1020, 2005.
[17] A. Bhattarai, V. Rus, and D. Dasgupta, “Classification of clinicalconditions: a case study on prediction of obesity and its co-morbidities,” in Proceedings of the 10th International Conferenceon Intelligent Text Processing and Computational Linguistics(CICLING ’09), Mexico City, Mexico, March 2009.
[18] O. Regnier-Coudert, J. McCall, R. Lothian, T. Lam, S. McClin-ton, and J.N’Dow, “Machine learning for improved pathologicalstaging of prostate cancer: a performance comparison on arange of classifiers,” Artificial Intelligence in Medicine, vol. 55,no. 1, pp. 25–35, 2012.
[19] J. T. Pollettini, S. R. Panico, J. C. Daneluzzi, R. Tinos, J. A.Baranauskas, and A. A. Macedo, “Using machine learningclassifiers to assist healthcare-related decisions: classification ofelectronic patient records,” Journal of Medical Systems, vol. 36,no. 6, pp. 3861–3874, 2012.
[20] D. Page, “Predicting clinical events from electronic healthrecords,” in Proceedings of the Microsoft Research MachineLearning Summit, Issy-les-Moulineaux, France, 2013.
[21] K. Sharp, W. Wiegerinck, W. Burgers et al., “Searching forgenetic dark matter,” in Proceedings of the Microsoft ResearchMachine Learning Summit, Issy-les-Moulineaux, France, 2013.
[22] A. Criminisi, “Machine learning for medical image analysis,” inProceedings of theMicrosoft ResearchMachine Learning Summit,Paris, France, 2013.
[23] J. T. Leek, “Predicting with trees. Coursera’s data analysis classmaterial,” 2013, https://github.com/jtleek/dataanalysis.
[24] T. G. Lohman, A. F. Roche, and R. Martorell, AnthropometricStandardization Reference Manual, Human Kinetics Books,Champaign, Ill, USA, 1988.
[25] H. Golino, “Women’s dataset from the “Predicting increasedblood pressure using machine learning” paper,” Figshare, 2013.
[26] H. Golino, “Men’s dataset from the “Predicting increased bloodpressure using machine learning” paper,” Figshare, 2013.
[27] B. D. Ripley, “Package “tree”: classification and regression trees.R package version 1.0-33,” 2013, http://cran.r-project.org/web/packages/tree.
[28] P. Geurts, A. Irrthum, and L. Wehenkel, “Supervised learningwith decision tree-based methods in computational and sys-tems biology,”Molecular Biosystems, vol. 5, no. 12, pp. 1593–1605,2009.
[29] Harvard Obesity Prevention Source, Harvard School of PublicHealth, Cambridge, Mass, USA, http://www.hsph.harvard.edu/obesity-prevention-source/.
[30] Ministerio da Saude, “Vigilancia de fatores de risco e protecaopara doencas cronicas por inquerito telefonico,” Ministerio daSaude, Brasılia, Brasil, 2011, http://portalsaude.saude.gov.br/portalsaude/arquivos/pdf/2012/Ago/22/vigite 2011 final 0812.pdf.
[31] M. L. Oliveira, Estimativa dos custos da obesidade para o sistemaunico de saude do Brasil [Ph.D. thesis], UnB, Brasılia, Brasil,2013.
[32] R. K. Dubey and E. K. Jackson, “Estrogen-induced cardiore-nal protection: potential cellular, biochemical, and molecularmechanisms,” American Journal of Physiology, vol. 280, no. 3,pp. F365–F388, 2001.
[33] J. E.Hall, “Thekidney, hypertension, and obesity,”Hypertension,vol. 41, no. 3, part 2, pp. 625–633, 2003.
[34] L. Landsberg, “Diet, obesity and hypertension: an hypothesisinvolving insulin, the sympathetic nervous system, and adaptivethermogenesis,” Quarterly Journal of Medicine, vol. 61, no. 236,pp. 1081–1090, 1986.
[35] J. E. Hall, “Mechanisms of abnormal renal sodium handling inobesity hypertension,” American Journal of Hypertension, vol.10, no. 5, part 2, pp. S49–S55, 1997.
[36] V. Kotsis, S. Stabouli, S. Papakatsika, Z. Rizos, and G. Parati,“Mechanisms of obesity-induced hypertension,” HypertensionResearch, vol. 33, no. 5, pp. 386–393, 2010.
[37] J. E. Hall, A. A. da Silva, J. M. do Carmo et al., “Obesity-inducedhypertension: role of sympathetic nervous system, leptin, andmelanocortins,” Journal of Biological Chemistry, vol. 285, no. 23,pp. 17271–17276, 2010.
12 Journal of Obesity
[38] World Health Organization, “Obesity: preventing and manag-ing the global epidemic,” Report of aWHOConsultationWHOTechnical Report Series 894,WHO, Geneva, Switzerland, 2000.
[39] G. Velasquez-Melendez, A. M. Pimenta, and G. Kac, “Epidemi-ologia do sobrepeso e da obesidade e seus fatores determinantesem Belo Horizonte (MG), Brasil: estudo transversal de basepopulacional,” Revista Panamericana de Salud Publica, vol. 16,no. 5, pp. 308–314, 2004.
[40] World Health Organization, “Waist circumference and waist-hip ratio,” Report of a WHO Expert ConsultAtion, WHO,Geneva, Switzerland, 2008.
[41] O. S. Adediran, P. B. Adebayo, andA. A. Akintunde, “Anthropo-metric differences among natives of Abuja living in urban andrural communities: correlations with other cardiovascular riskfactors,” BMC Research Notes, vol. 6, article 123, 2013.
[42] A. Misra, N. Vikram, R. Gupta, R. Pandey, V. Gupta, and J.Wasir, “Waist circumference cutoff points and action levelsfor Asian Indians for identification of abdominal obesity,”International Journal of Obesity, vol. 30, no. 1, pp. 106–111, 2006.
[43] C. J. Dobbelsteyn, M. R. Joffres, D. R. MacLean, and G. Flow-erdew, “A comparative evaluation of waist circumference, waist-to-hip ratio and bodymass index as indicators of cardiovascularrisk factors. The Canadian heart health surveys,” InternationalJournal of Obesity, vol. 25, no. 5, pp. 652–661, 2001.
[44] J. A. Gliner, N. Leech, and G. Morgan, “Problems with nullhypothesis significance testing (NHST): what do the textbookssay?” Journal of Experimental Education, vol. 71, no. 1, pp. 83–92,2002.
[45] L. S. Erdreich and E. T. Lee, “Use of relative operating char-acteristic analysis in epidemiology. A method for dealing withsubjective judgement,” American Journal of Epidemiology, vol.114, no. 5, pp. 649–662, 1981.
[46] Y.-C. Lee, W.-J. Lee, Y.-C. Lin et al., “Obesity and the decisiontree: predictors of sustained weight loss after bariatric surgery,”Hepatogastroenterology, vol. 56, no. 96, pp. 1745–1749, 2009.
[47] L. S. Barbosa, L. C. N. Scala, and M. G. Ferreira, “Associacaoentre marcadores antropometricos de adiposidade corporale hipertensao arterial na populacao adulta de Cuiaba, MatoGrosso,” Revista Brasileira de Epidemiologia, vol. 12, no. 2, pp.237–247, 2009.
[48] L. Breiman, “Random forests,”Machine Learning, vol. 45, no. 1,pp. 5–32, 2001.
[49] Global Health Organization, “Noncommunicable diseases,”2013, http://www.who.int/gho/ncd/en/index.html.

Submit your manuscripts athttp://www.hindawi.com
Stem CellsInternational
Hindawi Publishing Corporationhttp://www.hindawi.com Volume 2014
Hindawi Publishing Corporationhttp://www.hindawi.com Volume 2014
MEDIATORSINFLAMMATION
of
Hindawi Publishing Corporationhttp://www.hindawi.com Volume 2014
Behavioural Neurology
EndocrinologyInternational Journal of
Hindawi Publishing Corporationhttp://www.hindawi.com Volume 2014
Hindawi Publishing Corporationhttp://www.hindawi.com Volume 2014
Disease Markers
Hindawi Publishing Corporationhttp://www.hindawi.com Volume 2014
BioMed Research International
OncologyJournal of
Hindawi Publishing Corporationhttp://www.hindawi.com Volume 2014
Hindawi Publishing Corporationhttp://www.hindawi.com Volume 2014
Oxidative Medicine and Cellular Longevity
Hindawi Publishing Corporationhttp://www.hindawi.com Volume 2014
PPAR Research
The Scientific World JournalHindawi Publishing Corporation http://www.hindawi.com Volume 2014
Immunology ResearchHindawi Publishing Corporationhttp://www.hindawi.com Volume 2014
Journal of
ObesityJournal of
Hindawi Publishing Corporationhttp://www.hindawi.com Volume 2014
Hindawi Publishing Corporationhttp://www.hindawi.com Volume 2014
Computational and Mathematical Methods in Medicine
OphthalmologyJournal of
Hindawi Publishing Corporationhttp://www.hindawi.com Volume 2014
Diabetes ResearchJournal of
Hindawi Publishing Corporationhttp://www.hindawi.com Volume 2014
Hindawi Publishing Corporationhttp://www.hindawi.com Volume 2014
Research and TreatmentAIDS
Hindawi Publishing Corporationhttp://www.hindawi.com Volume 2014
Gastroenterology Research and Practice
Hindawi Publishing Corporationhttp://www.hindawi.com Volume 2014
Parkinson’s Disease
Evidence-Based Complementary and Alternative Medicine
Volume 2014Hindawi Publishing Corporationhttp://www.hindawi.com