research article prevalence and risk factors of
TRANSCRIPT
Research ArticlePrevalence and Risk Factors of Hypertensionamong Male Occupational Bus Drivers in North Kerala,South India: A Cross-Sectional Study
Arjun Lakshman,1 Neeraj Manikath,2 Asma Rahim,3 and V. P. Anilakumari4
1 Govt. Medical College, Kozhikode, Kerala 673008, India2Department of Internal Medicine, Medical College, Kozhikode, Kerala 673008, India3 Department of Community Medicine, Medical College, Kozhikode, Kerala 673008, India4Department of Nuclear Medicine, Medical College, Kozhikode, Kerala 673008, India
Correspondence should be addressed to Arjun Lakshman; [email protected]
Received 26 December 2013; Accepted 27 January 2014; Published 23 April 2014
Academic Editors: C. M. d. S. Figueredo and S. Glisic
Copyright © 2014 Arjun Lakshman et al. This is an open access article distributed under the Creative Commons AttributionLicense, which permits unrestricted use, distribution, and reproduction in any medium, provided the original work is properlycited.
Background. Hypertension is a leading cause of morbidity and mortality worldwide. We aimed to evaluate the prevalence ofhypertension in a population of male bus drivers in North Kerala, India.Methods. The study population included male bus driversof Corporation Bus stand Kozhikode, Kerala. Blood pressure, height, and weight of subjects were measured, and relevance wasobtained using a structured questionnaire. Results. Age varied from 21 to 60 years (mean 36.5±8.4). Among 179 bus drivers studied,16.8% (30/179) had normal BP, 41.9% (75/179) had prehypertension, and 41.3% (74/179) had hypertension. Isolated systolic HTNwas seen in 6.70% (12/179) individuals. Out of 74 hypertensives, 9 (12.1%) were aware of their hypertension, while 3 (4.0%) weremedicated and only 1 (1.3%) had BP adequately controlled. Age > 35 years (P = 0.015), BMI ≥ 23 kg/m2 (P = 0.007), supportingmorethan four familymembers (P = 0.011), and takingmainmeals from restaurants onmost working days (P = 0.017) were independentlyassociated with HTN in binary logistic regression. Conclusion. Prevalence of hypertension was high among bus drivers. Age >35 years, elevated BMI, supporting a large family, and dietary habits associated with the job showed significant association withhypertension. Primary and secondary prevention strategies need to be emphasized in this occupational group.
1. Introduction
Cardiovascular diseases (CVDs) account for nearly a third ofall deaths worldwide.The prevalence of CVDs is increasing indeveloping countries like India. CVD is predicted to becomethe major cause of morbidity and mortality by 2020 [1]. Thekey intervention in CVDs is to identify risk factors early andinitiate therapy to control them. An important modifiablerisk factor for CVDs is systemic arterial hypertension (HTN).Hence, diagnosis of hypertension and appropriate treatmentto optimize BP are important public health goals worldwide.
All groups of professional drivers especially those car-rying passengers are at excess risk of HTN, myocardialinfarction, and hemorrhagic stroke [2–6]. Occupational busdrivers in a developing country like India deserve specialconcern. They have to be extremely careful in handling
heavy vehicles laden with passengers. Traffic congestion,exposure to vehicle exhausts, constant whole body vibration,poor condition of roads, poor town planning and trafficregulation, over speeding due to competition between buses,and carelessness of pedestrians contribute to their misery.Besides, most of the drivers are in the habit of eating mainmeals from hotels and consuming snacks (often oily andfried) and fast food items between trips. Many resort toalcohol and smoking to overcome stress. It follows logicallythat they may have an additional risk of developing HTN. Nostudy has been published regarding the prevalence of HTNorspecial risk factors among professional bus drivers in India.In this context, we aimed to estimate the prevalence of HTNand to identify its risk factors among male occupational busdrivers of Kozhikode, a city in Kerala, South India.
Hindawi Publishing CorporationISRN Preventive MedicineVolume 2014, Article ID 318532, 9 pageshttp://dx.doi.org/10.1155/2014/318532
2 ISRN Preventive Medicine
2. Methods
2.1. Study Design and Sample. This cross-sectional study wascarried out in the Corporation bus Stand, Kozhikode, one ofthe busiest bus stands in Kerala. The study was conductedduring September and October, 2008. The approximateprevalence of HTN among males in Kerala as determined inprevious studies is 35% [7–9]. The estimated sample size forour study was 88. But we decided to study all male bus driversenlisted in the Corporation bus stand giving consent toparticipate in the study.
2.2. Data Collection and Measurements. 179 drivers partic-ipated in the study. Those who reported violent physicalexercise, smoking, tobacco chewing, or drinking tea orcoffee within thirty minutes prior to BP measurement wereexcluded. Information about their medical history, lifestyle,and occupation was obtained by personal interview usinga pretested semistructured questionnaire. BP was measuredmanually using a mercury column sphygmomanometer andstethoscope by the auscultatory method [10].The subject wasseated comfortably for at least 15 minutes before BP record-ing. Two readings were taken one before and one after theinterview, and the two were at least 15 minutes apart. Theaverage of two readings corrected to nearest integer was takenas the BP. Patients with BP in prehypertensive and hyperten-sive range were asked to report one week later and anotherset of readings was obtained for confirmation. The lower ofthe two values was taken as the BP of the individual. Wemeasured the subjects’ height and weight, from which thebody mass index (BMI) was calculated. The weight wasmeasured (closest to 1 kg) using a beam type weighing scale.Height was measured (nearest to 1 cm) with the subject in anerect position against a vertical surface. Hypertensives werereferred for medical care and prehypertensives were advisedlifestyle modification and BP monitoring.
2.3. Definitions. HTN was defined as systolic BP of≥140mmHg and/or diastolic BP of ≥90mmHg or currentpharmacological treatment for HTN. Pre-HTN was definedas systolic BP 120–139mmHg and/or diastolic BP 80–89mmHg. Isolated systolic HTN was defined as systolic BP≥140mmHg in presence of a normal diastolic BP [10].
A subject was said to be “aware” of HTN status if hereported a diagnosis of HTNmade by a medical practitioner.
“Treatment for HTN” was defined as regular use of aprescription medication for HTN.
“Control of HTNwith treatment” was defined as SBP andDBP less than 140mmHg and 90mmHg, respectively, in asubject on regular antihypertensive therapy.
The label “never smoked” was assigned to subjects whonever smoked cigarettes or beedis and “current smokers” tothose who smoked at any time during past one year. “Quitsmokers” were those who had quit smoking at least one yearbefore the study. The smoking habit was quantified in pack-years (number of packets of cigarettes smoked per day multi-plied by the duration of smoking in years assuming that eachpacket contains 20 cigarettes).
Based on alcohol use, subjects were classified into “nevertook alcohol”, “takes alcohol occasionally” (<3 days perweek),or “takes alcohol on most days” (≥3 days per week).
2.4. Ethical Considerations. Ethical clearance for the studywas obtained from the Institutional Ethics Committee, Govt.Medical College, Kozhikode. Informed written consent wasobtained from all subjects before including the study.
2.5. Statistical Analysis. The collected data was tabulatedusing Microsoft Excel 2007 and analyzed using EpiInfo3.5.1. Quantitative variables were summarized as meansand qualitative variables were summarized as proportions.Quantitative variables were tested for statistical significanceusing Student’s 𝑡-test. Qualitative variables were checked forstatistical significance using the Chi-Square test. For allstatistical tests, a 𝑃 value < 0.05 was taken as significant.
3. Results
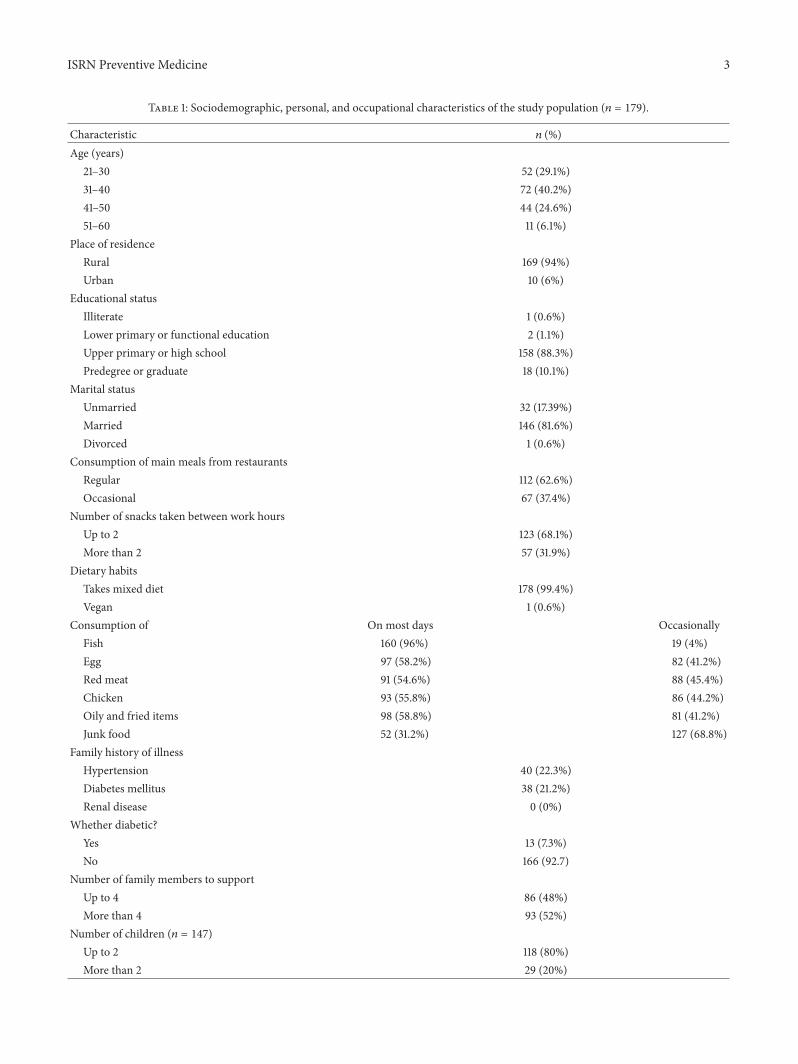
The important sociodemographic characteristics of the studypopulation are summarized in Table 1. Mean age of thepopulation was 36.52 ± 8.38 (SD) years (range 21–60 years).Mean number of familymembers each subject supported was4.93±1.71 (range 2–11).Meannumber of children permarriedcouple was 1.89±1.03 (range 0–6). Mean number of years forwhich the study subjects were in the job of bus driving was14.6 ± 8.27 years (range 1–38). On most days they worked fora mean duration of 11.56 ± 1.87 hours (range 5–16).
The mean SBP and DBP of the study population were126.66 ± 13.74mmHg (range 100 to 172) and 83.66 ±10.18mmHg (range 60 to 110), respectively. The mean SBPwas 122.19 ± 12.53mmHg and 130.25 ± 13.65mmHg,respectively, for subjects with age up to 35 years and subjectsolder than 35 years. Similar values for DBP were 80.45 ±9.75mmHg and 86.25 ± 9.83mmHg, respectively.ThemeanBMI of the study population was 22.77 ± 2.97 kg/m2 (range16.14 to 34.15). The physical examination findings in differentage groups are summarized in Table 2.
The systolic and diastolic BPs of study subjects increasedwith age (for SBP, 𝑟 = 0.306, 𝑃 < .01; for DBP, 𝑟 = 0.289,𝑃 < .01). The mean values of SBP and DBP were significantlyhigher in subjects older than 35 years (for SBP, 𝑡 = 4.12, 𝑃0.000; for DBP, 𝑡 = 3.94, 𝑃 0.000).
When the BPs of the subjects were classified accordingto JNC7 criteria, 16.8% (30/179) (95% CI = 11.2−22.3) hadnormal BP, 41.9% (75/179) (95% CI = 34.6−49.7) had pre-hypertension, and 41.3% (74/179) (95% CI = 34.1−49.2) hadHTN. Isolated systolic HTN was seen in 6.70% (12/179) (95%CI = 3.4−10.6) individuals. The distribution of the JNC7 cat-egories and isolated systolic HTN in each age group is shownin Table 2.
The association between HTN and various presumedsociodemographic, medical, personal, behavioral, occupa-tional, and dietary risks factors is shown in Tables 3, 4, and5.
Proportion of the study population belonging to eachcategory of BMI and their distribution according to JNC7
ISRN Preventive Medicine 3
Table 1: Sociodemographic, personal, and occupational characteristics of the study population (𝑛 = 179).
Characteristic 𝑛 (%)Age (years)
21–30 52 (29.1%)31–40 72 (40.2%)41–50 44 (24.6%)51–60 11 (6.1%)
Place of residenceRural 169 (94%)Urban 10 (6%)
Educational statusIlliterate 1 (0.6%)Lower primary or functional education 2 (1.1%)Upper primary or high school 158 (88.3%)Predegree or graduate 18 (10.1%)
Marital statusUnmarried 32 (17.39%)Married 146 (81.6%)Divorced 1 (0.6%)
Consumption of main meals from restaurantsRegular 112 (62.6%)Occasional 67 (37.4%)
Number of snacks taken between work hoursUp to 2 123 (68.1%)More than 2 57 (31.9%)
Dietary habitsTakes mixed diet 178 (99.4%)Vegan 1 (0.6%)
Consumption of On most days OccasionallyFish 160 (96%) 19 (4%)Egg 97 (58.2%) 82 (41.2%)Red meat 91 (54.6%) 88 (45.4%)Chicken 93 (55.8%) 86 (44.2%)Oily and fried items 98 (58.8%) 81 (41.2%)Junk food 52 (31.2%) 127 (68.8%)
Family history of illnessHypertension 40 (22.3%)Diabetes mellitus 38 (21.2%)Renal disease 0 (0%)
Whether diabetic?Yes 13 (7.3%)No 166 (92.7)
Number of family members to supportUp to 4 86 (48%)More than 4 93 (52%)
Number of children (𝑛 = 147)Up to 2 118 (80%)More than 2 29 (20%)

4 ISRN Preventive Medicine
Table 1: Continued.
Characteristic 𝑛 (%)Addictions
SmokingNon smokers 87 (49%)Current smokers 83 (46%)Quit smoking 9 (5%)
Alcohol consumptionNever consumed alcohol 55 (30.7%)Occasionally 107 (86.3%)Daily 17 (13.7%)
Pan or tobacco chewingYes 28 (15.6%)No 151 (84.4%)
Monthly income in rupeesUp to 40004001–8000 115 (64.3%)8001 and above 57 (31.8%)
Self reported rash driving 7 (3.9%)Past history of accidents 53 (29.6%)Personal habits 35 (19.6%)
Gets irritated oftenSleep inadequate 95 (53.1%)Inadequate physical activity 50 (27.9%)
Table 2: Mean values of important physical characteristics and JNC7 categories of BP in age groups.
Age category(years)
Mean SBP(mmHg)
Mean DBP(mmHg)
Mean BMI(kg/m2) Non-HTN Pre-HTN HTN Isolated systolic HTN
20–29 (𝑛 = 39) 119.28 ± 10.48 78.69 ± 8.59 22.00 ± 3.26 13 (33.3%) 19 (48.7%) 7 (17.9%) 2 (5.1%)30–39 (𝑛 = 75) 127.49 ± 13.72 84.09 ± 10.57 23.07 ± 3.10 10 (13.3%) 31 (41.3%) 34 (45.3%) 6 (8%)40–49 (𝑛 = 52) 129.17 ± 13.43 85.56 ± 9.79 23.16 ± 2.61 6 (11.5%) 21 (40.4%) 25 (48.1%) 3 (5.8%)50–59 (𝑛 = 13) 134.00 ± 16.02 88.46 ± 9.34 21.80 ± 2.29 1 (7.7%) 4 (30.8%) 8 (61.5%) 1 (7.7%)Total (𝑛 = 179) 126.66 ± 13.74 83.66 ± 10.18 22.77 ± 2.97 30 (16.8%) 75 (41.9%) 74 (41.3%) 12 (6.7%)
categories of BP are shown in Table 6. Taking the cut-off pointfor high BMI to be 25 kg/m2, hypertension was associatedwith high BMI (Chi-Square = 5.451; 𝑃 = 0.02). However, onassuming the cutoff point to be 23 kg/m2, the level ofsignificance increased (Chi-Square = 8.656; 𝑃 = 0.003).
Therewas significant association between longer durationof employment as bus driver and hypertensive status. Hyper-tensives were employed for a mean duration of 16.4 ± 8.22years, while nonhypertensives were employed for 13.40 ±8.10 years (Student’s 𝑡-test. 𝑡 = 2.48, 𝑃 = 0.014). In thestudy population, 7.26% (13/179) (95% CI = 3.46–11.06) wereself-reported diabetic patients among whom 61.54% (8/13)(95%CI = 35.09–87.99) were hypertensive also.Themean val-ues of systolic (134.08 ± 18.55mmHg) and diastolic (87.54 ±12.49) BPs were higher in diabetics compared to the remain-der. However, no statistically significant association couldbe discerned between HTN and diabetes mellitus.
Age > 35 years, being married, supporting more than 4familymembers, takingmainmeals from restaurants onmostworking days, eating egg on most days, BMI ≥ 23 kg/m2, andlonger duration of employment as bus driver were stronglyassociated with HTN on bivariate analysis. Binary logisticregression was done with these risk factors and currentsmoking and being diabetic as independent variables (dueto strong epidemiological association with HTN in previousstudies) as independent variables and HTN as dependantvariable. Age > 35 years (𝑃 = 0.015), BMI ≥ 23 kg/m2(𝑃 = 0.007), supporting more than four family members(𝑃 = 0.011), and takingmainmeals from restaurants onmostworking days (𝑃 = 0.017) were independently associatedwith HTN.
Out of 74 hypertensive individuals, 12.16% (9/74) (95%CI= 4.72−19.6) were aware of their hypertensive status, whileonly 4.05% (3/74) (95% CI = 0.00−8.54) were treated and

ISRN Preventive Medicine 5
Table 3: Association between sociodemographic and medical characteristics and HTN.
Risk factor Number of subjects, 𝑛 (%) Number of hypertensives, 𝑛 (%) Test statistic (𝜒2) 𝑃 valueAge
≤35 years 80 (44.7%) 21 (26.3%) 13.584 0.000>35 years 99 (55.3%) 53 (53.5%)
Place of residenceRural 169 (9404%) 69 (40.8%) 0.327 0.743Urban 10 (5.6%) 5 (50%)
Monthly incomeLess than Rs. 4000 74 (41.3%) 35 (39.3%) 1.846 0.114Rs. 4000 or more 105 (58.7%) 39 (37.1%)
Educational qualificationUp to secondary school 161 (89.9%) 67 (41.6%) 0.050 1.000Higher secondary and above 18 (10.1%) 7 (38.9%)
Marital statusUnmarried 32 (17.9%) 7 (21.9%) 6.089 0.010Married or divorced 147 (82.1%) 67 (45.6%)
Number of family members to supportUp to 4 86 (48%) 28 (32.6%) 5.265 0.024More than 4 93 (52%) 46 (49.5%)
Number of children (𝑛 = 147)Up to 2 118 (80.3%) 50 (42.4%) 2.478 0.086More than 2 29 (19.7%) 17 (58.6%)
Family history of hypertensionPresent 40 (22.3%) 16 (40.0%) 0.038 0.497Absent 139 (77.7%) 58 (41.7%)
Family history of diabetes mellitusPresent 38 (21.2%) 12 (31.6%) 1.896 0.116Absent 141 (78.8%) 62 (44.0%)
Diabetes mellitusPresent 13 (7.3%) 8 (61.5%) 2.358 0.149Absent 166 (92.7%) 66 (39.8%)
only 1.35% (1/74) (95% CI = 0.00−3.98) had BP adequatelycontrolled. No significant association was found betweenawareness about HTN and educational qualification (Chi-Square-0.033, 𝑃 = 1.000).
4. Discussion
Through our study we aimed to report the prevalence andspecial risk factors of HTN among occupational bus drivers,a particularly vulnerable group. 41.3% of the study populationwas found to be hypertensive. The only other study ontransit vehicle operators in India deals with HTN amongautorickshaw drivers of Nagpur among whom the reportedprevalence was 35.14% [11]. Only two studies have been pub-lished from South Asia on HTN in drivers. In one study, 200male bus driversworking for BangkokMass Transit Authoritywere screened for HTN. 23% of bus drivers were found to behypertensive compared to 15.85% of the normal population[12]. Another study conducted by Saleekul et al. in Bangkokobserved the prevalence of diastolic HTN to be 17.5% against7.7% of controls [13]. But numerous studies have investigated
this problem in the West. HTN rates among drivers werehigher than rates in comparison groups [14]. Ambulatory BPin drivers before, during, and after driving shifts was high[15]. Professional drivers especially those carrying passengerswere found to be at an increased risk of stroke, attributed toHTN and stress [6]. A survey showed that 74% of Irish taxidrivers were hypertensive [16].
The overall prevalence ofHTN in the study group ismuchhigher than the reported pooled prevalence of about 16–20%in India [17–19]. In the general population also, the prevalenceof HTN is higher in Kerala compared to the rest of India.Thishas been attributed in previous studies to an advanced stateof epidemiological transition existing in Kerala [7–9].
Thankappan et al. reported a HTN prevalence of about30% among males aged 30–59 years in Kumarakom, a rela-tively rural area in Kerala [7].The prevalence of hypertensionin similar age group in our study was 47.86%. Another studyconducted in Chemmaruthy, Varkala, a rural area, givesHTNprevalence of 31.2% amongmales 20–59 years old [9]. A thirdstudy reports a prevalence of 56.3% among urban males aged40–60 years which is comparable to our finding of 54.5% in
6 ISRN Preventive Medicine
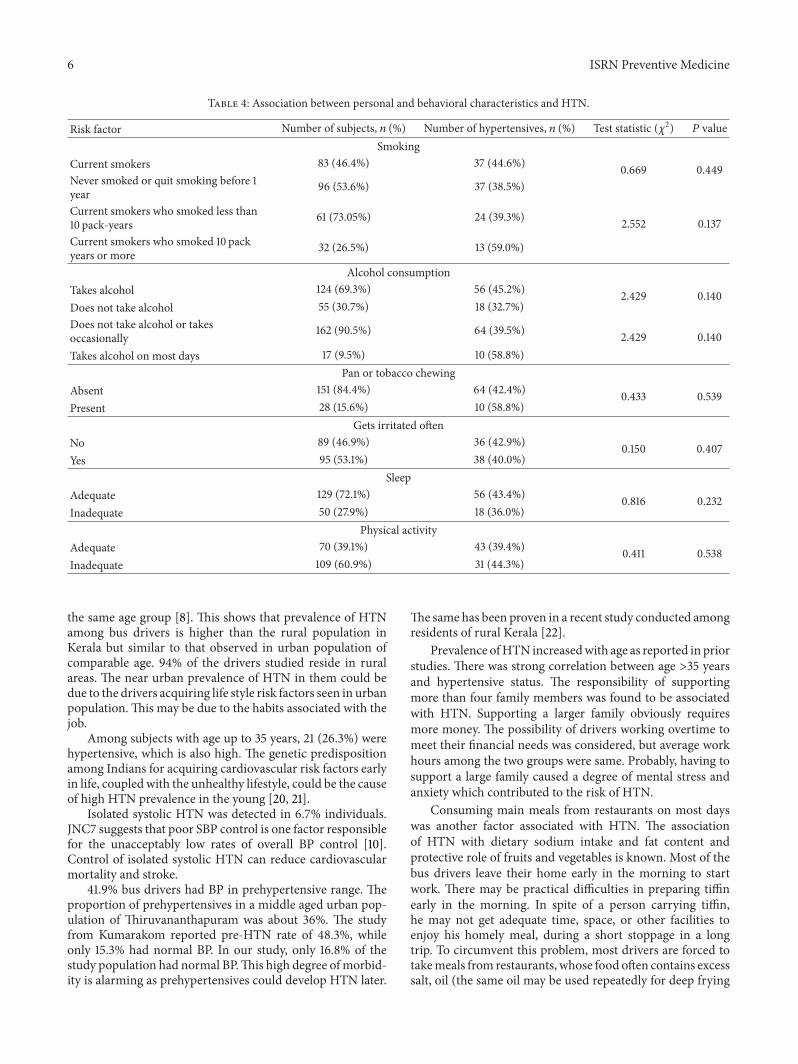
Table 4: Association between personal and behavioral characteristics and HTN.
Risk factor Number of subjects, 𝑛 (%) Number of hypertensives, 𝑛 (%) Test statistic (𝜒2) 𝑃 valueSmoking
Current smokers 83 (46.4%) 37 (44.6%) 0.669 0.449Never smoked or quit smoking before 1year 96 (53.6%) 37 (38.5%)
Current smokers who smoked less than10 pack-years 61 (73.05%) 24 (39.3%) 2.552 0.137Current smokers who smoked 10 packyears or more 32 (26.5%) 13 (59.0%)
Alcohol consumptionTakes alcohol 124 (69.3%) 56 (45.2%) 2.429 0.140Does not take alcohol 55 (30.7%) 18 (32.7%)Does not take alcohol or takesoccasionally 162 (90.5%) 64 (39.5%) 2.429 0.140Takes alcohol on most days 17 (9.5%) 10 (58.8%)
Pan or tobacco chewingAbsent 151 (84.4%) 64 (42.4%) 0.433 0.539Present 28 (15.6%) 10 (58.8%)
Gets irritated oftenNo 89 (46.9%) 36 (42.9%) 0.150 0.407Yes 95 (53.1%) 38 (40.0%)
SleepAdequate 129 (72.1%) 56 (43.4%) 0.816 0.232Inadequate 50 (27.9%) 18 (36.0%)
Physical activityAdequate 70 (39.1%) 43 (39.4%) 0.411 0.538Inadequate 109 (60.9%) 31 (44.3%)
the same age group [8]. This shows that prevalence of HTNamong bus drivers is higher than the rural population inKerala but similar to that observed in urban population ofcomparable age. 94% of the drivers studied reside in ruralareas. The near urban prevalence of HTN in them could bedue to the drivers acquiring life style risk factors seen in urbanpopulation.This may be due to the habits associated with thejob.
Among subjects with age up to 35 years, 21 (26.3%) werehypertensive, which is also high. The genetic predispositionamong Indians for acquiring cardiovascular risk factors earlyin life, coupledwith the unhealthy lifestyle, could be the causeof high HTN prevalence in the young [20, 21].
Isolated systolic HTN was detected in 6.7% individuals.JNC7 suggests that poor SBP control is one factor responsiblefor the unacceptably low rates of overall BP control [10].Control of isolated systolic HTN can reduce cardiovascularmortality and stroke.
41.9% bus drivers had BP in prehypertensive range. Theproportion of prehypertensives in a middle aged urban pop-ulation of Thiruvananthapuram was about 36%. The studyfrom Kumarakom reported pre-HTN rate of 48.3%, whileonly 15.3% had normal BP. In our study, only 16.8% of thestudy population had normal BP.This high degree ofmorbid-ity is alarming as prehypertensives could develop HTN later.
The same has been proven in a recent study conducted amongresidents of rural Kerala [22].
Prevalence ofHTN increasedwith age as reported in priorstudies. There was strong correlation between age >35 yearsand hypertensive status. The responsibility of supportingmore than four family members was found to be associatedwith HTN. Supporting a larger family obviously requiresmore money. The possibility of drivers working overtime tomeet their financial needs was considered, but average workhours among the two groups were same. Probably, having tosupport a large family caused a degree of mental stress andanxiety which contributed to the risk of HTN.
Consuming main meals from restaurants on most dayswas another factor associated with HTN. The associationof HTN with dietary sodium intake and fat content andprotective role of fruits and vegetables is known. Most of thebus drivers leave their home early in the morning to startwork. There may be practical difficulties in preparing tiffinearly in the morning. In spite of a person carrying tiffin,he may not get adequate time, space, or other facilities toenjoy his homely meal, during a short stoppage in a longtrip. To circumvent this problem, most drivers are forced totakemeals from restaurants, whose food often contains excesssalt, oil (the same oil may be used repeatedly for deep frying

ISRN Preventive Medicine 7
Table 5: Association between occupational and dietary characteristics an HTN.
Risk factor Number of subjects, 𝑛 (%) Number of hypertensives, 𝑛 (%) Test statistic (𝜒2) 𝑃 valueSelf-reported rash driving
No 53 (29.6%) 20 (37.7%) 0.403 0.321Yes 126 (70.4%) 54 (42.9%)
Past history of accidentNo 144 (80.4%) 59 (41.0%) 0.041 0.850Yes 35 (919.6%) 15 (42.9%)
Taking main meals from restaurants on working daysOccasionally or never 67 (37.4%) 20 (29.9%) 5.830 0.019On most days 112 (62.6%) 54 (48.2%)
Snacks taken between working hours≤2 122 (68.2%) 48 (39.3%) 0.630 0.515>2 57 (31.8%) 26 (45.6%)
Taking fish on most daysYes 160 (89.4%) 66 (41.3%) 0.005 1.000No 19 (10.6%) 8 (42.1%)
Taking red meat on most daysYes 91 (50.8%) 32 (35.2%) 2.911 0.097No 88 (49.2%) 42 (47.7%)
Taking egg on most daysYes 97 (54.2%) 33 (34.0%) 4.679 0.034No 82 (45.8%) 41 (50.0%)
Taking chicken on most daysYes 93 (52.0%) 35 (19.6%) 1.097 0.362No 86 (48.0%) 39 (21.8%)
Taking oily and fried items and junk food on most daysYes 98 (54.7%) 40 (40.8%) 0.025 0.880No 86 (48.0%) 34 (42.0%)
Table 6: Prevalence of hypertension among subjects according to WHO categories of BMI.
WHO category of BMI (kg/m2) Number of subjects, 𝑛 (%) Normal BP, 𝑛 (%) Prehypertension, 𝑛 (%) Hypertension, 𝑛 (%)<18.5 11 (6.1%) 6 (54.5%) 5 (45.5%) 0 (0%)18.5–24.99 130 (72.6%) 22 (16.9%) 56 (43.1%) 52 (40.0%)25–29.99 34 (19.0%) 2 (5.9%) 13 (38.2%) 19 (55.9%)≥30 4 (2.2%) 0 (0.0%) 1 (25.0%) 3 (75.0%)BMI: body mass index.
which is harmful), spices, and other additives tomake it morepalatable. This may explain the association we report.
There was significant association between prevalence ofHTN and being overweight (BMI ≥ 25 kg/m2). This is inaccordance with the published studies. It is seen that morbid-ity andmortality due to CVDs in Indians are higher in peoplewith lower BMI when compared to Western population [17].So, somehave advocated a cutoff point of 23 kg/m2 for normalBMI among Indian population. In the current study, when thecutoffpoint for highBMIwasmade 23 kg/m2, the significancelevels increased [17]. This supports the proposed cutoff of23 kg/m2.
We found significant association betweenHTNand dura-tion of employment as bus driver. Nevertheless, it was notan independent predictor in regression analysis. This was
probably due to age acting as a confounder. Some of thestudies have reported duration of employment as a risk factor[6, 12].
Many studies have attributed the higher prevalence ofHTNamong bus drivers to job stress especially while workingin heavy traffic (a “work barrier” which causes risky behavioror needs extra effort), factors in the occupational environ-ment, erratic work hours, sedentary lifestyle, and a sense ofunderpayment [2, 4–6, 15]. There are also studies that saythat there is no association between stress and HTN, whilesome others report inverse association between self-reportedstress and HTN [19, 23]. In our study, we explored this aspectwith self-reported traits like getting irritated often, frequentlyinvolving in heated exchanges, rash driving, previous involve-ment in accidents, and subjective feeling of adequate sleep
8 ISRN Preventive Medicine
and exercise. We could not find any association betweenthese factors andHTN. Explanations that have been given forthis inconsistent association between stress andHTN includeadverse situations making a person angry which facilitatesdevelopment of HTN and HTN altering perception of thedegree of stress [23].
HTN and diabetes mellitus often go hand in hand as partof the metabolic syndrome. However, we could not find anyassociation between the two in the present study. This maybe due to the small sample surveyed. In addition, our studypopulation was relatively young, about 70% being below 40years. Around middle age, many bus drivers tend to leave thevocation. In the young, type 2 diabetes is asymptomatic andoften goes undiagnosed unless blood sugar is estimated. Ourstudy relied entirely on subjects’ self-reporting of diabetes ifpreviously detected. 61.54% of diabetics were having HTNin our study, a figure comparable to the Kumarakom study[7]. We observed that diabetics have higher mean values ofsystolic and diastolic BPs.
We analyzed the relation between HTN and (a) smokingstatus (current smokers versus nonsmokers and quit smok-ers) as well as (b) degree of exposure estimated as pack-yearsof smoking.We were not able to find any association betweensmoking andHTN.There was no difference in distribution ofsmoking among hypertensives and normotensives. It may bepossible to clarify the relation by studying a larger sample ofthe population.
Consumption of fish on most days was found to beprotective against development of HTN in one study, likelyexplanation being the higher content of polyunsaturated-𝜔3-fatty acids in fish [19]. We could not find such a protectiveeffect in the present study. This could be because, majorityof the population under study are habitual fish eaters. (96%),so that the protective effect could not reveal itself for lack ofcontrast. It could also be due to the culinary practices liketaking fried fish.
The levels of awareness, treatment, and adequate controlof BP are poor in India compared to the West [10]. In thestudy from rural Kerala, 20.6% of men were aware of theirhypertensive status, 16.4% were treated, and 4.6% had theirBP controlled [7]. These figures were 33.7%, 22.8%, and 8%,respectively, among urban males of Kerala [8]. AwarenessaboutHTN (12.1%) among bus drivers is lower than the abovevalues. The proportion of hypertensives receiving treatmentand having their BP reduced to target levels is very low. Thislow level of awareness, treatment, and optimal control of BPis unacceptable considering the high literacy level of Kerala.Poor awareness about HTN may reflect (a) lack of frequentcontact with the health system, (b) deficits in routine clinicalexamination on patients, or (c) a lower degree of overallawareness about CVDs, risk factors, and prevention.
The principal strength of our study was that multiple BPreadings were obtained. All the measurements were done inthe field. Subjects with abnormal BP were advised regardingappropriate medical care. One of our limitations was notmeasuring the abdominal circumference which correlatesbetter with HTN than BMI. We did not quantify ingestionof salt and alcohol. Employing a questionnaire which willobjectively assess the driving habits and compare the stress
levels with other occupations will provide more insight intothe factors contributing to HTN. Similar studies should beconducted on a larger scale at multiple centers and involvingmore refined techniques and expertise to yield better results.
To conclude, the prevalence of HTN among male busdrivers of Kerala is very high. A close-to-urban unhealthylifestyle acquired as part of their job lies at the heart ofthe problem. They are at risk of developing coronary arterydisease, stroke, and chronic kidney disease in future.This willcause significant mortality and morbidity, reduce economicand social participation, and burden their family as well asthe nation’s health system. All occupational drivers should bescreened for lifestyle diseases at entry into the vocation andthen periodically. This by itself can reduce mortality due toCVDs [2]. Those at risk should be rehabilitated to protecttheir own health and to ensure the safety of passengers.The study underscores the pressing demand for targetededucational interventions, regular health checkups, andappropriate lifestyle modifications among bus drivers.
Conflict of Interests
The authors declare that they have no conflict of interests inthe present study.
Acknowledgments
This project was done under Short Term Studentship (STS)-2008 of Indian Council of Medical Research. This study waspresented in poster form at the Annual Conference of IndianSociety of Hypertension, 2011, held at Kozhikode, Kerala,India.
References
[1] World Health Organization and W. van Lerberghe, PrimaryHealth Care: Now more than Ever, World Health Organization,Geneva, Switzerland, 2008.
[2] L. Alfredsson, N. Hammar, and C. Hogstedt, “Incidence ofmyocardial infarction andmortality from specific causes amongbus drivers in Sweden,” International Journal of Epidemiology,vol. 22, no. 1, pp. 57–61, 1993.
[3] C. Bigert, P. Gustavsson, J. Hallqvist et al., “Myocardial infarc-tion among professional drivers,” Epidemiology, vol. 14, no. 3,pp. 333–339, 2003.
[4] H. Hannerz and F. Tuchsen, “Hospital admissions among maledrivers in Denmark,” Occupational and Environmental Med-icine, vol. 58, no. 4, pp. 253–260, 2001.
[5] B. Netterstrom and K. Juel, “Impact of work-related and psy-chosocial factors on the development of ischemic heart diseaseamong urban bus drivers in Denmark,” Scandinavian Journal ofWork, Environment and Health, vol. 14, no. 4, pp. 231–238, 1988.
[6] F. Tuchsen, H. Hannerz, C. Roepstorff, and N. Krause, “Strokeamong male professional drivers in Denmark, 1994–2003,”Occupational and Environmental Medicine, vol. 63, no. 7, pp.456–460, 2006.
[7] K. R. Thankappan, S. Sivasankaran, S. Abdul Khader et al.,“Prevalence, correlates, awareness, treatment, and control ofhypertension in Kumarakom, Kerala: baseline results of a

ISRN Preventive Medicine 9
community-based intervention program,” IndianHeart Journal,vol. 58, no. 1, pp. 28–33, 2006.
[8] M. G. Zachariah, K. R.Thankappan, S. C. Alex, P. S. Sarma, andR. S. Vasan, “Prevalence, correlates, awareness, treatment, andcontrol of hypertension in a middle-aged urban population inKerala,” Indian Heart Journal, vol. 55, no. 3, pp. 245–251, 2003.
[9] T. S. Prasanth and K. Vijayakumar, “Prevalence of SystemicHypertension among the rural residents of Kerala,” CalicutMedical Journal, vol. 6, no. 3, article e4, 2008.
[10] A. V. Chobanian, G. L. Bakris, H. R. Black et al., “Seventh reportof the Joint National Committee on Prevention, Detection,Evaluation, and Treatment of High Blood Pressure,” Hyperten-sion, vol. 42, no. 6, pp. 1206–1252, 2003.
[11] S. S. Chaudhary, M.M. Nagargoje, S. S. Kubde, S. C. Gupta, andS. K. Misra, “Prevalence of cardiovascular diseases risk factorsamong auto-rickshaw drivers,” Indian Journal of CommunityHealth, vol. 22, no. 1-2, pp. 32–34, 2011.
[12] O. Kaewboonchoo and S. Kalampakorn, “Hypertension amongbus drivers in Bangkok, Thailand,” 2011, http://www.nurs-inglibrary.org/vhl/handle/10755/166988.
[13] S. Saleekul, A. Pauwattana, and O. Kaewboonchoo, “Hyper-tension among bus drivers in an urban area, Thailand,” New-port Beach, 2005, http://www.workhealth.org/2005%20ICOH/ICOH%20final%20program.html.
[14] D. R. Ragland, M. A. Winkleby, and J. Schwalbe, “Prevalence ofhypertension in bus drivers,” International Journal of Epidemi-ology, vol. 16, no. 2, pp. 208–214, 1987.
[15] K. Belkic, R. Emdad, and T.Theorell, “Occupational profile andcardiac risk: possible mechanisms and implications for profes-sional drivers,” International Journal of Occupational Medicineand Environmental Health, vol. 11, no. 1, pp. 37–57, 1998.
[16] “3 in 4 taxi drivers have hypertension,” 2006, http://www.irishhealth.com/article.html?id=9510.
[17] S. Guha, A. Ghosh, N. Chatterjee et al., “Risk factors forcoronary heart disease in Indians: a case-control study fromEastern India,” Indian Heart Journal, vol. 57, no. 6, pp. 738–740,2005.
[18] R. Gupta, “Meta-analysis of prevalence of hypertension inIndia,” Indian Heart Journal, vol. 49, no. 4, p. 450, 1997.
[19] S. K. Das, K. Sanyal, and A. Basu, “Study of urban communitysurvey in India: growing trend of high prevalence of hyperten-sion in a developing country,” International Journal of MedicalSciences, vol. 2, no. 2, pp. 70–78, 2005.
[20] S. Markan, M. Sachdeva, B. S. Sehrawat, S. Kumari, S. Jain,and M. Khullar, “MTHFR 677 CT/MTHFR 1298CC genotypesare associated with increased risk of hypertension in Indians,”Molecular and Cellular Biochemistry, vol. 302, no. 1-2, pp. 125–131, 2007.
[21] K. Srivastava, R.Narang, V. Sreenivas, S. Das, andN.Das, “Asso-ciation of eNOS Glu298Asp gene polymorphism with essentialhypertension in Asian Indians,” Clinica Chimica Acta, vol.387, no. 1-2, pp. 80–83, 2008.
[22] T. Sathish, S. Kannan, P. S. Sarma, O. Razum, and K. R.Thankappan, “Incidence of hypertension and its risk factors inrural Kerala, India: a community-based cohort study,” PublicHealth, vol. 126, no. 1, pp. 25–32, 2012.
[23] M. A. Winkleby, D. R. Ragland, and S. L. Syme, “Self-reportedstressors and hypertension: evidence of an inverse association,”American Journal of Epidemiology, vol. 127, no. 1, pp. 124–134,1988.

Submit your manuscripts athttp://www.hindawi.com
Stem CellsInternational
Hindawi Publishing Corporationhttp://www.hindawi.com Volume 2014
Hindawi Publishing Corporationhttp://www.hindawi.com Volume 2014
MEDIATORSINFLAMMATION
of
Hindawi Publishing Corporationhttp://www.hindawi.com Volume 2014
Behavioural Neurology
EndocrinologyInternational Journal of
Hindawi Publishing Corporationhttp://www.hindawi.com Volume 2014
Hindawi Publishing Corporationhttp://www.hindawi.com Volume 2014
Disease Markers
Hindawi Publishing Corporationhttp://www.hindawi.com Volume 2014
BioMed Research International
OncologyJournal of
Hindawi Publishing Corporationhttp://www.hindawi.com Volume 2014
Hindawi Publishing Corporationhttp://www.hindawi.com Volume 2014
Oxidative Medicine and Cellular Longevity
Hindawi Publishing Corporationhttp://www.hindawi.com Volume 2014
PPAR Research
The Scientific World JournalHindawi Publishing Corporation http://www.hindawi.com Volume 2014
Immunology ResearchHindawi Publishing Corporationhttp://www.hindawi.com Volume 2014
Journal of
ObesityJournal of
Hindawi Publishing Corporationhttp://www.hindawi.com Volume 2014
Hindawi Publishing Corporationhttp://www.hindawi.com Volume 2014
Computational and Mathematical Methods in Medicine
OphthalmologyJournal of
Hindawi Publishing Corporationhttp://www.hindawi.com Volume 2014
Diabetes ResearchJournal of
Hindawi Publishing Corporationhttp://www.hindawi.com Volume 2014
Hindawi Publishing Corporationhttp://www.hindawi.com Volume 2014
Research and TreatmentAIDS
Hindawi Publishing Corporationhttp://www.hindawi.com Volume 2014
Gastroenterology Research and Practice
Hindawi Publishing Corporationhttp://www.hindawi.com Volume 2014
Parkinson’s Disease
Evidence-Based Complementary and Alternative Medicine
Volume 2014Hindawi Publishing Corporationhttp://www.hindawi.com