research article recommendations for the regionalizing · pdf fileresearch article...
TRANSCRIPT

RESEARCH ARTICLE
Recommendations for the Regionalizing ofCoffee Cultivation in Colombia: AMethodological Proposal Based on Agro-Climatic IndicesJuan Carlos Garcıa L.1,2*, Huver Posada-Suarez3, Peter Laderach4
1. Production and Productivity Program, National Center for Coffee Research (CENICAFE), Manizales,Colombia, 2. Agricultural Sciences Faculty, Universidad de Caldas, Manizales, Colombia, 3. TechnicalDivision, National Federation of Coffee Growers of Colombia (FNC), Santafe de Bogota, Colombia, 4.Decision and Policy Analysis (DAPA), International Center for Tropical Agriculture (CIAT), Cali, Colombia
Abstract
The Colombian National Federation of Coffee Growers (FNC) conducted an agro-
ecological zoning study based on climate, soil, and terrain of the Colombian coffee-
growing regions (CCGR) located in the tropics, between 1˚ and 11.5˚ N, in areas of
complex topography. To support this study, a climate baseline was constructed at a
spatial resolution of 5 km. Twenty-one bioclimatic indicators were drawn from this
baseline data and from yield data for different coffee genotypes evaluated under
conditions at eight experimental stations (ESs) belonging to the National Center for
Coffee Research (CENICAFE). Three topographic indicators were obtained from a
digital elevation model (DEM). Zoning at a national level resulted in the
differentiation of 12 agro-climatic zones. Altitude notably influenced zone
differentiation, however other factors such as large air currents, low-pressure
atmospheric systems, valleys of the great rivers, and physiography also played an
important role. The strategy of zoning according to coffee-growing conditions will
enable areas with the greatest potential for the development of coffee cultivation to
be identified, criteria for future research to be generated, and the level of technology
implementation to be assessed.
Introduction
Coffee is one of the most important commodities in the international agricultural
market and a source of income for many countries in Asia, Africa and Latin
OPEN ACCESS
Citation: Garcıa L. JC, Posada-Suarez H,Laderach P (2014) Recommendations for theRegionalizing of Coffee Cultivation in Colombia: AMethodological Proposal Based on Agro-ClimaticIndices. PLoS ONE 9(12): e113510. doi:10.1371/journal.pone.0113510
Editor: Dafeng Hui, Tennessee State University,United States of America
Received: December 19, 2013
Accepted: October 28, 2014
Published: December 1, 2014
Copyright: � 2014 Garcıa L. et al. This is anopen-access article distributed under the terms ofthe Creative Commons Attribution License, whichpermits unrestricted use, distribution, and repro-duction in any medium, provided the original authorand source are credited.
Funding: The Colombian National Federation ofCoffee Growers (FNC, its Spanish acronym)funded Juan Carlos Garcıa L.’s doctoral program.The FNC provided the information used in thedevelopment of the thesis, as research outcomedata, the coffee weather information network, andthe coffee information system (SICAH, its Spanishacronym), which is related to the characterizationof coffee farms. The base information used byJuan Carlos Garcıa L. as part of his doctoral thesiswas restricted to the scope thereof and the resultsgenerated from this will be public, with priority usefor the Colombian coffee growers. The salary ofresearchers Huver Posada and Juan Carlos GarcıaL. is in charge of the FNC. The salary of PeterLaderach and the logistics of the seven monthsinternship conducted by Juan Carlos Garcıa L. wasassumed by CIAT (Centro Internacional deAgricultura Tropical). The donors had no role instudy design, data collection and analysis, decisionto publish, or preparation of the manuscript.
Competing Interests: The authors have declaredthat no competing interests exist.
PLOS ONE | DOI:10.1371/journal.pone.0113510 December 1, 2014 1 / 22

America. In the period from 1965 to 1995, Colombia contributed to an average of
13.5% of world production, and between 2000 and 2011 to 7.6% [1]. The coffee
crop (Coffea arabica) represents 17% of Colombia’s agricultural gross domestic
product and constitutes 9% of its agricultural output. About 2.2 million people
depend directly on coffee for their livelihoods, this figure is equivalent to 25% of
Colombia’s rural population and 31% of its national labour force employed in
agriculture [2]. Much of this employment is seasonal, part-time and informal [1],
with jobs directly generated by the coffee industry distributed among the
following activities: investment (3.9%); management (65.2%); harvest (29.5%);
and postharvest (1.4%) [3].
The Colombian coffee-growing regions, lie between 1˚and 11.5˚N, and 72˚and
78˚ E, encompassing the Western, Central, and Eastern Andean Ranges, as well as
the mountain system of the Sierra Nevada of Santa Marta in northern Colombia
[4]. Coffee plantations are found at altitudes between 800 and 2000 masl.
CENICAFE has experimental stations (ESs) located in important coffee-
growing areas, in the states of Caldas, Antioquia, Tolima, Risaralda, Cauca,
Cundinamarca, Cesar and Quindıo. These highly technological coffee farms
include the Central Experimental Station Naranjal, ES Rosario, ES La Trinidad, ES
La Catalina, ES El Tambo, ES Santa Barbara, ES Pueblo Bello and ES Paraguaicito.
In Colombia, the intertropical convergence zone is responsible for the existence
of two dry and two wet seasons per year [4, 5, 6]. These seasons determine the two
coffee harvesting periods, with variations in the northern and southern extremes
of the CCGR where a mono-modal rainfall distribution results in a concentrated
harvest [4, 5, 6, 7]. The relative intensity of the dry season (1 to 2 months) has
repercussions on the production cycle, from flowering to harvesting, with
variability observed between 215 to 240 days at 5˚ N and 11˚ N, respectively [5].
Colombia is characterized by climatic complexity, with temporal variability
rendering the association of a pattern of reaction to an agronomic variable with
given climatic elements, as difficult. The country’s climate was first classified by
Hurtado into seven groups using Thornthwaite’s classification criteria [8]. Later,
Baldion and Hurtado [9] proposed five groups based on agro-climatic indices
derived from hydric balances obtained through Palmer’s method [10] which
collected climate information over a period of 10 years. More recently, Malagon et
al. introduced the concept of bioclimatic factors related to soil formation,
emphasizing the importance of temperature and soil moisture in soil evolution
[11].
The FNC studied soils, climates, and terrains in the coffee-growing regions
defined by the 1980–1981 Coffee Plantations Census. In total, 86 agro-ecological
zones known as ecotopes were identified where coffee trees responded to their
environment in similar ways and where geographic area was homogenous and
continuous [4].
In several studies in Brazil, the use of indicators for coffee has permitted the
following activities:
N Estimation of the length of different phenological periods [12, 13, 14]
Agro-Climatic Proposal for Coffee Cultivation
PLOS ONE | DOI:10.1371/journal.pone.0113510 December 1, 2014 2 / 22

N Development of agro-climatic models for estimating productivity [15, 16]
N Construction of agro-climatic zones for delimiting homogeneous areas by their
performance and defining their limitations, advantages, and risks [17, 18]
N Design of frost-alert systems [19]
In Colombia, indices have been constructed taking into account the crop’s
physiological periods, in particular, flowering [20, 21], fruit development [7], and
the entire cycle from planting to harvest [22]. These indices help to establish
criteria for season planning [23, 24, 25].
This research aims to identify coffee-growing areas with similar agro-climatic
characteristics and determine if the scope of current research is sufficiently
regional in terms of its coverage. This will contribute to important future
decision-making processes by coffee growers in the diverse regions of the country.
Materials and Methods
The methodology consisted of defining and acquiring the baseline and the
bioclimatic indicators, and then incorporating field attributes of the coffee-
growing regions. This methodology was adopted following previous analysis
which used climatic elements such as annual precipitation and temperature. The
results of the agro-climatic groups (ACGs) obtained are presented in a later
section of this paper.
2.1. Physiological data
2.1.1. Information on harvesting patterns
Based on Arcila et al. [23], a harvest raster adjusted to the Colombian coffee-
growing regions was generated using two criteria: the main harvest predominating
in the first semester (between January and June) and the main harvest
predominating in the second semester (between July and December). These
criteria were used to construct the coffee tree’s physiological stages (detailed
below), with their corresponding peak harvesting months for the zones with first
and second semester harvests (May and October, respectively).
2.1.2. Consolidation periods and physiological phases
Three physiological phases were defined as occurring before the main harvest,
relating to the bioclimatic indices described above:
a. Four months before maximum flowering (which defines the principal harvest):
hereafter referred to as stage 1. This phase begins with the flowering induction,
followed by the appearance of latent floral buds, and finally the occurrence of
flowering after a rainfall. [20, 26].
b. First four months of berry development (towards the principal harvest):
hereafter referred to as stage 2. In this phase, the completion of the early
phases of coffee berries development towards final seed size take place. [7, 26].
Agro-Climatic Proposal for Coffee Cultivation
PLOS ONE | DOI:10.1371/journal.pone.0113510 December 1, 2014 3 / 22

c. Four months before the principal harvest: hereafter referred to as stage 3. In this
phase coffee berries acquire their uniformity and final weight. [7, 26].
2.2. Environmental data
2.2.1. Climate information
More than 20 years of historical information on precipitation, temperatures
(minimum, mean, and maximum), and solar brightness from 80 meteorological
stations of the FNC’s coffee climate network was used for this study. Daily
information from the coffee-growing regions was modelled using Hutchinson’s
methodology [27] together with the ANUSPLIN interpolator, version 4.3 (which
uses geographic coordinates and terrain elevation as independent variables). This
procedure has been used in global studies undertaken by Hutchinson [28] and
others [29, 30, 31, 32, 33, 34]. Usually, the strategy of generating daily data requires
the adaptation of programming routines in the R Platform [35, 36].
2.2.2. Information on the water retention capacity of soil
Soil water retention (SWR), also known as maximum storage in hydric balance, is
defined in terms of field capacity (fc), permanent wilting point (pwp), apparent
density (ad), and depth of the coffee tree’s root zone (d). The formula is as follows:
SWR~½(fc{pwp) � ad � d�
10[37]
Information on the shape of soil units (digitized from findings in FNC’s
framework study on coffee ecotopes [4]) was crossed with the results of the
physical characterization (fc, pwp, ad, d) carried out by Suarez [38] on some of
these units. A raster with information on soil water retention was generated. To
assure the zone’s continuity, in areas not covered by Suarez’s study [38] a
theoretical daily retention capacity of 50 mm was assigned, based on test results
from hydric balances of CENICAFE’s Agroclimatology Research Group.
2.2.3. Generating buffer zones adjusted to CCGR
Following the delimitation of coffee-growing plantations or farms, additional
bordering areas or buffer zones of 3 km wide were generated to cover the edges of
coffee-growing regions and facilitate generation of daily information on
bioclimatic indices. Through this information, 5789 pixels or centroids across
CCGR were obtained.
2.2.4. Constructing the bioclimatic indices
Twenty one bioclimatic indices were obtained and classified into 3 groups: 9
moisture indices, 6 solar brightness indices and 6 thermal indices. Most
bioclimatic indicators were developed on a point basis, given that they were
associated with, for example, meteorological stations collecting largely pluvio-
metric information together with historical information.
Agro-Climatic Proposal for Coffee Cultivation
PLOS ONE | DOI:10.1371/journal.pone.0113510 December 1, 2014 4 / 22

Moisture indices: To calculate the daily hydric balance, a routine was generated
in R Platform [35], according to the methodology described and adapted by
Jaramillo et al. [39, 37] At the end of the routine, the soil water index (SWI) was
obtained (i.e. the difference between real evapotranspiration [ETr] and potential
evapotranspiration [ETp]). Its values are expressed between 0 and 1, where 0
corresponds to completely dry soil, and 1 to all the porous spaces being filled.
Moderate hydric deficit (MHD) falls in the range 0.5# SWI #0.8, while severe
hydric deficit (SHD) is established at SWI ,0.5. For each stage, the number of
days, and the accumulated daily rainfall (ppt) observed satisfied the criteria for
one of the two indices. The following bioclimatic indicators were generated:
ppt1 5 accumulated rainfall, stage 1
ppt2 5 accumulated rainfall, stage 2
ppt3 5 accumulated rainfall, stage 3
md1 5 number of days with MHD, stage 1
md2 5 number of days with MHD, stage 2
md3 5 number of days with MHD, stage 3
sd1 5 number of days with SHD, stage 1
sd2 5 number of days with SHD, stage 2
sd3 5 number of days with SHD, stage 3
Solar brightness indices: An R Platform routine was generated to calculate
solar radiation (SR), using Campbell and Donatelli’s methodology as described by
Meza and Varas [40] and Rivington et al. [41, 42]. Solar brightness (SB) is
calculated from SR, based on (a) coefficients a and b obtained by Gomez and
Guzman [43], using the Angstrom formula, and (b) the methodology presented in
Appendix C of the Atlas de Radiacion Solar de Colombia [44]. The difference
between the duration of the astronomical day in hours and SB gives the solar
brightness deficit (SBD). For each of the physiological stages established, the
hours of SB were counted, together with days where SBD was ,7.2 [21], to
generate the following bioclimatic indicators:
sb1 5 accumulated SB, stage 1
sb2 5 accumulated SB, stage 2
sb3 5 accumulated SB, stage 3
bd1 5 number of days with SBD at ,7.2, stage 1
bd2 5 number of days with SBD at ,7.2, stage 2
bd3 5 number of days with SBD at ,7.2, stage 3
Thermal indices: The indices for Thermal Amplitude (TA) or thermal gradient
(Tmax – Tmin,) and Thermal Time (TT) or degree days (Tmean – Tbase) were
generated from information on maximum (Tmax), minimum (Tmin), and mean
(Tmean) temperatures, and with the lowest base temperature (Tbase) of 10 C, as
determined for coffee trees in Colombia by Jaramillo and Guzman [22]. For each
Agro-Climatic Proposal for Coffee Cultivation
PLOS ONE | DOI:10.1371/journal.pone.0113510 December 1, 2014 5 / 22

of the three physiological stages proposed, the TT and the number of days with
TA at,10 were accumulated [21]. The following bioclimatic indices were
generated:
tt1 5 accumulated TT, stage 1
tt2 5 accumulated TT, stage 2
tt3 5 accumulated TT, stage 3
ta1 5 number of days with TA at ,10, stage 1
ta2 5 number of days with TA at ,10, stage 2
ta3 5 number of days with TA at ,10, stage 3
2.2.5. Incorporating the bioclimatic indices to the geo data base
As well as constructing the 21 bioclimatic indices, each of the 5789 centroids was
associated with the physiographic components of aspect, shade, and slope, thus
incorporating 24 attributes per pixel. This also served to geo-reference the pixels.
2.2.6. Topographic information
Terrain attributes such as elevation, slope, hillside shade, and aspect were
generated from the DEM of the Shuttle Radar Topography Mission [45]. A
resolution of 5 km was used for national zoning, taking into consideration only
pixels where the area covered by coffee was more than 30%.
2.3. Statistical methodology
2.3.1. Multivariate analysis
The multivariate analysis described by Pena and Dıaz [46, 47], and the statistical
package ‘‘ade4’’ [48] in the R platform were used. The selection of synthetic
variables was based on the maximum degree of variability that was explained by
the PCA, where the eigenvalues were equal to or greater than 1. Due to the fact
that the original variables were standardized before the PCA was performed, the
means of the standardized variables were zero and the variances were equal to one.
A cluster analysis was also undertaken, using PCAs from the previous analysis.
Two aspects were considered: similarity measures and clustering methods [46, 47].
For the first aspect, according to the method, the proximity of observations must
be measured; in this case, the Euclidean distance was used. For the second aspect,
clusters were formed, whereby observations were selected to be as similar and as
different as possible within and between clusters, respectively. K-means clustering,
a partitioning method that assumes the existence of an Euclidean distance
between the members comprising the cluster, was used to construct this time
series [49, 50]. Indices of similarity and quality as proposed by Liao [49] were
assumed as criteria for evaluating and deciding on cluster formation. The R
routine was adapted to the needs of the current research, using the statistical
package ‘‘cclust’’ from R Platform [51].
Agro-Climatic Proposal for Coffee Cultivation
PLOS ONE | DOI:10.1371/journal.pone.0113510 December 1, 2014 6 / 22

Results
3.1. Forming agroclimatic groups for the CCGR
Six principal components represented 86% of the variability attributable to the
original 24 variables (21 bioclimatic and 4 topographic indices). The first
component explained 34% of total variation, comprising most of the bioclimatic
indicators; except sd2, sb2, ppt1, ta3, sb3, bd3, md1, and sd1, which were not
significant. The second component explained 21.5% of the variation and was
composed of six bioclimatic indicators: sb2, sb3, bd3, ta3, ppt1, and sd1.
Components 3 to 6 explained 11.7, 7.5, 6.6, and 5.0% of the variation respectively.
Component 5 was represented by the topographic indicators of aspect and shade.
Slope showed a relationship with component 6 (Table 1).
The six components were taken into account in the cluster analysis. The clustering
test considered 40 combinations for 39 possible groups with 100 iterative processes
for each one. The cluster for agroclimatic group 12 (ACG 12) showed three
situations of interest: (a) a similarity index mean value of 75% and the least
fluctuation on the range of all the groups, even though the extreme values were 64
and 90%; (b) a quality index mean value of 2.47 with minimum variation; and, (c)
78.9% of variability explained, with a fluctuation between 77.5 and 79.5% (Figure 1).
The above-mentioned results show the need to subject the indices to increased
control when deciding on the number of groups to be formed.
The process focused on seeking, within each of the 12 ACGs, the particular
conditions that differentiated them. Table 2 lists, for each ACG, the mean values
of the 21 bioclimatic and 4 topographic indices (including altitude obtained from
a DEM with a resolution of 90 m).
3.1.1. Distribution of experimental stations and the coffee climate network in the
setting of agro-climatic groups
The red dots in Figure 2 show the distribution of CENICAFE’s ESs throughout the
ACGs. Four ESs — El Rosario, Naranjal, La Trinidad, and La Catalina — lie within ACG
9, whereas ESs El Tambo and Santa Barbara lie within ACG 12. The two remaining ESs
are situated in different ACGs, namely, ES Pueblo Bello in ACG 6 and ES Paraguaicito in
ACG 4. The main stations in the coffee climate network, totaling 74 and forming part of
CENICAFE’s ESs, are represented inFigure 2 by yellow dots. Aside from ACG 2, they are
distributed throughout all the ACGs, cover different types of areas.
3.1.2. Description of the agro-climatic groups
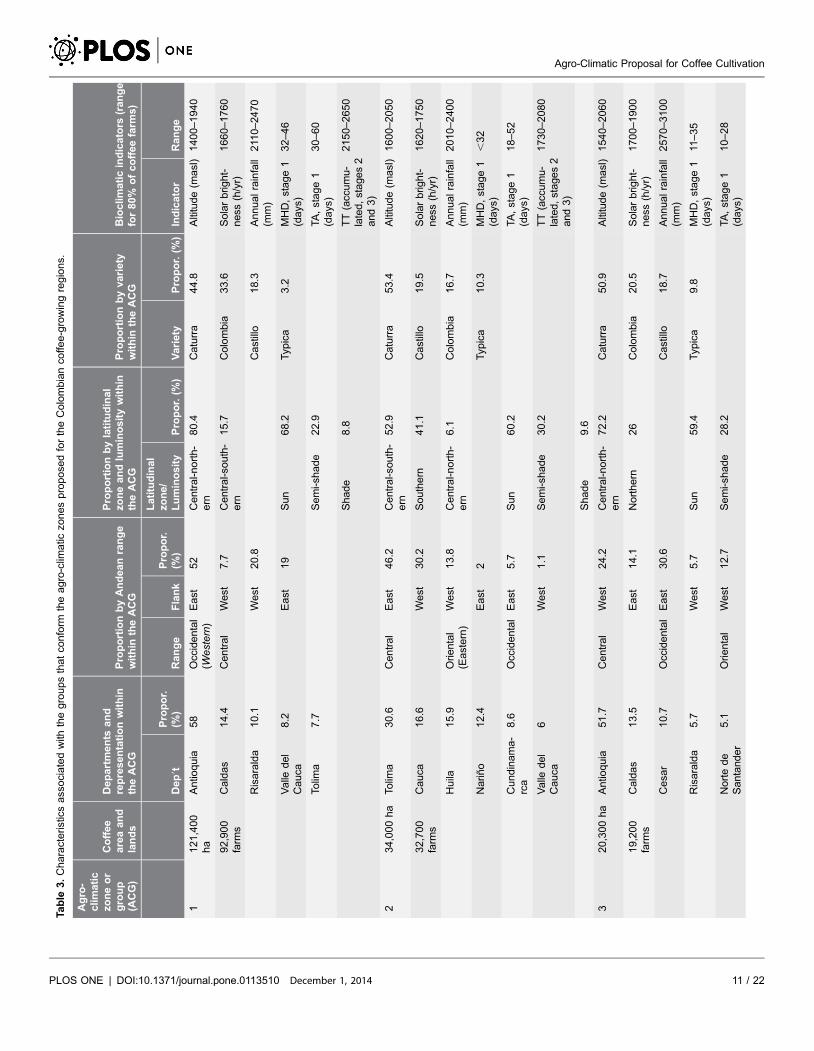
Tables 2 and 3 characterize the ACGs, showing bioclimatic and topographic
differences, and other characteristics such as varieties and luminosity. The last
column of Table 3 provides the ranges of the most noteworthy bioclimatic and
topographic indicators. In particular, the ACGs present variable ranges of altitude,
from the predominantly low as in ACGs 6 and 10, in which sd1 is accentuated
with more than 59% of its coffee-growing area under shade, to ACGs found
mostly in high zones (ACGs 2, 3, and 12), where thermal time values between
flowering and harvest are predominantly less than 2500 hours (Figure 2).
Agro-Climatic Proposal for Coffee Cultivation
PLOS ONE | DOI:10.1371/journal.pone.0113510 December 1, 2014 7 / 22

Discussion
4.1. Agro-climatic groups
The cluster analysis describes relevant characteristics that either contribute to, or
limit coffee production. The methodology is based on factors that occur before
the crop’s principal harvest, over the three stages of the reproductive period, that
is, the physiological events of pre-flowering, flowering, and fruit growth until
Table 1. Principal Component Analysis from the twenty four bioclimatic indices.
Principal Component Eigenvalues Explication of the Variability
1 8.13 33.90%
2 5.15 55.40%
3 2.81 67.10%
4 1.81 74.60%
5 1.58 81.20%
6 1.2 86.10%
doi:10.1371/journal.pone.0113510.t001
Figure 1. Boxplot from three indexes, Quality of Elbow and Similarity and Quality of Liao, built to determine the best decision criteria for groups,in an analysis of k-means clustering in the ACG. The axis "x" represents the k group level and the axis ‘‘y" the value of each index, the first and lastvalues are expressed from 0–1, with 1 being the perfect fit. The red box highlights the group with best fit.
doi:10.1371/journal.pone.0113510.g001
Agro-Climatic Proposal for Coffee Cultivation
PLOS ONE | DOI:10.1371/journal.pone.0113510 December 1, 2014 8 / 22

Table
2.Meanva
luesthatdiscrim
inate,using21bioclim
atic
and4topographic
indices,
among12agro-clim
atic
groups(ACGs)
resu
ltingfrom
clusteranalysisfortheColombian
coffe
e-growingregions.
ACG
BioclimaticIndicator
Topographic
Indicator
sb1
sb2
sb3
sd1
sd2
sd3
md1
md2
md3
bd1
bd2
bd3
ta1
ta2
ta3
pp1
pp2
pp3
tr1
tr2
tr3
hs
asp
slp
elev
1510
626
575
10
043
14
054
53
42
43
72
66
537
868
886
1194
1236
1163
175
124
4.66
1698
2598
482
588
00
011
13
55
30
63
33
59
42
598
772
771
916
982
967
181
167
4.81
1824
3575
656
526
00
025
60
78
57
20
21
37
53
597
1048
1116
1039
1046
897
176
135
4.93
1815
4667
363
431
96
10
22
16
34
75
20
61
123
120
304
749
674
1327
1288
1288
185
279
4.14
1512
5585
708
715
50
046
14
284
111
104
14
15
7506
832
820
1135
1196
1131
183
223
3.00
1660
6666
732
643
51
29
024
18
18
92
103
73
16
28
34
398
729
1033
1299
1450
1437
187
254
5.48
1207
7483
627
644
10
048
28
45
34
59
77
67
95
52
561
771
714
1284
1343
1329
179
176
4.02
1536
8244
420
636
123
81
12
31
15
00
75
120
122
58
726
603
395
1260
1314
1363
177
140
3.30
1410
9378
544
619
11
19
38
29
39
06
68
120
122
89
660
782
689
1368
1447
1484
176
128
2.99
1362
10
390
569
712
720
45
43
41
29
046
101
119
107
30
623
673
668
1375
1502
1567
188
277
4.27
1187
11387
517
643
17
54
24
31
33
02
84
118
122
45
622
650
476
1122
1142
1119
178
121
3.36
1646
12
688
452
562
51
10
56
16
28
92
12
40
43
105
94
398
702
675
1135
1158
1174
184
277
3.33
1715
aThissy
mbola
ndthenext
with
inthesa
merow,referto
indices,
where
sb1
5accumulatedso
larbrightness
(SB),stage1;sb
25
accumulatedSB,stage2;sb
35
accumulatedSB,
stage3;sd
15
numberofdays
with
seve
rehyd
ricdeficit(SHD),stage1;sd
25
numberofdays
with
SHD,stage2;sd
35
numberofdays
with
SHDstage3;md1
5numberofdays
with
moderate
hyd
ricdeficit(M
HD),stage1;m
d2
5numberofd
ays
with
MHD,s
tage2;m
d3
5numberofd
ays
with
MHD,s
tage3;b
d1
5numberofd
ays
with
solarbrightness
deficit
(SBD)at,
7.2,s
tage1;b
d2
5numberofd
ays
with
SBDat,
7.2,s
tage2;b
d3
5numberofd
ays
with
SBDat,
7.2,s
tage3;ta1
5numberofd
ays
with
therm
ala
mplitude(TA)at,
10,
stage1;ta2
5numberofd
ays
with
TAat,
10,s
tage2;ta3
5numberofd
ays
with
TAat,
10,s
tage3;p
pt1
5acc
umulatedrainfall,stage1;p
pt2
5accumulatedrainfall,stage2;p
pt3
5accumulatedrainfall,
stage3;tt1
5acc
umulatedtherm
altim
e(TT),stage1;tt2
5accumulatedTT,
stage2;tt3
5accumulatedTT,
stage3;hs
5hillsh
ade;asp
5asp
ect;slp
5
slope;andelev
5eleva
tion.
doi:10.1371/journal.pone.0113510.t002
Agro-Climatic Proposal for Coffee Cultivation
PLOS ONE | DOI:10.1371/journal.pone.0113510 December 1, 2014 9 / 22

harvest. Seasonal analysis is determined through the way in which the baseline is
obtained - daily history for an average year - whereby the goal is to analyze the
performance of the climatic indices.
Table 4 presents advantages and disadvantages of the ACGs according to their
agro-ecological suitability for the coffee crop in Colombia. This information is
based on agro-climatic indices values drawn from the literature and based on
research on the coffee crop in Colombia and Brazil.
In general, planting time dates determines crop development. At high
elevations, the reproductive stage is reached later than at lower altitudes. In some
Figure 2. Agroclimatic groups across Colombian coffee-growing regions.
doi:10.1371/journal.pone.0113510.g002
Agro-Climatic Proposal for Coffee Cultivation
PLOS ONE | DOI:10.1371/journal.pone.0113510 December 1, 2014 10 / 22
Table
3.Characteristicsassociatedwith
thegroupsthatco
nform
theagro-clim
atic
zonespropose
dfortheColombianco
ffee-growingregions.
Agro-
climatic
zoneor
group
(ACG)
Coffee
areaand
lands
Departments
and
representationwithin
theACG
ProportionbyAndeanrange
within
theACG
Proportionbylatitudinal
zoneandluminositywithin
theACG
Proportionbyvariety
within
theACG
Bioclimaticindicators
(range
for80%
ofcoffeefarm
s)
Dep
9tPropor.
(%)
Range
Flank
Propor.
(%)
Latitudinal
zone/
Luminosity
Propor.(%
)Variety
Propor.(%
)Indicator
Range
1121,400
ha
Antio
quia
58
Occidental
(Western)
East
52
Central-north-
ern
80.4
Caturra
44.8
Altitude(m
asl)
1400–1940
92,900
farm
sCaldas
14.4
Central
West
7.7
Central-so
uth-
ern
15.7
Colombia
33.6
Solarbrig
ht-
ness
(h/yr)
1660–1760
Risaralda
10.1
West
20.8
Castillo
18.3
Annualrainfall
(mm)
211
0–2470
Valle
del
Cauca
8.2
East
19
Sun
68.2
Typ
ica
3.2
MHD,stage1
(days
)32–46
Tolim
a7.7
Semi-sh
ade
22.9
TA,stage1
(days
)30–60
Shade
8.8
TT(acc
umu-
lated,stages2
and3)
2150–2650
234,000ha
Tolim
a30.6
Central
East
46.2
Central-so
uth-
ern
52.9
Caturra
53.4
Altitude(m
asl)
1600–2050
32,700
farm
sCauca
16.6
West
30.2
Southern
41.1
Castillo
19.5
Solarbrig
ht-
ness
(h/yr)
1620–1750
Huila
15.9
Oriental
(Eastern)
West
13.8
Central-north-
ern
6.1
Colombia
16.7
Annualrainfall
(mm)
2010–2400
Narino
12.4
East
2Typ
ica
10.3
MHD,stage1
(days
),32
Cundinama-
rca
8.6
Occ
idental
East
5.7
Sun
60.2
TA,stage1
(days
)18–52
Valle
del
Cauca
6West
1.1
Semi-sh
ade
30.2
TT(acc
umu-
lated,stages2
and3)
1730–2080
Shade
9.6
320,300ha
Antio
quia
51.7
Central
West
24.2
Central-north-
ern
72.2
Caturra
50.9
Altitude(m
asl)
1540–2060
19,200
farm
sCaldas
13.5
East
14.1
Northern
26
Colombia
20.5
Solarbrig
ht-
ness
(h/yr)
1700–1900
Cesa
r10.7
Occidental
East
30.6
Castillo
18.7
Annualrainfall
(mm)
2570–3100
Risaralda
5.7
West
5.7
Sun
59.4
Typ
ica
9.8
MHD,stage1
(days
)11
–35
Nortede
Santander
5.1
Oriental
West
12.7
Semi-sh
ade
28.2
TA,stage1
(days
)10–28
Agro-Climatic Proposal for Coffee Cultivation
PLOS ONE | DOI:10.1371/journal.pone.0113510 December 1, 2014 11 / 22

Table
3.Cont.
Agro-
climatic
zoneor
group
(ACG)
Coffee
areaand
lands
Departments
and
representationwithin
theACG
ProportionbyAndeanrange
within
theACG
Proportionbylatitudinal
zoneandluminositywithin
theACG
Proportionbyvariety
within
theACG
Bioclimaticindicators
(range
for80%
ofcoffeefarm
s)
Dep
9tPropor.
(%)
Range
Flank
Propor.
(%)
Latitudinal
zone/
Luminosity
Propor.(%
)Variety
Propor.(%
)Indicator
Range
Magdalena
4.4
East
5.2
Shade
12.4
TT(acc
umu-
lated,stages2
and3)
1680–2160
Santander
3.3
Sierra
Neva
da
6.8
Tolim
a3
411
4,700ha
Tolim
a26.2
Central
West
33.6
Central-so
uth-
ern
56.4
Caturra
35.8
Altitude(m
asl)
1200–1780
105,200
farm
sCauca
22
East
23.1
Southern
42
Colombia
29
Solarbrig
ht-
ness
(h/yr)
1160–1590
Cundinama-
rca
16
Oriental
West
34
Castillo
20.6
Annualrainfall
(mm)
1600–1920
Huila
14.8
Occ
idental
East
7.1
Semi-sh
ade
44.9
Typ
ica
14.6
SHD,stage1
(days
)80–100
Narino
11.8
West
2.1
Sun
39.8
TA,stage1
(days
)33–120
Valle
del
Cauca
6.6
Shade
15.3
TT(acc
umu-
lated,stages2
and3)
2440–2800
554,300ha
Santander
48.6
Oriental
West
67.9
Central-north-
ern
55.3
Colombia
34.4
Altitude(m
asl)
1370–1880
41,600
farm
sNortede
Santander
25
East
23.5
Northern
44.7
Caturra
28.1
Solarbrig
ht-
ness
(h/yr)
1940–2060
Boya
ca10.5
Sierra
Neva
da
8.3
Typ
ica
21.1
Annualrainfall
(mm)
2020–2400
Cesa
r9.7
Semi-sh
ade
52
Castillo
16.4
MHD,stage1
(days
)32–57
Magdalena
3.3
Shade
38.2
TT(acc
umu-
lated,stages2
and3)
2100–2490
LaGuajira
2.8
Sun
9.7
639,500ha
Cesa
r43.9
Sierra
Neva
da
63.2
Northern
100
Typ
ica
43.9
Altitude(m
asl)
840–1600
10,900
farm
sMagdalena
42.9
Oriental
West
34.8
Caturra
28.8
Solarbrig
ht-
ness
(h/yr)
1980–2210
LaGuajira
10.2
East
1.5
Semi-sh
ade
63
Castillo
14.2
Annualrainfall
(mm)
2020–2400
Agro-Climatic Proposal for Coffee Cultivation
PLOS ONE | DOI:10.1371/journal.pone.0113510 December 1, 2014 12 / 22

Table
3.Cont.
Agro-
climatic
zoneor
group
(ACG)
Coffee
areaand
lands
Departments
and
representationwithin
theACG
ProportionbyAndeanrange
within
theACG
Proportionbylatitudinal
zoneandluminositywithin
theACG
Proportionbyvariety
within
theACG
Bioclimaticindicators
(range
for80%
ofcoffeefarm
s)
Dep
9tPropor.
(%)
Range
Flank
Propor.
(%)
Latitudinal
zone/
Luminosity
Propor.(%
)Variety
Propor.(%
)Indicator
Range
Nortede
Santander
2.9
Shade
29.4
Colombia
12.9
MHD,stage1
(days
)19–29
Sun
7.5
SHD,stage1
(days
)39–59
TT(acc
umu-
lated,stages2
and3)
2000–2330
7150,700
ha
Risaralda
20.9
Occidental
East
34.5
Central-north-
ern
55.1
Colombia
40.4
Altitude(m
asl)
1270–1800
85,000
farm
sCaldas
19.7
West
7.4
Central-so
uth-
ern
36.6
Caturra
34.5
Solarbrig
ht-
ness
(h/yr)
1670–1870
Valle
del
Cauca
19.6
Central
West
32.7
Northern
8.3
Castillo
18.2
Annualrainfall
(mm)
1940–2200
Antio
quia
17.9
East
8.8
Typ
ica
6.9
MHD,stage1
(days
)42–55
Santander
7.9
Oriental
West
9.5
Sun
56.9
SHD,stage3
(days
)26–57
Nortede
Santander
6.3
East
7.2
Semi-sh
ade
29.9
TT(acc
umu-
lated,stages2
and3)
2480–2870
Tolim
a2.7
Shade
13.1
Quindıo
2.5
Boya
ca1.1
880,600ha
Huila
70.9
Oriental
West
56.6
Southern
76.5
Caturra
59.6
Altitude(m
asl)
1110–1680
59,900
farm
sTo
lima
15.8
East
9.2
Central-so
uth-
ern
18.6
Castillo
18.4
Solarbrig
ht-
ness
(h/yr)
1640–2080
Caqueta
3.5
Central
East
33.7
Central-north-
ern
4.9
Colombia
18.2
Annualrainfall
(mm)
1140–1400
Meta
3.1
Typ
ica
3.7
MHD,stage2
(days
)20–40
Casa
nare
2.4
Sun
76
SHD,stage3
(days
)60–80
Cauca
2.1
Semi-sh
ade
19
TT(acc
umu-
lated,stages2
and3)
2430–3050
Shade
5
Agro-Climatic Proposal for Coffee Cultivation
PLOS ONE | DOI:10.1371/journal.pone.0113510 December 1, 2014 13 / 22

Table
3.Cont.
Agro-
climatic
zoneor
group
(ACG)
Coffee
areaand
lands
Departments
and
representationwithin
theACG
ProportionbyAndeanrange
within
theACG
Proportionbylatitudinal
zoneandluminositywithin
theACG
Proportionbyvariety
within
theACG
Bioclimaticindicators
(range
for80%
ofcoffeefarm
s)
Dep
9tPropor.
(%)
Range
Flank
Propor.
(%)
Latitudinal
zone/
Luminosity
Propor.(%
)Variety
Propor.(%
)Indicator
Range
995,700ha
Caldas
29.8
Central
West
34.5
Central-north-
ern
69.6
Colombia
40
Altitude(m
asl)
1080–1660
63,700
farm
sAntio
quia
24.9
East
33.2
Central-so
uth-
ern
29.1
Caturra
38.6
Solarbrig
ht-
ness
(h/yr)
1360–1660
Tolim
a14
Occidental
East
21.8
Northern
1.3
Castillo
18.8
Annualrainfall
(mm)
2010–2300
Quindıo
9.7
West
3Typ
ica
2.6
MHD,stage1
(days
)26–46
Risaralda
8.2
Oriental
West
7.4
Sun
69.6
MHD,stage3
(days
)31–51
Cundinama-
rca
6.2
Semi-sh
ade
22
TT(acc
umu-
lated,stages2
and3)
2690–3210
Valle
del
Cauca
6Shade
8.3
10
21,100ha
Nortede
Santander
35.3
Oriental
West
42.4
Northern
53.4
Colombia
36.5
Altitude(m
asl)
820–1520
11,800
farm
sSantander
30
East
33.5
Central-so
uth-
ern
23.9
Caturra
28.7
Solarbrig
ht-
ness
(h/yr)
1510–1770
Valle
del
Cauca
23.9
Central
West
23.6
Central-north-
ern
22.7
Typ
ica
20.2
Annualrainfall
(mm)
1830–2140
Cesa
r7.1
Castillo
14.6
MHD,stage1
(days
)33–53
Semi-sh
ade
59
SHD,stage3
(days
)26–56
Shade
24.6
TT(acc
umu-
lated,stages2
and3)
2830–3390
Sun
16.4
1169,700ha
Huila
60.6
Central
East
58.9
Southern
66.8
Caturra
60.6
Altitude(m
asl)
1360–1860
52,000
farm
sTo
lima
24.2
West
3.1
Central-so
uth-
ern
30
Castillo
18.9
Solarbrig
ht-
ness
(h/yr)
1450–1660
Cauca
5.4
Oriental
West
31.2
Central-north-
ern
3.2
Colombia
15.5
Annualrainfall
(mm)
1640–1900
Valle
del
Cauca
4.9
East
4.8
Typ
ica
5MHD,stage3
(days
)19–62
Agro-Climatic Proposal for Coffee Cultivation
PLOS ONE | DOI:10.1371/journal.pone.0113510 December 1, 2014 14 / 22

Table
3.Cont.
Agro-
climatic
zoneor
group
(ACG)
Coffee
areaand
lands
Departments
and
representationwithin
theACG
ProportionbyAndeanrange
within
theACG
Proportionbylatitudinal
zoneandluminositywithin
theACG
Proportionbyvariety
within
theACG
Bioclimaticindicators
(range
for80%
ofcoffeefarm
s)
Dep
9tPropor.
(%)
Range
Flank
Propor.
(%)
Latitudinal
zone/
Luminosity
Propor.(%
)Variety
Propor.(%
)Indicator
Range
Boya
ca2.3
Occ
idental
West
1.3
Sun
76
SHD,stage3
(days
)14–75
East
0.5
Semi-sh
ade
18.6
TT(acc
umu-
lated,stages2
and3)
2060–2580
Shade
5.3
12
124,100
ha
Cauca
36
Central
West
56.5
Southern
55.2
Caturra
49.8
Altitude(m
asl)
1490–1920
130,600
farm
sNarino
14.3
East
13.2
Central-so
uth-
ern
41.9
Castillo
20.1
Solarbrig
ht-
ness
(h/yr)
1590–1750
Tolim
a10.8
Oriental
West
16.8
Central-north-
ern
2.8
Colombia
19.9
Annualrainfall
(mm)
1690–1900
Cundinama-
rca
10.7
Occ
idental
East
10.1
Typ
ica
10.2
MHD,stage1
(days
)38–76
Quindıo
10.6
West
3.3
Semi-sh
ade
43.6
MHD,stage3
(days
)14–39
Valle
del
Cauca
9.2
Sun
43.2
SHD,stage1
(days
)8–75
Huila
8.6
Shade
13.2
TT(acc
umu-
lated,stages2
and3)
2140–2470
doi:10.1371/journal.pone.0113510.t003
Agro-Climatic Proposal for Coffee Cultivation
PLOS ONE | DOI:10.1371/journal.pone.0113510 December 1, 2014 15 / 22

Table 4. Description of suitability of agroclimatic zones proposed for the Colombian coffee-growing regions.
Agroclimatic zone Limitations Advantages Recommendations
1 and 4 -Slow vegetative and reproductivegrowth in high areas.
-Zones are suitable for the crop. -Management with mulch.
-Flowering tends to be concentratedin two periods.
-High planting densities and arranged inwide alleys.
-Longer renovation cycles. -Planting at the beginning of the rainyseason.
2 and 3 -Zones are affected by the La Ninaphenomenon.
-Zones can become suitable forcultivation under conditions of theEl Nino phenomenon.
-Management with mulch and semishade.
-Excess humidity does not permitconcentration of flowering.
-Medium planting densities and arranged inwide alleys.
-Risk of diseases such as rots caused byPhoma spp., especially at higher altitudes.
-Planting at the beginning of the rainyseason.
-Slow vegetative and reproductive growth.
5 and 6 -In both zones, shaded conditions maylimit production.
-Concentrated flowering andharvesting times.
-Planting at the beginning of the rainyseason.
-Risk of hydric deficit in the middle phaseof fruit development in zone 6.
-Longer renovation cycles. -Regulating shading so that it is no morethan 50%.
-Slow vegetative and reproductive growthat higher altitudes, principally in zone 5.
-Conservation practices with mulching inthe dry season.
7, 8, and 9 -Risk of hydric deficit in the late phasesof fruit development.
-Flowering frequently concentratesinto one semester.
-Management with mulch or transitoryshading that favor humidity in stage 3.
-These zones can lose their suitability forcoffee cultivation under conditions of theEl Nino phenomenon.
-Sufficient thermal availability. -Planting at the beginning of the two rainyseasons.
-Shorter renovation cycles. -Optimal distribution in coffeeborder lands.
10 -Cropping in agroforestal systems becauseof the temporariness of rainy seasons.
-Flowering frequently concentratesinto one semester.
-Management with mulch to favor humidityin stages 2 and 3.
-This zone can lose its suitability forcultivation during conditions of the ElNino phenomenon.
-Regulating shading so that it is no morethan 60%
-Shade can diminish thermal availability. -Medium to high planting densities andarranged in wide alleys.
-Shady conditions can limit production. -Planting at the beginning of the rainyseason.
11 and 12 -Slow vegetative and reproductive growth. -Flowering frequently concentratesinto one semester.
-Medium to high planting densities andarranged in wide alleys.
-Risk of hydric deficit in the late phasesof fruit development.
-Longer renovation cycles. -Regulating shading so that it is no morethan 45%.
-Zones may lose suitability for croppingunder conditions of the El Nino phenomenon.
-Management with mulch to favor humidityin stage 3.
-Thermal availability diminishes undercloudy conditions.
-Risk of diseases such as rots causedby Phoma spp.
doi:10.1371/journal.pone.0113510.t004
Agro-Climatic Proposal for Coffee Cultivation
PLOS ONE | DOI:10.1371/journal.pone.0113510 December 1, 2014 16 / 22

ACGs, hydric deficit during the last phases of fruit development could be
improved by adopting management practices such as mulching and establishing
live barriers on steep hillsides [52, 53]. In other ACGs, high humidity prevailing
throughout most of the crop’s reproductive development may favour the
appearance of diseases such as those caused by Phoma sp. (dieback) and
Erithricium salmonicolor (pink disease). During flowering, star flower or other
abnormalities and attacks from fungi such as Colletotrichum sp. (anthracnose)
may also appear [52, 54, 55, 56].
As growing coffee under shade may also limit yield [57], practices through the
dry period such as regulating shade, sanitary harvesting, and pruning the crop,
reduce the potential effects of pests and diseases [58, 59]. Agronomic management
of the crop, such as fertilizer application, weed control, mulching, and shade
management, reinforces the conditions for a suitable crop [58, 59, 60, 61].
4.2. General considerations on agro-climatic group formation
In Colombian coffee cultivation, the concept of latitudinal zoning has been used
in agronomical management. In this context, such differentiation results in at least
four zones, which are related to flowering patterns [5, 23, 62, 63]: (a) southern
zone, delimited between 1˚ and 3˚ north; (b) central-southern zone, between 3˚and 4˚ north [5] and 4˚ in the west, 5˚ in the north, and 6˚ in the east; (c) central-
northern zone, between 5˚ and 8˚ north; and (d) northern zone, between 9˚ and
11˚ north.
As indicated above in the description of ACG formation, altitude exerts a strong
influence on agro-ecological suitability of areas for coffee cultivation. The four
latitudinal zones are associated with the ACGs as follows: the northern zone with
ACGs 5, 6, and 10; the southern zone with ACGs 4, 11, and 12; the central-
southern zone (the piedmont of the plains and south of Huila) with ACG 8; and
the central-northern zone with ACGs 1, 7, and 9. For the northern, southern, and
central-southern zones, these associations with the ACGs clearly delineate the
influence of the great northeastern air currents and the atmospheric systems of the
Pacific Ocean and the Amazon Basin, respectively [6, 64]. The broad valleys
forming the Magdalena River’s central watershed and the Cauca River watershed
noticeably influence the formation of ACGs 1, 7, and 9. Only ACGs 2 and 3 are
primarily governed by altitude, which averages at 1800 m above sea level.
These findings present a dimension beyond the geographic, orographic concept
or historical development when involving the level of detail such as water
retention, solar brightness, degree days, and certain topographic conditions. These
aspects brought together, delimit the crop agro-climatically, defining its potential.
Depending on the extent to which information is available for association with
a given farm or region, future work will approximate the concept of site-specific
agriculture, similar to what was developed for Colombia by CENICANA [65, 66],
integrating environmental concepts with management concepts. Pilot studies for
coffee such as those undertaken by Cock et al. [66], Laderach et al. [67] and
Oberthur et al. [68] to obtain the ‘‘denomination of origin’’ for Narino and
Agro-Climatic Proposal for Coffee Cultivation
PLOS ONE | DOI:10.1371/journal.pone.0113510 December 1, 2014 17 / 22

Cauca, will determine the future for coffee growers and the FNC, safeguarding
farmers from variability in terms of both climate and prices, and enabling progress
to be made towards guaranteeing a quality product.
Recommendations
Spatial resolution at 5 km used to obtain the indices is limited, especially for
climatic elements such as precipitation and for topographical features such as
slope and altitude. In steep zones, where slopes are more than 25 , the changes
associated with altitude, precipitation, and solar radiation within a cell of 5 km
are large. Assuming only one class for each element will consequently distort these
extreme conditions. The advantages of using this resolution are (a) an association
of large surfaces in a continuous manner incorporating data into each cell; (b)
efficient use of hardware and software resources; and (c) improved level of
precision of information generated.
Although the objective of establishing the potential scope of research results
generated by the ESs was achieved, the level of dispersion of the coffee climate
network did not allow a higher level of precision. An option to consider is to
incorporate more historical series type of information from weather stations, both
within and outside the coffee-growing regions, as administered by national
agencies such as the Institute of Hydrology, Meteorology, and Environmental
Studies (IDEAM) or private companies such as sugar mills. This would result in
benefits in terms of consistency of information, the possibility of increasing the
level of resolution and therefore the level of detail, and the possibility of exploring
other methodologies based on functional geo-statistics, functional regression, and
other tools of interpolation to obtain a greater coverage with improved level of
confidence.
One factor that limited the process of obtaining bioclimatic indicators was the
restricted scope of soil studies. Another factor was the scarcity of associated digital
information as attributes in each unit, such as in the case of water retention
capacity for which only a small part (40 units out of 800) could be related.
Yield information on coffee genotypes evaluated in the ESs and related to
bioclimatic indices, other variables of interest related to vegetative growth,
flowering, and quality, and molecular markers should be included in new
research. Research should not be limited to the ESs, but should have wider
national application, incorporating new research sites that this study identified as
having potential strategic importance and therefore as being worthy of inclusion
in the FNC’s investigation plan.
Conclusions
The coffee-growing regions in Colombia, based on bioclimatic indicators, can be
classified into 12 large zones in which the coffee tree’s responses are conditioned
by the constraints or suitabilities of the environment, soils, and management. This
Agro-Climatic Proposal for Coffee Cultivation
PLOS ONE | DOI:10.1371/journal.pone.0113510 December 1, 2014 18 / 22

information is valuable to the Colombian National Coffee Federation to guide
their research and extension and will benefit the farmers of Colombia. The
methodology and approach developed here can be used in other coffee-growing
countries across the world.
Acknowledgments
The authors acknowledge: the National Federation of Coffee Growers of
Colombia, who provided information and sponsored Juan Carlos Garcıa’s
doctoral formation in this fieldwork; the CENICAFE’s Agroclimatology Research
Group, headed by Alvaro Jaramillo and Andres Pena, for consolidating and
facilitating historical information on the coffee climate network and for
participating in the review of the baseline generated; the CGIAR research program
on Climate Change, Agriculture and Food Security (CCAFS) and specifically the
Decision and Policy Analysis (DAPA) at the International Center For Tropical
Agriculture (CIAT), for training and supervising Juan Carlos Garcıa during his
internship, allowing him to develop the methodology presented in this article.
This manuscript represents a portion of a PhD thesis submitted by the first author
to a Doctoral Program of the Universidad de Caldas, Colombia.
Author ContributionsPerformed the experiments: JCGL HPS PL. Analyzed the data: JCGL HPS PL.
Contributed reagents/materials/analysis tools: JCGL HPS PL. Wrote the paper:
JCGL HPS PL. Participated in study design and coordination and revised the
manuscript: JCGL HPS PL. Acquired data, participated in data analysis and
interpretation, and drafted the manuscript: JCGL HPS PL. Read and approved the
final manuscript: JCGL HPS PL.
References
1. Cano C, Vallejo C, Caicedo E, Amador J, Tique E (2012) El mercado mundial del cafe y su impacto enColombia. Borradores de Economıa: 1–56.
2. Federacion Nacional de Cafeteros de Colombia (FNC) (2012) Caficultura sostenible. Informe delGerente General. LXXVII Congreso Nacional de Cafeteros 2012. Accedida Septiembre, 2013. Available:http://www.federaciondecafeteros.org/static/files/IGG2012.pdf. Federacion Nacional de Cafeteros deColombia.
3. Leibovich J, Botello S (2008) Analisis de los cambios demograficos en los municipios cafeteros y surelacion con los cambios en la caficultura colombiana (1993–2005). Ensayos sobre economıa cafetera21: 67–87.
4. Gomez L, Caballero A, Baldion J (1991) Ecotopos cafeteros de Colombia. Bogota: FederacionNacional de Cafeteros de Colombia. pp.131.
5. Trojer H (1968) The phenological equator for coffee planting in Colombia. In: Unesco editor, Parıs.pp. 107–117.
6. Jaramillo A (2005) Clima andino y cafe en Colombia. Chinchina: FNC - Cenicafe. 195 p.
7. Arcila J, Jaramillo A (2003) Relacion entre la humedad del suelo, la floracion y el desarrollo del frutodel cafeto. Avances Tecnicos Cenicafe 311: 1–8.
Agro-Climatic Proposal for Coffee Cultivation
PLOS ONE | DOI:10.1371/journal.pone.0113510 December 1, 2014 19 / 22

8. Hurtado G (1988) Caracterizacion agroclimatica de Colombia. Santafe de Bogota, D.C.: Institutocolombiano de hidrologıa, meteorologıa y adecuacion de tierras. 112 p.
9. Baldion J, Hurtado G (1992) Estudio agroclimatico del tropico humedo de Colombia. Santafe deBogota, D.C.: Instituto colombiano de hidrologıa, meteorologıa y adecuacion de tierras. 187 p.
10. Palmer WC (1965) Meteorological Drought. Research Paper No. 45. U.S. Department of Commerce.Washington, D.C.
11. Malagon D, Pulido C, Llinas R, Chamorro C (1995) Factores bioclimaticos de formacion del suelo.Suelos de Colombia. Santafe de Bogota, D. C.: Instituto Geografico Agustın Codazzi. pp. 221–286.
12. Pezzopane J, Pedro JM, Camargo M, Fazuoli L (2008) Exigencia termica do cafe arabica CV. MundoNovo no subperıodo florescimento - colheita. Cienc agrotec, Lavras 32: 1781–1786.
13. Nunes F, Camargo M, Fazuoli L, Rolim G, Pezzopane J (2010) Modelos agrometeorologicos deestimativa da duracao do estadio floracao-maturacao para tres cultivares de cafe arabica. Bragantia,Campinas 69: 1011–1018.
14. Carvalho H, Melo B, Rabelo P, Silva C, Camargo R (2011) Indices bioclimaticos para a cultura de cafe.Revista Brasileira de Engenharia Agrıcola e Ambiental 15: 601–606.
15. Santos M, Camargo M (2006) Parametrizacao de modelo agrometeorologico de estimativa deprodutividade do cafeeiro. Bragantia, Campinas 65: 173–183.
16. Camargo M, Rolim G, Santos M (2007) Modelagem agroclimatologica do cafe: estimativa emapeamento das produtividades. Informe Agropecuario, Belo Horizonte 28: 58–65.
17. Silva F, Santos E, Evangelista B, Assad E, Pinto H, et al. (2000) Delimitacao das areas aptas doponto de vista agroclimatico para o plantio da cultura do cafe (Coffea arabica) no estado de Goias. ISimposio de Pesquisa dos Cafes do Brasil: Embrapa. pp. 123–125.
18. Meireles E, Volpato M, Alves H, Vieira T (2007) Zoneamento agroclimatico: Um estudo de caso para ocafe. Informe Agropecuario, Belo Horizonte 28: 50–57.
19. Caramori P, Filho A, Morais H, Filho F, Duquia C (2007) Sistema de aleta pars geadas na cafeiculturado Parana. Informe Agropecuario, Belo Horizonte 28: 66–71.
20. Camayo G, Chaves B, Arcila J, Jaramillo A (2003) Desarrollo floral del cafeto y su relacion con lascondiciones climaticas de Chinchina, Caldas. Revista Cenicafe 54: 35–49.
21. Ramırez V, Arcila J, Jaramillo A, Rendon J, Cuesta G, et al. (2010) Floracion del cafe en Colombia ysu relacion con la disponibilidad hıdrica, termica y de brillo solar. Revista Cenicafe 61: 132–158.
22. Jaramillo A, Guzman O (1984) Relacion entre la temperatura y el crecimiento en Coffea arabica L.,variedad caturra. Revista Cenicafe 35: 57–65.
23. Arcila J, Jaramillo A, Baldion J, Bustillo A (1993) La floracion del cafeto y su relacion con el control dela broca. Avances Tecnicos Cenicafe 193: 1–6.
24. Jaramillo A, Arcila J (1996) Epocas recomendables para la siembra de los cafetos. Avances TecnicosCenicafe 229: 8p.
25. Jaramillo A, Ramırez V, Arcila J (2011) Distribucion de la lluvia, clave para planificar las labores en elcultivo del cafe en Colombia. Avances Tecnicos Cenicafe 411: 1–8.
26. Arcila J, Buhr L, Bleiholder H, Hack H, Wicke H (2001) Application of the "Extended BBCH - Scale" forthe description of the growth stages of coffee (Coffea sp.). Cenicafe. pp. 32.
27. Hutchinson M (2006) Anusplin version 4.36 User Guide. 4.36 ed., Canberra, Australia: Centre forResource and Environmental Studies at the Australian National University. pp. 54.
28. Hutchinson M (1998) Interpolation of Rainfall Data with Thin Plate Smoothing Splines - Part I: TwoDimensional Smoothing of Data with Short Range Correlation. Journal of Geographic Information andDecision Analysis 2: 139–151.
29. Hijmans R, Cameron S, Parra J, Jones P, Jarvis A (2005) Very high resolution interpolated climatesurfaces for global land areas. Int J Climatol 25: 1965–1978.
30. McKenney D, Pedlar J, Papadopol P, Hutchinson M (2006) The development of 1901–2000 historicalmonthly climate models for Canada and the United States. Agricultural and Forest Meteorology 138: 69–81.
Agro-Climatic Proposal for Coffee Cultivation
PLOS ONE | DOI:10.1371/journal.pone.0113510 December 1, 2014 20 / 22

31. Hutchinson M, McKenney D, Lawrence K, Pedlar J, Hopkinson R, et al. (2009) Development andTesting of Canada-Wide Interpolated Spatial Models of Daily Minimum–Maximum Temperature andPrecipitation for 1961–2003. Journal of Applied Meteorology and Climatology 48: 725–740.
32. Ramırez J, Jarvis A (2010) Downscaling Global Circulation Model Outputs: The Delta Method Decisionand Policy Analysis Working Paper No. 1. Cali, Colombia: CIAT. 17p p.
33. Niekerk A, Joubert S (2011) Input variable selection for interpolating high-resolution climate surfaces forthe Western Cape. Water SA 37.
34. Laderach P, Zelaya C, Ovalle O, Garcıa S, Eitzinger A, et al. (2012) Escenarios del Impacto del ClimaFuturo en Areas de Cultivo de Cafe en Nicaragua. Cali, colombia; Managua, Nicaragua: CIAT. 32 p.
35. Team RDC (2008) R: A language and environment for statistical computing. R Foundation StatisticalComputing.
36. Hijmans R (2010) Introduction to the ’raster’ package (Version1.6–19). R package ’raster’.
37. Jaramillo A, Gomez O (2002) Desarrollo de una aplicacion de computo para el calculo de balancehıdrico en cafetales. Chinchina, Caldas: Cenicafe.
38. Suarez S (2000) Caracterısticas fısicas de los suelos de la zona cafetera de Colombia relacionadas conel uso, manejo y conservacion. Simposio sobre suelos de la zona cafetera Colombiana, Cenicafe. pp.17p.
39. Jaramillo A (1982) Balance hıdrico de la zona cafetera colombiana. Revista Cenicafe 33: 15–28.
40. Meza F, Varas E (2000) Estimation of mean monthly solar global radiation as a function of temperature.Agricultural and Forest Meteorology 100: 231–241.
41. Rivington M, Matthews B, Buchan K (2002) A Comparison of Methods for Providing Solar RadiationData to Crop Models and Decision Support Systems. Proc Int Environmental Modelling and SoftwareSociety 3: 193–198.
42. Rivington M, Bellocchi G, Matthews B, Buchan K (2005) Evaluation of three model estimations ofsolar radiation at 24 UK stations. Agricultural and Forest Meteorology 132: 228–243.
43. Gomez L, Guzman O (1995) Relacion empırica entre la radiacion solar global y el brillo solar en el areade Cenicafe, Chinchina, Caldas. Revista Cenicafe 46: 205–218.
44. UPME, IDEAM (2005) Atlas de Radiacion solar de Colombia. Santafe de Bogota D.C.: Unidad dePlaneacion Minero Energetica, Ministerio de Minas y Energıa; Instituto de Hidrologıa, Meteorologıa yEstudios Ambientales, Ministerio de Ambiente, Vivienda y Desarrollo Rural. 176 p.
45. Reuter H, Nelson A, Jarvis A (2007) An evaluation of void-filling interpolation methods for SRTM data.International Journal of Geographical Information 21: 983–1008.
46. Pena D (2002) Analisis datos multivariantes: McGraw Hill. 539 p.
47. Dıaz L (2007) Estadıstica mutivariada: inferencia y metodos. Santafe de Bogota D. C.: UniversidadNacional de Colombia. Facultad de Ciencias. Departamento de Estadıstica. 487 p.
48. Chessel D, Dufour A (2012) Analysis of Ecological Data: Exploratory and Euclidean methods inEnvironmental sciences. Package ade4: dudipca Principal Component Analysis. 1.5–1 ed.
49. Liao T (2005) Clustering of time series data—a survey. Pattern Recognition 38: 1857–1874.
50. Reymondin L (2011) Near-real time pan-tropical monitoring system for natural habitat conversiondetection. Strand, London: King’s College London. 53 p.
51. Dimitriadou E (2012) Convex Clustering Methods and Clustering Indexes. R package version 2.15.2(2012-10-26). R-project. org/package5 cclust.
52. Ramırez V, Jaramillo A, Pena A (2013) Gestion del riesgo agroclimatico. Vulnerabilidad y capacidad deadaptacion del sistema de produccion de cafe. Manual del cafetero colombiano Investigacion ytecnologıa para la sostenibilidad de la caficultura. Chinchina. Caldas. Colombia: FNC-Cenicafe. pp. 91–114.
53. Salazar L, Hincapie E (2013) Conservacion de suelos y aguas. Manual del cafetero colombianoInvestigacion y tecnologıa para la sostenibilidad de la caficultura. Chinchina. Caldas. Colombia: FNC-Cenicafe. pp. 287–320.
Agro-Climatic Proposal for Coffee Cultivation
PLOS ONE | DOI:10.1371/journal.pone.0113510 December 1, 2014 21 / 22

54. Jaramillo A, Arcila J (2009) Variabilidad climatica en la zona cafetera colombiana asociada al eventode El Nino y su efecto en la caficultura. Avances Tecnicos Cenicafe 390: 1–8.
55. Jaramillo A, Arcila J (2009) Variabilidad climatica en la zona cafetera colombiana asociada al eventode La Nina y su efecto en la caficultura. Avances Tecnicos Cenicafe 389: 1–8.
56. Florez C, Ibarra L, Gomez L, Carmona C, Castano A, et al. (2013) Estructura y funcionamiento de laplanta de cafe. Manual del cafetero colombiano Investigacion y tecnologıa para la sostenibilidad de lacaficultura. Chinchina. Caldas. Colombia: FNC-Cenicafe. pp. 123–168.
57. Farfan F, Jaramillo A (2009) Sombrıo para el cultivo del cafe segun la nubosidad de la region. AvancesTecnicos Cenicafe 379: 1–8.
58. Farfan F (2013) Establecimiento de sistemas agroforestales con cafe. Manual del cafetero colombianoInvestigacion y tecnologıa para la sostenibilidad de la caficultura. Chinchina. Caldas. Colombia: FNC-Cenicafe. pp. 44–63.
59. Ramırez V (2013) Establecimiento de cafetales al sol. Manual del cafetero colombiano Investigacion ytecnologıa para la sostenibilidad de la caficultura. Chinchina. Caldas. Colombia: FNC-Cenicafe. pp. 28–43.
60. Sadeghian S (2013) Nutricion de cafetales. Manual del cafetero colombiano Investigacion y tecnologıapara la sostenibilidad de la caficultura. Chinchina. Caldas. Colombia: FNC-Cenicafe. pp. 85–116.
61. Salazar L, Hincapie E (2013) Manejo integrado de arvenses. Manual del cafetero colombianoInvestigacion y tecnologıa para la sostenibilidad de la caficultura. Chinchina. Caldas. Colombia: FNC-Cenicafe. pp. 117–142.
62. Trojer H (1954) El ambiente climatologico y el cultivo del cafe en Colombia: problemas, conocimientosactuales y perspectivas. Revista Cenicafe 5: 22–37.
63. Arcila J (2007) Factores que determinan la productividad del cafetal. In: Cenicafe-FNC, editor.Sistemas de produccion de cafe en Colombia. Chinchina. pp. 61–86.
64. Trojer H (1959) Fundamentos para una zonificacion meteorologica y climatologica del tropico yespecialmente de Colombia. Revista Cenicafe 10: 287–373.
65. Carbonell J, Quintero R, Torres J, Osorio C, Isaacs C, et al. (2011) Zonificacion agroecologica para elcultivo de la cana de azucar en el valle del rıo Cauca (cuarta aproximacion). Principios metodologicos yaplicaciones. Cenicana. pp . 119.
66. Cock J, Oberthur T, Isaacs C, Laderach P, Palma P, et al. (2011) Crop management based on fieldobservations: Case studies in sugarcane and coffee. Agricultural Systems 104: 755–769.
67. Laderach P, Haggar J, Lau C, Eitzinger A, Ovalle O, et al. (2011) Cafe Mesoamericano: Desarrollo deuna estrategia de adaptacion al cambio climatico. CIAT Polıticas en Sıntesis: 4p.
68. Oberthur T, Laderach P, Posada H, Fisher M, Samper L, et al. (2011) Regional relationships betweeninherent coffee quality and growing environment for denomination of origin labels in Narino and Cauca,Colombia. Food Policy 36: 783–794.
Agro-Climatic Proposal for Coffee Cultivation
PLOS ONE | DOI:10.1371/journal.pone.0113510 December 1, 2014 22 / 22