research article section curve reconstruction and …famt.net/up/uppaper/2015052940493417.pdf ·...
TRANSCRIPT

RESEARCH ARTICLE
Section Curve Reconstruction and Mean-Camber Curve Extraction of a Point-Sampled Blade SurfaceWen-long Li, He Xie, Qi-dong Li, Li-ping Zhou, Zhou-ping Yin*
State Key Laboratory of Digital Manufacturing Equipment and Technology, School of Mechanical Science &Engineering, Huazhong University of Science and Technology, Wuhan, P. R. China
Abstract
The blade is one of the most critical parts of an aviation engine, and a small change
in the blade geometry may significantly affect the dynamics performance of the
aviation engine. Rapid advancements in 3D scanning techniques have enabled the
inspection of the blade shape using a dense and accurate point cloud. This paper
proposes a new method to achieving two common tasks in blade inspection:
section curve reconstruction and mean-camber curve extraction with the
representation of a point cloud. The mathematical morphology is expanded and
applied to restrain the effect of the measuring defects and generate an ordered
sequence of 2D measured points in the section plane. Then, the energy and
distance are minimized to iteratively smoothen the measured points, approximate
the section curve and extract the mean-camber curve. In addition, a turbine blade is
machined and scanned to observe the curvature variation, energy variation and
approximation error, which demonstrates the availability of the proposed method.
The proposed method is simple to implement and can be applied in aviation
casting-blade finish inspection, large forging-blade allowance inspection and visual-
guided robot grinding localization.
Introduction
Blades, which include turbine blades, compressor blades, and propeller blades, are
the most critical parts of an aviation engine. They work under high temperatures
and pressures, and a small change in the blade geometry can affect the operation
performance of the aviation engine. For quality assurance purposes, high-
precision measuring techniques are used to evaluate the dimensional error of
OPEN ACCESS
Citation: Li W-l, Xie H, Li Q-d, Zhou L-p, Yin Z-p (2014) Section Curve Reconstruction and Mean-Camber Curve Extraction of a Point-SampledBlade Surface. PLoS ONE 9(12): e115471. doi:10.1371/journal.pone.0115471
Editor: Rongrong Ji, Xiamen University, China
Received: August 6, 2014
Accepted: November 23, 2014
Published: December 31, 2014
Copyright: � 2014 Li et al. This is an open-access article distributed under the terms of theCreative Commons Attribution License, whichpermits unrestricted use, distribution, and repro-duction in any medium, provided the original authorand source are credited.
Data Availability: The authors confirm that all dataunderlying the findings are fully available withoutrestriction. All relevant data are within the paper.
Funding: This work was supported by the NationalNatural Science Foundation of China (Grant Nos.51475187, 51275192 and 51421062) and theNational Key Projects (GrantNo. 2014ZX04001051-05). The funders had norole in study design, data collection and analysis,decision to publish, or preparation of the manu-script.
Competing Interests: The authors have declaredthat no competing interests exist.
PLOS ONE | DOI:10.1371/journal.pone.0115471 December 31, 2014 1 / 30

aviation blades. These techniques can be categorized into two main groups:
contact measurement (coordinate measurement machine) and non-contact
measurement (laser/optical scanners, X-ray and CT). A coordinate measurement
machine (CMM) is equipped with a contact probe while scanning a freeform
surface. The CMM is the most popular measuring method in industrial settings
and has a high accuracy (1–3 mm). The low measuring speed and potential
collision/interference with parts are the main concerns. With the advent of high-
resolution sensors, non-contact measuring techniques, such as Breuckmann
stereoSCAN 3D-HE, achieve scanning accuracies as high as 10 mm and can be
used to inspect a blade during its manufacturing process (casting, forming and
robot polishing).
Many efforts have been made in blade inspection and repairing using both
contact and non-contact measuring techniques to obtain the optimum operation
performance and reliability for aviation engines. In Fig. 1, 1) Inspection: a blade
is designed with a thin wall, a crankle surface and a difficult-to-cut material.
Geometric deformation is a common problem during the manufacturing process,
and it must evaluate the dimensional error of the part. The inspection and analysis
of the blade section serve as an important link in blade manufacturing; 2)
Repairing: an aviation engine is extremely expensive (costing approximately $9
million), and blade manufacturing accounts for a large proportion of this cost.
Because of the high temperature and impact load, used blades may have various
defects, such as wear, impact dents and cracks. The manufacturing cost associated
with repairing a defected blade is as low as one third of the cost of replacing a
blade. Some blade manufacturers (MTU, BCT) have begun to perform this
business. The main tasks are to locate the damaged area, calculate the breakage
volume and evaluate the repaired quality.
Blade inspection
Hsu et al. [1] proposed an iterative localization algorithm for airfoil blade
inspection. A CMM was used to measure the blade object, and the traditional 3-2-
1 rule was applied to establish a coordinate system. A typical feature of this
method is its iterative process incorporating the CMM measurement and
coordinate upgrading procedure. Shortly thereafter, the same research group
systematically introduced a section inspection and analysis technique for aviation
blades [2]. A two-step measuring procedure was used to adapt sharp regions, such
as the leading/trailing edges. The design parameters of the blade section were
evaluated after an efficient localization between the measured data and their
nominal curve. Chang and Lin [3] proposed an automatic blade inspection
technique using a 3-axis CMM probe with a 2-axis driving head. Interference
from the undercut surfaces and traveling paths were particularly focused. Makem
et al. [4] presented a virtual inspection system to localize the data and evaluate the
manufacturing accuracy of the aviation blade, where the errors of the root/mid/tip
section thickness were inspected and analyzed. Unlike the 3-2-1 rule, the Iterative
Closest Point (ICP) algorithm [5] was used to provide significantly better
Curve Reconstruction and Mean-Camber Curve Extraction of Blade
PLOS ONE | DOI:10.1371/journal.pone.0115471 December 31, 2014 2 / 30

registration results between the point cloud and its nominal model. Savio et al. [6]
presented a state of metrology of freeform shapes, which focused on the
introduction of measuring techniques and related metrological issues. A blade,
which is regarded as a typical freeform surface, was cited to analyze the
challenging tasks in sampling, alignment and error evaluation. Heo et al. [7]
presented a computer-aided measuring technique for an impeller using a CMM
based on the ruled line of the CAD model, which could partition the blade surface
into several unit measuring regions. To recover the surface shape of the
manufacturing part from the nominal curve and measured points, Li and Ni [8]
proposed an iterative method of non-rigid registration and section profile
reconstruction.
Recently, Breuckmann and GE companies [9–10] also developed a blade
inspection system based on the non-contact measuring technique and successfully
applied it to blade inspection. The Breuckmann 3D inspection system operates
based on an adapted structured light projector, and customized software was
developed for the inspection requirement. By using the latest state-of-the-art
inspection technology of Breuckmann, GE replaced the conventional CMM
measuring approach with a highly time-saving and cost-saving control procedure,
which significantly reduced the inspection time and generated more conclusive
and easily transferrable measurement results. The non-contact measurement
points are large-scale, unordered and noisy. In this situation, performing surface
alignment and parameter extraction of the blade surface is not easy. Over the past
few years, some iterative alignment methods for the blade surface have been
developed, such as the improved ICP algorithm [11], SDM algorithm [12], ADF
algorithm [13]; however, avoiding the local optimal alignment problem and
accurately extracting the blade section parameters from the discrete point cloud
remain a challenging task.
Blade repairing
The repair of aviation components, particularly the blade, is a highly competitive
market and actively supported by well-known engine producers, such as Rolls-
Royce, MTU Aero Engines, SNECMA Moteurs and General Electric. Currently,
Fig. 1. Industrial application of blade measuring. (a) Inspection (GE), (b) Repairing (MTU).
doi:10.1371/journal.pone.0115471.g001
Curve Reconstruction and Mean-Camber Curve Extraction of Blade
PLOS ONE | DOI:10.1371/journal.pone.0115471 December 31, 2014 3 / 30

the blade repairing processes are manually performed, but they are labor intensive
and time consuming, and the quality is inconsistent because curved blades are
overly complex for manual treatment. Recently, many practical studies of blade
repair have been conducted by researchers at the University of Nottingham.
Yilmaz et al. [14] presented the state of the research on machining and repairing
turbo-machinery components. Two important repair steps were introduced and
discussed: milling tool path generation and robot belt grinding/polishing. Gao
et al. [15] and Yilmaz and Grindy [16] also published important studies on blade
repairing based on the reverse-engineering technique. In their repair process, a
CAD model was used to generate motion paths of laser welding and NC
machining. Because used blades typically suffer from wear, cracks and other
defects, non-contact measuring sensors were applied to locate the defecting
regions. Similar to Gao et al., Zheng et al. [17] used the reverse-engineering
technique to digitize the blade surface, perform point-to-surface alignment,
identify the worn area and undamaged area, and generate a laser welding
procedure. Berger et al. [18] proposed an integrated process for the multi-axis
milling of aviation hard-cutting materials, such as titanium and nickel alloys,
which is applied to the intelligent equipment and control of the ESPRIT project.
Rong et al. [19] proposed a deformable-template-based method to recover the
blade surface from section profiles. This method can automatically deform the
nominal curve to best fit the measured points of a blade section.
Robotic grinding/polishing has attracted considerable attention in blade
repairing due to its advantages of automation, flexible contact and width-line
machining. Zhang et al. [20] proposed a local grinding model to simulate robot
belt grinding, particularly for free-form surfaces, such as blades. Huang et al. [21]
reported a successful development of an automated SMART robotic system to
grind/polish vane airfoils. The system layout, section profile fitting, robot path
planning and tool wear compensation during the repairing process were
introduced. Chen et al. [22] proposed a rail-free robot scheme in on-site welding
repair for hydraulic turbine blades with large-scale surfaces. Real-time images of
the blade state from a CCD camera were used to determine the damaged area;
therefore, the operator could control the robot system to perform the repair.
Researchers at the ABB Corporate Research Center in Shanghai [23] briefly
reviewed the robotic techniques in industrial application and noted that force
control and machine vision were enabling technologies of robotic automation.
Because of its high speed and simple operation, non-contact measurement is
widely applied in blade manufacturing (in addition to medical orthopedics [24]
and surgical changing assessment [25]), and point cloud has received increasing
attention as a representation of the blade model. The motivation of this study is to
improve section curve reconstruction and mean-camber curve extraction in blade
inspection and repairing. This paper introduces a new method of section curve
reconstruction and mean-camber extraction. One important characteristic of this
Curve Reconstruction and Mean-Camber Curve Extraction of Blade
PLOS ONE | DOI:10.1371/journal.pone.0115471 December 31, 2014 4 / 30

method is that both energy minimization and distance minimization are used to
smooth the point cloud and generate the curve to improve reconstruction
accuracy and parameter extraction accuracy as quickly as possible. First, the
mathematical morphology (MM) is expanded from image processing to point
cloud processing with the objective of restraining the effect of measuring defects,
such as holes, uneven density and miss-registration, generating an ordered
sequence of 2D measured points, and providing an initial value for the point
cloud smoothing and curve reconstruction process. Next, the energy and distance
are minimized to iteratively smoothen the measured points, approximate the
section curve and extract the mean-camber parameter of the blade surface.
The remainder of the paper is organized as follows. Section 2 introduces an
implementation of the MM operation to a point cloud, an energy minimization
process for smoothing, and a distance minimization process for curve
reconstruction. Section 3 introduces the mean-camber curve extraction process
via the distance minimization method. Section 4 presents the experiments and
analysis. Section 5 contains our conclusion and discusses the potential
applications of the proposed method.
Curve Reconstruction Based on Distance Function
Minimization
Mathematical morphology operation to a point cloud
The development and application of mathematical morphology (MM) [26, 27]
originates from image processing and pattern recognition. The computation of
MM is a simple combination of adding and subtracting operations based on a
defined structure element. Assuming that F is a binary image and B is a structure
element to perform the MM operation, the dilation and corrosion can be
described by
F+B~[b[B
Fb,FHB~[b[B
F{b ð1Þ
The MM operation is illustrated in Fig. 2. The dilation operation can enlarge
the objective and compress the hole regions, and the corrosion operation can
control overlapping regions and uneven-density regions. In the following, the MM
operation is expanded from a 2D image to 3D measured points. The main
objectives are to construct a well-organized point set in a section plane of the
blade and provide a fast computation method of the initial value for point cloud
smoothing, section curve reconstruction and mean-camber curve extraction.
The execution object of the MM algorithm is a binary image, and it should first
interpret the measured points into 3D grids. Assume that the measured points
from the blade model are described by P and that the mean value of sampling
resolution is d. The extrema of the XYZ coordinates from P are defined as
(xmax,ymax,zmax) and (xmin,ymin,zmin). Then, the numbers of grids along the XYZ
Curve Reconstruction and Mean-Camber Curve Extraction of Blade
PLOS ONE | DOI:10.1371/journal.pone.0115471 December 31, 2014 5 / 30

directions are
Nx~int((xmaxzt){(xmin{t)
h),
Ny~int((ymaxzt){(ymin{t)
h),
Nz~int((zmaxzt){(zmin{t)
h)
ð2Þ
where int(N) is an integer operation, t is an allowance (tw3h), and h (equal to d) is
the width of the 3D grids. For Vpi[P, the position in the 3D grids is calculated as
px~floor(xi{xmin
h),py~floor(
yi{ymin
h),pz~floor(
zi{zmin
h) ð3Þ
where floor(N) is a floor integer operation. If there is a measured point in the grid
(px,py,pz), define the value of grid (px,py,pz) as ‘‘1’’; otherwise, define it as ‘‘0’’.
Therefore, all measured points of P can be described using a binary image.
Fig. 3(a) presents a point-sampled turbine surface, where section planes that
are parallel to the reference plane are used to intercept the point cloud, and
Fig. 3(b) shows the 2D points in one section plane. It is difficult to obtain the real
intersection points between the section planes and point-sampled surface. In our
implementation, the section plane pi (Fig. 3(c)) is set from the reference plane
with a relative distance di (which is determined based on the required number of
blade inspections), and all points between planes pzi and p{
i are projected onto
Fig. 2. Mathematical morphology operation of a binary image. (a) dilation, (b) corrosion.
doi:10.1371/journal.pone.0115471.g002
Curve Reconstruction and Mean-Camber Curve Extraction of Blade
PLOS ONE | DOI:10.1371/journal.pone.0115471 December 31, 2014 6 / 30

plane pi. The MM operation, which includes dilation, flood filling and erosion, is
implemented toward well-ordered points in Fig. 4(b). As shown in Fig. 4(c), an
initial profile curve in one section plane can be generated by linking the well-
ordered points after erosion, an initial mean-camber curve is rapidly generated by
extracting the morphological skeleton from the well-ordered points, and the
normal vector at each point is obtained by computing the gradient vector field of
the binary image [28]. MM is advantageous because it can reduce the effect of the
measured defects, such as holes, uneven density and miss-registration, and
confirm the oriented normal information of the measured points. In the following
Fig. 3. Searching for projecting points by section planes. (a) initial 3D measured points and the reference/section planes, (b) measured points in onesection plane, (c) search for projecting points in a section plane pi.
doi:10.1371/journal.pone.0115471.g003
Fig. 4. Mathematical morphology operation of a binary image from the blade model. (a) ‘‘+’’ structureelement, (b) MM operation, (c) initial curves and normal vector.
doi:10.1371/journal.pone.0115471.g004
Curve Reconstruction and Mean-Camber Curve Extraction of Blade
PLOS ONE | DOI:10.1371/journal.pone.0115471 December 31, 2014 7 / 30

section, the obtained initial curves and normal vector are used to implement the
section curve reconstruction and parameter extraction.
2.2 Point cloud smoothing by energy minimization
The initial section curve in Fig. 4(c) is not smooth (folding line) because the
position of the measured points are affected by the dilation/erosion operation and
measuring noise. Assume that Q0~fq01,q0
2, � � � ,q0ng and Q~fq1,q2, � � � ,qng
denote the measured points in one section plane before and after smoothing,
respectively, and that k denotes the section curve curvature. Then, the strain
energy EC of a curve s is
EC~12
ðk2ds ð4Þ
The curvature of a discrete point qi can be approximated by
ki<2
lizliz1
qiz1{qi
liz1{
qi{qi{1
li
�������� ð5Þ
where li~ qi{qi{1k k2. Because ds~(lizliz1)=2, (4) can be represented by
EC~12
Xin
i~i0
k2i: lizliz1
2~Xin
i~i0
1lizliz1
qiz1{qi
liz1{
qi{qi{1
li
��������
2
2
ð6Þ
S between point qi and point
q0i is
Pni~1
qi{q0i
�� ��2
2. Then, the total energy function of point cloud smoothing is
defined by
E~aECzbES ð7Þ
where a[½0:1,0:5�,b[½1,1:2�. The strain energy EC expresses the relationship
between two adjacent points and is used to control the fairness of adjacent points
qi{1,qi,qiz1
� �. The spring energy ES is used to control the distance deviation
between unsmoothed point q0i and smoothed point qi, which avoids a major
change in q0i .
1) If point set Q0 is located in an unclosed curve, i0~2,in~n{1;
2) If point set Q0 is located in a closed curve, q0~qn,q{1~qn{1 and
qnz1~q1,qnz2~q2, then i0~1,in~n.
To minimize the energy function E in (7), one differentiates energy E on
variable qi; then,
ai,i{2qi{2zai,i{1qi{1z(1zaii)qizai,iz1qiz1zai,iz2qiz2~q0i ð8Þ
Curve Reconstruction and Mean-Camber Curve Extraction of Blade
PLOS ONE | DOI:10.1371/journal.pone.0115471 December 31, 2014 8 / 30
According to Zhu’s work [29], the spring energy E

The coefficients in (8) are
ai,i~{(ai,i{2zai,i{1zai,iz1zai,iz2),
ai,i{2~a½(lizli{1)lili{1�{1,
ai,i{1~{a(liz1zli{1)½li{1l2i liz1�{1
,
ai,iz1~{a(liz2zli)½lil2iz1liz2�{1
,
ai,iz1~{a(liz2zli)½lil2iz1liz2�{1
There are n equations with n variables qi, and the solution is unique. However,
if n is high, the calculation and storage of equations will consume large amounts
of memory space. In this paper, an iterative solving method is used to calculate the
smoothed points in Q. For a smoothed point qi, there exists
(1zaii)qi~q0i {ai,iz1q0
iz1{ai,iz2q0iz2{ai,i{1qi{1{ai,i{2qi{2 ð9Þ
Therefore, during each iteration, there is
1) For an unclosed curve
N The first smoothed point: (1za11)q1~q01{a12q0
2{a13q03
N The second smoothed point: (1za22)q2~q02{a23q0
3{a24q04{a21q1
N The (n{1)th smoothed point: (1zan{1,n{1)qn{1~q0n{1{an{1,nq0
n{a{an{1,n{3qn{3
N The nth smoothed point: (1zann)qn~q0n{an,n{1qn{1{an,n{2qn{2
2) For a closed curve (q0~qn,q{1~qn{1 and qnz1~q1,qnz2~q2)
N The first smoothed point: (1za11)q1~q01{a12q0
2{a13q03{a1,nq0
n{a1,n{1q0n{1
N The second smoothed point: (1za22)q2~q02{a23q0
3{a24q04{a2,nq0
n{a21q1
N The (n{1)th smoothed point: (1zan{1,n{1)qn{1~q0n{1{an{1,n{3q0
n{3
{an{1,nq0n{an{1,n{2qn{2{an{1,1q1
N The nth smoothed point: (1zann)qn~q0n{an,n{2qn{2{an,n{1qn{1{an,1q1
{an,2q2
Because the measured points in the section plane are derived from a closed line,
the second strategy above is used to iteratively calculate the smoothed points
Q~fq1,q2, � � � ,qng.
Curve reconstruction by distance minimization
Using the smoothed point q[Q, a cubic B-spline q(t) is constructed by
q(t)~Xl
i~0
Ni,3(t)bi ð10Þ
Curve Reconstruction and Mean-Camber Curve Extraction of Blade
PLOS ONE | DOI:10.1371/journal.pone.0115471 December 31, 2014 9 / 30
qn{2
n{2n{1,

where q(ti)~qi and t(t1vt2v � � �vtn) is a sequence of real numbers. The symbol
Ni,3(t) denotes the basis function of the B-spline, and bi(i~0,1,2, � � � ,l) denotes
the control points of the B-spline. The calculation of the curve q(t) requires the
interception of planar points, a dilation/erosion operation and energy-
minimization smoothing. In particular, in the interception process, two section
planes with a width of d are used to surround the initially measured points from
the blade model, and the surrounded points are subsequently projected onto a
section plane. The surround points may not be real ‘‘intersection points’’ in the
section plane, and the curve q(t) in (10) is only a fitting curve that passes through
the smoothed points in Section 3. Therefore, the curve q(t) is considered an initial
section curve and is iteratively updated to approximate the measured points in P.
In Fig. 5, assume that S(P) denotes the design surface of the blade and v denotes
the normal direction perpendicular to the section plane; for Vq[q(w,t), the foot
projecting point q\[S(P) with respect to q is calculated. The design surface S(P) is
unknown, and the foot point q\ can be approximately replaced by the closest
point of q in P. Then, the directed distance function between point q and P is
defined by
dq,P~ minq[Q,p[P
q{pk k2~ q{q\�� ��
2 ð11Þ
For point q(w), dq,P is a distance function with variable w. Ideally, if dq,P~0,
point q(w) is located at S(P). When a differential perturbation with respect to Dwappears, q(w) becomes q(wzDw). Assume that the foot projecting point of q is
still q\; then,
dq,P(wzDw)~ q(wzDw){q\�� ��
2 ð12Þ
The first-order Taylor expansion at w is
dq,P(wzDw)< q(w){q\�� ��
2zXm
j~1
qwj(w):½q(w){q\�q(w){q\k k2
Dwj ð13Þ
Fig. 5. Point q(w) moves to the position of q(wzDw) when there is a perpendicular Dw.
doi:10.1371/journal.pone.0115471.g005
Curve Reconstruction and Mean-Camber Curve Extraction of Blade
PLOS ONE | DOI:10.1371/journal.pone.0115471 December 31, 2014 10 / 30

where m~2(lz1) and qwj(w) denotes the first-order derivative with respect to the
variable wj. Then,
dq,P(wzDw)<dq,P(w)zXm
j~1
qwj(w):½q(w){q\�q(w){q\k k2
Dwj ð14Þ
To simplify the calculation process, one scatters the initial B-spline curve into
qi(i~1,2, � � � ,N) if the distance between two adjacent points is not larger than d.
Then, the problem of constructing the section curve q(t) of the point-sampled
blade surface becomes
minw[R2(lz1)
XN
i~1
½dqi,P(w)�2 ð15Þ
According to (14), the nonlinear least-square problem of (15) corresponds to
minDw[Rm
XN
i~1
½dqi,P(w)zXm
j~1
qwj(w):½q(w){q\�q(w){q\k k2
Dwj�2 ð16Þ
To limit the excessive offset of the variable w, the coefficient l is added to the
constraint. The final optimization model is
minDw[Rm
XN
i~1
½dqi,P(w)zXm
j~1
qwj(w):½q(w){q\�q(w){q\k k2
Dwj�2zlXm
j~1
Dw2j
!ð17Þ
The implementation steps are as follows:
(1) Perform MM and energy minimization to obtain a group of smoothed
points and generate an initial cubic B-spline curve q(t);(2) Scatter q(t) into N points qi and search for the foot-projecting point q\
i of qiin P;
(3) Minimize (17) and obtain the offset Dw of the control variable during each
iteration, where the value of l is set as 4;
(4) Update the control variable by (wzDw) and obtain an updated curve q(t);(5) Repeat steps (2)-(4) until 1
N
PNi~1
qi{qi\
�� ��ƒd=100 or the number of iterations
exceeds 20.
Mean-camber curve extraction of the point-sampled blade surface
An aviation blade has many geometric parameters, such as the mean-camber
curve, maximum gauge, leading/trailing edge, chord length, chord inclination,
Curve Reconstruction and Mean-Camber Curve Extraction of Blade
PLOS ONE | DOI:10.1371/journal.pone.0115471 December 31, 2014 11 / 30

torsion resistance, and tortuosity. The manufacturing accuracy is important in the
service performance of the blade. The mean-camber curve is a continuous curve
of in-circle centers, where the maximum gauge corresponds to the maximal
inscribed circle. The mean-camber curve is an important design basis, and a
marginal shift may decrease the aviation aerodynamic performance considerably.
Calculation and inspection of the mean-camber curve are vital to blade
manufacturing. In the following, we introduce the method to extract the mean-
camber curve.
A group of point set M from the mean-camber curve is initially generated using
the skeleton MM implementation presented in Section 2. For Vmj[M, the two
nearest points qj1 and qj2 are calculated in the suction and pressure surfaces of the
constructed curve q(t), respectively. Assume that dj1~ mj{qj1
��� ���,dj2~ mj{qj2
��� ���,
and define rj~(dj1zdj2)�
2 as the inscribed circle radius at point mj. Then,
Mr~f(mj,rj),j~1,2, � � � ,nMg constitutes a group of new point sets and yields an
envelope curve mr(w,t)~(m(w,t),r(w,t)) in Fig. 6, where m(w,t) denotes the
mean-camber curve and r(w,t) denotes the radius of the inscribed circle. For the
convenience of calculation, the control point set is expressed as a column vector
w[Ra below.
First, the reconstructed curve q(t) is scattered into N points. For Vq[Q, the
normal vector is defined as n, and a straight line Lq is generated using point q and
vector n. The intersection point between line Lq and the mean-camber curve is
m(w); then, the directed distance from point q to the envelope curve mr(w,t) is
dq,m(w)~½q{m(w)�:n{r(w) ð18Þ
When a differential perturbation with respect to Dw appears, q(w) becomes
q(wzDw), and the first-order Taylor expansions at w are
Fig. 6. Calculation process of the mean-camber curve.
doi:10.1371/journal.pone.0115471.g006
Curve Reconstruction and Mean-Camber Curve Extraction of Blade
PLOS ONE | DOI:10.1371/journal.pone.0115471 December 31, 2014 12 / 30

m(wzDw)~m(w)zXa
j~1
mwj(w):Dwj,
r(wzDw)~r(w)zXa
j~1
rwj(w):Dwj
ð19Þ
where mwj(w) and rwj(w) denote the first-order derivatives with respect to the
variable wj. Because
dq,m(wzDw)~½q{m(wzDw)�:v{r(wzDw)
~ q{m(w){Xa
j~1
mwj(w):Dwj
" #:v{ r(w)z
Xa
j~1
rwj(w):Dwj
" #
~ q{m(w)½ �:v{r(w){Xa
j~1
mwj(w):vzXa
j~1
rwj(w)
" #:Dwj
~dq,m(w){Xa
j~1
mwj(w):vzXa
j~1
rwj(w)
" #:Dwj
ð20Þ
Fig. 7. Scanning a turbine blade and intercepting its point cloud. (a) Turbine blade and scanning sensor, (b) Section planes and obtainedmeasured points.
doi:10.1371/journal.pone.0115471.g007
Curve Reconstruction and Mean-Camber Curve Extraction of Blade
PLOS ONE | DOI:10.1371/journal.pone.0115471 December 31, 2014 13 / 30
The first-order differential increment of dq,m(w) is
Ddq,m(w)~{Xa
j~1
mwj(w):vzXa
j~1
rwj(w)
" #:Dwj ð21Þ
Therefore, the calculation process of the mean-camber curve becomes a
nonlinear least-squares problem
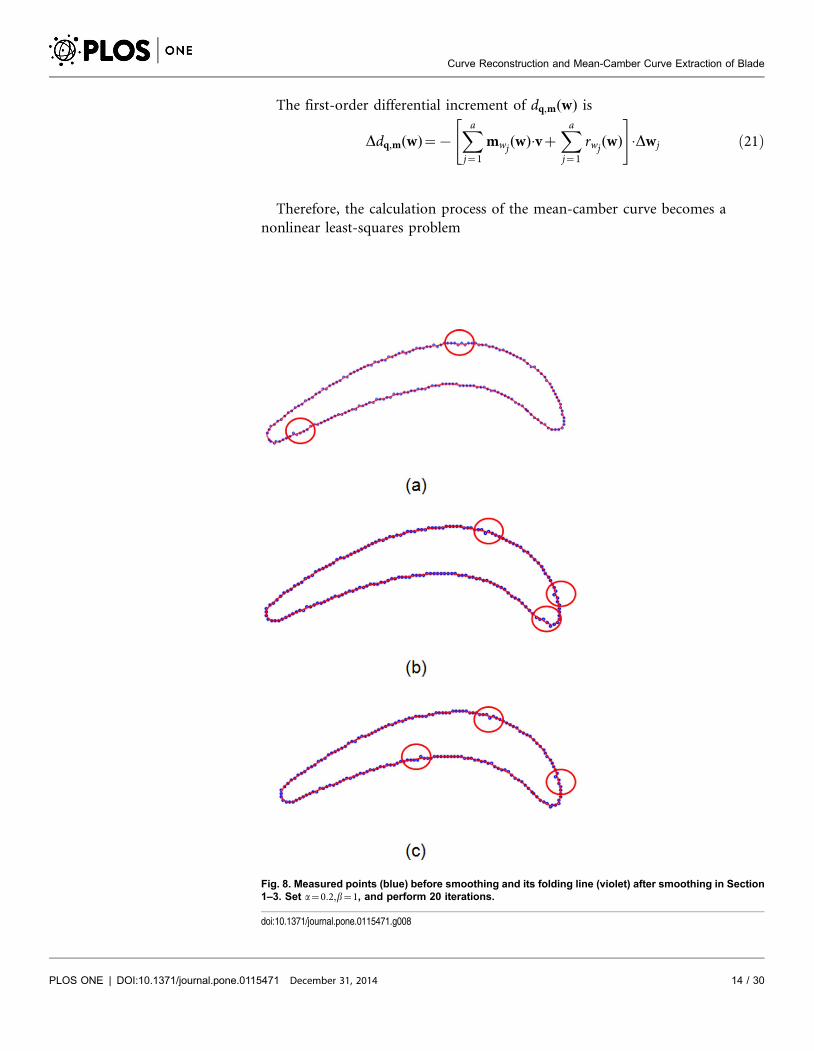
Fig. 8. Measured points (blue) before smoothing and its folding line (violet) after smoothing in Section1–3. Set a~0:2,b~1, and perform 20 iterations.
doi:10.1371/journal.pone.0115471.g008
Curve Reconstruction and Mean-Camber Curve Extraction of Blade
PLOS ONE | DOI:10.1371/journal.pone.0115471 December 31, 2014 14 / 30

minDw[Ra
XN
i~1
dqi,m(w)zDdqi,m(w)� �2
zlXa
j~1
Dw2j
!ð22Þ
The calculation error of the mean-camber curve is defined by
�"~1N
XN
i~1
dqi,m(w)�� �� ð23Þ
The implementation steps are as follows:
Fig. 9. Mean-camber points (blue) from the morphological skeleton and its folding line (violet) aftersmoothing in Section 1–3.
doi:10.1371/journal.pone.0115471.g009
Curve Reconstruction and Mean-Camber Curve Extraction of Blade
PLOS ONE | DOI:10.1371/journal.pone.0115471 December 31, 2014 15 / 30

Curve Reconstruction and Mean-Camber Curve Extraction of Blade
PLOS ONE | DOI:10.1371/journal.pone.0115471 December 31, 2014 16 / 30

(1) Scatter q(t) into N points qi (i~1,2, � � � ,N) and maintain the dense points in
the regions of the leading and trailing edges;
(2) For each point mj, calculate its inscribed circle radius rj and obtain a new
point set Mr. A cubic B-spline curve is used to construct an envelope curve
mr(w,t);(3) Calculate the offset Dw of the control point set during each iteration
according to (22);
(4) Apply the calculated wzDw and update the envelope curve mr(w,t);(5) Calculate the distance dq,m(w) between q and the curve mr(w,t) using (18);
(6) Repeat steps (2)–(5) until �"ƒd=100 or the number of iterations exceeds 20.
Experiments and Analysis
In Fig. 7(a), a turbine blade (150 mm6100 mm640 m) is machined for the
experimental analysis using a 5-axis Mikron CNC machine (UCP 800 Duro). The
blade is placed on an anti-vibration platform and scanned using a Hexagon laser-
scanning equipment (Infinite SC 2.4 m). The laser-scanning equipment has 6
rotational degrees of freedom and can scan the integral blade in one coordinate
system without moving the blade or scanning equipment. The data scale of the
obtained point cloud is 358,748, and the sampling space of the measured points
after uniform simplification is 0.3 mm. Three section planes are used to intercept
the point cloud and obtain three groups of 2D measured points (red color) in
Fig. 7(b).
Measured-point smoothing
First, the strain energy in (4) and spring energy in (6) are calculated to construct a
total energy function in (7), which is minimized to calculate the new position of
the measured points. To obtain a stable strain energy of the 2D measured points,
20 iterations were run for convergence. The experimental results are shown in
Figs. 8–13.
In Fig. 8, the measured points are marked with blue circles, and the measured
points after smoothing are marked with red folding lines. To better graphically
display the smoothing results, no more than 200 measured points are shown. The
blue circles are uniformly distributed on two sides of the folding line. The same
experimental results with respect to the mean-camber line are observed in Fig. 9.
However, in some regions of the section curve, there is a large distance deviation
(shown with red circles) between the measured points and folding line. The
existing Gaussian noise is extremely high in these regions. The energy
minimization in Section 3 suppresses the mutation of 2D measured points and
Fig. 10. Energy variation of the section curves in Section 1–3 with an increasing number of iterations.Set a~0:2,b~1, and perform 20 iterations.
doi:10.1371/journal.pone.0115471.g010
Curve Reconstruction and Mean-Camber Curve Extraction of Blade
PLOS ONE | DOI:10.1371/journal.pone.0115471 December 31, 2014 17 / 30

Curve Reconstruction and Mean-Camber Curve Extraction of Blade
PLOS ONE | DOI:10.1371/journal.pone.0115471 December 31, 2014 18 / 30

maintains a fine fairness of the bolding line. The energy variations of the strain
energy and spring energy are shown in Figs. 10 and 11, respectively. The strain
energy, which controls the fairness of adjacent points, gradually decreases, and 15
iterations are sufficient to attain a stable value. From the 15th iteration to the 20th
iteration, the strain energy slowly decreases, but the spring energy rapidly
increases. Thus, the distance deviation between an unsmoothed point q0i and a
smoothed point qi varies considerably to adapt to the fairness requirement. In the
experiment, if the strain energy is approximately stable, it should stop the
subsequent iterations to control the large movement of 2D measured points.
Figs. 12 and 13 present the variation in the curvature of the section curves and
mean-camber curves, respectively. The blue polyline denotes the 2D measured
points before smoothing, and the violet polyline denotes the folding line after
smoothing. The variations in the curvature of the blue polyline are choppy, and
the absolute value in some regions is relatively large. However, the curvature of
the points smoothed via energy minimization nearly surrounds the X-axis, except
for two high values at the leading/trailing edges. In addition, the plus-minus
direction of curvature in the regions between the leading and trailing edges is not
constant and does not fit with practical applications. The section curve is only
represented by the folding line when energy-minimization smoothing is
implemented, and it is not considered to maintain a direction consistency during
each iteration. This problem can be solved using the distance minimization
method.
Section curve reconstruction
The smoothed points in Section 1–3 are used to create three cubic B-spline curves
according to (10). By minimizing the objective function in (17), the variations in
the control points of the cubic B-spline curve are iteratively calculated and revised.
In this experiment, 20 iterations are performed to obtain the optimal variable. The
curvature values of the measured points before performing the MM operation
(blue), the continuous B-spline curve before the distance minimization (jasper)
and the continuous B-spline curve after the distance minimization (red) are
obtained. The curvature variations in Section 1–3 are shown in Figs. 14 (a–c). To
better display the curvature variation, the region of pressure surface is selected for
further analysis. The curvature variation of the measured points oscillates and is
unordered, and the curvature variation of the continuous curve before distance
minimization (but after energy minimization) is stable around the X-axis. The
main problem is that the plus-minus direction of curvature in the pressure region
or suction region oscillates and does not maintain a consistent direction in the
concave or convex surface. The continuous B-spline curve after distance
minimization has the most realistic curvature variation. The curvature direction
Fig. 11. Energy variation of the mean-camber curves in Section 1–3 with an increasing iterations.
doi:10.1371/journal.pone.0115471.g011
Curve Reconstruction and Mean-Camber Curve Extraction of Blade
PLOS ONE | DOI:10.1371/journal.pone.0115471 December 31, 2014 19 / 30

Curve Reconstruction and Mean-Camber Curve Extraction of Blade
PLOS ONE | DOI:10.1371/journal.pone.0115471 December 31, 2014 20 / 30

of the pressure surface is steadily negative and provides an increasing curvature
value when approaching leading/trailing edges, which is consistent with practice.
The constructed B-spline curves and control points after 20 iterations are
shown in Figs. 15–17(a). To observe the constructed results in a quantifiable
manner, the geometric errors of the average distance, distance standard error and
mini/max error are calculated and shown in Figs. 15–17(b-c). Three continuous
B-spline curves are obtained in Section 1–3. In Figs. 15–17(b), the value of the
average distance Avej j is approximately 0.03 mm. The error mainly originates
from the measuring uncertainty of the Hexagon laser-scanning equipment.
However, in Figs. 15–17(c), the value of Avej j is reduced to approximately
0.01 mm, which benefits from the energy minimization in Section 3. The strain
energy is used to smooth the measured points, and the spring energy is used to
prevent a large deviation between an unsmoothed point and smoothed point, and
provide a good initial value to iteratively construct a B-spline curve in Section 4.
Mean-camber curve extraction
Finally, the implementation steps in Section 5 are performed to calculate the
mean-camber curves of Section 1–3. The variations in the control points of each
cubic B-spline curve are iteratively calculated and revised by minimizing the
objective function in (22). Similarly, in this experiment, 20 iterations are
performed to obtain the optimal value. The obtained mean-camber curves (blue),
envelope circles (black) and maximum gauge circles (violet) are graphically shown
in Fig. 18. To accurately calculate the maximum gauge circler, each B-spline curve
of the mean-camber curve is scattered into 1,000 points, which are used to
generate the envelope circles. To better display the generated envelope circles,
approximately 50 points (from 1,000 points) and their corresponding circles are
selected and shown in Fig. 18. In Figs. 18(a–c), the radii of the maximum gauge
circles are 10.0011, 10.9182 and 11.8530 mm. Three mean-camber curves are
successfully extracted, and the envelope circles are sufficiently close to the
surrounding section curves.
In addition, the curvature distributions of the three mean-camber curves are
also calculated and displayed in Fig. 19. From the leading edge to the trailing edge,
the curvature variation is rather consistent, which further demonstrates variable of
parameter extraction.
Conclusion
Rapid advancements in 3D scanning techniques have led to dense and accurate
point clouds from real objects. Point cloud processing, curve approximation and
parameter analysis based on 3D scanning have become a topic of considerable
Fig. 12. Variation in the curvature of the measured points after MM (blue) and the folding line (violet)that corresponds to Fig. 8.
doi:10.1371/journal.pone.0115471.g012
Curve Reconstruction and Mean-Camber Curve Extraction of Blade
PLOS ONE | DOI:10.1371/journal.pone.0115471 December 31, 2014 21 / 30

Fig. 13. Variation in the curvature of the mean-camber points after MM (blue) and the folding line(violet) that corresponds to Fig. 9.
doi:10.1371/journal.pone.0115471.g013
Curve Reconstruction and Mean-Camber Curve Extraction of Blade
PLOS ONE | DOI:10.1371/journal.pone.0115471 December 31, 2014 22 / 30

interest in blade manufacturing. This paper proposes a new method to address
two common tasks in blade manufacturing: section curve reconstruction and
mean-camber curve extraction. The main contributions of the proposed method
Fig. 14. Curvature variation of the measured points (blue), continuous curve before distance functionminimization (green) and continuous curve after distance function minimization (red).
doi:10.1371/journal.pone.0115471.g014
Curve Reconstruction and Mean-Camber Curve Extraction of Blade
PLOS ONE | DOI:10.1371/journal.pone.0115471 December 31, 2014 23 / 30

include the following. First, the MM is expanded and applied to measured-point
processing to restrain the effect of scanning defects. The results demonstrate that
the MM implementation can also generate an ordered point sequence and provide
an initial value for the curve approximation and parameter extraction. Second, the
energy functions of the strain energy and spring energy are built to smooth the 2D
measured points while preventing a large distance deviation between the
unsmoothed and smoothed points. This implementation process is based on
Fig. 15. Curve reconstruction result in Section 1 after distance minimization: (a) reconstructed B-spline curve and its control points; (b) geometric errors between the measured points and B-splinecurve; (c) geometric errors between the energy-smoothed points and B-spline curve. The displays of(b–c) are provided by iCloud3D software, which is developed by our team.
doi:10.1371/journal.pone.0115471.g015
Curve Reconstruction and Mean-Camber Curve Extraction of Blade
PLOS ONE | DOI:10.1371/journal.pone.0115471 December 31, 2014 24 / 30

points and lines and is thus easy to implement. Third, a directed distance function
from a measured point to its foot point or an envelope curve is defined and used
to build a constrained nonlinear least-squares function. The purpose of this
function is to iteratively approximate the cubic B-spline curve and extract the
mean-camber curve using distance minimization. In addition, a turbine blade is
machined and scanned to implement the experiments. The values of curvature
Fig. 16. Curve reconstruction result in Section 2 after distance minimization: (a) reconstructed B-spline curve and its control points; (b) geometric errors between the measured points and B-splinecurve; (c) geometric errors between the energy-smoothed points and B-spline curve. The displays of(b–c) are provided by iCloud3D software, which is developed by our team.
doi:10.1371/journal.pone.0115471.g016
Curve Reconstruction and Mean-Camber Curve Extraction of Blade
PLOS ONE | DOI:10.1371/journal.pone.0115471 December 31, 2014 25 / 30

variation, energy variation and approximation error are obtained and analyzed.
The experimental results demonstrate the availability of the proposed method.
Curve reconstruction and parameter extraction are common problems in blade
manufacturing, and the proposed method can find specific applications in the
following fields. Future work will focus on practical applications of the proposed
method.
Fig. 17. Curve reconstruction result in Section 3 after distance minimization: (a) reconstructed B-spline curve and its control points; (b) geometric errors between the measured points and B-splinecurve; (c) geometric errors between the energy-smoothed points and B-spline curve. The displays of(b–c) are provided by iCloud3D software, which is developed by our team.
doi:10.1371/journal.pone.0115471.g017
Curve Reconstruction and Mean-Camber Curve Extraction of Blade
PLOS ONE | DOI:10.1371/journal.pone.0115471 December 31, 2014 26 / 30

1) Aviation casting-blade finish inspection. A turbine blade is typically short
(300–600 mm), and a casting technique can be used to directly form its
geometric shape. Measurements via a CMM are a common but inefficient
inspection strategy in blade manufacturing. In practice, casting-blade finish
inspection can be performed based on a 3D scanning method because there is
nearly no reflective problem from the casting part. In this application, the
calculation of the section curve and parameters is an important task.
2) Large forging-blade allowance inspection. A nuclear blade is rather long
(600–2,000 mm). A general manufacturing process includes hammer forging,
transformation straightening, milling and profile inspection. Mold wear and
thermal stress releasing after forging typically result in uncertain blade
transformation. Before milling, the uniformity of machining allowance in
selected section planes should be inspected. The existing contact snap-gauge
inspection based on naked eye/light transmission is not accurate and can be
replaced by a 3D scanning method. In this application, the dislocation, mean-
camber line and maximum gauge are three main parameters that must be
calculated.
Fig. 18. Graphical representation of the mean-camber curves and maximum gauge circles in Section1–3, respectively. The displays of (a–c) are provided by iCloud3D software, which is developed by our team.
doi:10.1371/journal.pone.0115471.g018
Curve Reconstruction and Mean-Camber Curve Extraction of Blade
PLOS ONE | DOI:10.1371/journal.pone.0115471 December 31, 2014 27 / 30

3) Visual-guided robot grinding localization. Robot grinding has the
advantages of flexible contacting and wide-line machining and can lead to
high surface roughness and quality consistency compared to traditional
artificial grinding. One important task is to construct a relationship between
the blade workpiece in the robot coordinate system and the grinding path in
the design coordinate system. The workpiece can be scanned using a laser
scanning sensor, and the obtained point cloud is used to register the design
model. The registering results can be evaluated using the mean square error
and section parameter error to determine whether the grinding allowance is
satisfactory.
Author Contributions
Conceived and designed the experiments: WLL HX. Performed the experiments:
WLL HX ZPY. Analyzed the data: QDL HX LPZ. Contributed reagents/materials/
analysis tools: WLL HX QDL. Wrote the paper: WLL HX.
1. Hsu TH, Lai JY, Ueng WD, Hwang JZ (2005) An iterative coordinate setup algorithm for airfoil bladesinspection. International Journal of Advanced Manufacturing Technology 26(7–8): 797–807
Fig. 19. Graphical representation of the curvature value of the mean-camber curves in Section 1–3.
doi:10.1371/journal.pone.0115471.g019
Curve Reconstruction and Mean-Camber Curve Extraction of Blade
PLOS ONE | DOI:10.1371/journal.pone.0115471 December 31, 2014 28 / 30
References

2. Hsu TH, Lai JY, Ueng WD (2006) On the development of airfoil section inspection and analysistechnique. International Journal of Advanced Manufacturing Technology 30(1–2): 129–140
3. Chang HC, Lin AC (2005) Automatic inspection of turbine blades using a 3-axis CMM together with a 2-axis dividing head. International Journal of Advanced Manufacturing Technology 26(7–8): 789–796
4. Makem Je, Ou HG, Armstrong (2012) A virtual inspection framework for precision manufacturing ofaerofoil components. Computer Aided Design 44(9): 858–874
5. Besl P, McKay H (1992) A method for registration of 3-D shapes. IEEE Transaction on Pattern Analysisand Machine Intelligence 14(2): 239–256
6. Savio E, De Chiffre L, Schimitt R (2007). Metrology of freeform shaped parts. CIRP Annals-Manufacturing Technology 56(2): 810–835
7. Heo EY, Kim DW, Lee JY, Kim KY (2008) Computer-aided measurement plan for an impeller on acoordinate measurement machine with a rotating and tilting probe. Robotics and Computer-IntegratedManufacturing 24(6): 788–795
8. Li YQ, Ni J (2009). Constraints based nonrigid registration for 2D blade profile reconstruction in reverseengineering. ASME Journal of Computing and Information Science in Engineering 9(3): 0310005(9pp)
9. http://aicon3d.com/applications/3d-scanner/quality-control/3d-quality-inspection-of-turbine-blades.html
10. Chen T, Du XM, Jia M, Song G (2010) Application of optical inspection and metrology in quality controlfor aircraft components. In: Proceedings of International Conference on Computer Engineering andTechnology. Piscataway, USA, pp. 294–298
11. Ravishankar S, Dutt HNV, Gurumoorthy B (2010) Automated inspection of aircraft parts using amodified ICP algorithm. International Journal of Advanced Manufacturing Technology 46(1–4): 227–236
12. Pottmann H, Huang Q, Yang Y (2006) Geometry and convergence analysis of algorithms forregistration of 3D shapes. International Journal of Computer Vision 67(3): 277–296
13. Li WL, Yin ZP, Huang YA, Xiong YL (2011) Three-dimensional point-based registration algorithm basedon adaptive distance function. IET Computer Vision 5(1): 68–77
14. Yimaz O, Noble D, Gindy NNZ, Gao J (2005) A study of turbomachinery components machining andrepairing methodologies. Aircraft Engineering and Aerospace Technology 77(6): 455–466
15. Gao J, Chen X, Yilmaz O, Gindy N (2008) An integrated adaptive repair solution for complex aerospacecomponents through geometry reconstruction. International Journal of Advanced ManufacturingTechnology 36(11–12): 1170–1179
16. Yilmaz O, Gindy N (2010) A repair and overhaul methodology for aero-engine components. Roboticsand Computer-Integrated Manufacturing 26(2): 190–201
17. Zheng JM, Zhong GL, Chen X (2006) Worn area modeling for automating the repair of turbine blades.International Journal of Advanced Manufacturing Technology 29(4): 1062–1067
18. Berger U, Janssen R, Brinksmeier E (1999) Advanced mechatronic system for manufacturing andrepair of turbine blades. In: Proceedings of Symposium on Information Control in Manufacturing.Kidlington, UK, pp. 295–300
19. Rong Y, X JT, Sun YW (2014) A surface reconstruction strategy based on deformable template forrepairing damaged turbine blades. Proceedings of the Institution of Mechanical Engineers, Part G:Journal of Aerospace Engineering 228(8): 1–13
20. Zhang X, Kuhlenkotter B, Knueuper K (2005) An efficient method for solving the signorini problem inthe simulation of free-form surfaces produced by belt grinding. International Journal of Machine Tools &Manufacture 45(6): 641–648
21. Huang H, Gong ZM, Chen XQ, Zhou L (2003) SMART robotic system for 3D profile turbine vane airfoilrepair 21(4): 275–283
Proceedings of IEEE Conference on Robotics, Automation and Mechatronics, Piscataway, USA, pp.155–159
Curve Reconstruction and Mean-Camber Curve Extraction of Blade
PLOS ONE | DOI:10.1371/journal.pone.0115471 December 31, 2014 29 / 30
22. Chen Q, Sun ZG, Zhang WZ, Gui ZC (2008) A robot for welding repair of hydraulic turbine blade. In:
23. Gan ZX, Zhang H, Wang JJ (2007) Behavior-based intelligent robotic technologies in industrial applications. Lecture Notes in Control and Information Sciences 362 pp. 1-12

Recognition 40(11): 2914–2929
comparison. Pattern Recognition 21(2): 237–360
Publishing
Curve Reconstruction and Mean-Camber Curve Extraction of Blade
PLOS ONE | DOI:10.1371/journal.pone.0115471 December 31, 2014 30 / 30
based registration and surface based registration for 3D assessment of surgical change followingorthognathic surgery. PLoS ONE 9(4): e93402
dynamic morphological changes after dual-plane augmentation mammaplasty with 3Dscanning technique. PLoS ONE 9(3): e93010
24. Ji K, Luan J, Liu CJ, Mu DL, Mu LH, et al. (2014) A prospective study of breast
25. Almukhtar A, Ju XY, Khambay B, McDonald J, Ayoub A (2014) Comparison of the accuracy of voxel
26. Serra J (1982) Image analysis and mathematical morphology, London, UK: Academic Press
27. Aptoula E, Lefevre S (2007) A comparative study on multivariate mathematical morphology. Pattern
28. Vizilter YV, Sidyakin SV, Rubis AY, Gorbatsevich V (2011) Skeleton-based morphological shape
29. Zhu XX (2000). Modeling technology of free-form curve and surface. Beijing, China: Chinese Scientific