research, development and technology co-force … · modot research development and technology 1617...
TRANSCRIPT

Research, Development and Technology
MoDOT
RDT 01-017
Repair and Strengthening of ImpactedPC Girders on Bridge A4845
Jackson County, Missouri
December, 2001
RI 01-016
Co-Force America, Inc.
Technical Report Documentation Page
1. Report No. RDT01-017
2. Government Accession No.
3. Recipient’s Catalog No. 5. Report Date September 2001
4. Title and Subtitle Repair and Strengthening of Impacted PC Girders on Bridge A4845 6. Performing Organization Code
CFA 7. Author/s S. Schiebel, R. Parretti, and A. Nanni
8. Performing Organization Report No. RDT01-017/RI01-016 10. Work Unit No. (TRAIS)
9. Performing Organization Name and Address Co-Force America, Inc. 800 West 14th Street Suite 108 Rolla, MO 65401-2157
11. Contract or Grant No.
13. Type of report and period covered
12. Sponsoring Organization Name and Address MoDOT Research Development and Technology 1617 Missouri Blvd., Jefferson City, MO 65101 14. Sponsoring Agency Code
MoDOT
15. Supplementary Notes
16. Abstract This project consisted of the repair and strengthening of 11 PC girders that were damaged by vehicular impact on Bridge A4845, Jackson County, MO. The repair/strengthening was achieved by externally bonded FRP reinforcement. Co-Force America, Inc. carried out the design for the repair/strengthening of the girders and provided quality control in the initial stages of the construction. Additional strips of FRP were installed by the University of Missouri-Rolla for long-term bond durability studies in the form of bond pull-off and torsion tests. The initial tests have shown good adhesion of the laminate to the concrete substrate. Follow up tests will be performed at one-year intervals for the next 5 years. A separate report will be submitted by UMR once all of the bond durability tests are completed.
17. Key Words Bridge, fiber reinforced polymer, strengthening, girder, repair
18. Distribution Statement No restrictions. This document is available to the public through NTIC, Springfield, VA 22161
19. Security Classification (of this report) Unclassified
20. Security Classification (of this page) Unclassified
21. No. of Pages 27
22. Price
Form DOT F 1700.7 (8-72) Reproduction of form and completed page is authorized.

Co-Force America, Inc.800 West 14th Street, Suite 108
Rolla, MO 65401Ph./Fax: (573) 364-7997
e-mail: [email protected]
REPAIR AND STRENGTHENING OF IMPACTED PC GIRDERS ON BRIDGE A-4845
JACKSON COUNTY, MO
Final Report
Prepared for the
Missouri Department of Transportation (MODOT)
Project No. RI01-016
Submitted
November 2001
ii

Executive Summary
Eleven PC girders of Bridge A-4845 located over Route 291 on Route 24 in Independence, MO, were impact-damaged by overheight vehicle/s causing concrete to spall and exposing rebar and prestressing strands. This project consisted of the repair and strengthening of the eleven girders. After applying concrete patches to those sections that had been damaged, the strengthening was achieved by externally bonded FRP reinforcement using established methods and ensuring that the new ultimate flexural capacity be equal or higher than the original one. Co-Force America, Inc. (CFA) carried out the design for the strengthening of the girders and provided quality control in the initial stages of the construction. MoDOT personnel repaired and strengthened the girders without incidents or problems after they had been trained by CFA engineers on the proper installation methods. Additional strips of FRP were installed by the University of Missouri-Rolla (UMR) for long-term bond durability studies in the form of bond pull-off and torsion tests. The initial tests have shown good adhesion of the laminate to the concrete substrate. Follow up tests will be performed at one-year intervals for the next five years. A separate report will be submitted by UMR once all of the bond durability tests are completed.
iii

Acknowledgements
The authors would like to thank Anand Khataukar, graduate student, and Jason Cox, senior laboratory technician, at the University Transportation Center of the University of Missouri Rolla. They were responsible for applying the additional FRP laminates and conducting the in-situ bond tests.
iv

Table of Contents
Executive Summary ..................................................................................................................... iii
Acknowledgements ..................................................................................................................... iv
1 Introduction........................................................................................................................... 1 1.1 Scope............................................................................................................................... 1 1.2 Background ..................................................................................................................... 1
2 Design and Strengthening .................................................................................................... 2 2.1 Strengthening Procedures ............................................................................................... 5
3 Long-Term Bond Durability Testing .................................................................................. 6 3.1 Pull-off Tests................................................................................................................... 6 3.2 Torsion Tests................................................................................................................... 9
4 Summary and Conclusion .................................................................................................. 11
5 References............................................................................................................................ 12
Appendix A: Location of Bridge A4845 in Jackson County, Missouri................................. 13
Appendix B: Strengthening Design Calculations.................................................................... 14
v

List of Tables
Table 1 – Results of the Initial Pull-off Tests ................................................................................. 7 Table 2 – Results of the Initial Torsion Testing ............................................................................. 9
List of Figures
Figure 1 – Impacted Girders on Bridge A4845 .............................................................................. 1 Figure 2 - Examples of Accidental Damage Repair Using FRP Technology................................. 2 Figure 3 – Exposed Tendons on Bridge A4845.............................................................................. 3 Figure 4 – Details of Longitudinal CFRP Sheets on Girder Soffit ................................................. 4 Figure 5 – Details of CFRP Anchor Strips ..................................................................................... 4 Figure 6 – MoDOT Personnel Applying MBrace Putty to a Damaged Girder .............................. 5 Figure 7 – FRP Strips for Bond Durability Testing........................................................................ 6 Figure 8 – Pull-off Test Procedures ................................................................................................ 7 Figure 9 – Pull-off Test Results ...................................................................................................... 8 Figure 10 – Apparatus for Torsion Testing..................................................................................... 9 Figure 11 – Torsion Test Results .................................................................................................. 10 Figure 12 – Relationship Between Results Obtained by Pull-Off and Torsion Tests .................. 11
vi

1 Introduction 1.1 Scope Eleven prestressed concrete (PC) girders of Bridge A-4845 located over Route 291 on Route 24 in Independence, MO, were impact-damaged by overheight vehicles causing concrete to spall and exposing rebar and prestressing strands. The location of the bridge is shown in Appendix A.
Figure 1 – Impacted Girders on Bridge A4845
1.2 Background There has been limited research on the repair of PC bridge girders damaged by vehicular impact. Traditional techniques used to repair concrete structures may be expensive, time consuming, and of limited effectiveness. On the other hand, FRP bonded reinforcement is an effective strengthening technique in terms of installation, design, and performance. In the event of FRP damage due to vehicular impact or other reasons, the external system can be removed and replaced with a new one. From a National Cooperative Highway Research Program (NCHRP) perspective, two publications (Shanafelt and Horn 1980 and 1985) address this topic. Researchers at Iowa State University have recently published a comprehensive report (Klaiber et al. 1999). This document includes an extensive annotated bibliography as well as results from experiments conducted in the field and in the laboratory. With respect to US experience, in addition to Iowa, Departments of Transportation of other states such as Georgia (Aboutaha et al. 1997), Minnesota (Olson et al. 1992), and Texas (Zobel et al. 1997) have supported work in this area. Under the repetitive nature of highway loading, repair methods such as internal strand splices and external post-tensioning were found to be only partially satisfactory because they could not restore the ultimate strength to the damaged member (Olson et al. 1992; Zobel and Jirsa 1998). Strengthening of reinforced concrete (RC) and PC structures using externally bonded steel plates and composite laminates has proven to be an effective method for decreasing or restoring structural capacity (Dolan et al. 1999). Fiber reinforced polymer (FRP) composites come in the form of pre-cured laminates or fiber sheets to be installed by hand lay-up. The application of the latter offers
1

several advantages such as ease of bonding to curved or irregular surfaces, lightweight, and the fact that fibers can be oriented along any direction. Strengthening of impact-damaged girders with FRP laminates has already been explored (Nanni 1997). A similar project involving the strengthening of a damaged bridge girder has been conducted by the authors. A truck impacted the four girders of the bridge overpass on highway Appia, near Rome (Nanni 1997). This is a short bridge, 10.5 m in span, made of four prestressed concrete girders having cross sectional dimensions of 1.0 by 1.5 m. The concrete cross section was restored with no-shrink mortar and, after surface preparation, CFRP sheets were adhered to the concrete (see Figure 2). Two Research projects (Bridge G270 see Mayo et al. 1999, and Bridge J857 see Alkhrdaji et al. 1999) and two highway bridge repair projects (A3050 and A10062, see Figure 2) using advanced composites technology have already been conducted under MoDOT sponsorship by researchers at UMR.
Bridge on Highway Appia Bridge A3050 Bridge A10062
Figure 2 - Examples of Accidental Damage Repair Using FRP Technology In this project, it was decided to use carbon FRP (CFRP) laminates installed by manual lay-up to restore the original structural capacity of the girder. Co-Force America, Inc. (CFA) work involved the design of the CFRP strengthening, specifications for construction, and quality control of the installation. Quality control tests, performance monitoring, and bond-behavior investigation of the strengthening system were conducted by the University of Missouri-Rolla (UMR). The project provided a new opportunity to use FRP technology for accidental damage repair. Data collected from this project will add to existing information and will be used to establish guidelines for repair specifications of highway bridges. 2 Design and Strengthening The design for these girders was based on the premise that the loss of ultimate flexural capacity due to the damage to the prestressing tendons in the girders would be provided by the bonded CFRP. The MoDOT inspection crew stated that only three girders had been damaged enough to expose any tendons, and that the maximum number of tendons exposed in a single girder was two (see Figure 3a & 3b).
2

(a)
(b)
Figure 3 – Exposed Tendons on Bridge A4845 Girder details were based on the structural drawings provided by MoDOT. The girders are standard MoDOT Type 6 Prestressed I-girders with a total height of 4.5 ft, a top and bottom flange width of 2 ft, and a web width of 6.5 in. Each girder has a total of 24, 0.5 in. tendons with an assumed effective stress fpe of 165 ksi. The concrete strength was assumed to be 4000 psi. The ultimate tensile strength of the fiber composite strengthening system is 550 ksi with a maximum elongation of 0.017 in./in. According to AASHTO, the strength reduction factor for prestressed girders is � =1.0. The factored moment capacity (�Mn) of an undamaged composite slab/girder is approximately 4408 kip-ft. Capacity calculations are achieved using an effective slab width of 96.5 in. and slab thickness of 7.5 in. and considering a 1-in haunch between the girders and the topping slab. In order to design the strengthening for the impacted girders two tendons were assumed to be damaged at 50% or one tendon totally broken. The capacity of a damaged girder is 4221 k-ft, making the capacity required for the strengthening to be 187 k-ft. It was determined that two CFRP sheets be bonded to the soffitt of each girder. The moment capacity of a girder section after this strengthening is �Mn = 4407 k-ft. The CFRP will increase the moment capacity by approximately 4.4%. The bonded CFRP, in addition to its structural contribution, will help to prevent deterioration of the repaired areas. See Appendix B for the detailed strengthening design calculations. The design called for the installation of two plies of 22 in. wide strips of CFRP to the soffitt of each beam. The first ply was 14 ft. in length and the second was 12 ft. in length. Figure 4 below shows a sketch of the longitudinal strip installation. In order to resist peeling of the longitudinal sheets a total of 12 strips of CFRP were wrapped around the bulb of the girders over the length of the repair. These strips are 6 in. wide and extend from the bottom of the web on one side of the bulb to the bottom of the web on the opposite side. The strips are spaced at 16 in. on center. Figure 5 below shows a sketch of the installation of the anchor strips.
3

Bottom View
22”
Side View
12’ CFRP ply CFRP ply
14’
Area of Damage
Figure 4 – Details of Longitudinal CFRP Sheets on Girder Soffitt
14’
8”
Side View
16” 16”
Cross Section
12 CFRP strips (6” wide @16” c/c, 60” length)
Round edges to ½”rad. min
Figure 5 – Details of CFRP Anchor Strips
4

2.1 Strengthening Procedures After the design had been completed and submitted the strengthening could be performed. In order to strengthen the impacted girders, they first had to be repaired. This consisted of applying concrete patches to those sections that had been damaged. Once the concrete had been repaired, the strengthening system could be applied. A MoDOT bridge repair crew conducted the application of the CFRP strengthening as specified in the design. The MBrace Composite Strengthening System was the material used and was applied according to the manufacturer’s recommendations (MBT 1998). A brief summary of the procedures for application of CFRP sheets is given below.
1. Surface Preparation: The surface of the structure is cleaned and prepared for installation through the use of sand blasting. This is to remove laitance and open the concrete pores.
2. Primer Application: A coat of MBrace Primer is applied to the concrete surface. The
low-viscosity epoxy-based primer prepares the surface of the concrete for the application of the CFRP sheets.
3. Putty Application: A very thin coat of MBrace Putty is smoothed over the surface to fill
in any small voids, cracks or uneven surfaces (See Figure 6) 4. Saturant: A layer of MBrace Saturant is applied next. This precedes the installation of
the first layer of carbon fibers. 5. CFRP Sheets: The first ply of carbon fibers is then applied. The sheet is rolled into the
saturant to insure good impregnation. 6. Saturant: The application of a second layer of saturant follows. The sheet is rolled
thoroughly to ensure good penetration of the resin around the fibers
7. Additional plies can be installed until the required thickness of laminate is attained.
(a)
(b)
Figure 6 – MoDOT Personnel Applying MBrace Putty to a Damaged Girder
5

3 Long-Term Bond Durability Testing The final aspect of this project is the continuing long-term bond durability monitoring being carried out by the University of Missouri-Rolla. This report outlines the concepts and procedures for the testing as well as the findings of the initial testing. As the testing is to proceed for a total of five years, the final report on the bond durability monitoring will be submitted by UMR at the time it is completed. A team from the university installed five strips of CFRP on the bridge girder in a similar fashion to that adopted during the strengthening system installation. The five strips were installed at one end of the bridge away from the traffic lanes (see Figure 7) to avoid traffic disruption during testing. These strips will be used to perform a series of tests once every five years. The tests consist of bond pull-off and torsion tests and will help evaluate the performance of the installed strengthening over time.
Figure 7 – FRP Strips for Bond Durability Testing
3.1 Pull-off Tests The pull-off test is a simple and straightforward test to perform. A fixture of 1.625-in. diameter is adhered to the surface of the FRP with an epoxy adhesive (Figure 8a). After the epoxy is allowed to cure and the fixture is firmly attached to the FRP, the fixture is isolated from the surrounding FRP with a core drill (Figure 8b). The test apparatus is then attached to the fixture and aligned so that tension is applied perpendicular to the concrete surface (Figure 8c). A force is applied at a constant rate until the fixture detaches from the surface (Figure 8d). There are three possible failure modes for the pull-off test; 1) failure in the concrete substrate, 2) failure at the interface FRP laminate-concrete, or 3) failure in the epoxy adhesive compound (fixture delamination). Of the three failure modes, the third one is unacceptable in that it shows fixture installation problems. The second failure mode may be indicative of a bond durability problem. The first failure mode is the desirable one and should occur at a stress value larger than 200 psi. A full description of the pull-off test for concrete repair evaluation is given in the International Concrete Repair Institute’s “1999 Concrete Repair Manual” (ICRI, 1999).
6

(a)
(b)
(c)
(d)
Figure 8 – Pull-off Test Procedures The results of the pull-off tests conducted in August 2001 are given in Table 1. The load at which the specimen detached from the surface is given in the second column with the corresponding stress displayed in the third column. The ultimate stress (or bond tensile strength) is computed al the ultimate load divided by the fixture area. It is to be noted that according to ICRI recommendations, the minimum threshold is 200 psi; therefore, these results can be considered highly satisfactory. The results of the pull-off tests show that the failure was in the concrete indicating a strong bond between the FRP and the concrete surface. The approximate percentages of disk area as covered by concrete or exposed FRP is given in the fourth column of the table.
Table 1 – Results of the Initial Pull-off Tests
Pull-off Tests Load (lb) Stress (psi) Disk Area Inspection P1 1000 482 25% FRP, 75% concrete P2 1200 579 30% FRP, 70% concrete P3 1000 482 35% FRP, 65% concrete
Photos for the initial pull off tests are shown in Figure 9. The photos on the left display the locations of the pull-off test and the photos on the right display the sample discs.
7

(a) Location of P1
(b) P1 disc
(c) Location of P2
(d) P2 disc
(e) Location of P3
(f) P3 disc
Figure 9 – Pull-off Test Results
8

3.2 Torsion Tests To perform the torsion tests, special disks are adhered to the FRP with epoxy. The disks are identical to the ones used for pull-off, with the exception of a grid of 4 grooves to improve bonding of the adhesive to the steel surface. Similar to the pull-off test, the FRP was cut along the perimeter of the disk using a core drill. Torsion was applied using a calibrated torque wrench until the fixture separated from the surface (Figure 10a & 10b).
(a)
(b)
Figure 10 – Apparatus for Torsion Testing The shear stress that develops as the result of the applied torque has a triangular distribution with maximum at the external location and zero at the center of the circle. Due to this stress distribution, it is common practice to report the average shear stress equal to half the peak (Khataukar, 2001). The average shear stresses were calculated by taking the average of individual tests results with identical mode of failure. Three samples were used for the initial torsion tests. The results of the tests are given in Table 2 below. The torque at which the disc separated from the surface is given in the second column. The third column displays the corresponding ultimate stress or bond shear strength. The amount of disk surface area covered by the respective materials is given in column 4.
Table 2 – Results of the Initial Torsion Testing
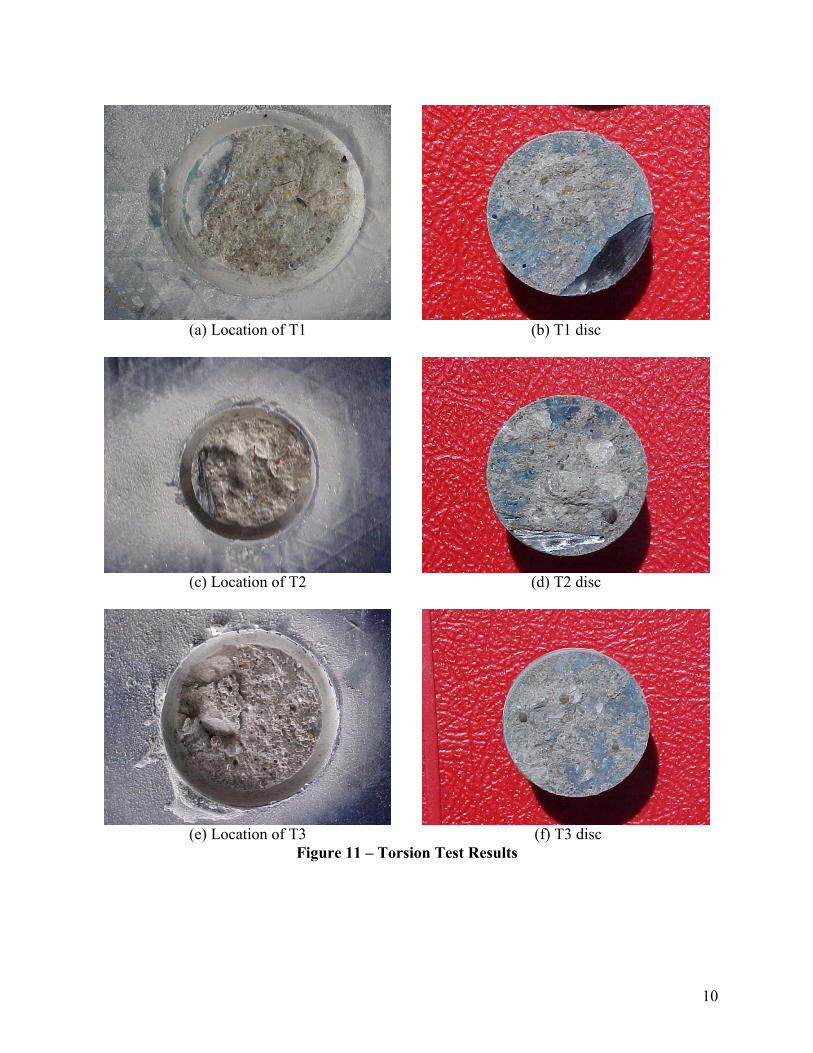
Torsion Tests Torque (ft-lb) �max (psi) Disk Area Inspection T1 75 534 60% FRP, 40% concrete T2 95 676 50% FRP, 50% concrete T3 100 712 45% FRP, 55% concrete
Figure 11 below displays the photos taken of the torsion test samples. The photos on the left show the locations of the torsion test specimens and the photos on the right show the torsion test discs.
9
(a) Location of T1
(b) T1 disc
(c) Location of T2
(d) T2 disc
(e) Location of T3
(f) T3 disc
Figure 11 – Torsion Test Results
10

The results of the torsion tests indicate that the bond is as strong as that indicated in the pull-off tests. This is consistent with results obtained in the laboratory as shown in Figure 12. In this figure, the data from A4845 bridge (hollow square) are compared with results obtained from eight series of specimens on which the FRP laminate was applied on a concrete substrate having temperature ranging from 10 to 120 oF (Khataukar, 2001).
0
200
400
600
800
1000
1200
1400
400 450 500 550 600 650 700 750 800 850 900
Normal stress (psi)
Shea
r st
ress
(psi
)
120 F 105 F 90 F70 F 40 F 30 F20 F 10 F A4845
Figure 12 – Relationship Between Results Obtained by Pull-Off and Torsion Tests
4 Summary and Conclusion Eleven PC girders of Bridge A-4845 located over Route 291 on Route 24 in Independence, MO, were impact-damaged by overheight vehicles causing concrete to spall and exposing rebar and prestressing strands. The damage was repaired and the girders strengthened with externally bonded carbon FRP laminates The design of the strengthening was achieved using established methods and ensuring that the new ultimate flexural capacity be equal or higher than the original one . The girders were repaired and strengthened by MoDOT personnel without incidents or problems after they had been trained by Co-Force America, Inc. engineers on the proper installation methods. The initial bond durability tests performed by UMR indicate that the strengthening system has achieved a good bond with the substrate and performance is as expected. Further bond durability testing by UMR in subsequent years will verify these findings.
11

5 References Aboutaha, R, R.T. Leon, and A.H. Zureick, (1997), “Rehabilitation of Damaged AASHTO Type
II Prestressed Girder Using CFRP,” Proc., II Symposium on Practical Solutions for Bridge Strengthening and Rehabilitation, Kansas City, MO, April, pp. 293-301.
Alkhrdaji, T., Nanni., A., Chen, G., and Barker, M., (1999) “Upgrading The Transportation Infrastructure: Solid RC Decks Strengthened with FRP,” Concrete International: Design and Construction, Vol. 21, No. 10, Oct. 1999, pp. 37-41.
Dolan, C.W., S. Rizkalla and A. Nanni, Editors, (1999), Fiber Reinforced-Polymer Reinforcement for Concrete Structures – Fourth International Symposium (FRPRCS4), ACI Special Publication No. 188, American Concrete Institute, Farmington Hills, MI, 1182 pp.
ICRI-ACI, (1999), Concrete Repair Manual, Sterling, VA, pp. 395-397. Khataukar, A. (2001), “Effect of Environmental Conditions on the Installation Process of
Bonded FRP Materials,” M.Sc. Thesis, UMR, in print. Klaiber, F.W., T.J. Wipf, F.M. Russo, R.R. Paradis, and R.E. Mateega, (1999), “Field/
Laboratory Testing of Damaged Prestressed Concrete Girder Bridges,” Iowa DOT Report HR-397, Iowa State Univ., Ames, Iowa, Dec., 261 pp.
Master Builders Technologies, (1998), “MBrace Composite Strengthening System - Engineering Design Guidelines,” Second Ed., Cleveland, OH, 140 pp.
Mayo, R., Nanni, A., Gold, W. and Barker, M., (1999)“Strengthening of Bridge G270 With Externally-Bonded CFRP Reinforcement,” Proc., 4th International Symposium on FRP for Reinforcement of Concrete Structures (FRPRCS4), Baltimore, MD, Nov. 1999.
Nanni, A., (1997) “Carbon FRP Strengthening: New Technology Becomes Mainstream,” Concrete International: Design and Construction, Vol. 19, No. 6, June, pp. 19-23.
Nanni, A., F. Focacci, and C.A. Cobb, (1998) “Proposed Procedure for the Design of RC Flexural Members Strengthened with FRP Sheets,” Proceedings, ICCI-98, Tucson, AZ, Jan. 5-7, Vol. I, pp. 187-201.
Olson, S.A., C. W. French, and R.T. Leon, (1992), “Reusability and Impact Damage Repair of Twenty-Year-Old AASHTO Type III Girders,” Research Report No. 93-04, Univ. of Minnesota, Minneapolis, MN, May.
Prestressed Concrete Institute, (1999), PCI Design Handbook, Fifth Edition, Chicago, Illinois, pp. 4-59~4-63.
Shanafelt, G.O., and W.B. Horn, (1980), “Damage Evaluation and Repair Methods for Prestressed Bridge Members,” Transportation Research Board, Washington, DC, NCHRP Report 226.
Shanafelt, G.O., and W.B. Horn, (1985), “Guidelines for Evaluation and Repair of Prestressed Concrete Bridge Members,” NCHRP Report 280, Transportation Research Board, Washington, DC.
Zobel, R.S, and J. O. Jirsa, (1998), “Performance of Strand Splice Repair in Prestressed Concrete Bridges,” PCI Journal, Vol. 43, No. 6, Nov.-Dec., pp. 72-84.
Zobel, R.S, J.O. Jirsa, D.W. Fowler, and R.L. Carrasquillo, (1997), “Evaluation and Repair of Impact-Damaged Prestressed Concrete Bridge Girders,” Report CTR 1370-3F, Univ. of Texas, Austin, TX.
12

Appendix A: Location of Bridge A4845 in Jackson County, Missouri
Bridge A4845
13

Appendix B: Strengthening Design Calculations Original Capacity Section Dimensions
Reinforcement Layout Load and Span Information Material Property Specifications
Design Ultimate Moment Capacity
fpe 165�� Effective stress in the steel due to prestress [ksi]
Bond 1�� Type of tendon installation (Enter "1" for bonded, "0" for unbonded)
Mu 4408�� Factored moment to be resisted by the strengthened element [k-ft]
Ms 0.5 Mu��� Service moment to be resisted by the strengthened element [k-ft]
Mip 0.5 Ms��� Moment in place at the time of MBrace installation [k-ft]
ln 0�� Clear span [ft]
lr 1.0�� Ratio of loaded spans to total spans (e.g., 0.50 for alternate bay loading)This variable is used only if unbonded tendons are present
f'c 4000�� Nominal compressive strength of the concrete [psi]
fy 60�� Yield strength of the mild steel [ksi]
fpu 270�� Ultimate strength of the prestressing steel [ksi]
fpy 243�� Yield strength of the prestressing steel [ksi]
Ep 28000�� Modulus of elasticity of the prestressing steel [ksi]
Required Information about the Existing Structure
h 62.5�� Total section height [in]
bw 6.5�� Width of web [in]
bft 96.5�� Width of top flange (zero for rectangular or inverted tee sections) [in]
tft 7.5�� Thickness of top flange (zero for rectangular or inverted tee sections) [in]
bfb 24�� Width of bottom flange (zero for rectangular or tee sections) [in]
tfb 6�� Thickness of bottom flange (zero for rectangular or tee sections) [in]
As 0�� Area of mild tension steel [in2]
d 17.5�� Depth to the mild tension steel centroid [in]
As' 0�� Area of mild compression steel [in2]
d' 0�� Depth to the mild compression steel centroid [in]
Ap .153 24��� Area of prestressing steel [in 2]
dp 58.83�� Depth to the prestressing steel centroid [in]
�Mn 4408.4� Mu 4408� Design moment capacity [k-ft] vs moment demand [k-ft]
14

Beam’s Capacity after one tendon has been lost Section Dimensions
Reinforcement Layout Load and Span Information Material Property Specifications
Design Ultimate Moment Capacity
fpe 165�� Effective stress in the steel due to prestress [ksi]
Bond 1�� Type of tendon installation (Enter "1" for bonded, "0" for unbonded)
Mu 4408�� Factored moment to be resisted by the strengthened element [k-ft]
Ms 0.5 Mu��� Service moment to be resisted by the strengthened element [k-ft]
Mip 0.5 Ms��� Moment in place at the time of MBrace installation [k-ft]
ln 0�� Clear span [ft]
lr 1.0�� Ratio of loaded spans to total spans (e.g., 0.50 for alternate bay loading)This variable is used only if unbonded tendons are present
f'c 4000�� Nominal compressive strength of the concrete [psi]
fy 60�� Yield strength of the mild steel [ksi]
fpu 270�� Ultimate strength of the prestressing steel [ksi]
fpy 243�� Yield strength of the prestressing steel [ksi]
Ep 28000�� Modulus of elasticity of the prestressing steel [ksi]
Required Information about the Existing Structure
h 62.5�� Total section height [in]
bw 6.5�� Width of web [in]
bft 96.5�� Width of top flange (zero for rectangular or inverted tee sections) [in]
tft 7.5�� Thickness of top flange (zero for rectangular or inverted tee sections) [in]
bfb 24�� Width of bottom flange (zero for rectangular or tee sections) [in]
tfb 6�� Thickness of bottom flange (zero for rectangular or tee sections) [in]
As 0�� Area of mild tension steel [in2]
d 17.5�� Depth to the mild tension steel centroid [in]
As' 0�� Area of mild compression steel [in2]
d' 0�� Depth to the mild compression steel centroid [in]
Ap .153 23��� Area of prestressing steel [in 2]
dp 58.83�� Depth to the prestressing steel centroid [in]
�Mn 4221.1� Mu 4408� Design moment capacity [k-ft] vs moment demand [k-ft]
15

Strengthening Design Section Dimensions
Reinforcement Layout
Load and Span Information
Material Property Specifications MBrace Material Selection
Bond 1�� Type of tendon installation (Enter "1" for bonded, "0" for unbonded)
Mu 4408�� Factored moment to be resisted by the strengthened element [k-ft]
Ms 0.5 Mu��� Service moment to be resisted by the strengthened element [k-ft]
Mip 0.5 Ms��� Moment in place at the time of MBrace installation [k-ft]
ln 0�� Clear span [ft]
lr 1.0�� Ratio of loaded spans to total spans (e.g., 0.50 for alternate bay loading)This variable is used only if unbonded tendons are present
f'c 4000�� Nominal compressive strength of the concrete [psi]
fy 60�� Yield strength of the mild steel [ksi]
fpu 270�� Ultimate strength of the prestressing steel [ksi]
fpy 243�� Yield strength of the prestressing steel [ksi]
Ep 28000�� Modulus of elasticity of the prestressing steel [ksi]
Required MBrace Design Information
Fiber 1�� MBrace Fiber Reinforcement1 -- MBrace CF 130 High Strength Carbon Fiber2 -- MBrace CF 160 High Strength Carbon Fiber3 -- MBrace AK 60 High Performance Aramid Fiber
Required Information about the Existing Structure
h 62.5�� Total section height [in]
bw 6.5�� Width of web [in]
bft 96.5�� Width of top flange (zero for rectangular or inverted tee sections) [in]
tft 7.5�� Thickness of top flange (zero for rectangular or inverted tee sections) [in]
bfb 24�� Width of bottom flange (zero for rectangular or tee sections) [in]
tfb 6�� Thickness of bottom flange (zero for rectangular or tee sections) [in]
As 0�� Area of mild tension steel [in2]
d 17.5�� Depth to the mild tension steel centroid [in]
As' 0�� Area of mild compression steel [in2]
d' 0�� Depth to the mild compression steel centroid [in]
Ap .153 23��� Area of prestressing steel [in 2]
dp 58.83�� Depth to the prestressing steel centroid [in]
fpe 165�� Effective stress in the steel due to prestress [ksi]
16

17
Durability Reduction Factors
Ccr 0.55�� Creep rupture stress limit (Use 0.55 for Carbon, 0.30 for Aramid, and 0.20 for E-Glass
Ce 0.95�� Reduction factor to limit strain in the MBrace reinforcement
Layout of the MBrace Reinforcement
wf 22�� Width of the MBrace strip [in]
n 2�� Number of MBrace plies
�sy 2.069 10 3�
��
�syfyEs
��
Yield strain for the mild reinforcement [in/in]�
�'c 1.897 10 3�
��
�'c1.71 f'c�
Ec��
Concrete strain corresponding to f'c [in/in]�
Ec 3.605 106��
Ec 57000 f'c���
Modulus of elasticity for concrete [psi]�
Computation of Material Characteristics
r 21.036�
rIgAc
��
Radius of gyration [in]�
Ig 5.249 105��
Ig bw h�h2
12h2
ct����
���
2�
��
��
� bft bw�( ) tft�tft2
12ct
tft2
����
���
2�
��
��
�� bfb bw�( ) tfb�tfb2
12cb
tfb2
����
���
2�
��
��
����
Gross moment of inertia [in 4]�
cb 44.398�
cb h ct���
Distance from the bottom fiber to the centroid [in]�
ct 18.102�
ct0.5 bw� h2
� 0.5 bft bw�( )� tft2�� bfb bw�( ) tfb� h 0.5 tfb��( )��
Ac��
Distance from the top fiber to the centroid [in]�
Ac 1.186 103��
Ac bw h� bft bw�( ) tft�� bfb bw�( ) tfb����
Cross sectional area [in 2]�
be 96.5�
be if bft 0 bw bft( )��
Effective width of concrete in compression [in]�
Computation of Gross Section Properties

18
�
�b 1�
�b if Bond 03.0lndp
���
���
lr�� 1.0����
���
��
Bond reduction coefficient applied to unbonded tendons�
�p1 6.538 10 3�
��
�p1Pe
Ap Ep�
PeAc Ec�
1e2
r2
����
����
���
Strain in the tendon at decompression [in/in]�
e 40.728�
e dp ct��
Eccentricity of prestressing force [in]�
Pe 5.806 105��
Pe Ap fpe���
Prestressing force [lbs]�
Preliminary computations for prestressing steel properties
�m 0.811�
�m min 11
60 �fu�1
n Ef� tf�2000000
���
���
� n Ef� tf� 1000000�if
160 �fu�
500000n Ef� tf�
���
���
� otherwise
�����
�����
�����
�����
��
Bond dependent coefficient for flexure �
�fu 0.016�
�fu Ce �fu���*
Design rupture strain [in/in] �
ffu 522500�
ffu Ce ffu���*Design ultimate tensile strength [psi] �
Preliminary computations for FRP properties
Moment capacity calculation based on the failure mode, strain compatibility, and equilibrium
Find the depth to the neutral axis by trial and error [in]�
c 5.49�
Compute the strain in the concrete if failure is controlled by concrete crushing (Failure Mode 1) [in/in]
�c1 0.003��

Compute the strain in the concrete if failure is controlled by tendon rupture (Failure Mode 2) [in/in]�
�c2 0.003 Ap 0if
0.03 �p1�� � cdp c�� Bond 1if
1�b
0.94 fpy�
Ep�p1�
���
���
�c
dp c�� Bond 0if
otherwise
��
�c2 0.0024�
Compute the strain in the concrete if failure is controlled by FRP failure (Failure Mode 3) [in/in]�
�c3 0.003 Af 0if
�m �fu� �bi� � ch c�� otherwise
��
�c3 0.0013�
Compute the strain in the concrete based on which mode of failure governs [in/in]�
�c min �c1 �c2 �c3� �� ���
�c 0.0013�
Compute the strain in the mild compression steel at ultimate [in/in]�
�s' 0 As' 0if
�cc d'�
c� otherwise
��
�s' 0�
Compute the strain in the mild tension steel at ultimate [in/in]�
�s 0 As 0if
�cd c�
c� otherwise
��
�s 0�
Compute the strain in the prestressing steel at ultimate [in/in]�
�ps 0 Ap 0if
�p1 �b �c�dp c�
c�� otherwise
��
�ps 0.019�
Compute the strain in the FRP at ultimate [in/in]�
�f 0 Af 0if
�ch c�
c� �bi� otherwise
�� Note: Based on M ip, the initial strain in the substrate was computed to be:
�bi 0.000088��
�f 0.013�
19

�c 3.929�
�c 2 c0
cyfc y( ) be� y�
���
d if bft 0 0� 1�( ) if c tft� 0� 1�( )�0
c tft�
yfc y( ) be bw( )� y����
d�
Cc
�����
�����
��
Locate the centroid of the compressive stress distribution in the concrete [in]�
O.K.�F 0�
�F Cc As' fs'� As fs� Ap fps� Af ff��
Check internal force equilibrium by summing the internal force resultants. Revise "c" if the sum does not �equal zero.
Cc 1045026�
Cc0
cyfc y( ) be�
���
d if bft 0 0� 1�( ) if c tft� 0� 1�( )�0
c tft�
yfc y( ) be bw( )����
d��
Find the resultant compressive force from the compressive stress distribution in the concrete [lbs]�
fc y( )1.8 f'c�
�c y��'c c�
��
��
�
1�c y��'c c�
��
��
2
�
Todeschini's equation defining the nonlinear compressive stress distribution in the concrete:�
ff 432025�
ff Ef �f��
Compute the stress in the FRP at ultimate by Hooke's Law [psi]�
fps 261855�
fps �ps Ep� �ps 0.008�if
fpu 2000( )if fpu 270000 75� 58�( )
�ps if fpu 270000 0.0065� 0.006�( ) otherwise
�
Compute the stress in the prestressing steel at ultimate per PCI Design Aid 11.2.5 [psi]�
fs 0�
fs fy �s �sy�if
fy( ) �s �sy�if
Es �s� otherwise
�
Compute the stress in the mild tension steel at ultimate for elastic/perfectly plastic behavior [psi]�
fs' 0�
fs' fy �s' �sy�if
fy( ) �s' �sy�if
Es �s'� otherwise
�
Compute the stress in the mild compression steel at ultimate for elastic/perfectly plastic behavior [psi]�
20

� � � Design Ultimate Moment Capacity
Additional reduction factor applied to the FRP contribution
�f 0.85��
Compute the strength reduction factor based on ductility per ACI 318-95 Section B.9.3.2.
� 0.90 Ap 0�if
0.9 �s 0.005�if
0.7�s �sy� �
0.025 5 �sy� �sy �s� 0.005�if
0.7 �s �sy if
otherwise
��
� 0.9�
Compute the design moment capacity [k-ft]
�Mn� As' fs'
�c2
d'���
���
As fs d�c2
���
���
� Ap fps dp�c2
���
���
� �f Af ff h�c2
���
���
���
��
12000��
�Mn 4406.8� Mu 4408� Design moment capacity [k-ft] vs moment demand [k-ft]
21