research method research designeprints.walisongo.ac.id/1733/4/093411048_bab3.pdfseventh grade...
TRANSCRIPT

28
CHAPTER III
RESEARCH METHOD
A. Research Design
Research design refers to the outline, plan, or strategy
specifying the procedure to be used in collecting data in a
research. This research is quantitative, because the result of the
students’ vocabulary achievement will be expressed in the
language of mathematic, evaluated consequently and also
interpreted by appropriate statistical procedures.
In this research, researcher uses an experimental
method. In applied linguistic, experimental study might involve
research that test whether method A or method B is more effective
in teaching.1 An experimental research is divided into two groups,
they are experimental group and control group. An experimental
group uses a new treatment while control group received without
treatment. According to Nunan, experiment is designed to collect
data in such a way that threats to the reliability and validity of the
research are minimized.2
The researcher uses true experiment (pretest-posttest
control group design) to identify and to know the effectiveness of
1 James Dean Brown and Theodore S. Redgers, Doing Second
Language Research, (United Kingdom: Oxford University Press, 2002), P.211
2David Nunan, Research Method in Language Learning, (Cambridge: Cambridge University Press, 1992), p. 47.
29
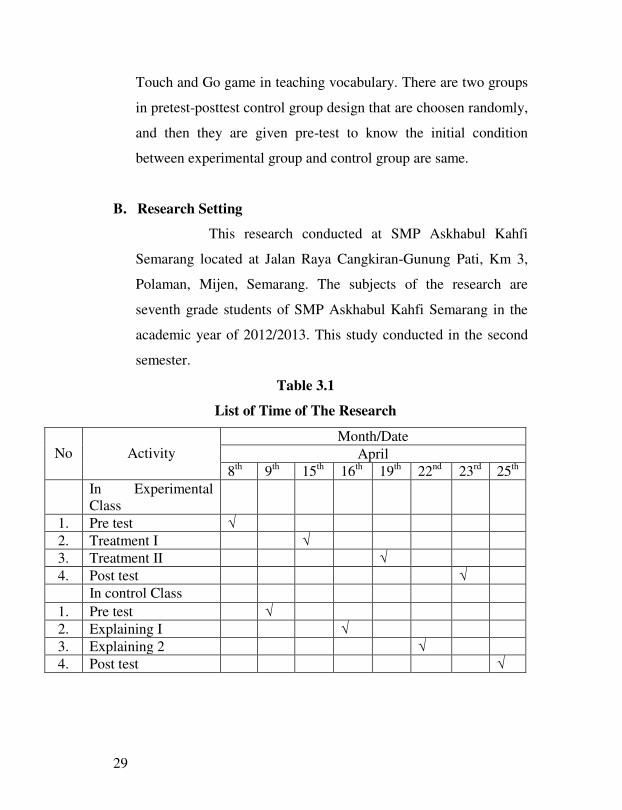
Touch and Go game in teaching vocabulary. There are two groups
in pretest-posttest control group design that are choosen randomly,
and then they are given pre-test to know the initial condition
between experimental group and control group are same.
B. Research Setting
This research conducted at SMP Askhabul Kahfi
Semarang located at Jalan Raya Cangkiran-Gunung Pati, Km 3,
Polaman, Mijen, Semarang. The subjects of the research are
seventh grade students of SMP Askhabul Kahfi Semarang in the
academic year of 2012/2013. This study conducted in the second
semester.
Table 3.1
List of Time of The Research
No
Activity
Month/Date
April
8th 9th 15th 16th 19th 22nd 23rd 25th
In Experimental Class
1. Pre test √
2. Treatment I √
3. Treatment II √
4. Post test √
In control Class
1. Pre test √
2. Explaining I √
3. Explaining 2 √
4. Post test √

30
C. Population and Sample
Before choosing the sample, the researcher has to determine the
population first. Population is a set (or collection) of all elements
possessing one or more attributes of interest.3 The population of this
research are the seventh grade students of SMP Askhabul Kahfi
Semarang in the academic year of 2012/2013.
Sample is part of population which is chosen as source of data.4
Sample is a representative group from population to serve as
respondents.5 Arikunto said that sample is a part that can represent all
the population observed. It is called sample research when we want to
generalize the sample research result. 6 The researcher selected two
groups of students from the population as sample in this study. The
total number of the population is 90 students which are divided into
three classes, the proccess of selection will be taken use purposive
sampling technique.
3 Suharsimi Arikunto, ….. p.130.
4 Sukardi, Metodologi Penelitian Pendidikan, (Jakarta; PT Bumi Aksara, 2009)p.54
5 Tuckman, Introduction to Linguistic Research,(Great Britain:Longman,1978)p.226
6 Suharsimi Arikunto….,p.131
31
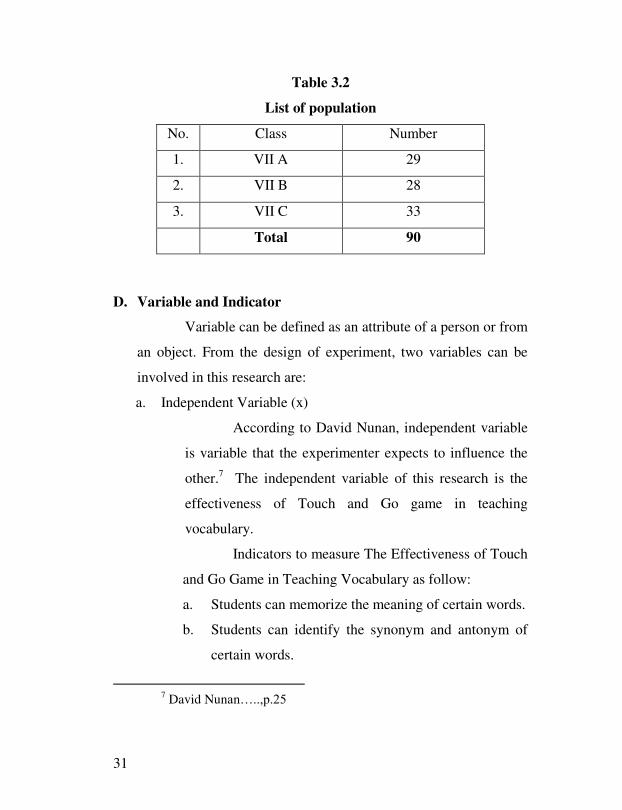
Table 3.2
List of population
No. Class Number
1. VII A 29
2. VII B 28
3. VII C 33
Total 90
D. Variable and Indicator
Variable can be defined as an attribute of a person or from
an object. From the design of experiment, two variables can be
involved in this research are:
a. Independent Variable (x)
According to David Nunan, independent variable
is variable that the experimenter expects to influence the
other.7 The independent variable of this research is the
effectiveness of Touch and Go game in teaching
vocabulary.
Indicators to measure The Effectiveness of Touch
and Go Game in Teaching Vocabulary as follow:
a. Students can memorize the meaning of certain words.
b. Students can identify the synonym and antonym of
certain words.
7 David Nunan…..,p.25

32
c. Students can compose sentences using the certain
words.
d. Dependent Variable (y)
The dependent variable is variable that measures
the influence of independent variable. The dependent
variable in this research is the students’ achievement in
the vocabulary test score.
Indicators to measure the students’ achievement
on vocabulary as follow:
a. Students can identify the certain vocabulary in a text.
b. Students can identify the meaning of certain
vocabulary.
c. Students can use the certain vocabulary to make a
good sentences.
E. Data Collection Technique
Data are the most important things in doing research. The
procedure of data collection should be appropriate to the kind of
the study. Therefore, in conducting this study, especially in
collecting the data, the researcher needs some methods in order to
obtain the expected data.
1. Test
Test is a question which is used to measure
competence, knowledge, intelligence, and ability of talent

33
which is possessed by individual or group to collect data.8 In
this research, the researcher will give the test twice (pretest
and post test) in both experimental and control groups in the
same way. Pre-Test, before the teacher explains material by
using Touch and Go Game, the teacher will give a test to the
students. Pre-test will be given before the experience is
running. Post-Test, this test will be given to the experimental
class and the control class. The test will be given in order to
know the improvement of students’ ability in vocabulary.
Post-test will be given to the both of class after receiving
treatment. The experimental class taught by using Touch and
Go game, but the control class taught without using Touch
and Go Game.
2. Documentation
Documentation is the accumulation, classification,
and dissemination of information. It refers to the archival data
that help the researcher to collect the needed data. In this
study, this method is used to get the data that related to the
object research such as students name list are included in the
population.9 In this case, the data is gained by the help of the
English teacher.
8 M.Chabib Thoha, Teknik Evaluasi Pendidikan, (Jakarta: PT Raja
Grafindo Persada, 2001), p.43
9 Suharsimi Arikunto, Prosedur Penelitian.., p. 231
34
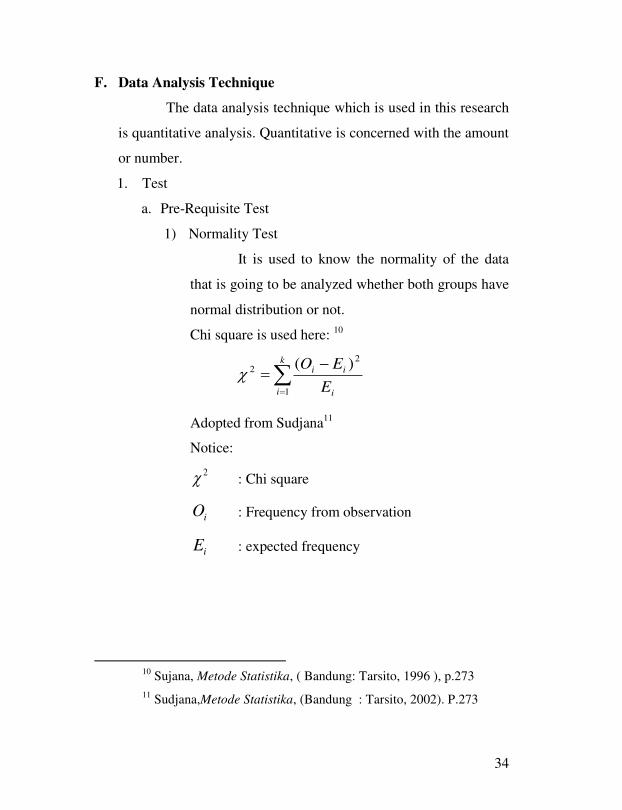
F. Data Analysis Technique
The data analysis technique which is used in this research
is quantitative analysis. Quantitative is concerned with the amount
or number.
1. Test
a. Pre-Requisite Test
1) Normality Test
It is used to know the normality of the data
that is going to be analyzed whether both groups have
normal distribution or not.
Chi square is used here: 10
k
i i
ii
E
EO
1
22 )(
Adopted from Sudjana11
Notice:
2 : Chi square
iO : Frequency from observation
iE : expected frequency
10 Sujana, Metode Statistika, ( Bandung: Tarsito, 1996 ), p.273
11 Sudjana,Metode Statistika, (Bandung : Tarsito, 2002). P.273

35
Calculation result of 2 is compared with x
table by 5% degree of significance. If 2 is lower
than x table so the distribution list is normal.
2) Homogeneity Test
Is used to know whether experimental group
and control group, that are decided, come from
population that has relatively same variant or not. The
formula is:
Vk
VbF
Adopted from Sugiono.12
Notice:
Vb : bigger varian
Vk : smaller varian
The hypotheses in homogeneity test are:
Ho : homogeny variant: 2
2
2
1
H1 : non homogeny variant: 2
2
2
1
If calculation result of F is lower than F table
by 5% degree of significance so Ho is accepted, it
means both groups have same variant.
12 Sugiyono,Statistika Untuk Penelitian, (Bandung: Alfabeta,
2007),p.140

36
3) Average same Test
It is used to examine average whether
experimental group and control group have been
decided having different average. 13
T-test is used to analyze the data of this
research. It used to measure or to compare the mean
scores of the two groups.
If 12 = 2
2 (has same variant), the formula is:
21
21
11
nnS
XXt
With
Adopted from Sudjana14
Where:
1X : The mean score of the experimental group
2X : The mean of the control group
n1 : The number of experimental group
n2 : The number of control group
S12 : The standard of deviation of experimental group
13Suharsimi Arikunto, Prosedur Penelitian.., p. 311.
14 Sudjana......p.239
2
)1()1(
21
2
22
2
11
nn
SnSnS

37
S22 : The standard of deviation of both groups
If = 122
2 (has no same variant) the formula is:
The hypotheses are:
Ho = 1 = 2
Ha = 1 2
1 : average data of experimental group
2 : average data of control group
Criteria test is: Ho is accepted if
2
112
11 ttt , where 2
11t obtained from
the distribution list t with 221 nndk and
opportunities 2
11 . Values for other t Ho
rejected.15
b. Try-Out Instrument of Test
1) Validity of Test
Validity is measurement that shows the validity
of instrument. It is counted using product moment
formula.
15Sudjana, Metode Statistika, p. 239-240.
2
2
1
1
2
1
21
n
S
n
S
XXt
38
})(}{)({
))((
2
11
22
11
2
111
n
i
i
n
i
i
n
i
i
n
i
i
n
i
i
n
i
i
n
i
ii
xy
yynxxn
yxyxn
r
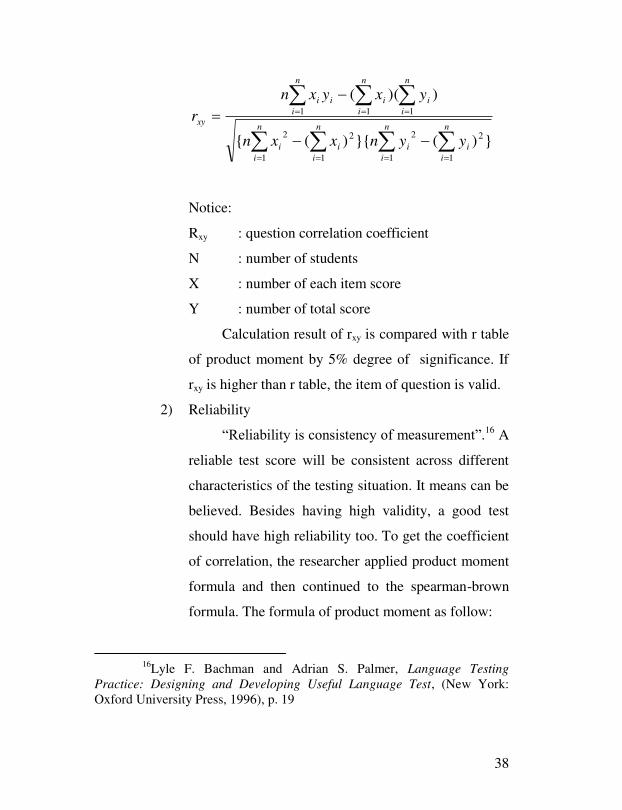
Notice:
Rxy : question correlation coefficient
N : number of students
X : number of each item score
Y : number of total score
Calculation result of rxy is compared with r table
of product moment by 5% degree of significance. If
rxy is higher than r table, the item of question is valid.
2) Reliability
“Reliability is consistency of measurement”.16 A
reliable test score will be consistent across different
characteristics of the testing situation. It means can be
believed. Besides having high validity, a good test
should have high reliability too. To get the coefficient
of correlation, the researcher applied product moment
formula and then continued to the spearman-brown
formula. The formula of product moment as follow:
16Lyle F. Bachman and Adrian S. Palmer, Language Testing
Practice: Designing and Developing Useful Language Test, (New York: Oxford University Press, 1996), p. 19

39
2222
YYNXXN
YXXYNrxy
Where:
r xy : coefficient of correlation between the scores
of the first and last part of the items.
N : The number of students / subject participating in
the test
∑x : The score of first part.
∑y : The score of last part.
After finding r xy the computation is continued
to the spearman-brown formula as follow:
xy
x
r1
rxy 2r11
In Which:
11r : the reability of the instrument
r xy : coefficient of the correlation between first and
last part.
Calculation result of r 11 is compared with r table
of product moment by 5% degree of significance. If r
11 is higher than r table , the item of question is
reliable.17
17Suharsimi Arikunto, Prosedur Penelitian..,p. 187-188

40
3) Degree of test difficulty
A good question is a question that not really
difficult and not really easy. Formula for degree of
test difficulty is:18
JS
BP
Notice:
P : difficulty’s index
B : number of students who has right answer
JS : number of students
The criteria are:
P = 0,00 too difficult question
0,00 < P ≤ 0,03 difficult question
0,03 < P ≤ 0,70 average question
0,70 < P ≤ 1,00 easy question
P = 1 too easy question
4) Discriminating Power
The discriminating power is a measure of the
effectiveness of a whole test. It is used to know how
accurate the question differ higher subject and lower
subject. The formula for discriminating power is:
18Suharsimi Arikunto, Prosedur Penelitian.., p.208
JB
BB
JA
BAD

41
Where:
D : discrimination index
JA : member of student in upper group
JB : member of student in low group
BA : member of students in upper group who
answer the item correctly
BB : member of students in low group who
answer the item correctly
The criteria are:
D < 0.2 is poor
0.2 < D ≤ 0.4 is fair
0.4 < D ≤ 0.7 is good
0.7 < D ≤ 1 is very good.
c. Phase End Analysis
To examine the hypothesis that have been stated,
these following steps are used.
1) Normality Test
The steps are same with the steps on data analysis
technique.
2) Homogeneity Test
The steps are same with the steps on data analysis
technique.
3) Average Same Test
The steps are same with the steps on data analysis
technique that is to prove the researcher hypothesis

42
about the difference of students’ achievement on the
vocabulary mastery between the students who were
taught by using Touch and Go game and who were not
taught by using Touch and Go game. Here, the t-test
formula is used.
Ho = 1 = 2
Ha = 1 2
If 12 = 2
2 (has same variant), the formula is:
21
21
11
nnS
XXt
With
Where:
1X : The mean score of the experimental group
2X : The mean of the control group
n1 : The number of experimental group
n2 : The number of control group
S12 : The standard of deviation of experimental group
S22 : The standard of deviation of both groups
If = 122
2 (has no same variant) the formula is:
2
)1()1(
21
2
22
2
11
nn
SnSnS

43
Testing criteria that apply Ho is accepted if scoret >
t table with determine 221 nndk and α = 5%
with opportunities (1-α). Values for other t Ho rejected.19
19 Sudjana,... p.243
2
2
1
1
2
1
21
n
S
n
S
XXt