research modal split between includes research … paper reviews the trends in transport and modal...
TRANSCRIPT

In the 1950s, the rail mode occupied a dominant position in transport within India. Since then,however, the transport sector in the country has been characterized by a secular decline in the shareof rail mode. Internalization of the external costs of transport may not be sufficient for theachievement of a socially optimal modal split unless account is taken of the factors behind thecurrent modal split. This paper attempts an investigation of these issues on the basis of data relatingto eight representative sections in the country where the two modes are in competition.
India became a decidedly road-dominant economy in the beginning of the eighties with therailways losing out in respect of freight traffic in addition to its already declining share in passengertraffic. The dominance of road over rail has since continued unabated till the present and is likelyto continue into the future.
This paper reviews the trends in transport and modal split in India from the fifties onwards andlooks at the factors likely to influence modal choice. In the literature, an individual’s choice of modeis divided into two main categories:
personal characteristics of the individual (income, tastes, auto ownership, competing familyneeds for the car)characteristics of transportation alternatives available (relative time, cost, and comfort).
Based on time-series including user costs, per capita domestic product, and consumptionexpenditure, an econometric analysis of inter-modal competition in the eight sections selected forthe current study reveals the following:
In the case of passenger traffic, increases in the user cost difference and the user cost ratiobetween road and rail have an upward impact on the relative traffic volume of rail.Income (as represented by per capita gross state domestic product) seems to play a part indetermining choice between travel by car on road and first-class/air-conditioned travel onrail.The relationship between modal split and user cost difference/cost ratio in the case ofcompetition between bus on road and second-class/sleeper-class travel on rail appears tobe a non-linear one.In the case of freight competition, the modal share of rail does not go up with increase inthe user cost difference or cost ratio between road and rail.It is the income variable that appears to influence modal choice in freight transport in theexpected manner with shippers patronizing the qualitatively superior road mode when percapita state domestic product goes up.
To arrive at a socially optimal modal split, therefore, it is necessary to concentrate onimprovements in the quality of service on rail while at the same time devising measures tointernalize the external costs of transport.
Modal Split betweenRail and Road Modesof Transport in India
Prosenjit Dey Chaudhury
ExecutiveSummary
R E S E A R C H
includes research articles thatfocus on the analysis and
resolution of managerial andacademic issues based on
analytical and empirical orcase research
KEY WORDS
Modal Split
User Cost
Vehicle Operating Costs
Value of Passenger Time
Feasible GeneralizedLeast Squares
VIKALPA • VOLUME 30 • NO 1 • JANUARY - MARCH 2005 17
17

The rail and road modes are worldwide thedominant modes of transport. The origin andrapid growth of railways in the nineteenth
century meant, in some cases, the displacement of theroad mode, both for passenger and freight movement.This was especially the case for long-distance travelbefore and in the early days of the internal combustionengine. In the early years of the twentieth century,however, the era of motorization set in and travel by roadbecame more popular. After the Second World War,rapid industrial development was accompanied byacceleration in the growth of motorized transport.Volumes of traffic on the rail and road modes grewsignificantly with the latter often showing a greaterincrease than the former as it could more readily meetthe demand for transport among different sections of thepopulation.
In the 1950s, the rail mode occupied a dominantposition in transport within India. Since then, however,the transport sector in the country has been characterizedby a secular decline in the share of rail in the total trafficcarried by both road and rail, although, in absoluteterms, traffic on both modes has increased significantly.The decline in the rail share has been pronounced forboth passenger and goods traffic. This phenomenongives rise to a number of issues that must engage theattention of the policy-maker. While it is true that theroad mode has inherent advantages of convenience,flexibility, and adaptability and may in many cases bequalitatively superior to the rail mode, nonetheless, itsdominance may not imply a socially desirable modalsplit. A number of studies has found that the externalcosts of rail transport are lower than those for roadtransport (Button, 1993; Government of Australia, 1994,1995, and 1996; Government of New Zealand, 1996; Ren-nings et al., 1999; Savelli and Domergue, 1998;Wiederkehr, 1998). The market-determined split betweenrail and road may be corrected through the internalizationof the external costs of transport such as resulting frompollution and accidents. Accordingly, the policy-ordecision-maker must find ways to internalize theseexternal costs in order to ensure desirable modal choicein transport. However, a proper inquiry into the subjectshould begin with an understanding of the factors thatdetermine the current modal split in transport.Internalization of external costs may not be sufficient forthe achievement of a socially optimal modal split unlessan account is taken of these factors.
We shall, in this paper, attempt an investigation ofthe factors behind the choice between rail and road inIndia on the basis of data relating to eight representativesections in the country where the two modes are incompetition. Since the data is aggregative in nature anddoes not cover all the variables that should ideally beincluded in such an exercise, the findings are meant toprovide preliminary, general ideas about the factorsbehind modal choice in passenger travel and freightshipment. We first review the trends in transport andmodal split in India concentrating on the two principalmodes and the findings of the important committeessuch as the National Transport Policy Committee. Next,we look at the factors likely to influence modal choicein transport and, finally, describe our own exercise inunderstanding modal choice between rail and road inthe country.
TRENDS IN TRANSPORT AND MODALSHARES IN INDIA
The Committee on Transport Planning and Coordination(Planning Commission, 1966), set up in 1959, noted thatthe burden of the increase in internal traffic since theFirst Plan had fallen mainly on the railways and on theroad transport. Over the period 1950-51 to 1964-65, railfreight traffic increased nearly two and a half times andthe same category of traffic on road went up almost fourtimes. During the same period, the share of rail in thetotal freight traffic carried by rail and road came downfrom 79 per cent to 73 per cent. The Committee notedthat railways accounted for close to 77 per cent of themovement of bulk commodities such as coal, iron ore,limestone, cement, and petroleum products. Passengertraffic by rail increased by nearly 40 per cent over theperiod 1950-51 to 1964-65, while passenger traffic byroad went up more than three times.
During the period 1950-51 to 1963-64, freight trafficincreased at a rate distinctly faster than either the rateof growth of national income or the expansion of outputin the industrial, mineral, and agricultural sectors. Whilenational income went up almost 60 per cent over theperiod, the total freight tonne-kilometres of rail and roadshowed a more than two-fold increase. Passenger trafficalso tended to rise somewhat faster than growth innational income, showing an almost two-fold increase.The Committee attributed the faster growth of transportoutput to the emphasis given to the development ofindustries, especially heavy industries, since the Second
18 MODAL SPLIT BETWEEN RAIL AND ROAD MODES OF TRANSPORT IN INDIA
18
Plan. However, the higher rate of growth of the transportsector did not indicate that the supply of transport serviceshad always been able to keep up with demand.
During the period under review, it was seen thatin the years when there was a slackening in economicgrowth, excess capacity was present in the transportsector, especially on the railways. However, in the otheryears, when the tempo of economic activity was pickingup, the transport sector could not cope with the demandand there were severe bottlenecks. The emphasis of theFive Year Plans on heavy and basic industries tendedto increase the proportion of traffic in bulk commoditiescarried by the railways. On the other hand, the growthof consumer goods industries and industries requiringspecial facilities had led to increased demand for roadtransport facilities.
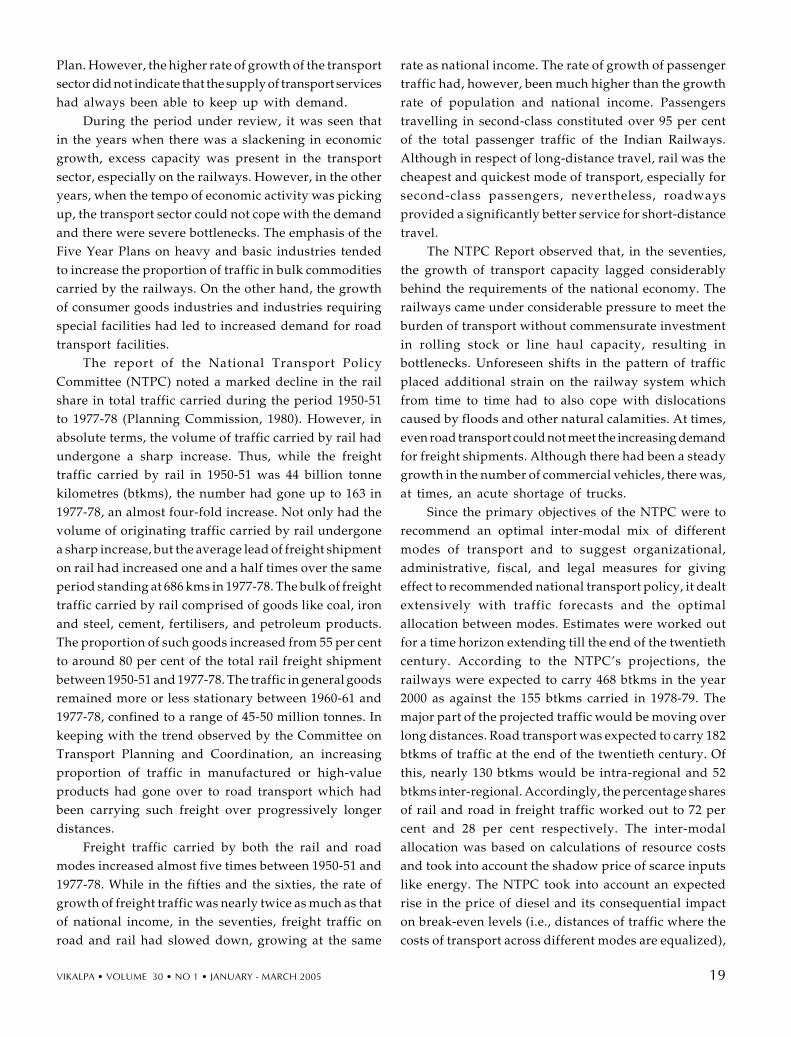
The report of the National Transport PolicyCommittee (NTPC) noted a marked decline in the railshare in total traffic carried during the period 1950-51to 1977-78 (Planning Commission, 1980). However, inabsolute terms, the volume of traffic carried by rail hadundergone a sharp increase. Thus, while the freighttraffic carried by rail in 1950-51 was 44 billion tonnekilometres (btkms), the number had gone up to 163 in1977-78, an almost four-fold increase. Not only had thevolume of originating traffic carried by rail undergonea sharp increase, but the average lead of freight shipmenton rail had increased one and a half times over the sameperiod standing at 686 kms in 1977-78. The bulk of freighttraffic carried by rail comprised of goods like coal, ironand steel, cement, fertilisers, and petroleum products.The proportion of such goods increased from 55 per centto around 80 per cent of the total rail freight shipmentbetween 1950-51 and 1977-78. The traffic in general goodsremained more or less stationary between 1960-61 and1977-78, confined to a range of 45-50 million tonnes. Inkeeping with the trend observed by the Committee onTransport Planning and Coordination, an increasingproportion of traffic in manufactured or high-valueproducts had gone over to road transport which hadbeen carrying such freight over progressively longerdistances.
Freight traffic carried by both the rail and roadmodes increased almost five times between 1950-51 and1977-78. While in the fifties and the sixties, the rate ofgrowth of freight traffic was nearly twice as much as thatof national income, in the seventies, freight traffic onroad and rail had slowed down, growing at the same
rate as national income. The rate of growth of passengertraffic had, however, been much higher than the growthrate of population and national income. Passengerstravelling in second-class constituted over 95 per centof the total passenger traffic of the Indian Railways.Although in respect of long-distance travel, rail was thecheapest and quickest mode of transport, especially forsecond-class passengers, nevertheless, roadwaysprovided a significantly better service for short-distancetravel.
The NTPC Report observed that, in the seventies,the growth of transport capacity lagged considerablybehind the requirements of the national economy. Therailways came under considerable pressure to meet theburden of transport without commensurate investmentin rolling stock or line haul capacity, resulting inbottlenecks. Unforeseen shifts in the pattern of trafficplaced additional strain on the railway system whichfrom time to time had to also cope with dislocationscaused by floods and other natural calamities. At times,even road transport could not meet the increasing demandfor freight shipments. Although there had been a steadygrowth in the number of commercial vehicles, there was,at times, an acute shortage of trucks.
Since the primary objectives of the NTPC were torecommend an optimal inter-modal mix of differentmodes of transport and to suggest organizational,administrative, fiscal, and legal measures for givingeffect to recommended national transport policy, it dealtextensively with traffic forecasts and the optimalallocation between modes. Estimates were worked outfor a time horizon extending till the end of the twentiethcentury. According to the NTPC’s projections, therailways were expected to carry 468 btkms in the year2000 as against the 155 btkms carried in 1978-79. Themajor part of the projected traffic would be moving overlong distances. Road transport was expected to carry 182btkms of traffic at the end of the twentieth century. Ofthis, nearly 130 btkms would be intra-regional and 52btkms inter-regional. Accordingly, the percentage sharesof rail and road in freight traffic worked out to 72 percent and 28 per cent respectively. The inter-modalallocation was based on calculations of resource costsand took into account the shadow price of scarce inputslike energy. The NTPC took into account an expectedrise in the price of diesel and its consequential impacton break-even levels (i.e., distances of traffic where thecosts of transport across different modes are equalized),
VIKALPA • VOLUME 30 • NO 1 • JANUARY - MARCH 2005 19
19
and assumed a shift to rail of at least 50 per cent of trafficmoving by road beyond these break-even levels.However, the Committee stated that the increase in railshare would not materialize unless appropriateinvestment and pricing policies were pursued to ensurethe suggested modal split. It was of the view that ifminimum resource cost was to be the guiding principlefor determining inter-modal mix, the railways shouldplay a larger role in the nation’s transport system. TheNTPC’s expectations of future modal split in this regardhave not been fulfilled: the modal shares of rail and roadin the total freight traffic carried in 2000-01 were 26 percent and 74 per cent respectively (Ministry of Railways,2002; Ministry of Surface Transport, 2001).
The last major committee to look into thedevelopment of the transport sector as a whole in Indiawas the Steering Committee on Perspective Planning forTransport Development (Planning Commission, 1988).The report of the Committee contains projections oftransport demand based on a study by RITES whichmakes projections of traffic volumes and average leadsfor the years 1994-95 and 1999-2000. Rail freight trafficwas projected at 462 btkms in 1999-2000 with an averagelead of 852 kms. The corresponding road traffic wasprojected at 157 btkms, the average lead being 397 kms.The break-up between rail and road is accordingly inthe ratio 75:25. Assuming that recent trends of transportcoefficients and average leads would continue for thefuture, the Committee projected freight traffic on rail inthe year 2000 at 516 btkms. By the trend growth rateapproach, rail freight traffic was projected at 374 btkms
and road freight traffic at 686 btkms in 1999-2000, givinga modal split of 35:65 between rail and road respectively.For passenger traffic in the same year, the rail volumewas projected at 256 billion passenger kilometres (bpkms)and the road traffic at 2916 bpkms, giving a modal splitof 8:92 between rail and road. While no transportcommittees with such broad objectives as the onesdiscussed here have since been set up, nevertheless,from time to time, the Government of India has constitutedexpert groups to look into the aspects of one or moretransport modes in the country.
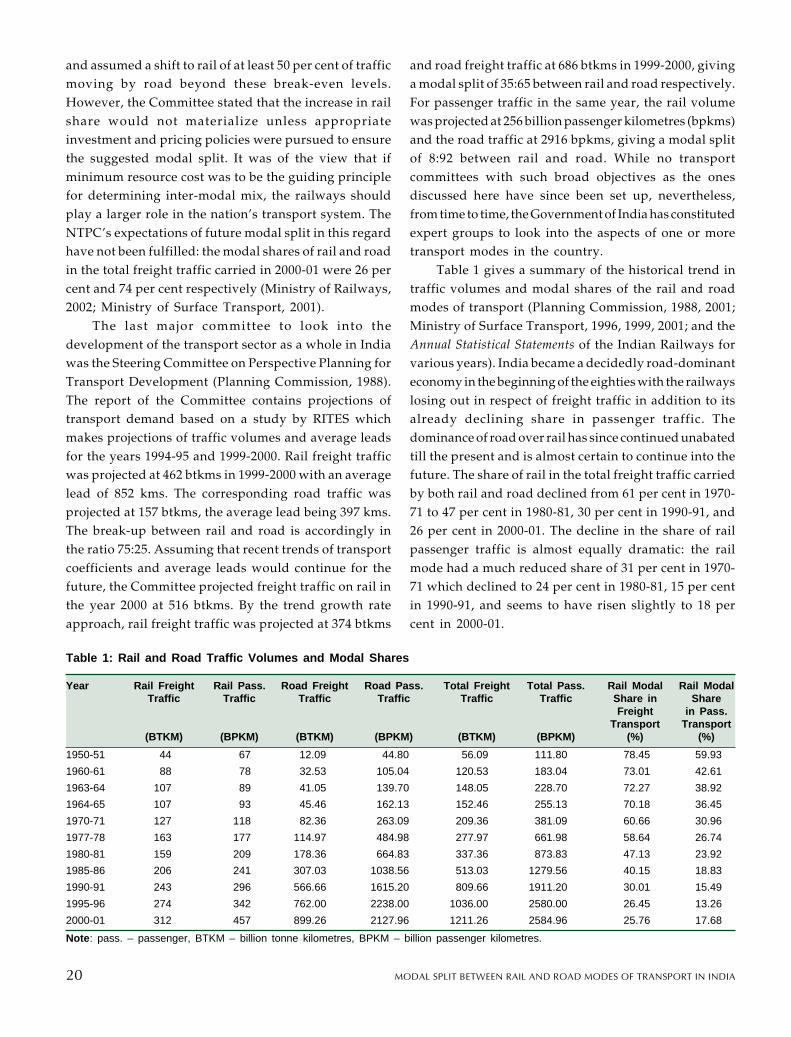
Table 1 gives a summary of the historical trend intraffic volumes and modal shares of the rail and roadmodes of transport (Planning Commission, 1988, 2001;Ministry of Surface Transport, 1996, 1999, 2001; and theAnnual Statistical Statements of the Indian Railways forvarious years). India became a decidedly road-dominanteconomy in the beginning of the eighties with the railwayslosing out in respect of freight traffic in addition to itsalready declining share in passenger traffic. Thedominance of road over rail has since continued unabatedtill the present and is almost certain to continue into thefuture. The share of rail in the total freight traffic carriedby both rail and road declined from 61 per cent in 1970-71 to 47 per cent in 1980-81, 30 per cent in 1990-91, and26 per cent in 2000-01. The decline in the share of railpassenger traffic is almost equally dramatic: the railmode had a much reduced share of 31 per cent in 1970-71 which declined to 24 per cent in 1980-81, 15 per centin 1990-91, and seems to have risen slightly to 18 percent in 2000-01.
Table 1: Rail and Road Traffic Volumes and Modal Shares
Year Rail Freight Rail Pass. Road Freight Road Pass. Total Freight Total Pass. Rail Modal Rail ModalTraffic Traffic Traffic Traffic Traffic Traffic Share in Share
Freight in Pass.Transport Transport
(BTKM) (BPKM) (BTKM) (BPKM) (BTKM) (BPKM) (%) (%)
1950-51 44 67 12.09 44.80 56.09 111.80 78.45 59.93
1960-61 88 78 32.53 105.04 120.53 183.04 73.01 42.61
1963-64 107 89 41.05 139.70 148.05 228.70 72.27 38.92
1964-65 107 93 45.46 162.13 152.46 255.13 70.18 36.45
1970-71 127 118 82.36 263.09 209.36 381.09 60.66 30.96
1977-78 163 177 114.97 484.98 277.97 661.98 58.64 26.74
1980-81 159 209 178.36 664.83 337.36 873.83 47.13 23.92
1985-86 206 241 307.03 1038.56 513.03 1279.56 40.15 18.83
1990-91 243 296 566.66 1615.20 809.66 1911.20 30.01 15.49
1995-96 274 342 762.00 2238.00 1036.00 2580.00 26.45 13.26
2000-01 312 457 899.26 2127.96 1211.26 2584.96 25.76 17.68
Note: pass. – passenger, BTKM – billion tonne kilometres, BPKM – billion passenger kilometres.
20 MODAL SPLIT BETWEEN RAIL AND ROAD MODES OF TRANSPORT IN INDIA
20

During the period 1950-51 to 2000-01, the elasticityof total freight transport carried by road and rail in Indiawith respect to GDP was 1.48 while the same for totalpassenger transport was 1.70. Thus, the total transportoutput in India with respect to both freight and passengerservice has grown faster than the national income. Thetotal freight traffic increased from 56 btkms in 1950-51to 337 btkms in 1980-81 and then to 1,211 btkms in 2000-01, a more than twenty-fold increase since 1950-51. Thetotal passenger traffic grew from 112 bpkms in 1950-51to 874 bpkms in 1980-81 and subsequently to 2,580 bpkmsin 2000-01, a twenty three-fold increase since 1950-51.
Between 1950-51 and 2000-01, the elasticity of railpassenger transport service in India with respect to GDPwas 1.01. Passenger service on rail, therefore, appearsto have kept pace with GDP. From a figure of 67 bpkmsin 1950-51, rail carried 209 bpkms in 1980-81 andsubsequently 457 bpkms in 2000-01, an almost seven-fold increase since 1950-51. Suburban traffic accountedfor about 19.4 per cent of the total bpkms in 2000-01.The elasticity of rail freight transport with respect toGDP turns out to be 0.86. The number of net freight tonnekilometres (revenue-earning) went up from 44 billion in1950-51 to 159 billion in 1980-81 and then to 312 billionin 2000-01, an increase of seven times since the beginning.
All forms of road transport have shown spectacularincrease in volume since independence. Road passengertraffic and road freight traffic grew at annual rates of8.02 per cent and 9 per cent respectively during theperiod 1950-51 to 2000-01. The elasticity of road freighttransport with respect to GDP was 2.15 while for roadpassenger transport, it was 2.00. These elasticities aresubstantially higher than those of rail transport. Thepassenger kilometres of road transport went up from 45billion in 1950-51 to 665 billion in 1980-81 and then to2,128 billion in 2000-01, an almost fifty-fold increasesince the initial period. In terms of net tonne kilometres,freight movement by road transport rose from 12 billionin 1950-51 to 178 billion in 1980-81 and subsequently to899 billion in 2000-01, an increase of seventy-five timessince 1950-51.*
Transport volumes have actually grown to levelsgreater than those predicted in the work of the committeesdescribed above. The pattern of economic developmentwith increasing dispersion of industries and markets,the nature of modern production with requirements of
efficient delivery of factors and products, and, to a certainextent, the spurt in passenger movement on account ofhigher incomes all mean that the demand for transporthas been growing at a faster rate than the growth innational product. These developments have also meanta lower share for the rail mode than predicted in earlierstudies. Road transport has been more flexible than railtransport in adapting to the needs of the economy,specializing in the transport of high-value, non-bulkproducts. There has been spectacular development ofmotorized road transport both for passenger and freightmovement. While the greater share of the road mode intransport demand may be explained by inherentadvantages in terms of accessibility, convenience, anddoor-to-door delivery, factors such as underinvestmentin rolling stock and line haul capacity on the rail mode,along with the lack of a customer-oriented approach,have led to an increasing shift in patronage towards theroad mode.
FACTORS LIKELY TO INFLUENCE MODALCHOICE
A number of variables might be included in a study ofthe factors behind a choice of transport mode. Intuitively,the relative cost of alternative transport modes shouldhave an influence on the decision-maker: the cheapermode ought to be the preferred mode. However, it is notimmediately known which form of the cost variable ismost relevant. Some studies have used the cost ratiobetween alternative modes while others have used thecost difference. Under the difference formulation, theconsumer gives the same amount of consideration tochoosing between a Rs 1.05 and Re 1.00 pair of alternativeas between a Re 0.10 and a Re 0.05 pair. On the otherhand, if the cost ratio between alternative modes is ofimportance, then the first pair of alternatives would haveto be, say, Rs 2.00 and Re 1.00 if the consumer is to beindifferent between this pair and the Re 0.10/Re 0.05pair. Lave (1969) is of the opinion that neither the diffe-rence nor the ratio formulation seems to be absolutelycorrect but that the truth would seem to lie close to theformer.
The variable of relative time of travel of alternativetransport modes also presents the same problem of choiceas that between the difference and the ratio specification.In support of the difference formulation for the relativetime variable, Lave (1969) cites contemporary writingsconcerning the value of time (Becker, 1965; Moses and* Calculated from data in the above sources.
VIKALPA • VOLUME 30 • NO 1 • JANUARY - MARCH 2005 21
21

Williamson, 1965). Once it is assumed that time hasmonetary value, then a time differential can be expressedin currency units, and the relative time and relative costinformation for a given fair of alternatives may becombined into a single relative cost figure to describethe difference between the two modes. Among otherthings, this makes it possible to say that, other thingsbeing equal, the passenger or consignor will choose thatmode which has the lowest combined cost. The mea-surement of the value of time is important because timesavings amount to most of the potential benefit fromimprovements in transport, typically about 80 per cent.
The next important influencing variable on modalchoice is relative comfort and convenience. Lave (1969)argues that deficiency in both comfort and convenienceof public transport in the US had been the most importantfactor in the post-war decline in the patronage of masstransit. However, hardly any study had made an attemptto quantify the comfort variable and use it in a modalsplit model. Ideally, the analyst should have a scale ofsubjective valuations of comfort and a corresponding listof objective characteristics such as seating dimensions,crowding, booking procedure for shipments, etc. It wouldthen be possible to develop on objectively measurableset of indices of comfort.
The above three variables — relative costs, relativetime, and relative comfort — are instrumental variablesin the sense that they could be useful for implementingsome normative goal on the part of the decision-maker.The next important variable is personal income. It is adifficult variable to handle since its influence may befelt in other directions and it may interact in a complexmanner with other variables influencing modal choice.On account of its collinearity with many other variables,a number of aggregate modal split models have derivedthe major part of their explanatory power from the incomevariable alone. If one is analysing the modal choicebetween, say, road and rail in respect of first-classpassenger travel, then the income variable is importantsince rising income levels might help to explain why incertain situations car travel, which is more expensive,is being preferred by the consumer of transport servicesto travel on first-class rail. One may also look upon theincome variable as operating a constraint on choice ofmode. It is reasonable to assume that if incomes fallbelow a certain critical level, then the commuter will notbe able to afford car travel.
Other variables that might be included in a detailed
study of modal split are purpose of trip, family size andcomposition, sex and age of the commuter, and distanceof travel.
GENERATION OF DATASETS
In India, there is no detailed or extensive database onmodal split between transport modes on important routesalong with the costs of transport operations and otherimportant variables such as user perception of travel orshipment on alternative modes. Studies in the past havelooked at the important trends in transport in the countryand sometimes discussed specific modal costs. However,the information contained in these studies does not permitthe construction of a sufficient database for econometricanalysis. On the one hand, the data on modal splits iseither at an aggregate level or confined to a few selectedroutes, and on the other hand, in many cases, the dataon modal splits is not accompanied by correspondingdata on user costs on the part of the passenger or shipper.In addition, there is no time series of modal split andaccompanying factors such as user costs and perceptionsof the quality of service.
For this study, relevant data on modal split betweenrail and road, user costs, and per capita income couldbe obtained either directly or estimated for eightrepresentative sections in the country: New Delhi-MughalSarai, Jalandhar-Jammu, Jabalpur-Allahabad, Lucknow-Gorakhpur, Secunderabad-Wadi, Gudur-Renigunta,Bhopal-Ujjain, and Ratlam-Godhra. In all these sections,the rail and road modes are in competition with eachother, both in passenger and freight traffic, the rail track(whether single-line or double-line) being contiguouswith a national or state highway (mostly two-lane). Thefirst four of the above sections have national highwayswhile the remainder have state highways. Besides, theselected sections vary in respect of terrain and length.The lengths for railways were worked out by lookingat the zonal working time-tables giving distances betweensuccessive stations for the concerned sections. The lengthsof national highways were obtained from the Ministryof Road Transport and Highways (formerly Ministry ofSurface Transport), while for state highways, they werecalculated on the basis of state road maps. The longestection, namely New Delhi-Mughal Sarai, has a rail routelength of 780 kms and a road length of 825 kms, whilethe shortest section, Gudur-Renigunta, has a rail routelength of 83 kms and a road length of 75 kms.
Our objective is to relate the modal split between
22 MODAL SPLIT BETWEEN RAIL AND ROAD MODES OF TRANSPORT IN INDIA
22

rail and road to important explanatory variables suchas relative user costs and per capita income, given thatsuitable data on other factors, such as user perceptionof quality of service on alternative modes, is not available.The main hypothesis of this study is that as the differencebetween road and rail user costs, or the ratio betweenthe two goes up, then, other things being equal, the shareof the rail mode in the total traffic should increase. Inaddition, we wish to bring out the role of measures ofpersonal income in our analysis. Since the road modehas such advantages as greater convenience andaccessibility, the hypothesis to be tested with regard tothe income and consumption expenditure variables isthat as these go up, the share of the rail mode shoulddecline as consumers are enabled to choose the(qualitatively better but probably more expensive) roadmode. These hypotheses are examined under threescenarios of inter-modal competition.
It should be borne in mind that all traffic within ourselected sections, which are a part of the larger network,does not necessarily begin and end at the terminal points.The origin and destination of traffic movements may lieoutside or inside the sections. Thus, a certain sectionaldistance is not a criterion for competition between railand road. However, these traffic volumes are related toexplanatory variables such as user costs within thesections; it seems reasonable to assume that the lattervariables, in so far as they have any influencing power,can explain more or less the pattern of traffic movingwithin the selected sections. The role of network effects,therefore, may not be fully captured in the user costestimates derived for the current analysis, especially inso far as the component of operating cost reflected inthe fares and charges paid to the transport operator isconcerned.
We shall now describe how time-series data on eachof the variables is constructed.
Traffic Volumes
The time series of traffic volumes relating to bothpassenger and freight transport for both the rail and roadmodes were first derived in each of the selected sections.Table 2 summarizes the steps in the generation of dataon traffic volumes for each case of competition betweenrail and road. We have looked at three cases of inter-modal competition: (i) between car on road and first-class/air-conditioned (AC) travel on rail (such categoriesas AC chair and AC sleeper classes being included in
the latter); (ii) between bus on road and second-class/sleeper-class travel on rail; and (iii) between freightservices on rail and road. On the basis of the datacontained in the given sources, calculated growth ratesand assumptions and estimates of the average dailynumbers of cars, buses, and trucks in each of the selectedroad sections were first made for the period 1986-87 to2000-01, and then the passenger kilometres and net tonnekilometres represented by these vehicle numbers wereworked out.
In the case of rail traffic volumes, the total dailypassenger kilometres (pkms) for a particular sectionwere calculated for the year 1998-99 by multiplying theoccupancy of each train1 by the lead and frequency, andthen summing up across all passenger trains. For theyears before and after 1998-99, the rates of change ofpassenger kilometres for the previous and successiveyears for the regional railways covering the selectedsection of interest were used to estimate the daily pkmsof rail traffic. The following classes of rail passengertravel were taken to be in competition with travel by car:general air-conditioned, general first-class, air-conditioned chair, air-conditioned first class, air-conditioned sleeper, air-conditioned three tier, first-classrail, and first-class ordinary classes. The classes of railtravel that are taken to be competitive with travel bybus on road are second-class mail, second-class ordinary,sleeper-class mail, and ordinary sleeper classes. Comingto the derivation of freight transport volumes on rail,we made use of the statements of line capacity utilizationin 1998-99 and the tonnage of a four-wheeler wagon toarrive at daily net tonne kilometres (ntkms) for a particularsection in 1998-99. Rates of change of ntkms werecalculated on the basis of data in the Annual StatisticalStatements in order to derive the ntkms of other yearsfor the particular section.
User Costs
Our next objective is to estimate the user costs of travelor shipment on each of the rail and road modes for theperiod in order later to analyse the relationship, if any,between cost differentials or cost ratios between themodes and the share of traffic of one mode in total traffic.The total user cost for transport service consists of anumber of components. There is, first, the financialpayment to the supplier (which may depend on tax andsubsidy elements). This payment is reflected in bus fares,train fares, and shipment rates. Apart from this basic
VIKALPA • VOLUME 30 • NO 1 • JANUARY - MARCH 2005 23
23

payment, the user of transport service has to incur costsfor services other than those provided by the transportsupplier. This category of cost includes the following:(i) cost of porterage and local transport (in the case ofpassenger service), and (ii) cost of packing, handling,and local cartage (in the case of freight service). The costof porterage and local transport is relevant in the casesof travel by bus on road and travel or shipment by rail.The cost of packing, handling, and local cartage is incurredwhen the shipper avails of freight service on either therail or road mode. A special category of costs in the caseof freight service comprises illegal rental payments orunofficial fees that are charged to the user by variousparties directly or indirectly connected with the provisionof transport service.
Besides these categories of costs, the passenger orshipper incurs special costs that are not reflected intransactions with other parties. When a passenger istravelling, a value is attached to the time he or she spendsin transit, depending upon the opportunity cost of travel.This opportunity cost is the loss in earnings which isreflected in the hourly wage rate. The value of passenger
time (VOPT) is included as a component of the total usercost of passenger travel. Similarly, when a shipperundertakes to avail of freight service by a particularmode, he or she incurs a special cost while the commodityis in transit. This is again an opportunity cost which ismeasured by the interest the shipper would earn on thetotal value of the shipped commodity. The opportunitycost of freight shipment is termed the cost of commodityin transit and is a component of the total user cost offreight shipment.
The total user cost, therefore, includes the financialcost of transport service charged by the supplier, coststhat are incurred apart from the payment to the supplier,and opportunity costs. The three cases of competitionand the categories of user cost applicable to each caseare presented in Table 3.
We now discuss the derivation of the componentsof user cost for each of the three cases of inter-modalcompetition. Exhibit 1 illustrates the different steps inthe generation of data on user costs for both modes. Inthe case of road transport, the manual of the IndianRoads Congress (IRC) provided the means of making
Table 2: Generation of Data on Traffic Volumes
Nature of Inter- Variable Sources of Data Assumptions Values Obtainedmodal Competition
Car on road vs Road passenger Road surveys, discussions, Car occupancy Time-series from 1987-88first-class/AC traffic volume motor transport statistics, factor = 4 to 1999-2000travel on rail statistics of the ASRTU
Rail passenger H.Q. of zonal railways of Average daily occupancy – do –traffic volume interest for the year 1998-99, of train for intercity
Indian Railways’ ASST for travel = 80% of statedother years carrying capacity
Bus on road vs Road passenger Same as for the road traffic Bus occupancy Time-series from 1986-87second-class/sleeper- traffic volume volume in the previous factor = 40 to 1999-2000class travel on rail scenario of competition
Rail passenger Same as for the rail traffic Average daily occupancy – do –traffic volume volume in the previous of train as above
scenario of competition
Freight shipment by Road freight Road surveys, discussions, Proportion of LCVs = 15%, Time-series from 1986-87road vs freight traffic volume motor transport statistics, proportion of MAVs = 10% in to 1999-2000shipment by rail road user cost study north India and 8% in south
India, LCV payload = 5 tonnes,HCV payload = 9 tonnes, MAVAv. comp. payload = 18 tonnes,load factor for LCV, HCV andMAV = 100%, 100% and 90%respectively on NH, and 90%,90% and 80% on SH, 20%empty trucks on NH and 30%empties on SH
Rail freight Line capacity utilization Payload of four-wheeler – do –traffic volume statements for 1998-99, Indian wagon = 24 tonnes
Railways’ ASST for other years
Notes: ASRTU – Association of State Road Transport Undertakings, H.Q. – headquarters, ASST – Annual Statistical Statements, LCV –light commercial vehicle, MAV – multi-axle vehicle, HCV – heavy commercial vehicle, Av. Comp. – average composite, NH – nationalhighways, SH – state highways; the reference for the road user cost study is Ministry of Surface Transport/CES (1989).
24 MODAL SPLIT BETWEEN RAIL AND ROAD MODES OF TRANSPORT IN INDIA
24

estimates of road operating cost for all types of vehiclesin different types of terrain, road surface, and trafficcongestion (Indian Roads Congress, 1993). The datacontained in the manual was based on a road user coststudy of 1982 and further results were obtained in theStudy for Updating Road User Cost Data (Kadiyali andAssociates, 1992). Adjusting the data for congestion andmaking use of assumptions relating to the compositionof traffic, we have derived the estimated costs of travelby car per passenger kilometre incorporating both thehigher cost of travel by taxi and VOPT.2
In respect of the rail mode, the Annual StatisticalStatements were used to derive estimates of the averagerail fares per passenger kilometre for the air-conditionedand first classes during the period of interest in all theselected eight rail sections. The estimates were thenexpressed in 1997-98 prices by use of the GDP deflator.The costs of porterage and local transport for passengertravel by rail, as given in Planning Commission/RITES(1987-88), were adjusted for inflation to express them interms of prices of the year 1997-98. The same source wasused to estimate VOPT on rail. The sum of rail fare, costsof porterage, local transport, and VOPT on rail gives usthe total user cost per passenger kilometre for travel byfirst-class/air-conditioned rail classes in each of ourselected horizons across the given time period.
The average fares per passenger kilometre for travelby bus were estimated by making use of the performancestatistics of public bus companies published by theAssociation of State Road Transport Undertakings(ASRTU). As we are concerned with intercity traffic, inmaking these estimates, we have excluded the datarelating to operations in metropolitan areas. The cost ofporterage and local transport for bus travel was takenfrom the same source as mentioned above for rail travel.The VOPT pertaining to travel by bus was next worked
out by using the data in the IRC manual which allowedus to estimate different values of VOPT in differentconditions of traffic density.
To estimate the corresponding user costs of travelby rail, the Annual Statistical Statements of the IndianRailways were used for the period under considerationand the average rail fare per passenger kilometre wasworked out. To these estimates of rail fares, the cost ofporterage and local transport and the values of passengertime per passenger kilometre (as worked out earlier)were added to arrive at the total user costs of travel insecond-class/sleeper-class on rail.
To estimate the road freight bill, we first estimatedthe costs of operation of trucks per net tonne kilometrein the same way as was done for car in the first scenarioof inter-modal competition. Applying a mark-up to theseoperating costs, estimates of freight bills paid by theshipper on road were derived. An average cost of packing,handling, and local cartage for road shipment was workedout by taking seven principal commodities for whichdata was available for both road and rail. Other expensesincurred en route on the part of the truck operator includedcheck-post expenses, charges paid to transport officialsand the police, loading and unloading charges and others.Using information in the report of the Steering Committeeon Trucking Operations in India, we worked out theunofficial expenses of freight shipment on road per tonnekilometre and applied them to each of our selectedsections in accordance with geographical proximity. Anaverage cost of commodity in transit on road was workedout by making use of the VOC tables referred to earlierduly adjusted for congestion as reflected in the prevailingdensity of traffic.
In the case of rail mode, rail freight rates wereestimated by using data on earnings from revenue-earning freight traffic in the Annual Statistical Statements.
Table 3: Cases of Inter-modal Competition and Components of Rail and Road User Costs Considered in the CurrentStudy
Nature of Inter-modal Fare/Charge Cost of Cost of Packing, Unofficial Fees/ Value of Cost ofCompetition Paid to Supplier of Porterage and Handling, and Illegal Rents Passenger Commodity
Transport Service Local Transport Local Cartage Time in Transit
Car on road vsfirst-class/AC travel on rail XX X* XX
Bus on road vs second-class/sleeper-class travel on rail XX XX XX
Freight shipment by road vsfreight shipment by rail XX XX XX XX
* This component of user cost is included in the case of travel by air.X – User cost is included in the user cost of only one mode.XX – Particular category of user cost is included in total user cost for both the modes.
VIKALPA • VOLUME 30 • NO 1 • JANUARY - MARCH 2005 25
25

An average cost of packing, handling, and local cartagewas next worked out by taking into account the sameimportant commodities as in the case of road mode. Thenext item of user cost for freight shipment by railconsidered in our analysis was the cost of extra-officialfees and charges relating to documentation, claimssettlement, etc. Data on commissions and extra-officialfees in the Indian Railways was difficult to obtain. Inworking out the value of illegal rental payments in Indiafor 1964, Krueger reproduces data of a study done in1966 in which some information is given on this subject(Krueger, 1974). For this study, the data was adjustedin line with inflation, increasing corruption, documen-tation, and other charges unique to the railways to arriveat a figure representing the sum of extra-official fees andother charges to be paid by the user of rail freight service.Finally, the cost of commodity in transit for rail shipmentwas derived by using data for the seven specificcommodities mentioned earlier.
Measures of Income/Expenditure
The next important explanatory variable that we includedin our datasets was per capita income. Unfortunately,the available data did not permit us to construct a timeseries of personal income for each of the scenarios ofcompetition in the sections selected for this study.Accordingly, we had to devise some proxy measures ofthis variable. In the case of two of the scenarios ofcompetition—between sleeper-class/second-class railand bus and between rail and road freight service — weused the series on gross state domestic product (GSDP)published by the Central Statistical Organization andpopulation figures of each state to work out values ofper capita GSDP for each of the selected sections in allthe years considered. The per capita GSDP values thusderived served as proxies for the income variable in ouranalysis of the two scenarios of competition mentionedabove.
While considering the competition between air-conditioned, first-class rail, and car, we need to haveestimates of income of the upper-income bracket of thepopulation who are most likely to use these transportservices. For this particular case of competition, weestimated the levels of minimum consumption expen-diture of the richest 10 per cent of households in eachof the states covering our selected sections. For the periodcovered by this study, there are three quinquennialsurveys of consumer expenditure published by the
National Sample Survey Organization (NSSO): 1987-88,1993-94, and 1999-2000 (termed the 43rd, 50th and 55throunds respectively). In each of these surveys, we havelooked at the distribution of a thousand sampledhouseholds in the urban sector of each concerned stateover classes of monthly per capita consumer expenditure(MPCE). A lognormal distribution was fitted to the givendata in order to make estimates of consumptionexpenditure of the richest 10 per cent of the population.Given these estimates of upper-level consumptionexpenditure in the years 1987-88, 1993-94, and 1999-2000, the values for the intervening years were filled inby looking at the changes in the ratio of estimatedconsumption expenditure to the per capita GSDP. It wasassumed that the ratio would change according to ageometric progression.
We thus constructed three datasets in which wereincluded relative traffic volumes of the rail mode (or theratios of rail to road traffic volumes), user cost differences,user cost ratios, per capita GSDP, and upper income levelconsumption expenditures. Our next task is to analysewhether there are any statistically significant relation-ships between the share of rail and the explanatoryvariables.
THE MODEL
We have taken the relative traffic volume of rail (the ratioof the rail traffic volume to the road volume) as thedependent variable while the independent variables(depending on the particular case of inter-modalcompetition) include: (i) the difference between the usercost on road and the same on rail, (ii) the ratio of theuser cost on road to the same on rail, (iii) per capitamonthly consumption expenditure of the upper-incomeclass, and (iv) per capita yearly gross state domesticproduct. The inclusion of more variables in our analysiscould have resulted in a greater probability of findingsignificant relationships under the options of variouseconometric models. However, because of paucity ofdata, we had to limit ourselves to the above explanatoryvariables in explaining modal spilt between rail androad. The restricted nature of the choice of explanatoryvariables may influence the nature of the model in whichstatistically significant relationships are ultimatelyderived.
The econometric analysis of the trends in traffic inall the three cases of competition was carried out withthe help of Stata 6.0. The datasets were arranged in
26 MODAL SPLIT BETWEEN RAIL AND ROAD MODES OF TRANSPORT IN INDIA
26

panels, each of which is composed of the data of aparticular transport section from 1986-87/1987-88 to 1999-2000. Heteroscedasticity was detected in the data in allthe three cases. The datasets were, therefore, analysedunder generalized least squares (GLS) regressioninvolving both random effects and fixed effects. In allthe datasets, the Hausman test did not indicate anysystematic differences in coefficients between the twomodels. The coefficients of the explanatory variablesturned out to be insignificant at the 10 per cent level inmost cases. Subsequently, cross-sectional time-seriesfeasible generalized least squares (FGLS) was carried outon the datasets. The models tested were: (i) generalizedleast squares with heteroscedastic panels, (ii) GLS withheteroscedastic panels and within-panel correlation inthe form of a common AR(1) coefficient for all panels,(iii) GLS with heteroscedastic panels and panel-specificAR(1) correlation. The model that finally yieldedstatistically significant relationships was found to be thecross-sectional time-series FGLS model involvingheteroscedastic panels with cross-sectional correlationand panel-specific AR(1) correlation. This model isdescribed in the Appendix.
RESULTS AND INTERPRETATION
The econometric exercise was aimed at seeing whetherthere is change in the relative traffic volume of rail inrelation to the user cost difference or ratio between roadand rail and measures of personal income and expen-diture. The share of rail was expected to rise with increasein the values of the cost variables as the least expensivemode is preferred. Conversely, it was expected to fallwith increase in income or expenditure since customersand shippers were likely to favour the road mode withits attendant qualitative advantages.
It should be mentioned that the effects of a changein the inter-modal user cost difference (user cost ratio)cannot be isolated from the accompanying change in theinter-modal cost ratio (cost difference). Furthermore, ifone of the variables changes, the other need not changein a fixed manner. Hence, the statistical relationshipsthat we have been able to establish are conditional onthe structure of changes, in the given datasets, in onecost variable and accompanying movements in the other.
The main results are presented in Table 4. Whilesectional and year dummy variables are included in theanalysis, we concentrate on the impact of the mainexplanatory variables of cost and income on the relativetraffic volume of rail.3
Passenger Transport
In the case of inter-modal competition involving car onroad and first-class/air-conditioned rail, we find thatlinear relationships hold between relative traffic volumeon the one hand and user cost difference/ratio andconsumption expenditure on the other. The elasticity ofthe relative traffic volume of rail with respect to usercost difference between road and rail is only 0.022.However, a 10 per cent rise in monthly per capitaconsumption expenditure leads to a 9.9 per cent decreasein the relative traffic volume, with the cost differencevariable being held constant. Coming next to the effectof the cost ratio between road and rail, we find that theelasticity of relative traffic volume of rail with respectto user cost ratio is 0.53. If the cost ratio is unchanged,a 10 per cent increase in consumption expenditure leadsto a 11.6 per cent fall in the relative traffic volume.
Equiproportional increases in the cost differenceand cost ratio variables, therefore, lead to a greaterupward impact on the relative traffic volume in the caseof the latter than for the former variable. The relationship
Table 4: Cross-sectional Time-series FGLS Regressionsof Relative Traffic Volume of Rail on Cost andOther Variables
Form of Equation Explanatory EstimatedVariables Coefficient
Passenger transport: Competition between car on road and first-class/air-conditioned railLog-linear Cost difference 0.022
Consumption expenditure -0.985Log-linear Cost ratio 0.533
Consumption expenditure -1.157
Passenger transport: Competition between bus on road andsecond-class/sleeper-class railLinear Cost difference 0.162Linear Cost ratio 0.171Cubic Cost difference 0.475
Cost difference squared -1.088Cost difference cubed 1.009
Cubic Cost ratio 7.399Cost ratio squared -5.501Cost ratio cubed 1.386
Freight transport: Competition in freight traffic between road andrailLog-linear Cost difference -1.253
Per capita SDP -0.352Log-linear Cost ratio -0.88
Per capita SDP -0.351Quadratic Cost difference 9.438
Cost difference squared -3.697Per capita SDP -0.0002
Note: All the coefficients are significant at 5 per cent level.
VIKALPA • VOLUME 30 • NO 1 • JANUARY - MARCH 2005 27
27

between consumption expenditure and relative trafficvolume suggests that as incomes rise for the upper-income bracket of the population, there is a tendencyto switch over to the more expensive car mode affordinggreater comfort and convenience.
Next we turn to the case of competition between buson road and second-class/sleeper-class travel on rail.The results of the cross-sectional time-series FGLSregression of relative traffic volume of rail on costvariables and per capita state domestic product (SDP)yielded coefficients of the SDP variable that suggestedthe lack of a statistically significant impact of this factoron relative traffic volume. Inter-modal competition withbus on road does not seem to be influenced by the incomefactor, which in this study is represented by per capitaGSDP. Hence, only the cost factors were used in thesubsequent analysis. For the vast majority of the travellingpopulation, user cost differentials or ratios appear to bea more important factor in determining modal choice.Taking the cost difference between rail and road first,we find that linear regression yields a relationship inwhich a unit increase in this variable is related to anincrease in the relative traffic volume of rail by an amount0.162. If we come to the cost ratio, a unit rise in thisvariable leads to an increase in the traffic volume by anamount 0.171. Since the semi-log and log transformationsof the regression yielded insignificant coefficients, wedecided to examine the results of non-linear regressionof relative traffic volume on either of the cost variables.Quadratic regression yielded statistically insignificantcoefficients in both the cost difference and cost variablecases. However, regression using a cubic form yieldedstatistically significant coefficients in both cases. For auniform change in cost difference or the cost ratio betweenroad and rail, the relative traffic volume of rail increasesin a fluctuating manner with declining percentageincreases for an initial range of cost difference or costratio values and increasing rates of increase for sub-sequent values.
Ignoring the coefficients of the sectional and yeardummies, we have used, as an illustrative case, the equa-tion of the cubic regression of relative traffic volume ofrail on the cost difference between road and rail toexamine the behaviour of the latter if the value of thecost variable is increased uniformly in the range givenby the dataset of this scenario of inter-modal competition(Table 5).
For a uniform change in the cost difference between
road and rail, the relative traffic volume of rail increasesin a fluctuating manner with declining percentage in-creases between the cost difference values 0.01 and 0.37,and thereafter increasing rates of increase for thesubsequent values. The same behaviour is exhibited inthe case of the cost ratio variable. Given the structureof cost differences and ratios in the given dataset, wheneither the user cost difference or cost ratio between roadand rail rises to certain critical levels, the modal shareof rail (as indicated by the relative traffic volume), whichhas been rising at a diminishing rate, begins to increasein an exponential manner.
Freight Transport
We finally come to the analysis of competition in freighttransport between the two modes. Linear regressionunder the cross-sectional time-series FGLS model wasvariables carried out separately for cost difference andcost ratio variables. The elasticity of relative traffic volumeof rail with respect to user cost difference is -1.25, whilethe same with respect to user cost ratio is -0.88. Themodal share of rail does not go up with increase in theuser cost difference or cost ratio between road and railunlike the earlier cases of competition in passenger traffic.The elasticity of the traffic volume with respect to percapita SDP is about -0.35 in both cost difference and costratio relationships. It is per capita SDP, therefore, that
Table 5: Inter-modal Cost Difference and Relative TrafficVolume (competition between bus and rail)
Cost Difference Relative Percentage Increasebetween Road and Traffic Volume of Volume withRail (Re) of Rail* Respect to Previous
Value
0.01 0.749 -
0.05 0.765 2.200.09 0.779 1.760.13 0.789 1.400.17 0.798 1.100.21 0.805 0.860.25 0.810 0.670.29 0.815 0.530.33 0.818 0.450.37 0.822 0.410.41 0.825 0.420.45 0.829 0.480.49 0.834 0.590.53 0.840 0.730.57 0.848 0.930.61 0.858 1.160.65 0.870 1.430.69 0.885 1.73
* The ratio of rail volume to road volume.
28 MODAL SPLIT BETWEEN RAIL AND ROAD MODES OF TRANSPORT IN INDIA
28

appears to influence modal split in the expected manner,suggesting that users of rail switch to the road mode asincomes rise, the latter offering a range of facilities whichthe rail mode cannot provide. A quadratic regressionyields statistically significant coefficients for the costdifference variable and insignificant coefficients for thecost ratio variable. We used the quadratic relationshipbetween traffic volume, cost difference, and per capitaSDP to examine how relative traffic volume of rail varieswith uniform increase in the values of cost differencein the range given by the dataset, while per capita yearlySDP is fixed at an average level (Rs 11,500) and thecoefficients of the section and year dummies in theequation are ignored (Table 6).
The table shows that the modal share of rail increasesat a diminishing rate when the cost difference betweenroad and rail is increased from 1 to 1.28. Beyond thispoint, however, the modal share declines continuouslyat an increasing rate. We may surmise that the cost factoris not very helpful in explaining modal split in the caseof competition in freight service. Qualitative factors seemto play a more important part. It is probable that increasesin the user cost for shipment by road are accompaniedby a rise in the perceived quality of service promptingusers to switch over to this mode.
It may be noted that generally, the relationship,where it exists, between the cost variable and modal
share is a weak one. Our datasets show that the usercost difference between road and rail (as well as the usercost ratio) for both passenger and freight competitionhas moved upward although with significant fluctua-tions. The results on the competition between car on roadand first-class/AC travel on rail implies that if this trendcontinues into the future, there will be an increasingshare of the rail mode that will, however, be counter-balanced by a movement towards road as personalincomes go up.
The relevant dataset shows that the rail share hasindeed been rising for this set of competition. For thecompetition between bus on road and second-class/sleeper-class travel on rail, the concerned dataset showsa declining share of rail although with significant fluc-tuation from year to year. Our results indicate a weakrelationship between these fluctuations and movementsin the user cost variable, other factors influencing modalsplit not being taken into account. The national trendof increasingly lower modal share of rail in passengertransport is almost certain to continue on account ofthese other factors, chief among them probably beingdeterminants of the quality of service such as availabilityand comfort. Finally, as far as competition in freighttransport is concerned, we have seen that increasingdifferentials in user costs do not explain modal splitwhile future rise in incomes can only mean a lower shareof the rail mode.
Some idea on future aggregate modal splits in Indiamay be obtained from recent studies (Expert Group onIndian Railways, 2001; Ministry of Surface Transport,2001). As far as passenger traffic is concerned, modalshares of rail and road are expected to be 14 per centand 86 per cent respectively in 2005-06 under theassumption of unchanged structure of rail fares. Theseshares are expected to change slightly in favour of roadif there is adjustment in upper- and second-class railfares. The modal shares of rail and road in freight trafficare projected at 21 per cent and 79 per cent for 2015-16 under the assumption of uniform growth rate in trafficof all commodities on rail. With the assumption ofcommodity-specific growth rates, this rail share isexpected to go down slightly.
CONCLUSION
In the light of these results, it may be stated that effortsat reduction of high tariffs for shipment by rail shouldbe accompanied by improvements in the quality of
Table 6: Inter-modal Cost Difference and Relative TrafficVolume (inter-modal competition in freightservice)
Cost Difference Relative Traffic Percentage Change ofbetween Road Volume of Rail Volume with Respectand Rail to Previous Value
1.00 3.324 -1.04 3.400 2.281.08 3.464 1.881.12 3.517 1.511.16 3.557 1.151.20 3.586 0.801.24 3.602 0.471.28 3.607 0.141.32 3.600 -0.191.36 3.582 -0.521.40 3.551 -0.851.44 3.509 -1.191.48 3.454 -1.551.52 3.388 -1.911.56 3.310 -2.301.60 3.221 -2.711.64 3.119 -3.151.68 3.006 -3.641.72 2.880 -4.171.76 2.743 -4.761.80 2.594 -5.43
VIKALPA • VOLUME 30 • NO 1 • JANUARY - MARCH 2005 29
29

service. Shippers’ perception of the quality of service isinfluenced by factors such as connectivity, availability,reliability, transit time, ease of payment, negotiability,adaptability, product suitability for mode, claim-processing time, access to decision-makers, suitabilityof price, customer-friendly attitude, and customer infor-mation. For all these parameters, a survey among shippersin India found that the rail mode is ranked significantlylower than the road mode (A F Ferguson & Co., 1999).
The issue of quality of service is crucial in the segmentof freight transport more so because it is one area inwhich the railways seem to have a greater environmentaland financial advantage over roadways than in passengertransport (Dey Chaudhury, 2003). It is, therefore, impera-tive that the task of redressing the current distortion infreight modal shares be addressed on the part of thepolicy-maker in the interest of bringing about a sociallydesirable modal split. While our analysis shows that usercost factors appear to play a negligible role, attentionshould nevertheless be given to ways of internalizingthe external costs of freight transport so that each modeof transport is made to bear the social costs of transport.In particular, heavy goods vehicles on road that causedamage to the pavement should be made to defray thecost of road repair and maintenance.
Much of the profit generated by the railways infreight movement goes towards the subsidization ofpassenger transport. Because of social commitment, thereis little scope for increase in passenger fares. If theobjective is to divert passenger traffic from road, thenmeasures aimed at the internalization of the externalcosts of transport, which studies show are generallylower for rail, need to be considered. Road users shouldbe made to pay for the cost of infrastructure provision
and maintenance through toll charges. The pricing oftransport services should take into account the costs ofsuch factors as pollution and congestion. The externalcosts of accident need to be covered through compulsorysubscription to an insurance regime. An appropriatelegal and supervisory framework should be put in placeto facilitate the settlement of claims. Again, as in the caseof freight transport, improvement in the quality of serviceon rail must not be neglected. Since supply has oftenlagged behind demand, enhancement of capacity inpassenger services on rail is all the more important inany policy initiative aimed at attracting customers fromthe road mode.
The issue of modal choice in transport should begiven more prominence by policy-makers and analysts.The loss of rail dominance to road in India is in line withthe experience of many countries, but has not occupiedthe central position in policy discussions on the transportsector (World Bank, 1995). While the present study yieldssome general, preliminary results, more detailed exercisesneed to be carried out in order to understand better thefactors behind modal choice. Studies concentrating onmodal split in important transport sections would bringout the section-specific role played by various factorsand possibly help to establish critical fare and tarifflevels.
While rail and road are the principal modes oftransport in the country and the competition betweenthe two is of clear relevance to policy-makers, it shouldbe remembered that waterways and pipelines have asignificant share in freight movement. Hence, studies onmodal choice should also take into account these othermodes and examine their relation to the rail and roadmodes.
ENDNOTES1. In the discussions with railway officials, it was suggested
that the average daily occupancy of trains for intercitytravel could be assumed to be 80 per cent of the statedcarrying capacity.
2. The VOPT for travel on road varies with the level ofcongestion whereas for rail it is fixed. This may be
justified on the ground that the speed of intercity transitby rail has not varied significantly over the period.
3. The coefficients of the sectional and year dummiesindicate that spatial and temporal effects are in somecases significant across all the scenarios of competitionstudied.
30 MODAL SPLIT BETWEEN RAIL AND ROAD MODES OF TRANSPORT IN INDIA
30
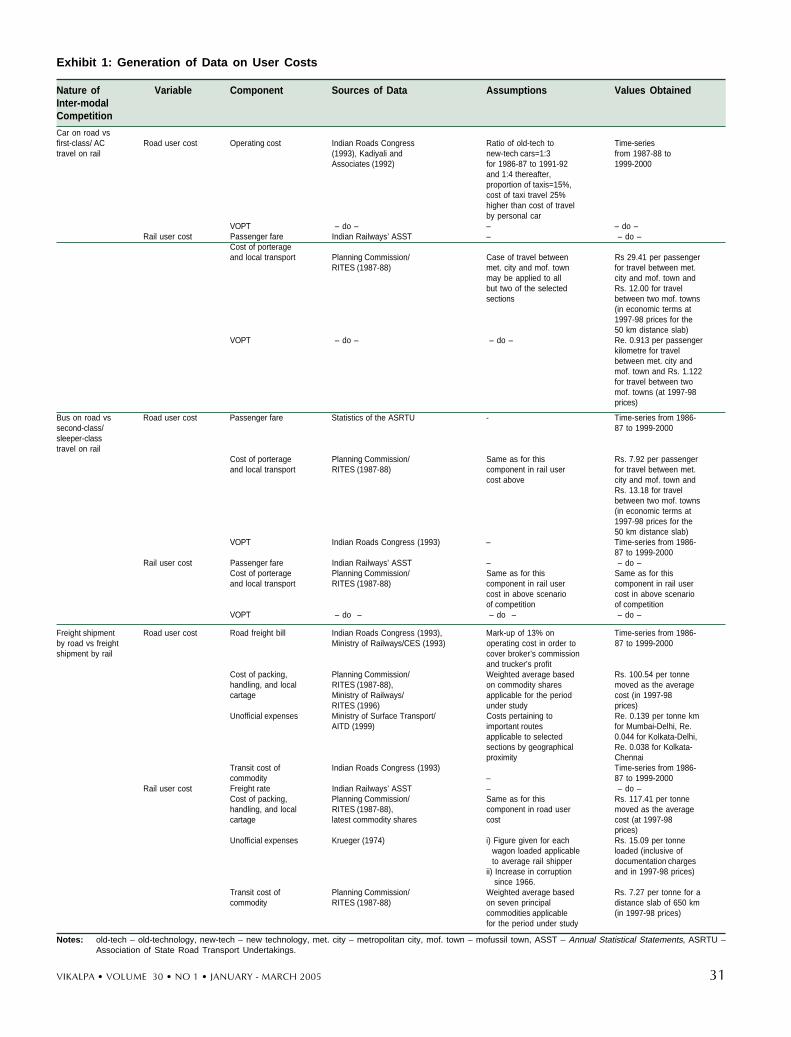
Exhibit 1: Generation of Data on User Costs
Nature of Variable Component Sources of Data Assumptions Values ObtainedInter-modalCompetition
Car on road vsfirst-class/ AC Road user cost Operating cost Indian Roads Congress Ratio of old-tech to Time-seriestravel on rail (1993), Kadiyali and new-tech cars=1:3 from 1987-88 to
Associates (1992) for 1986-87 to 1991-92 1999-2000and 1:4 thereafter,proportion of taxis=15%,cost of taxi travel 25%higher than cost of travelby personal car
VOPT – do – – – do –Rail user cost Passenger fare Indian Railways’ ASST – – do –
Cost of porterageand local transport Planning Commission/ Case of travel between Rs 29.41 per passenger
RITES (1987-88) met. city and mof. town for travel between met.may be applied to all city and mof. town andbut two of the selected Rs. 12.00 for travelsections between two mof. towns
(in economic terms at1997-98 prices for the50 km distance slab)
VOPT – do – – do – Re. 0.913 per passengerkilometre for travelbetween met. city andmof. town and Rs. 1.122for travel between twomof. towns (at 1997-98prices)
Bus on road vs Road user cost Passenger fare Statistics of the ASRTU - Time-series from 1986-second-class/ 87 to 1999-2000sleeper-classtravel on rail
Cost of porterage Planning Commission/ Same as for this Rs. 7.92 per passengerand local transport RITES (1987-88) component in rail user for travel between met.
cost above city and mof. town andRs. 13.18 for travelbetween two mof. towns(in economic terms at1997-98 prices for the50 km distance slab)
VOPT Indian Roads Congress (1993) – Time-series from 1986-87 to 1999-2000
Rail user cost Passenger fare Indian Railways’ ASST – – do –Cost of porterage Planning Commission/ Same as for this Same as for thisand local transport RITES (1987-88) component in rail user component in rail user
cost in above scenario cost in above scenarioof competition of competition
VOPT – do – – do – – do –
Freight shipment Road user cost Road freight bill Indian Roads Congress (1993), Mark-up of 13% on Time-series from 1986-by road vs freight Ministry of Railways/CES (1993) operating cost in order to 87 to 1999-2000shipment by rail cover broker’s commission
and trucker’s profitCost of packing, Planning Commission/ Weighted average based Rs. 100.54 per tonnehandling, and local RITES (1987-88), on commodity shares moved as the averagecartage Ministry of Railways/ applicable for the period cost (in 1997-98
RITES (1996) under study prices)Unofficial expenses Ministry of Surface Transport/ Costs pertaining to Re. 0.139 per tonne km
AITD (1999) important routes for Mumbai-Delhi, Re.applicable to selected 0.044 for Kolkata-Delhi,sections by geographical Re. 0.038 for Kolkata-proximity Chennai
Transit cost of Indian Roads Congress (1993) Time-series from 1986-commodity – 87 to 1999-2000
Rail user cost Freight rate Indian Railways’ ASST – – do –Cost of packing, Planning Commission/ Same as for this Rs. 117.41 per tonnehandling, and local RITES (1987-88), component in road user moved as the averagecartage latest commodity shares cost cost (at 1997-98
prices)Unofficial expenses Krueger (1974) i) Figure given for each Rs. 15.09 per tonne
wagon loaded applicable loaded (inclusive of to average rail shipper documentation chargesii) Increase in corruption and in 1997-98 prices) since 1966.
Transit cost of Planning Commission/ Weighted average based Rs. 7.27 per tonne for acommodity RITES (1987-88) on seven principal distance slab of 650 km
commodities applicable (in 1997-98 prices)for the period under study
Notes: old-tech – old-technology, new-tech – new technology, met. city – metropolitan city, mof. town – mofussil town, ASST – Annual Statistical Statements, ASRTU –Association of State Road Transport Undertakings.
VIKALPA • VOLUME 30 • NO 1 • JANUARY - MARCH 2005 31
31


REFERENCESA F Ferguson & Co. (1999). Final Report on All-India Shipper
Survey, New Delhi.
Becker, G S (1965). “A Theory of the Allocation of Time,”Economic Journal, 75(299), 493-517.
Button, K J (1993). Transport, the Environment and EconomicPolicy, Aldershot, UK: Edward Elgar.
Dey Chaudhury, P (2003). “Environmental Sustainabilityof Transport: Issues in the Case of Rail and Road,” un-published Ph.D. thesis, Centre for Economic Studiesand Planning, New Delhi: Jawaharlal Nehru University.Expert Group on Indian Railways (2001). Policy Imperatives
for Reinvention and Growth: The Indian Railways Report,New Delhi.
Government of Australia (1994). Victorian TransportExternalities Study: Volume I, Environment ProtectionAuthority, Bureau of Transport and CommunicationsEconomics.
Government of Australia (1995). Greenhouse Gas Emissionsfrom Australian Transport: Long-term Projections, Report88 , Bureau of Transport and CommunicationsEconomics.
Government of Australia (1996). Transport and Greenhouse:Cost and Options for Reducing Emissions, Report 94, Bureauof Transport and Communications Economics.
Government of New Zealand (1996). Land Transport PricingStudy: Safety Externalities, Discussion Paper, Ministry ofTransport.
Greene, William H (2000). Econometric Analysis, New Jersey:Prentice Hall International, Inc.
Indian Roads Congress (1993). Manual on Economic Evaluationof Highway Projects in India, First Revision, New Delhi.
Kadiyali, L R and Associates (1992). Study for Updating RoadUser Cost Data, Ministry of Surface Transport/AsianDevelopment Bank, New Delhi: Government of India.
Kmenta, J (1986). Elements of Econometrics, New York:Macmillan Publishing Company.
Krueger, A (1974). “Political Economy of the Rent-SeekingSociety,” American Economic Review, 64(3), 291-303.
Lave, Charles A (1969). “A Behavioral Approach to ModalSplit Forecasting,” in Mohring, H (ed.) (1994). TheEconomics of Transport, Volume 1, Aldershot, UK: EdwardElgar.
Ministry of Railways/CES (1993). Integrated Rail RoadTransport System for Movement of Long Distance Freight:Final Report, New Delhi: Government of India.
Ministry of Railways/RITES (1996). Study on Decline inRailway’s Share in Total Land Traffic Volume: Draft Report,New Delhi: Government of India.
Ministry of Railways (2002). Indian Railways Annual StatisticalStatements, New Delhi: Government of India.
Ministry of Surface Transport/CES (1989). Road User ChargesStudy, New Delhi: Government of India.
Ministry of Surface Transport (1996). Report of the WorkingGroup on Road Transport for the Ninth Five Year Plan, NewDelhi: Government of India.
Ministry of Surface Transport (1999). Comprehensive Studyof Road Traffic Flows in the Country: Final Report, NewDelhi: Government of India.
Ministry of Surface Transport/AITD (1999). TruckingOperations in India: Report of the Steering Committee, NewDelhi: Government of India.
Ministry of Surface Transport (2001). Report of the Sub-Group on Traffic Forecasts and Fleet Requirement in theTenth Plan, New Delhi: Government of India.
Moses, L N and Williamson, H F (1965). “Choice of Modein Urban Transportation,” Unpublished Report, North-western University, USA.
Planning Commission, (1966). Final Report of the Committeeon Transport Policy and Coordination , New Delhi:Government of India.
Planning Commission (1980). Report of the National TransportPolicy Committee, New Delhi: Government of India.
Planning Commission (1988). Perspective Planning forTransport Development, Report of Steering Committee, NewDelhi: Government of India.
Planning Commission/RITES (1987-88). Total TransportSystem Study, New Delhi: Government of India.
Planning Commission (2001). Report of the Working Groupon Road Transport for the Tenth Five Year Plan, New Delhi:Government of India.
Rennings, K et al . (1999). “Valuation of TransportExternalities,” Institute for Transport Studies, Universityof Leeds: Project No PL 97-Z064 commissioned by theEuropean Commission.
Savelli, G and Domergue, P (1998). “Rail Transport andGreenhouse Effect,” paper presented at the UIC-MAPSseminar, New Delhi.
Wiederkehr, P (1998). “Environmentally SustainableTransport (EST): International Perspectives,” paperpresented at the UIC-MAPS seminar, New Delhi.
World Bank (1995). India Transport Sector: Long-TermIssues, Infrastructure Operations Division, South AsiaRegional Office.
Prosenjit Dey Chaudhury is currently an Economist withConsulting Engineering Services (India) Private Limited, NewDelhi. He has been involved in studies on the environmentaland social sustainability of transport modes in India, overloadingof commercial vehicles, proposed expressways in the NationalCapital Region, etc. In 2004, he received his doctoral degree
for his thesis titled “Environmental Sustainability of Transport:Issues in the Case of Rail and Road,” submitted to theJawaharlal Nehru University, New Delhi. His areas of interestinclude economic development, environment, infrastructure,and energy.e-mail: [email protected]
VIKALPA • VOLUME 30 • NO 1 • JANUARY - MARCH 2005 33
33