research on adcn method for damage detection of mining
TRANSCRIPT

Delft University of Technology
Research On ADCN Method For Damage Detection Of Mining Conveyor Belt
Qu, Dingran; Qiao, Tiezhu; Pang, Yusong; Yang, Yi; Zhang, Haitao
DOI10.1109/JSEN.2020.3048057Publication date2021Document VersionAccepted author manuscriptPublished inIEEE Sensors Journal
Citation (APA)Qu, D., Qiao, T., Pang, Y., Yang, Y., & Zhang, H. (2021). Research On ADCN Method For DamageDetection Of Mining Conveyor Belt. IEEE Sensors Journal, 21(6), 8662-8669.https://doi.org/10.1109/JSEN.2020.3048057
Important noteTo cite this publication, please use the final published version (if applicable).Please check the document version above.
CopyrightOther than for strictly personal use, it is not permitted to download, forward or distribute the text or part of it, without the consentof the author(s) and/or copyright holder(s), unless the work is under an open content license such as Creative Commons.
Takedown policyPlease contact us and provide details if you believe this document breaches copyrights.We will remove access to the work immediately and investigate your claim.
This work is downloaded from Delft University of Technology.For technical reasons the number of authors shown on this cover page is limited to a maximum of 10.

1530-437X (c) 2020 IEEE. Personal use is permitted, but republication/redistribution requires IEEE permission. See http://www.ieee.org/publications_standards/publications/rights/index.html for more information.
This article has been accepted for publication in a future issue of this journal, but has not been fully edited. Content may change prior to final publication. Citation information: DOI 10.1109/JSEN.2020.3048057, IEEE SensorsJournal
IEEE SENSORS JOURNAL, VOL. XX, NO. XX, MONTH X, XXXX 1
Abstract: Belt conveyor is considered as a momentous component of modern coal mining transportation system, and thus it is an essential task to diagnose and monitor the damage of belt in real time and accurately. Based on the deep learning algorithm, this present study proposes a method of conveyor belt damage detection based on ADCN (Adaptive Deep Convolutional Network). A deep convolution network with unique adaptability is built to extract the different scale features of visible light image of conveyor belt damage, and the target is classified and located in the form of anchor boxes. A data set with data diversity is collected according to the actual working conditions of the conveyor belt. After training and regression, the ADCN model can perfectly capture and classify the damaged target in the video of the conveyor running. Compared with the SVM based method, the method based on ADCN can better meet the real-time and reliability requirements of belt damage detection, and it has the positioning function which SVM does not have.
Index Terms—Deep learning, ADCN, Conveyor belt, Damage
I. Introduction
Mining belt conveyor is the lifeblood of raw coal transportation system[1], which is considered as the necessary and expensive large-scale working equipment for coal mine transportation. As an important part of the belt conveyor, the belt is used to carry coal transportation. Therefore, it plays an extremely important role in the operation of belt conveyor. In the working process of the belt conveyor, harsh working environment and sudden accidents may lead to longitudinal tearing of conveyor belt [2][3], which may lead to machine damage, production stagnation and even casualties in serious cases.
In August 2020, a metal part fell off at the coal falling point of conveyor belt in China Qingxu, Jinmei Railway Logistics Co., Ltd. As a result of the conveyor belt had not been equipped with tear detection
This work is supported by the National Natural Science Foundation
of China-Shanxi coal-based low-carbon joint fund (Grant No. U1810121)
;Funds for Local Scientific and Technological Development under the
Guidance of the Central Government(Grant No.YDZX20201400001796) a. Dingran Qu. Key Laboratory of Advanced Transducers and
Intelligent Control System, Ministry of Education, College of Physics and Optoelectronics, Taiyuan University of Technology, Taiyuan 030024, China ([email protected])
b. Tiezhu Qiao. Key Laboratory of Advanced Transducers and Intelligent Control System, Ministry of Education, College of Physics and Optoelectronics, Taiyuan University of Technology, Taiyuan
030024, China ([email protected])
equipment, the longitudinal tear of nearly 400m conveyor belt has been caused, resulting in the direct loss of 26W RMB and the indirect loss of 10W RMB. The scene of the accident is shown in Fig.1.
Fig. 1. Scene of accident
c. Yusong Pang. Section of Transport Engineering and Logistic, Faculty of Mechanical, Maritime and Materials Engineering, Delft
University of Technology, 2628 CD Delft, the Netherlands ([email protected]) d. Yi Yang. Key Laboratory of Advanced Transducers and Intelligent
Control System, Ministry of Education, College of Physics and Optoelectronics, Taiyuan University of Technology, Taiyuan 030024, China ([email protected])
e. Haitao Zhang. Key Laboratory of Advanced Transducers and Intelligent Control System, Ministry of Education, College of Physics and Optoelectronics, Taiyuan University of Technology, Taiyuan
030024, China ([email protected])
Research On ADCN Method For Damage Detection Of Mining Conveyor Belt
Dingran Qu, Tiezhu Qiao, Yusong Pang, Yi Yang,Haitao Zhang
,Yi Yang,Haitao Zhang
Authorized licensed use limited to: TU Delft Library. Downloaded on February 11,2021 at 10:11:11 UTC from IEEE Xplore. Restrictions apply.

1530-437X (c) 2020 IEEE. Personal use is permitted, but republication/redistribution requires IEEE permission. See http://www.ieee.org/publications_standards/publications/rights/index.html for more information.
This article has been accepted for publication in a future issue of this journal, but has not been fully edited. Content may change prior to final publication. Citation information: DOI 10.1109/JSEN.2020.3048057, IEEE SensorsJournal
8 IEEE SENSORS JOURNAL, VOL. XX, NO. XX, MONTH X, XXXX
Consequently, it is of particular importance to detect the longitudinal tear state of the conveyor belt in real time[4]. Compared with traditional detection methods, such as electromagnetic testing method[5], ultrasonic testing method and mechanical testing method[6][7], machine vision detection technology has better detection speed and accuracy without the requirement to contact with the detected object[8], and lower maintenance cost[9]. The existing damage detection methods for conveyor belt based on machine vision include: Chen et al. proposed the SVM-based monitoring technology to detect the damage of mining conveyor belt[10]. Li et al. used the optimized SSR algorithm to detect the damage of conveyor belt[11]. Yu et al. proposed a dual-band machine vision method based on the combination of medium infrared light and long infrared light to detect belt damage[12]. Hou et al. employed the multi-spectral image acquisition sensor to decompose visible light into visible light, medium infrared light and far infrared light, and integrated the multi-spectral image for longitudinal tear detection of conveyor belt[13]. Qiao et al. proposed an integrated binocular vision detection method on the basis of infrared and visible light fusion to detect the tearing of the mining conveyor belt[14]. Yang et al. used the infrared light detection method based on the new infrared image binarization threshold automatic selection algorithm to detect the tear of conveyor belt[3]. Hou et al. combined machine vision and GMM-UBM sound recognition to comprehensively detect the tearing of conveyor belt[15]. However, due to its imaging principle, the method based on infrared image still has great limitations such as high noise, high cost and poor effect in the actual experiment. Due to the fuzzy classification characteristics of different damage in the conveyor belt, existing machine learning methods, such as SVM and GMM still have a very large room for the improvement in both detection accuracy and speed[16][17].
Consequently, this present study refers to the deep learning ideas in the field of mechanical defect detection[18][19], and takes the lead in putting forward a method of ADCN to the damage detection of mining conveyor belt. Compared with traditional machine vision detection methods, such as SVM, this method has stronger generalization, higher detection accuracy and faster detection speed. In addition, it can also accurately locate the specific location of the damage of the conveyor belt. In this paper, the visible light image data of the real working environment of mine conveyor belt are collected and processed, and the damage detection data set of mine conveyor belt is established. Based on the thought of deep neural network and the special situation of self-made data set, the ADCN structure of mine conveyor belt damage detection is established. In addition, the trained network model can be used to capture and classify the surface scratches and penetrating tears on the conveyor belt in real time and accurately.
The input image size of the ADCN is 416x416x3. The backbone of the network consists of 14 layers of convolution layer, and each convolution layer includes convolution operation, BN normalization and Mish
activation function. In the neck part of neural network, both SPP module and FPN structure are adopted. In addition, the head part is to output three size feature maps corresponding to three size anchor boxes respectively. In this article, CIoU_loss function is selected as the Bounding Box Regression Function, and DIoU_NMS function is employed to screen the prediction boxes.
The remainder of this article is arranged as follows: Section 2 represents the structure of the ADCN for damage detection of mining conveyor belt, which is divided into four network modules for separate explanation. Section 3 describes the experimental process of this study, evaluates the experimental results and analyzes the data with four evaluation indexes we presented. Finally, the conclusion of this paper and the direction of future development will be provided in Section 4.
II. ADCN STRUCTURE
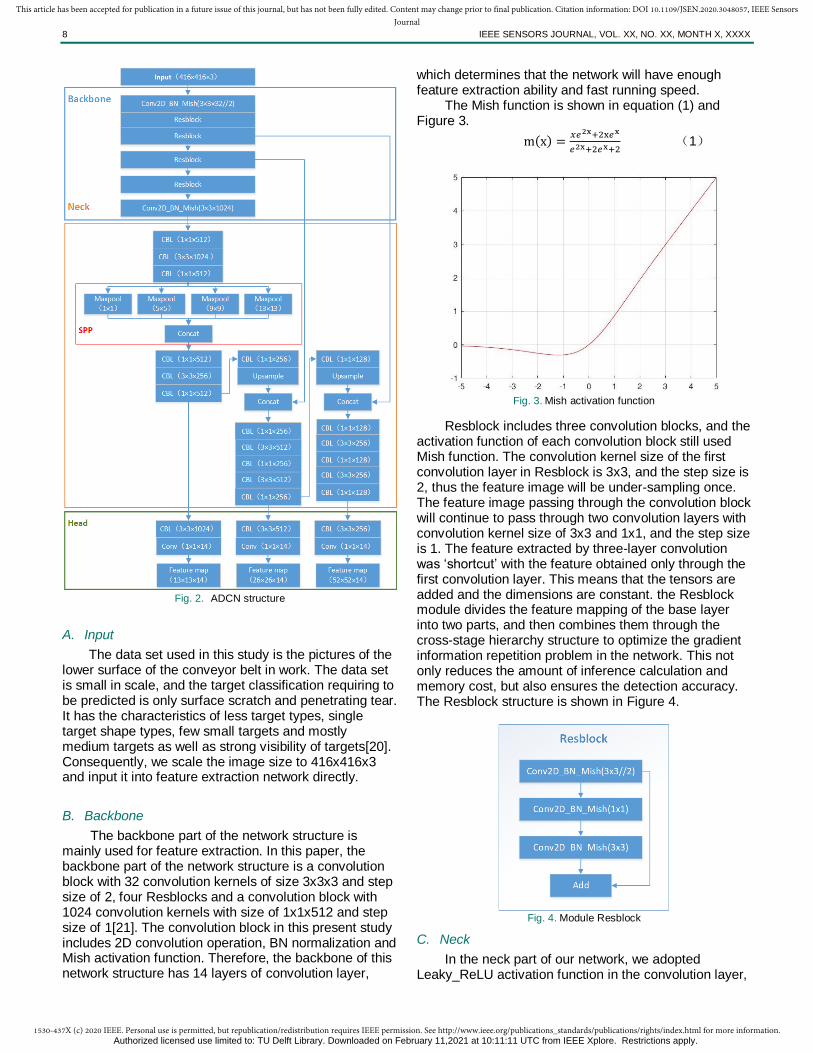
The network structure used in the ADCN method for damage detection of mining conveyor belt is a special network structure customized according to the application scenarios in the present study. The ADCN is divided into four parts for explanation: input is the input end, which is responsible for image input. Backbone is the main part of the network, which accounts for the characteristic extraction of the input images. The neck part exists between the backbone and the head, making it better use of the predictor layer to take advantage of the image features extracted by backbone by adding a series of complex network structures or algorithms. As the prediction part, the head is responsible for obtaining the output content of the neural network, and predicting the target through the features extracted from the neural network model. In the following, we will elaborate the four parts of the neural network structure respectively.
The structure of ADCN is shown in Fig.2. In the ’CBL(x×y×n)’,’Conv(x×y×n)’ and ‘Con2D_BN_Mish(x×y×n)’ in Fig.2, ‘x×y’ is the length and width of the convolution kernel, ‘n’ is the quantity of the convolution kernel. In ‘Feature map(x×y×n)’, ‘x×y×n’ represents the size of the feature map. In addition, ‘//2’ means that the step size of convolution kernel is 2, and other steps are 1 by default.
Authorized licensed use limited to: TU Delft Library. Downloaded on February 11,2021 at 10:11:11 UTC from IEEE Xplore. Restrictions apply.
1530-437X (c) 2020 IEEE. Personal use is permitted, but republication/redistribution requires IEEE permission. See http://www.ieee.org/publications_standards/publications/rights/index.html for more information.
This article has been accepted for publication in a future issue of this journal, but has not been fully edited. Content may change prior to final publication. Citation information: DOI 10.1109/JSEN.2020.3048057, IEEE SensorsJournal
8 IEEE SENSORS JOURNAL, VOL. XX, NO. XX, MONTH X, XXXX
Fig. 2. ADCN structure
A. Input
The data set used in this study is the pictures of the lower surface of the conveyor belt in work. The data set is small in scale, and the target classification requiring to be predicted is only surface scratch and penetrating tear. It has the characteristics of less target types, single target shape types, few small targets and mostly medium targets as well as strong visibility of targets[20]. Consequently, we scale the image size to 416x416x3 and input it into feature extraction network directly.
B. Backbone
The backbone part of the network structure is mainly used for feature extraction. In this paper, the backbone part of the network structure is a convolution block with 32 convolution kernels of size 3x3x3 and step size of 2, four Resblocks and a convolution block with 1024 convolution kernels with size of 1x1x512 and step size of 1[21]. The convolution block in this present study includes 2D convolution operation, BN normalization and Mish activation function. Therefore, the backbone of this network structure has 14 layers of convolution layer,
which determines that the network will have enough feature extraction ability and fast running speed.
The Mish function is shown in equation (1) and Figure 3.
m(x) =𝑥𝑒2x+2x𝑒x
𝑒2x+2𝑒x+2 (1)
Fig. 3. Mish activation function
Resblock includes three convolution blocks, and the activation function of each convolution block still used Mish function. The convolution kernel size of the first convolution layer in Resblock is 3x3, and the step size is 2, thus the feature image will be under-sampling once. The feature image passing through the convolution block will continue to pass through two convolution layers with convolution kernel size of 3x3 and 1x1, and the step size is 1. The feature extracted by three-layer convolution was ‘shortcut’ with the feature obtained only through the first convolution layer. This means that the tensors are added and the dimensions are constant. the Resblock module divides the feature mapping of the base layer into two parts, and then combines them through the cross-stage hierarchy structure to optimize the gradient information repetition problem in the network. This not only reduces the amount of inference calculation and memory cost, but also ensures the detection accuracy. The Resblock structure is shown in Figure 4.
Fig. 4. Module Resblock
C. Neck
In the neck part of our network, we adopted Leaky_ReLU activation function in the convolution layer,
Authorized licensed use limited to: TU Delft Library. Downloaded on February 11,2021 at 10:11:11 UTC from IEEE Xplore. Restrictions apply.

1530-437X (c) 2020 IEEE. Personal use is permitted, but republication/redistribution requires IEEE permission. See http://www.ieee.org/publications_standards/publications/rights/index.html for more information.
This article has been accepted for publication in a future issue of this journal, but has not been fully edited. Content may change prior to final publication. Citation information: DOI 10.1109/JSEN.2020.3048057, IEEE SensorsJournal
8 IEEE SENSORS JOURNAL, VOL. XX, NO. XX, MONTH X, XXXX
and used SPP module and FPN to build the network structure[22][23]. In the SPP module, the feature images entered the Max-Pooling operation of convolution kernel = {1x1, 5x5, 9x9, 13x13}, and then the four different scale feature images were concatenated and created. Padding operation was adopted for Max-Pooling. Compared to the KxK Max-Pooling method, SPP module has a variety of advantages, such as effectively increasing the receiving range of backbone features, significantly separating the most important context features, and improving the average accuracy value under the condition of almost constant computing cost. FPN is the abbreviation of Feature Pyramid Networks, which is used to transfer and fuse the high-level feature information by up-sampling, and get the feature map for prediction. FPN layer conveys strong semantic features from top to bottom, and aggregates features from different backbone layers to different detection layers. This can greatly improve the ability of feature extraction of neural network. However, it will increase a large amount of calculation for the whole network structure. The FPN layer has three feature maps of different sizes, which are 13x13, 26x26, 52x52, respectively. They are corresponding to the largest medium and the smallest anchor box[24].
The Activation function of Leaky_ReLU is shown in equation (2).
𝑦𝑖 = {𝑥𝑖 𝑖𝑓 𝑥𝑖 ≥ 0𝑥𝑖
2 𝑖𝑓 𝑥𝑖 < 0
(2)
Figure 5 shows the network structure of CBL module. Fig. 6 is the schematic diagram of FPN for image feature fusion.
Fig. 5. Module CBL
Fig. 6. FPN structure
D. Head
The Head part of the network structure in this paper converts the three feature graphs input by the neck layer
into three feature maps with dimensions of 13×13×14, 26×26×14 and 52×52×14, through a CBL module and a convolutional layer to achieve the prediction effect. The 14 shown here is the feature graph dimension, which is defined by (anchor_num/3)x(5+classes_num).
The loss function of the neural network model in this paper consists of two types, including Classification Loss and Bounding Box Regression Loss during target detection. CIoU_loss function is adopted in the Bounding Box Regression Loss, which makes the regression of neural network model prediction box faster and more accurate than using IoU_Loss.
CIoU_Loss function is shown in equation (3). “C” is the CIoU_loss function value. When C exceeds the threshold of the score, the anchor box returns. In this paper, we set score_threshold to 0.5. “B” is the
Predicted Bounding Box. “𝐵𝑔𝑡”is the Ground-truth
Bounding Box. “ρ” is the square of the distance
between the predicted bounding box and the ground
truth bounding box. “c” is the diagonal length of the
minimum bounding box that can contain the Predicted
Bounding Box and the Ground-truth Bounding Box. “α
” is used as a trade-off parameter. The definition is
shown in equation (4). In equation (5), “υ” is used as
a parameter for measuring consistency of aspect ratio. “W” is the width of the Predicted Bounding Box while “𝑤𝑔𝑡”is the width of the Ground-truth Bounding Box. “h” is the height of the Predicted Bounding Box while “ℎ𝑔𝑡” is the height of the Ground-truth Bounding Box.
𝐶 = 1 −|𝐵∩𝐵𝑔𝑡|
|𝐵∪𝐵𝑔𝑡|+
𝜌2(𝐵,𝐵𝑔𝑡)
𝑐2 + 𝛼υ (3)
𝛼 =υ
(1−|𝐵∩𝐵𝑔𝑡|
|𝐵∪𝐵𝑔𝑡|)+υ
(4)
υ = [2(𝑎𝑟𝑐𝑡𝑎𝑛
𝑤𝑔𝑡
ℎ𝑔𝑡 −𝑎𝑟𝑐𝑡𝑎𝑛𝑤
ℎ)
𝜋]2 (5)
Classification Loss adopts DIOU_nms[25]. Compared with IOU, this method has better performance in detecting overlapping targets. DIOU_NMS function is shown in equation (6). “D” is the DIoU_loss function value. When D exceeds the iou_threshold, we choose this anchor box. In this study, we set iou_threshold to 0.3.
𝐷 = 1 −|𝐵∩𝐵𝑔𝑡|
|𝐵∪𝐵𝑔𝑡|+
𝜌2(𝐵,𝐵𝑔𝑡)
𝑐2 (6)
III. EXPERIMENTAL PROCESS AND RESULT ANALYSIS
A. Construction of experimental platform
1) Mining conveyor belt damage detection platform
To test the reliability and real-time performance of the ADCN diagnosis method for mining conveyor belt damage, according to the actual working situation of the conveyor belt, we set up two experimental platforms for mining conveyor belt in the laboratory after the on-the-spot investigation in China Qingxu, Jinmei Railway Logistics Co., Ltd. Fig.7. shows the actual working condition of belt conveyor. Fig.8. presents the data acquisition platform and test platform of mining conveyor belt. The length, width and thickness of the conveyor belt
Authorized licensed use limited to: TU Delft Library. Downloaded on February 11,2021 at 10:11:11 UTC from IEEE Xplore. Restrictions apply.

1530-437X (c) 2020 IEEE. Personal use is permitted, but republication/redistribution requires IEEE permission. See http://www.ieee.org/publications_standards/publications/rights/index.html for more information.
This article has been accepted for publication in a future issue of this journal, but has not been fully edited. Content may change prior to final publication. Citation information: DOI 10.1109/JSEN.2020.3048057, IEEE SensorsJournal
8 IEEE SENSORS JOURNAL, VOL. XX, NO. XX, MONTH X, XXXX
are 11m, 0.8m and 15mm respectively. The maximum speed of conveyor belt is 4m/s. The image acquisition equipment used a visible light camera with a frame rate of 60FPS and a resolution of 1280x1024, fully satisfying the requirements of the image detection experiment of the mining conveyor belt.
Fig. 7. actual working condition of belt conveyor
Fig.8. a. Data acquisition platform
Fig.8. b. Test platform
Since tearing usually occurs near the coal falling
point of the conveyor belt, the image sensor should be installed near the front of the coal falling point. In addition, as shown in Fig.9, first of all, the lower part of the conveyor belt has a large space, which will not be covered by coal, and the longitudinal tearing of the conveyor belt is easier to be detected due to the large downward radian. Longitudinal tearing at the top of the belt can be also detected below. Therefore, we installed the camera on the lower part of the conveyor belt. The
hardware installation position of the experimental platform is presented as Fig.10.
Fig. 9. Lower part of conveyor belt
Fig. 10. Hardware installation location diagram
2) Data processing module configuration
The experimental data processing module uses HP OMEN5 64-bit computer; Windows 10. CPU adopts Intel I7 9750H and RAM size of 16G. Single GPU uses Nvidia GeForce RTX 2060 with 6G video memory.
The software environment version used in this experiment is: python3.6, CUDA10.1, tensorflow-gpu2.2.0rc2, keras2.4.3, numpy1.19.1, and opencv3.3.1.
B. Experimental process
1) Data-set Longitudinal tear is the key target to be detected in
this experiment, and scratch external defects are the precursors of longitudinal tear[26], so in this experiment, we divided the damage into tear and scratch.
We used the camera to collect the damage images of the conveyor belt in the dark light environment. We collected damage images of different angles, sizes and positions on the data acquisition platform, including 300 tear samples and 300 scratch samples, which were used as the training set of this experiment. The training set samples is shown in Fig.11.
Authorized licensed use limited to: TU Delft Library. Downloaded on February 11,2021 at 10:11:11 UTC from IEEE Xplore. Restrictions apply.

1530-437X (c) 2020 IEEE. Personal use is permitted, but republication/redistribution requires IEEE permission. See http://www.ieee.org/publications_standards/publications/rights/index.html for more information.
This article has been accepted for publication in a future issue of this journal, but has not been fully edited. Content may change prior to final publication. Citation information: DOI 10.1109/JSEN.2020.3048057, IEEE SensorsJournal
8 IEEE SENSORS JOURNAL, VOL. XX, NO. XX, MONTH X, XXXX
Fig. 11. a. Training set samples of scratch
Fig. 11. b. Training set samples of tearing
2) Network model training
In this paper, Kmeans algorithm is adopted to cluster the damage data of mining conveyor belt[27], so as to obtain anchor boxes with pertinency and adaptability. In this present study, the size of the input image is 416x416x3, the number of anchor boxes is 6. Six anchor boxes are equally divided by three output tensors, and each of them takes its own anchor boxes in accordance with the size of large, medium and small. Fig.12. shows kmeans algorithm to obtain anchor boxes standardized value. Therefore, the anchor boxes used in this paper are((104,410)(36,408)(41,407)(47,411)(18,407)(72,405)).
Fig. 12. Getting anchor boxes by kmeans
In this paper, the training parameters of the neural
network model were set as: mini_batch=32; Epoch = 500;
and Image_size = (416x416x3). The training time in this
condition is 286 mins. 3) Experimental test
The test experiments were carried out on the test platform. we set the running speed of the belt conveyor to 3.15m/s (the data is provided by the China Qingxu, Jinmei Railway Logistics Co., Ltd.), and then used the camera to test the target detection in three positions of the mounting frame, which are left, middle and right.
In order to carry out the test experiment, we created 13.68m continuous tear and 19.32m continuous scratch on different positions of the conveyor belt on the test platform. After image data acquisition, 260 tear samples and 368 scratch samples were obtained. This paper set the prediction parameters as: score_ threshold=0.5; iou_threshold=0.3.
We carried out 5 detection experiments in a row to obtain more accurate performance index data.
Figure 13 presents the diagnosis results of the image under ADCN method.
Fig. 13. The detection results under ADCN method
In order to highlight the advantages of the conveyor
belt damage detection method based on ADCN, We used the detection method based on SVM with the same test data in the same experimental environment to carry out a group of comparative experiments, and compared the experimental data.
C. Analysis of experimental results
We choose 3 indicators to describe the performance of the diagnosis method for the test results, respectively, AR(average recall), AP(average precision), TAfps(total average FPS).
Authorized licensed use limited to: TU Delft Library. Downloaded on February 11,2021 at 10:11:11 UTC from IEEE Xplore. Restrictions apply.

1530-437X (c) 2020 IEEE. Personal use is permitted, but republication/redistribution requires IEEE permission. See http://www.ieee.org/publications_standards/publications/rights/index.html for more information.
This article has been accepted for publication in a future issue of this journal, but has not been fully edited. Content may change prior to final publication. Citation information: DOI 10.1109/JSEN.2020.3048057, IEEE SensorsJournal
8 IEEE SENSORS JOURNAL, VOL. XX, NO. XX, MONTH X, XXXX
The calculation method of recall rate is presented in formula (7).
𝑅 =𝑇𝑃𝑠+𝑇𝑃𝑡
𝑇𝑃𝑠+𝑇𝑃𝑡+𝐹𝑁𝑠+𝐹𝑁𝑡 (7)
The calculation method of precision rate is presented in formula (8).
𝑃 =𝑇𝑃𝑠+𝑇𝑃𝑡
𝑇𝑃𝑠+𝑇𝑃𝑡+𝐹𝑃𝑠+𝐹𝑃𝑡 (8)
“𝑇𝑃𝑠” is the number of Scratch classes correctly
predicted as Scratch classes;”𝑇𝑃𝑡 ” is the number of
Tearing classes correctly predicted as Tearing classes; ”𝐹𝑃𝑠” is the number of false predictions of other
situations as Scratch classes;”𝐹𝑃𝑡” is the number of
false predictions of other situations as Tearing classes;” 𝐹𝑁𝑠” is the number of missed predictions of Scratch
class;”𝐹𝑁𝑡” is the number of missed predictions of
Tearing class. The AR obtained after a group of experiments is
shown in formula (9). AP is presented in formula (10). TAfps is shown in formula (11). “𝑅𝑛” is the recall rate of
the nth experiment;”𝑅𝑚𝑖𝑛” is the minimum recall rate of
a group of experiments;”𝑅𝑚𝑎𝑥” is the maximum recall
rate of a group of experiments; “𝑃𝑛” is the precision rate
of the nth experiment;”𝑃𝑚𝑖𝑛” is the minimum precision
rate of a group of experiments;”𝑃𝑚𝑎𝑥” is the maximum
precision rate of a group of experiments;”𝐴𝑓𝑝𝑠𝑛” is the
average FPS obtained in the nth experiment。
𝐴𝑅 =(∑ 𝑅𝑛)5
𝑛=1 −𝑅𝑚𝑖𝑛−𝑅𝑚𝑎𝑥
3 (9)
𝐴𝑃 =∑ 𝑃𝑛
5𝑛=1 −𝑃𝑚𝑖𝑛−𝑃𝑚𝑎𝑥
3 (10)
TAfps =∑ 𝐴𝑓𝑝𝑠𝑛
5𝑛=1
5 (11)
Table 1 presents the scratch class detection results obtained by 5 test experiments under ADCN model.
TABLE I
DETECTION Result of SCRATCH
EXPERIMENT TP FP FN
1 355 12 13
2 354 10 14
3 352 8 16
4 357 9 11
5 350 10 18
Table 2 presents the tearing class detection results
obtained by 5 test experiments under ADCN model.
TABLEⅡ
DETECTION Result of Tearing
EXPERIMENT TP FP FN
1 248 7 12
2 251 5 9
3 250 7 10
4 243 6 17
5 247 8 13
Table 3 presents the recall, precision and average
FPS data obtained from 5 test experiments under the ADCN model.
TABLEⅢ
PERFORMANCE OF ADCN
EXPERIMENT RECALL/% PRECISION/% AVERAGE FPS
1 96.02 96.95 23.44
2 96.34 97.58 24.75
3 95.86 97.57 24.03
4 95.54 97.56 23.92
5 95.06 97.07 25.47
AVERAGE 95.81 97.40 24.32
Table 4 shows the detection results of scratch class
by 5 test experiments under SVM method.
TABLE Ⅳ
DETECTION RESULT OF SCRATCH
EXPERIMENT TP FP FN
1 330 35 38
2 324 31 44 3 332 29 36
4 327 33 41
5 325 32 43
Table 5 shows the detection results of tearing class
by 5 test experiments under SVM method.
TABLE Ⅴ
DETECTION RESULT OF TEARING
EXPERIMENT TP FP FN
1 231 25 29
2 230 24 30
3 227 28 33
4 233 21 27
5 225 27 35
Table 6 presents the recall, precision and average
FPS data obtained from 5 test experiments under the SVM model.
TABLE Ⅵ
PERFORMANCE OF SVM
EXPERIMENT RECALL/% PRECISION/% AVERAGE FPS
1 89.33 90.34 7.12
2 88.22 90.97 6.83
3 89.01 90.75 7.06
4 89.17 91.21 7.45
5 87.58 90.31 6.95
AVERAGE 88.85 90.69 7.08
The performance index of the detection method
based on ADCN and SVM is shown in Table 7.
TABLE Ⅶ
PERFORMANCE COMPARISON
Detection method
AR AP TAFPS
ADCN 95.81% 97.40% 24.32 SVM 88.85% 90.69% 7.08
Authorized licensed use limited to: TU Delft Library. Downloaded on February 11,2021 at 10:11:11 UTC from IEEE Xplore. Restrictions apply.

1530-437X (c) 2020 IEEE. Personal use is permitted, but republication/redistribution requires IEEE permission. See http://www.ieee.org/publications_standards/publications/rights/index.html for more information.
This article has been accepted for publication in a future issue of this journal, but has not been fully edited. Content may change prior to final publication. Citation information: DOI 10.1109/JSEN.2020.3048057, IEEE SensorsJournal
8 IEEE SENSORS JOURNAL, VOL. XX, NO. XX, MONTH X, XXXX
According to the experimental data obtained from two groups of experiments, the AR and AP of the mine conveyor belt damage detection method based on ADCN reach 95.81% and 97.40% respectively, the total average detection speed (TAfps) is 24.32 FPS, and the AR ,AP and total average detection speed of the damage detection method based on SVM reach 88.85%, 90.69% and 7.08 FPS. By comparing with the SVM, the AR, AP and TAfps of the method in this paper are improved by 6.96%, 6.71% and 243.50%. Therefore, the method based on ADCN can fully meet the real-time and reliability requirements of conveyor belt damage detection in actual industry. Moreover, it is stronger than the traditional machine learning method.
IV. CONCLUSION
In order to monitor, diagnose and warn the damage of mining conveyor belt in real time and avoid the occurrence of production accidents, the ADCN method is proposed for damage detection of mine conveyor belt.
We balanced the AR, AP and detection speed as well as realized the existing optimal network model for mine conveyor belt damage detection. This method has never been put forward in the field of mine conveyor belt damage detection. In addition, we have built two experimental platforms for mining conveyor belt damage detection in the laboratory. The damage detection method based on ADCN model was verified through the test platform, and the experiment was compared with the traditional machine learning method based on SVM. According to the experimental results, the average detection speed of the proposed method is over 20fps, which fully meets the purpose of real-time monitoring of mining conveyor belt. In the aspect of damage identification, ADCN method can accurately identify and locate two types of damage on the conveyor belt surface, namely, Scratch and Tearing. The AR of this method is 95.81%, the AP is 97.40%, and the TAfps is 24.32fps. Compared with the SVM based method, AR, AP and TAfps are increased by 6.96%, 6.71% and 243.50% respectively. Therefore, the ADCN method for damage detection of mining conveyor belt can satisfy the real-time and reliability requirements of the industrial field conveyor belt damage detection, and it is stronger than traditional machine learning methods.
REFERENCES
[1] D. He, Y. Pang, G. Lodewijks, and X. Liu, “Healthy speed control of belt conveyors on conveying bulk materials,” Powder Technol., vol. 327, pp. 408–419, 2018, doi:
10.1016/j.powtec.2018.01.002. [2] F. Hakami, A. Pramanik, N. Ridgway, and A. K. Basak,
“Developments of rubber material wear in conveyer belt system,” Tribol. Int., vol. 111, pp. 148–158, 2017, doi:
10.1016/j.triboint.2017.03.010.
[3] Y. Yang, C. Hou, T. Qiao, H. Zhang, and L. Ma, “Longitudinal tear early-warning method for conveyor belt based on infrared vision,” Meas. J. Int. Meas. Confed., vol. 147, p. 106817,
2019, doi: 10.1016/j.measurement.2019.07.045.
[4] M. Andrejiova, A. Grincova, and D. Marasova, “Measurement and simulation of impact wear damage to industrial conveyor belts,” Wear, vol. 368–369, pp. 400–407, 2016, doi:
10.1016/j.wear.2016.10.010. [5] Y. Pang and G. Lodewijks, “A Novel Embedded Conductive
Detection System for Intelligent Conveyor Belt Monitoring,” no. May 2014, pp. 803–808, 2007, doi: 10.1109/soli.2006.328958.
[6] D. Dobrotə, “Vulcanization of rubber conveyor belts with metallic insertion using ultrasounds,” Procedia Eng., vol. 100,
no. January, pp. 1160–1166, 2015, doi:
10.1016/j.proeng.2015.01.479. [7] X. Peng, “A novel image-based method for conveyor belt rip
detection,” 2013 IEEE Int. Conf. Signal Process. Commun.
Comput. ICSPCC 2013, pp. 2–5, 2013, doi:
10.1109/ICSPCC.2013.6663878. [8] M. Leo, G. Medioni, M. Trivedi, T. Kanade, and G. M.
Farinella, “Computer vision for assistive technologies,” Comput. Vis. Image Underst., vol. 154, pp. 1–15, 2017, doi:
10.1016/j.cviu.2016.09.001. [9] M. Soprana, A. C. Santomaso, and P. Facco, Artificial vision
system for the online characterization of the particle size distribution of bulk materials on conveyor belts, vol. 43.
Elsevier Masson SAS, 2018. [10] G. Chen, X. Zhang, Z. J. Wang, and F. Li, “Robust support
vector data description for outlier detection with noise or uncertain data,” Knowledge-Based Syst., vol. 90, pp. 129–
137, 2015, doi: 10.1016/j.knosys.2015.09.025. [11] J. Li and C. Miao, “The conveyor belt longitudinal tear on-line
detection based on improved SSR algorithm,” Optik (Stuttg).,
vol. 127, no. 19, pp. 8002–8010, 2016, doi: 10.1016/j.ijleo.2016.05.111.
[12] B. Yu, T. Qiao, H. Zhang, and G. Yan, “Dual band infrared detection method based on mid-infrared and long infrared vision for conveyor belts longitudinal tear,” Meas. J. Int. Meas.
Confed., vol. 120, no. October 2017, pp. 140–149, 2018, doi:
10.1016/j.measurement.2018.02.029. [13] C. Hou, T. Qiao, H. Zhang, Y. Pang, and X. Xiong,
“Multispectral visual detection method for conveyor belt longitudinal tear,” Meas. J. Int. Meas. Confed., vol. 143, pp.
246–257, 2019, doi: 10.1016/j.measurement.2019.05.010.
[14] T. Qiao, L. Chen, Y. Pang, G. Yan, and C. Miao, “Integrative binocular vision detection method based on infrared and visible light fusion for conveyor belts longitudinal tear,” Meas.
J. Int. Meas. Confed., vol. 110, pp. 192–201, 2017, doi:
10.1016/j.measurement.2017.06.032. [15] C. Hou, T. Qiao, M. Qiao, X. Xiong, Y. Yang, and H. Zhang,
“Research on Audio-Visual Detection Method for Conveyor Belt Longitudinal Tear,” IEEE Access, vol. 7, pp. 120202–
120213, 2019, doi: 10.1109/access.2019.2937660.
[16] F. Nie, W. Zhu, and X. Li, “Decision Tree SVM: An extension of linear SVM for non-linear classification,” Neurocomputing,
vol. 401, pp. 153–159, 2020, doi:
10.1016/j.neucom.2019.10.051. [17] D. M. Elking, G. A. Cisneros, J. P. Piquemal, T. A. Darden,
and L. G. Pedersen, “Gaussian multipole model (GMM),” J.
Chem. Theory Comput., vol. 6, no. 1, pp. 190–202, 2010, doi:
10.1021/ct900348b. [18] J. Yang, S. Li, Z. Wang, and G. Yang, “Real-Time Tiny Part
Defect Detection System in Manufacturing Using Deep Learning,” IEEE Access, vol. 7, pp. 89278–89291, 2019, doi:
10.1109/ACCESS.2019.2925561.
[19] C. Zeng, J. Zheng, and J. Li, “Real-time conveyor belt deviation detection algorithm based on multi-scale feature fusion network,” Algorithms, vol. 12, no. 10, 2019, doi:
10.3390/a12100205. [20] M. Kisantal, Z. Wojna, J. Murawski, J. Naruniec, and K. Cho,
“Augmentation for small object detection,” vol. 2017, pp. 119–
133, 2019, doi: 10.5121/csit.2019.91713. [21] C. Y. Wang, H. Y. Mark Liao, Y. H. Wu, P. Y. Chen, J. W.
Hsieh, and I. H. Yeh, “CSPNet: A new backbone that can enhance learning capability of CNN,” IEEE Comput. Soc. Conf. Comput. Vis. Pattern Recognit. Work., vol. 2020-June,
pp. 1571–1580, 2020, doi:
10.1109/CVPRW50498.2020.00203.
Authorized licensed use limited to: TU Delft Library. Downloaded on February 11,2021 at 10:11:11 UTC from IEEE Xplore. Restrictions apply.

1530-437X (c) 2020 IEEE. Personal use is permitted, but republication/redistribution requires IEEE permission. See http://www.ieee.org/publications_standards/publications/rights/index.html for more information.
This article has been accepted for publication in a future issue of this journal, but has not been fully edited. Content may change prior to final publication. Citation information: DOI 10.1109/JSEN.2020.3048057, IEEE SensorsJournal
8 IEEE SENSORS JOURNAL, VOL. XX, NO. XX, MONTH X, XXXX
[22] Z. Huang, J. Wang, X. Fu, T. Yu, Y. Guo, and R. Wang, “DC-SPP-YOLO: Dense connection and spatial pyramid pooling based YOLO for object detection,” Inf. Sci. (Ny)., vol. 522, pp.
241–258, 2020, doi: 10.1016/j.ins.2020.02.067. [23] T. Y. Lin, P. Dollár, R. Girshick, K. He, B. Hariharan, and S.
Belongie, “Feature pyramid networks for object detection,” Proc. - 30th IEEE Conf. Comput. Vis. Pattern Recognition, CVPR 2017, vol. 2017-Janua, pp. 936–944, 2017, doi:
10.1109/CVPR.2017.106. [24] P. Chen, Y. Li, H. Zhou, B. Liu, and P. Liu, “Detection of small
ship objects using anchor boxes cluster and feature pyramid network model for SAR imagery,” J. Mar. Sci. Eng., vol. 8, no.
2, 2020, doi: 10.3390/jmse8020112. [25] J. Hosang and M. Planck, “Learning non-maximum
suppression.” [26] M. Leo, A. Natale, M. Del-Coco, P. Carcagnì, and C. Distante,
“Robust Estimation of Object Dimensions and External Defect Detection with a Low-Cost Sensor,” J. Nondestruct. Eval., vol.
36, no. 1, 2017, doi: 10.1007/s10921-017-0395-7. [27] Z. Xiong and Z. Zhang, “A Data Preprocessing Method
Applied to Cluster Analysis on Stock Data by Kmeans,” no. Icca, pp. 142–145, 2016, doi: 10.2991/icca-16.2016.32.
Dingran Qu received the B.S. degree in internet of things engineering from Jilin University,
Changchun, China, in 2019. He is currently pursuing the M.S. degree in control science and engineering with the Taiyuan University of
Technology, Taiyuan, China. His research interests include neural networks and coal mine safety detection.
Tiezhu Qiao received the B.S. degree in industrial
electrical automation from the Shanxi Mining Institute, in 1990, and the M.S. degree in control
science and engineering and the Ph.D. degree in
circuits and systems from the Taiyuan University of
Technology, Taiyuan, China, in 2004 and 2015, respectively, where he is currently a Professor and
the Director of the Key Laboratory of Advanced
Transducers and Intelligent Control System,
Ministry of Education. His research interests include machine vision, advanced transducers, and intelligent
control systems.
Yusong Pang received the M.Sc. degree in electrical engineering in 1996. Since 2000, he
has been working at Seaview B.V., The Netherlands, for industrial production life cycle management. After his Ph.D. research on
Intelligent Belt Conveyor Monitoring and Control in 2007, he was employed at the Advisory Group Industrial Installations, Royal Haskoning, The
Netherlands, as an Expert Material Handling. Since 2010, he has been an Assistant Professor
with the Section of Transport Engineering and Logistics, Delft University
of Technology, The Netherlands. His research mainly focuses on the intelligent control for large-scale material handling systems and logistics processes.
Yi Yang received the Ph.D. degree in instrument science and technology from Tianjin University,
Tianjin, China, in 2018. He is currently with the Key Laboratory of Advanced Transducers and Intelligent Control System, Ministry of Education, Taiyuan University of Technology, Taiyuan,
China. His research interests include computer vision, image processing, and pattern recognition.
Haitao Zhang received the B.S. degree in measuring and controlling technologies and
instruments from the Jiangsu University of Science and Technology, Jiangsu, China, in 2009, and the M.S. and Ph.D. degrees in instrumentation science
and technology from Tianjin University, Tianjin, China, in 2015, where he was a Postdoctoral in mechanical engineering, from 2015 to 2017. He is
currently with the Key Laboratory of Advanced Transducers and Intelligent Control System, Ministry of Education, Taiyuan University of
Technology, Taiyuan, China. His research interests include the development of precision measuring technology and instruments, precision measurement of geometrical parameters, error calibration, and
compensation of precision instrumentations.
Authorized licensed use limited to: TU Delft Library. Downloaded on February 11,2021 at 10:11:11 UTC from IEEE Xplore. Restrictions apply.