research on e-bus energy consumption and · pdf filesource capacity optimization evaluating...
TRANSCRIPT

RESEARCH ON E-BUS ENERGY CONSUMPTION AND
MOBILE POWER SOURCE CAPACITY OPTIMIZATION
EVALUATING REGENERATIVE ENERGY
Klaipeda university
(JSC “Vėjo projektai”)
Prof. dr. Eleonora Guseinoviene


Klaipeda is the third city in Lithuania after Vilnius and Kaunas in terms of size and population. Square 98 km2, population 180 400 (2011)

Klaipeda university (faculties are situated in the main campus and a few
different parts of the city)

Content
Introduction
Problem definition
Experiment planning
Analysis of power consumption
Conclusions
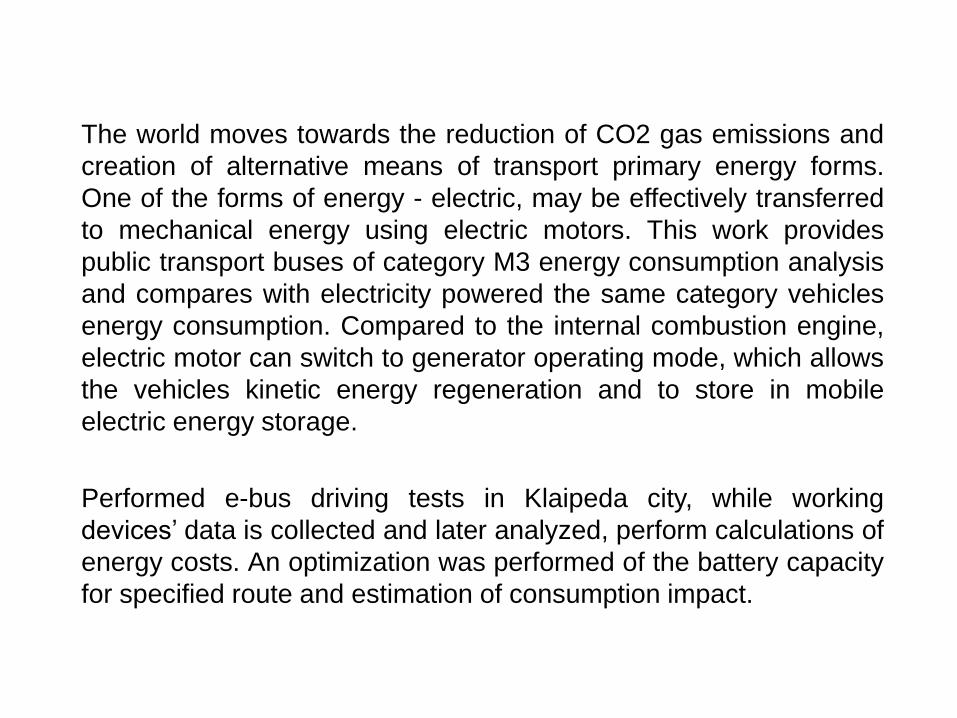
The world moves towards the reduction of CO2 gas emissions and
creation of alternative means of transport primary energy forms.
One of the forms of energy - electric, may be effectively transferred
to mechanical energy using electric motors. This work provides
public transport buses of category M3 energy consumption analysis
and compares with electricity powered the same category vehicles
energy consumption. Compared to the internal combustion engine,
electric motor can switch to generator operating mode, which allows
the vehicles kinetic energy regeneration and to store in mobile
electric energy storage.
Performed e-bus driving tests in Klaipeda city, while working
devices’ data is collected and later analyzed, perform calculations of
energy costs. An optimization was performed of the battery capacity
for specified route and estimation of consumption impact.

Abbreviations
APD – Automatic gear box (automatinė pavarų dėžė)
BMS – Battery management system
CAN – Controller area network
DC – Direct current
DI – Digital input
DO – Digital output
ES – European Union (Europos sąjunga)
FCS – Fuel cell system
GHG – Greenhouse gas
I/O – Input/Output
USB – Universal serial bus
VDV – Internal combustion engine (Vidaus degimo variklis)

Introduction
CO2 emission world tendencies up to 2011 and after 2011. According
to statistics, energy consumption and CO2 emission is increasing and
the main users are industry and transport

Distribution of public transport (ES, 2012)

Consumption by sector (2012)

Distribution of energy type used in transport in the world (2012)

Object of investigation
M3 category electro bus, typeTR14M, re-designed
from Škoda TR14 trolley (made in1983) in Klaipeda
by JSC „Vėjo projektai“; the drive motors having the
structure, which consists of mobile electrical storage
system – battery with LiFePO4 chemical cells,
DC/AC converter and one synchronous electrical
motor with permanent magnets that is connected
mechanically to rear axle differential
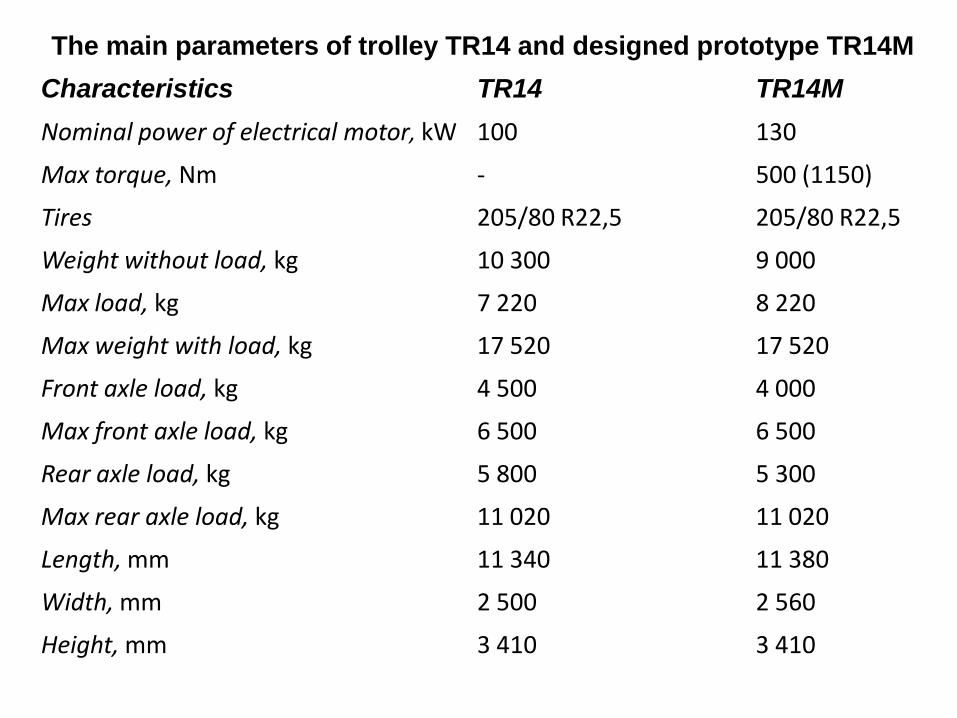
The main parameters of trolley TR14 and designed prototype TR14M
Characteristics TR14 TR14M
Nominal power of electrical motor, kW 100 130
Max torque, Nm - 500 (1150)
Tires 205/80 R22,5 205/80 R22,5
Weight without load, kg 10 300 9 000
Max load, kg 7 220 8 220
Max weight with load, kg 17 520 17 520
Front axle load, kg 4 500 4 000
Max front axle load, kg 6 500 6 500
Rear axle load, kg 5 800 5 300
Max rear axle load, kg 11 020 11 020
Length, mm 11 340 11 380
Width, mm 2 500 2 560
Height, mm 3 410 3 410

The main aim was:
To make a research on e-bus energy consumption and mobile power
source capacity optimization evaluating regenerative energy (public
transport buses of category M3)
Tasks:
Analysis of current situation and solutions
Methodics
Real experimental
Analysis of the results and recomendations
Methods:
Experimental investigation in three different routes
Data mining using CAN bus, DL1 with GPS and dynamic acceleration
sensor
„MathWorks MATLAB“ and „Microsoft EXCEL“ software

Analysis of current situation
shows, that economy of hydrogen was researched by
scientists from Tsinghua universitety in China. They made
investigation on hydrogen economy in fuel cells of hybrid
electro bus when using created algorithm for braking
mode with energy regenerative function. Energy cannot
be transferred to the fuel cell system, so mobile electrical
storage system (batteries or super capacitors) is
connected in parallel in order to store regenerative energy
when braking mode. FCS and motor are separated using
converters

Typical buses driving cycle in the cities in China

Configuration of FCSB system and energy flows
Study shows that consumption of hydrogen decreased by
16% (when coordinating control algorithm for the brake
pedal), and 9% (when parallel regenerative braking
algorithm)
Different types of batteries were used as well: Li batteries
have more advantages in comparison with Ni-Mh (Nickel–
metal hydride) batteries, so hydrogen economy increased by
11,5% due to decreasing losses in batteries. Weight was not
taken into account

Scientists from Turino
together with company
“Pininfarina” made an
experiment in Genua,
Italy and calculated
economy of diesel fuel in
hybrid prototype in
comparison with typical
bus
Data: The route Nr.18,
average speed 11 km/h,
length 9,4 km, hillside ±5%,
3,5 stops/km. Hybrid
prototype system allows to
save 27–45% fuel
consumption in comparison
with typical bus. Experiment
was repeated with the route
Nr.63)

Parallel type hybrid drive (combination of internal combustion engine with
an electrical motor/generator) has an advantage when decreasing fuel
consumption; implementation of such a system gives 25–50% economy.
Many companies: VOLVO (Sweden), IVECO (Italy), DAF (Netherlands),
RENAULT (France), MERCEDES-BENZ , MAN (Germany), MITSUBISHI ,
HINO, ISUZU (Japan), PETERBILT (USA) have been working on different
systems in order to decrease fuel consumption, to increase energy saving
etc.

Experiment was realized using:
feedback rotational speed, pressure, current (Hall sensors),
voltage, temperature sensors, vibration acceleration sensors
Speed measurement encoder RM44
Hall sensors installed in the battery BMS
Temperature sensors mounted in electric motor (PT100)
inverters, batteries
GPS and accelerometer data logger “Race Technology DL1
MK2“
Protocol converter DIGA “CRUSB” and its software CANstudio3
Pro (from CAN to USB interface)
„Race technology analysis software – v8.5”
Devices for measuring temperature, pressure, voltage, current
Etc.

Mobile power supply – 600V-cell LiFePO4 battery with BMS's
proprietary monitoring system and the climate control, internal
temperature, current and voltage sensors, contactors and fuses. CAN
communication CANopen 401 protocol is attached

Parameter Value Notes
System
Model EBattery™ 690
Type 23s8s3p
Total cell count 552
Cell chemistry LiFePO4
Module
Model EBattery30
Type 8s3p
Dimensions (W x H x L) 170 x 317 x 428
Weight 32 kg

Electrical specification
Cell voltage:
Nominal
Maximum charge
Minimum discharge
3,20 V
3,55 V
2,50 V
@ C/5 discharge
Battery voltage:
Nominal
Maximum charge
Minimum discharge
588,8 V
653,2 V
460,0 V
@ C/5 discharge
Battery capacity (@ C/5
discharge)
126 Ah IEC 62660-1 (7.2)
Charge current:
Nominal
Maximum
Max. regenerative current
14 A
14 A
126 A
Charger max. 14 A
32 A charger fuse
Cell max. Voltage limit
Discharge current:
Recommended
Maximum continuous
Maximum (1 s pulse)
126 A
235 A
350 A 350 A main fuse
Battery energy capacity 75,4 kWh
Balancing capacity 0.9 % / h
Insulation resistance TBD Between cooling fins and battery terminals @ TBD V

Environment
Operating temperature:
Charge
Discharge
0° to +60° C
-20° to +60° C
Inside module. Non-condensing, noncorrosive humidity.
Storage temperature
Continuous
Temporary (48 h)
-30° to +45° C
-40° to +60° C
Non-condensing, noncorrosive humidity.

24V I/O signal module
Liquid cooled power converter
"PowerMASTER"

VISEDO „PowerDRUM XS-frame“ motor
Motor was mounted on the frame


CAN bus data analyzer „DIGA CRUSB v1”
The scheme of normal operating of
DL1 data logger
DL1–MK2 data logger (Race Technology)
GPS mounting place

View of software "CANstudio3 Pro”

View of Race Technology Analysis V8.5 software

Route Nr.1 of electrobus in closed territory of “West Baltic Ship
building” company

Route Nr.2 of electrobus in Klaipeda; Streets: Minijos, Pilies, Naujoji
Uosto, J.Janonio, Dariaus ir Girėno, H.Manto, Šiaurės pr., Kretingos are
included to the route. Length of the route is 11 km; 15 traffic lights,
experiment time from 8.30 a.m. to 12 a.m.

Route Nr.3 of electrobus in Klaipeda (route the same as bus Nr.5)
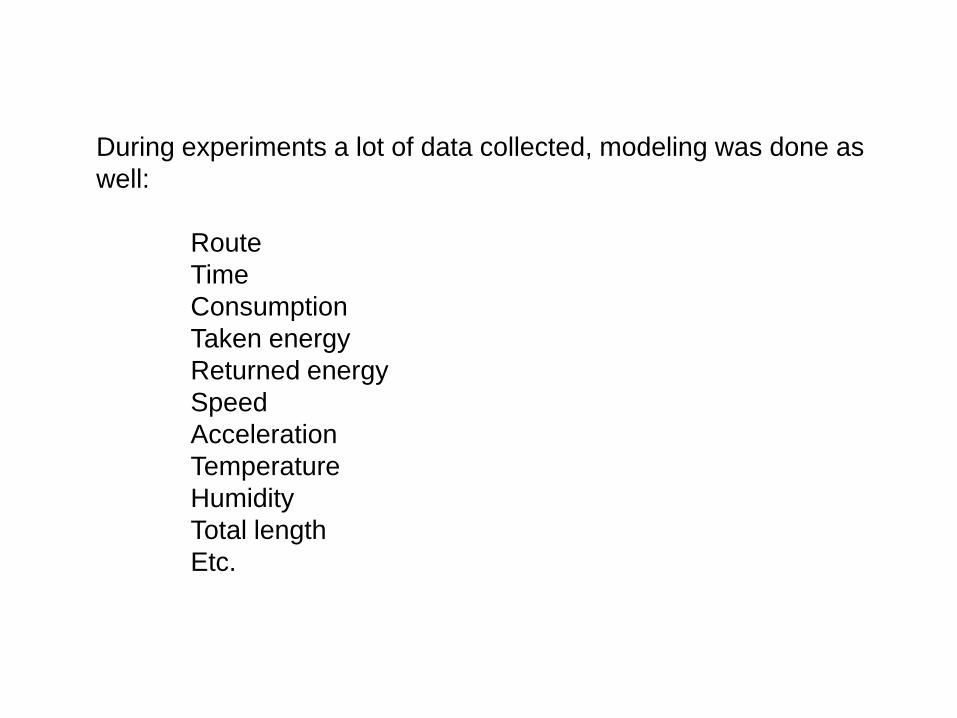
During experiments a lot of data collected, modeling was done as
well:
Route
Time
Consumption
Taken energy
Returned energy
Speed
Acceleration
Temperature
Humidity
Total length
Etc.

Modeling of the first route:
left side – clockwise, speed 39,8 km/h
right side – counterclockwise, speed 36,9 km/h
It can be seen that the number of acceleration and braking cycles is 41,
batteries SOC decreased 6% (in both cases). Electrobus was not
loaded

Modeling of the first route:
left side – clockwise, speed 35,1 km/h
right side – counterclockwise, speed 36,9 km/h
batteries SOC decreased 16% (in both cases). Electrobus was
loaded

Speed dependence on torque, when electrobus was loaded

Frequency dependence on the speed, when electrobus was loaded

Modeling of the route Nr.2:
left side – clockwise, speed 50 km/h
right side – counterclockwise, speed 48,8 km/h
Batteries decreased 6%. 7 times braking happens due to traffic lights
Electrobus was not loaded

Modeling of the route Nr.2:
left side – clockwise, speed 50,9 km/h
right side – counterclockwise, speed 47,1 km/h
Batteries decreased 4%. 6 times braking happens due to traffic lights
Electrobus was loaded

Frequency dependence on the speed; red line, when electrobus was
not loaded, speed is 40-46 km/h, 27% time stops; orange line –
11,8% electrobus stops, speed 34-42 km/h, electrobus was
loaded

Data was collected during all experiments:
Weight (number of passengers);
Time;
600V ir 24V charging;
Weather conditions outside and inside.
DL1 device registered data:
Investigation time on real time;
Acceleration;
CANStudio registered data:
Motors’ rotor:
Number of rotation, RPM;
Torque, Nm;
Temperature of the motor, 0C.
DC\AC invertors:
Current, A;
Voltage, U;
….
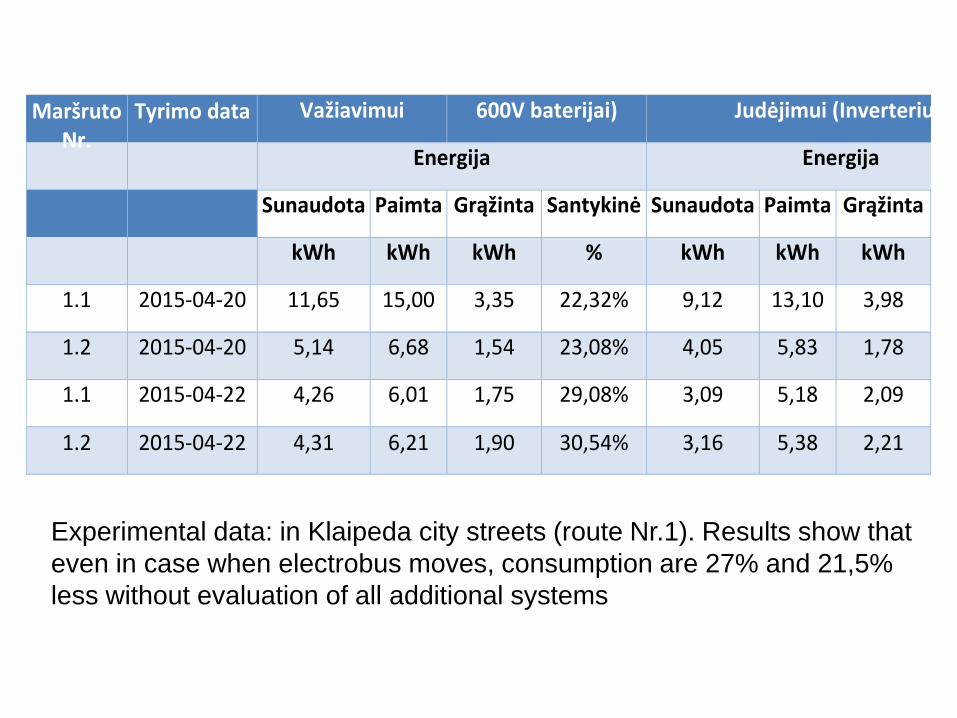
MaršrutoNr.
Tyrimo data Važiavimui 600V baterijai) Judėjimui (Inverteriui)
Nr.Energija Energija
Sunaudota Paimta Grąžinta Santykinė Sunaudota Paimta Grąžinta Santykinė
kWh kWh kWh % kWh kWh kWh %
1.1 2015-04-20 11,65 15,00 3,35 22,32% 9,12 13,10 3,98 30,40
1.2 2015-04-20 5,14 6,68 1,54 23,08% 4,05 5,83 1,78 30,59
1.1 2015-04-22 4,26 6,01 1,75 29,08% 3,09 5,18 2,09 40,33
1.2 2015-04-22 4,31 6,21 1,90 30,54% 3,16 5,38 2,21 41,20
Experimental data: in Klaipeda city streets (route Nr.1). Results show that
even in case when electrobus moves, consumption are 27% and 21,5%
less without evaluation of all additional systems

MaršrutoN r.
Tyrimo data Vidutinisgreitis
Didžiausiaspagreitis
Vidutinėgalia
Energija pagal DL1
įsibėgėjant stabdant Sunaudota Paimta Grąžinta Santykinė
km/h m/s2 m/s2 kW kWh kWh kWh %
1.1 2015-04-20 17,93 1,14 -2,77 13,76 9,09 14,53 5,43 37,41
1.2 2015-04-20 19,21 1,10 -2,23 14,55 4,19 6,84 2,65 38,74
1.1 2015-04-22 21,13 1,34 -2,30 12,00 3,55 5,54 2,00 36,04
1.2 2015-04-22 21,16 1,20 -2,10 12,00 3,59 5,68 2,09 36,85
Experimental data: in Klaipėda city streets (route Nr.1). Results show that
even in case when electrobus moves, consumption are 27% and 21,5%
less without evaluation of all additional systems

Comparison of consumption
When increasing the weight of electrobus, consumption will increase by
40,4% (weight increased by 60,7%)

Results of route Nr 2.1 show that regenerative energy is12,2% ir 14,9%
(fully loaded) and 15,8% and 21,8% (not loaded), respectively, in
comparison to route Nr.2.2; if all other additional systems were not taken
into account it is achieved 13,8% and 5,3% (loaded), 19,0% and 21,3%
(not loaded), routes Nr.2.1 and Nr.2.2.

Electrobus Škoda TR14M in Klaipėda city streets when experiment (photo made by Eglė Šerbinskaitė)

Photos © eglė ščerbinskaitė
A lighter electric city bus through the use of composite materials, integration
of new technological materials into the public transportation, creation a new
generation of city buses, a visionary approach to the automotive industry that
seeks to integrate into the public transportation sphere the original concepts
used in bus design with new technological materials and wind power usage;

Interior of the bus, while engineers test and monitor it (photo made by Eglė
Šerbinskaitė)

MARINE VALLEY OPEN ACCESS RESEARCH INFRASTRUCTURE
IN KLAIPĖDA UNIVERSITY
Laboratory of Marine
Ecosystems
Laboratory of Marine
Chemistry
Laboratory for Research of
Marine Constructions
and their Reliability
Laboratory of Waterborne
Transport Technologies
Research Vessel
50

RESEARCH VESSEL
MODERN EQUIPMENT
