research on relationship between parameters correlation of ... · but those parameters can be used...
TRANSCRIPT

Sensors & Transducers, Vol. 183, Issue 12, December 2014, pp. 147-154
147
© 2014 by IFSA Publishing, S. L. http://www.sensorsportal.com
Research on Relationship Between Parameters Correlation of Acoustic Emission and Rock Failure
* Duan Dong, Zhang Xiangdong, Liu Libin
Taiyuan University of Technology, College of mining technology, Taiyuan, China * E-mail: [email protected]
Received: 14 August 2014 /Accepted: 20 October 2014 /Published: 31 December 2014 Abstract: Analyzes that granite AE signal parameters under uniaxial loading by that way of Pearson linear correlation, research that correlation of characterization parameters within that separate group with various characteristics, and analyzes that relationship between each parameter and destruction. This study shows that: impact, events and ringing are mainly used to describe the damage degree of rock, amplitude characteristics, time characteristics and frequency characteristics are mainly used for acoustic emission source properties, and energy characteristics can not only be used to describe the damage degree of rock, but also be used to analyze the acoustic emission source. That ringing counts are highly interrelated with energy, intensity, duration, RMS and ASL have high correlation, a high correlation is in the three parameters of the energy characteristics, and there is a higher correlation between the two parameters of the timing characteristics. The correlation between the parameters of frequency is very low, and the acoustic emission parameters can't be replaced for each other in analysis, which need separate analysis. Characteristics of ringing and energy can be a very good description of failure, but failure precursors can't be quantized. However, the amplitude, RMS, ASL, can quantify characterization of that precursor of failure, such as the effective voltage value 0.7 V as the precursor of destruction, the emergence of amplitude exceeding 95 dB as that destructive precursor. The relationship between the timing characteristics and damage is not obvious, so you can't use those parameters analysis that fracture of rocks. But those parameters can be used to describe AE source characteristics. The peak frequency, inverse frequency and the center frequency can't reflect AE source characteristics, and that average frequency and initial frequency can reflect AE source characteristics. Copyright © 2014 IFSA Publishing, S. L. Keywords: Acoustic emission, Characterization parameters, Correlation, Damage characterization, Frequency, Acoustic emission source, Pearson linear correlation.
1. Introduction
Acoustic emission is that phenomenon that the strain energy is released in the form of elastic wave when material or component deforms or is damaged [1]. With the constant improvement of acoustic emission technology, the range of applications is increased of through comparison, Mogi [2] studied the acoustic emission sequence characteristics of natural earthquake and rock samples rupture. G. M. Boyce [3] got the historical maximum stress
value in various rock samples with the method of Kaiser effect of rock acoustic emission, and divided that brittle rock into four stages before the failure of rock. Goodman [4] by sandstone uniaxial loading tests found that the Kaiser effect also exists in the rock. C. Li and E. Norfund [5] conducted many experiments to verify the Kaiser effect of rock acoustic emission, and used them to evaluate the damage degree of rock. Zhou Xiaoping [6], through a large number of experiments, obtained the basic law of the cumulative number of AE events and energy
http://www.sensorsportal.com/HTML/DIGEST/P_2556.htm
Sensors & Transducers, Vol. 183, Issue 12, December 2014, pp. 147-154
148
rate, and put forward that it is more accurate to use the energy rate to determine the stage of deformation and failure of rock. Zhao Xingdong [7] through many experiments revealed that inner relationship between characteristics of acoustic emission and rock failure, and went deep into the failure mechanism of rock. Xu Jiang [8] and Zuo Jianping [9] with the way of acoustic emission studied rock damage evolution law of three dimensional space. H. P. Xie [10] studied that bedded salt rock failure with acoustic emission technique and the space evolution of damage. Liu Jianpo [11] researched that process of precut hole rocks failure by those characteristics of spatial and temporal evolution of acoustic emission. Thus, the acoustic emission technique has been widely applied in in-situ stress measurement and rock failure mechanism etc. The application of acoustic emission technique is based on experience or selects several AE parameters habitually to analyze problems, and analysis of other acoustic emission parameters is very limited. In recent years, people found the problem, pay attention to it and research in this area started, such as Zhang Yanbo, Ji Hongguang [12-16] etc., enhanced the research of rock acoustic emission signal energy, and frequency.
In the current study, that minority of acoustic emission characterization parameter is mainly applied to analysis that rock damage, but we know very little about the relationship within the characteristic parameters, which is easy to apply two characteristic parameter with high correlation to analyze the same question and cause repeated study. At the same time, it is also easy to cause study respectively. Therefore, to study the correlation between acoustic emission characterization parameters is instructive in the application of acoustic emission technique for scientific and choosing reasonable characterization parameters.
2. Acoustic Emission Characterization Parameters
There are a lot of acoustic emission characterization parameters and the meaning of each parameter characterization is different. If we want to
research rock damage scientifically and reasonably by the way of acoustic emission technology, it is most important to make the significance of acoustic emission characterization parameters clearly. Hit, events, ringing, amplitude, energy, timing, frequency, etc. are included in acoustic emission signal characterization parameters. The meanings of specific characterization are shown in Table 1.
3. Correlation Analysis to Acoustic Emission Characterization Parameter
3.1. The Production of Experiment
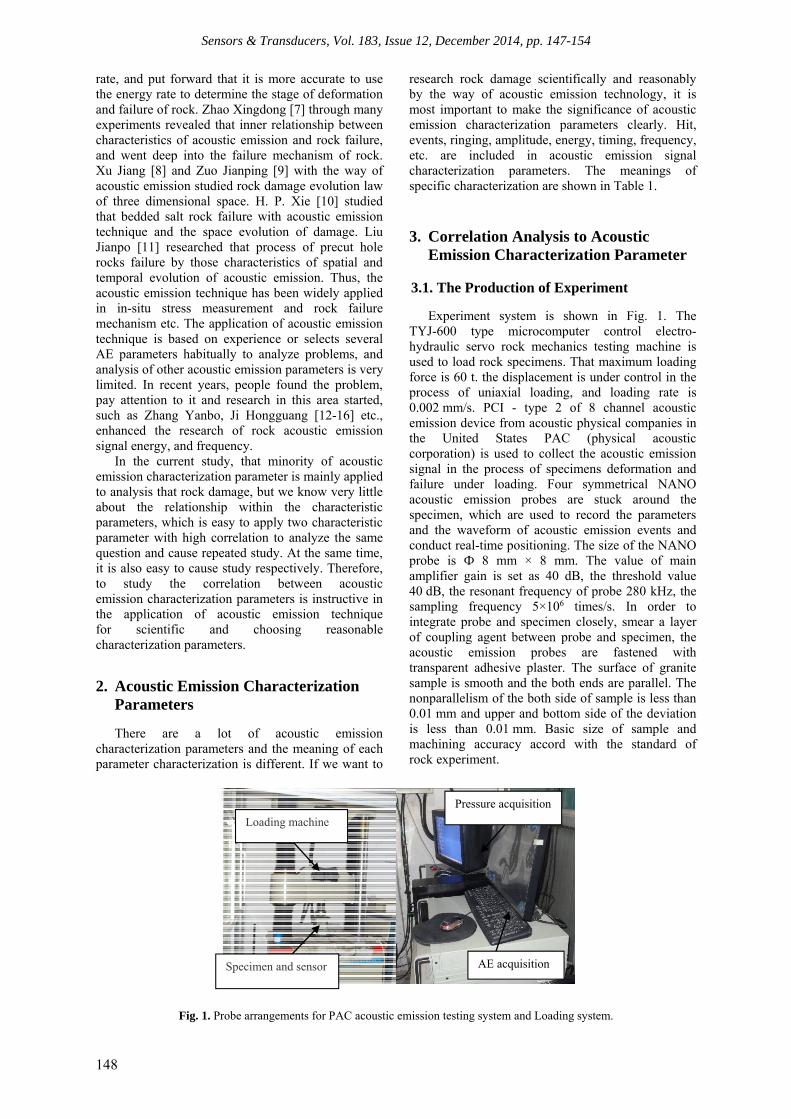
Experiment system is shown in Fig. 1. The TYJ-600 type microcomputer control electro-hydraulic servo rock mechanics testing machine is used to load rock specimens. That maximum loading force is 60 t. the displacement is under control in the process of uniaxial loading, and loading rate is 0.002 mm/s. PCI - type 2 of 8 channel acoustic emission device from acoustic physical companies in the United States PAC (physical acoustic corporation) is used to collect the acoustic emission signal in the process of specimens deformation and failure under loading. Four symmetrical NANO acoustic emission probes are stuck around the specimen, which are used to record the parameters and the waveform of acoustic emission events and conduct real-time positioning. The size of the NANO probe is Ф 8 mm × 8 mm. The value of main amplifier gain is set as 40 dB, the threshold value 40 dB, the resonant frequency of probe 280 kHz, the sampling frequency 5×10⁶ times/s. In order to integrate probe and specimen closely, smear a layer of coupling agent between probe and specimen, the acoustic emission probes are fastened with transparent adhesive plaster. The surface of granite sample is smooth and the both ends are parallel. The nonparallelism of the both side of sample is less than 0.01 mm and upper and bottom side of the deviation is less than 0.01 mm. Basic size of sample and machining accuracy accord with the standard of rock experiment.
Fig. 1. Probe arrangements for PAC acoustic emission testing system and Loading system.
Loading machine
Specimen and sensor
Pressure acquisition
AE acquisition

Sensors & Transducers, Vol. 183, Issue 12, December 2014, pp. 147-154
149
Table 1. Main acoustic emission characterization parameters and application.
Characterization parameter Meaning The characteristics and uses
Hit
Any acoustic emission signal that over the threshold and make a channel date accumulation is called a Hit.
Reflect the total amount and frequency of acoustic emission. It is often used to evaluate activity of acoustic emission.
Event
Regional change which produces acoustic emission in material is called an acoustic emission event.
Reflect the total amount and frequency of acoustic emission events. It is used to evaluate the source of activity and the concentration degree of positioning.
Ringing The times of oscillation crossing the threshold of signal.
It processes signal simply. It is suitable for two kinds of signals, and can roughly reflect the signal strength and frequency, which is widely used in acoustic emission activity evaluation.
Characteristics of amplitude
Amplitude
The maximum vibration amplitude of Signal waveform which is usually expressed in the dB.
Decide measurability of event. It is commonly used to identify the type of wave source, and measure the strength and attenuation
RMS
Root mean square value of signal during the sampling, which is usually expressed in the V.
It is mainly used for continuous acoustic emission activity evaluation.
ASL The mean during the sampling time, which is expressed in the dB.
It is similar to RMS in providing information and USES, and it is particularly useful to continuous signal which acquires high demands of the dynamic range of amplitude and low demands of time resolution. It is also used for measurement of background noise level.
Characteristics of energy
Energy The area below the detection signal envelope line.
Reflect the relative energy or strength. It can replace the ringing count, is also used to identify the type of wave source.
Absoluteenergy
2
0
m
it
TV
R =,Vi represents the
sampling point voltage, ΔT represents sampling interval, m represents sampling in duration, R represents the input impedance of measuring circuit.
An authentic reflection of acoustic emission signal impact energy.
Signal strength 0
m
itT V
= , Vi represents the
sampling point voltage, ΔT represents sampling interval, m represents sampling in duration
Measurement of acoustic emission impact signal energy.
Characteristics of timing
Time of duration
Time interval from event signal first crossing the threshold value back to the threshold value, which is usually expressed in theμs.
It is very similar with ringing count, but often used to identify types of special waves and the noise.
Rising time Time interval from event signal first crossing the threshold value to maximum amplitude.
Its physical meaning is not clear due to the influence of the transmission. It is sometimes used to identify mechanical and electrical noise.
Characteristics of frequency
The average frequency
It is talked about as a complete acoustic emission impact signal, in KHz.
It is associated with ringing count and duration, and can roughly reflect the frequency of the signal.
The initial frequency The frequency in view of duration of the rise time, in KHz.
It is related to the ringing count before the peak and rising time, and It can roughly reflect the frequency of the signal.
Inversefrequency Frequency which is defined in view of the period after the signal peak, in kHz.
It is associated with ringing count, ringing count before peak, duration and rising time. It can roughly reflect the frequency of the signal.
Center frequency The corresponding frequency components of center of gravity in the spectrum.
It can roughly reflect the frequency of the signal.
Peak frequency The corresponding frequency components of the maximum amplitude in the spectrum.
It can roughly reflect the frequency of the signal.

Sensors & Transducers, Vol. 183, Issue 12, December 2014, pp. 147-154
150
3.2. Correlation Analysis of Characterization Parameter
Use the way of the Pearson linear correlation to analyze the data collected in the process of the experiment, and get Pearson correlation coefficient between these parameters. If the correlation coefficient is close to 1, the degree of variables correlation is high. However, if it is close to zero, then the measured variables are almost irrelevant. The positive correlation means that one variable
increases with the increasing of another variable. If it is a negative correlation, then the law is just the opposite. In this article, the absolute value of correlation coefficient is above 0.7, we treat they are highly correlated. If the value between 0.4 to 0.7, it is considered a weak correlation. The value below 0.4 means no correlation. The statistical information of Pearson correlation analysis is shown as Table 2 and the correlation calculation results are shown in Table 3.
Table 2.Statistic data about Pearson correlation analysis.
Parameter feature Quantity of sample
Mean valueThe fitting standard deviation
Sum Minimum Maximum
Ringing characteristic
Ringing count 15169 138.7432 823.7705 2.10E+06 1 8779
Amplitude characteristic
Amplitude 15169 49.75575 10.83369 754745 40 99
RMS 15169 0.05013 0.09062 760.4448 2.00E-04 0.7502
ASL 15169 47.36139 13.40578 718425 10 80
Energy characteristic
Energy 15169 212.2135 2106.66 3.22E+06 0 65535
Absolute energy 15169 1.23E+06 2.19E+07 1.87E+10 0 1.23E+09
Strength of signal 15169 1.34E+06 1.35E+07 2.03E+10 0 4.97E+08
Timing characteristic
Rising time 15169 668.092 4162.974 1.01E+07 0 65506
Duration 15169 2386.546 12563.12 3.62E+07 0 100000
Frequency characteristic
Mean frequency 15169 101.0475 205.5248 1.53E+06 0 1000
Inverse frequency 15169 35.81825 34.6823 543327 0 333
Original frequency 15169 288.033 364.1762 4.37E+06 5 1000
Center frequency 15169 105.0763 15.51119 1.59E+06 39 283
Peak frequency 15169 85.21907 37.30974 1.29E+06 18 180
As shown in Table 3, the ringing count is closely related to energy, signal intensity, and duration, and time distribution is also very similar, as is shown in Fig. 2(a). They can be substituted in the analysis of the acoustic emission parameters which would reduce the workload of analysis. Although there is higher similarity between characteristic parameters, certain difference still exists. For example, some parameters are easy to quantitatively described, but some parameters are more suitable for qualitative analysis. So the parameter selection should be based on the need. To the characteristic parameter for the amplitude characteristic, the correlation between RMS and ASL is high, and time distribution is also very similar, as shown in Fig. 2(b). They can be substituted in the analysis of the acoustic emission parameters, while amplitude requires a separate
analysis. For characterization parameters of timing, the two parameters have higher correlation, and the time distribution is also very similar, as shown in Fig. 2(c). They can be substituted when we analyze acoustic emission parameter. For frequency characterization parameter, the correlation between each parameter is very low. Though there is a relatively high correlation between peak frequency and the center frequency, but its distribution in the time difference is different, as shown in Fig. 2(d). So emission parameters can’t substitute in parameter analysis, and they are needed to be analyzed separately. To the characterization parameters of the energy, there is high correlation between the three parameters, and the time distribution is also very similar, as shown in Fig. 2(e), they can be substituted when we analyze acoustic emission parameter.

Sensors & Transducers, Vol. 183, Issue 12, December 2014, pp. 147-154
151
Table 3. Results of Pearson correlation coefficient of granite acoustic emission.
Parameter feature
Rin
gin
g co
un
t
Am
pli
tud
e
RMS
ASL
En
ergy
Ab
solu
te
ener
gy
Str
engt
h
of s
ign
al
Ris
ing
tim
e
Du
rati
on
Mea
n
freq
uen
cy
Inve
rse
freq
uen
cy
Ori
gin
al f
req
uen
cy
Cen
ter
freq
uen
cy
Pea
k
freq
uen
cy
Ringing characteris-
tic
Ringing count
1.000 0.581 0.267 0.219 0.763 0.472 0.749 0.802 0.975 -0.031 0.127 -0.100 -0.152 -0.076
Amplitude characteris-
tic
Amplitude 1.000 0.224 0.292 0.412 0.249 0.404 0.508 0.610 -0.199 0.300 -0.413 -0.334 -0.118RMS 1.000 0.703 0.251 0.193 0.250 0.207 0.255 -0.033 0.003 -0.083 -0.153 -0.101ASL 1.000 0.164 0.105 0.162 0.196 0.228 -0.070 -0.026 -0.149 -0.286 -0.162
Energy characteris-
tic
Energy 1.000 0.896 0.998 0.556 0.605 -0.016 0.093 -0.060 -0.098 -0.054absolute energy
1.000 0.916 0.310 0.421 -0.008 0.058 -0.033 -0.048 -0.028
Strength of signal
1.000 0.542 0.602 -0.016 0.091 -0.059 -0.095 -0.053
Timing characteris-
tic
Rising time
1.000 0.817 -0.034 0.096 -0.102 -0.163 -0.083
Duration 1.000 -0.040 0.117 -0.114 -0.191 -0.099
Frequency characteris-
tic
Mean frequency
1.000 -0.163 0.460 0.135 0.033
Inverse frequency
1.000 -0.338 0.143 0.189
Original frequency
1.000 0.242 0.078
Center frequency
1.000 0.601
Peak frequency
1.000
(a)
(b)
(c)
(d)
Fig. 2 (a-d). Distribution of characterization parameters in time.
0 50 100 150 200 250
0.0
0.2
0.4
0.6
0.8
1.0
Ringing Energy Signal Strength Duration
Time(s)
-0.2
0.0
0.2
0.4
0.6
0.8
1.0
-0.2
0.0
0.2
0.4
0.6
0.8
1.0
-0.4
-0.2
0.0
0.2
0.4
0.6
0.8
1.0
Sensors & Transducers, Vol. 183, Issue 12, December 2014, pp. 147-154
152
(e)
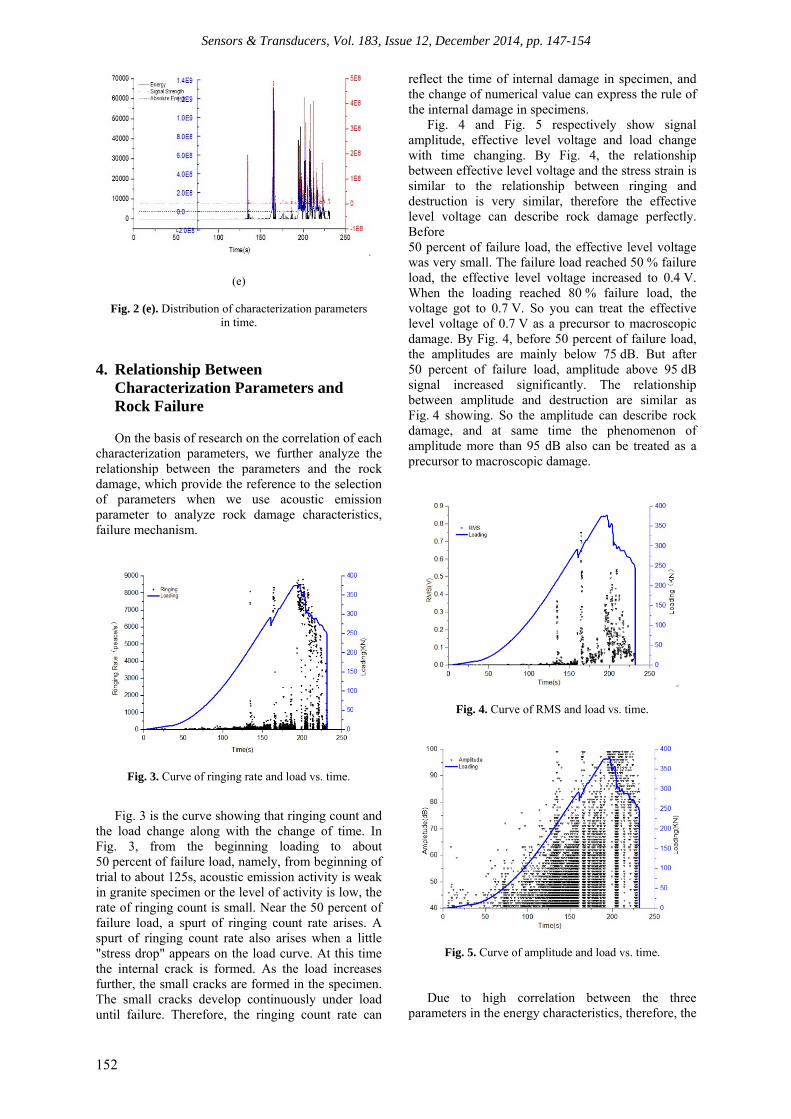
Fig. 2 (e). Distribution of characterization parameters in time.
4. Relationship Between Characterization Parameters and Rock Failure
On the basis of research on the correlation of each
characterization parameters, we further analyze the relationship between the parameters and the rock damage, which provide the reference to the selection of parameters when we use acoustic emission parameter to analyze rock damage characteristics, failure mechanism.
Fig. 3. Curve of ringing rate and load vs. time.
Fig. 3 is the curve showing that ringing count and the load change along with the change of time. In Fig. 3, from the beginning loading to about 50 percent of failure load, namely, from beginning of trial to about 125s, acoustic emission activity is weak in granite specimen or the level of activity is low, the rate of ringing count is small. Near the 50 percent of failure load, a spurt of ringing count rate arises. A spurt of ringing count rate also arises when a little "stress drop" appears on the load curve. At this time the internal crack is formed. As the load increases further, the small cracks are formed in the specimen. The small cracks develop continuously under load until failure. Therefore, the ringing count rate can
reflect the time of internal damage in specimen, and the change of numerical value can express the rule of the internal damage in specimens.
Fig. 4 and Fig. 5 respectively show signal amplitude, effective level voltage and load change with time changing. By Fig. 4, the relationship between effective level voltage and the stress strain is similar to the relationship between ringing and destruction is very similar, therefore the effective level voltage can describe rock damage perfectly. Before 50 percent of failure load, the effective level voltage was very small. The failure load reached 50 % failure load, the effective level voltage increased to 0.4 V. When the loading reached 80 % failure load, the voltage got to 0.7 V. So you can treat the effective level voltage of 0.7 V as a precursor to macroscopic damage. By Fig. 4, before 50 percent of failure load, the amplitudes are mainly below 75 dB. But after 50 percent of failure load, amplitude above 95 dB signal increased significantly. The relationship between amplitude and destruction are similar as Fig. 4 showing. So the amplitude can describe rock damage, and at same time the phenomenon of amplitude more than 95 dB also can be treated as a precursor to macroscopic damage.
Fig. 4. Curve of RMS and load vs. time.
Fig. 5. Curve of amplitude and load vs. time.
Due to high correlation between the three parameters in the energy characteristics, therefore, the
Sensors & Transducers, Vol. 183, Issue 12, December 2014, pp. 147-154
153
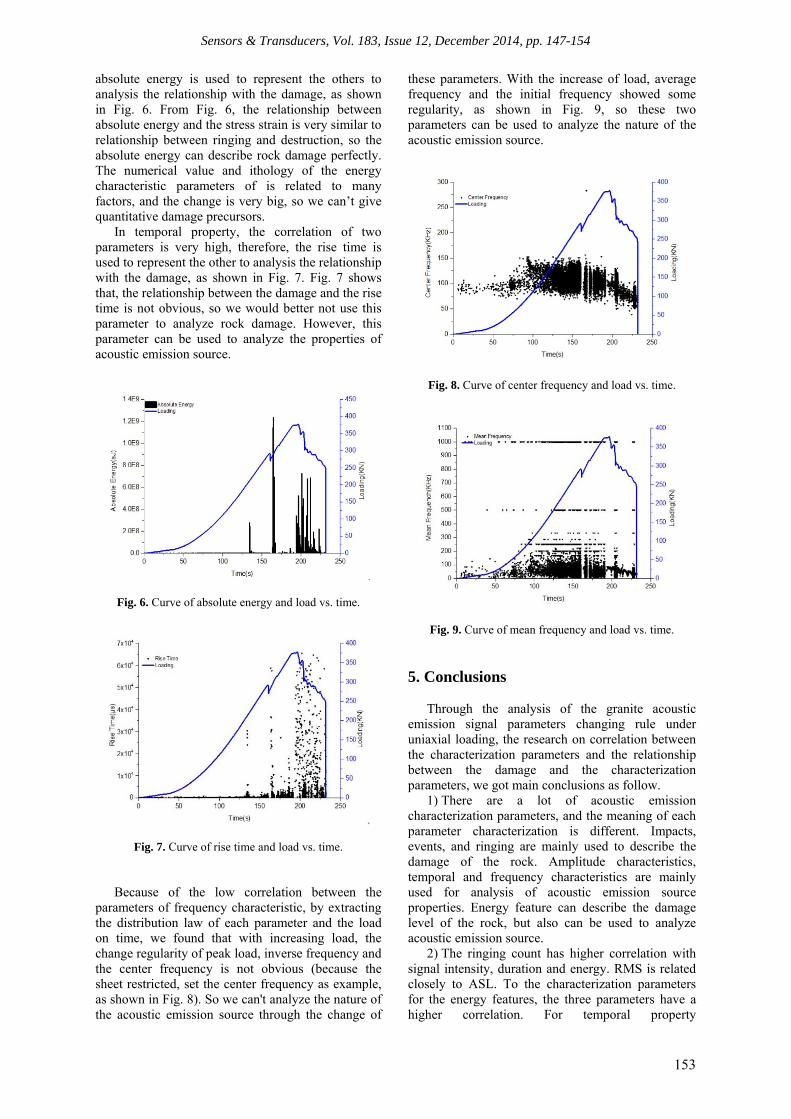
absolute energy is used to represent the others to analysis the relationship with the damage, as shown in Fig. 6. From Fig. 6, the relationship between absolute energy and the stress strain is very similar to relationship between ringing and destruction, so the absolute energy can describe rock damage perfectly. The numerical value and ithology of the energy characteristic parameters of is related to many factors, and the change is very big, so we can’t give quantitative damage precursors.
In temporal property, the correlation of two parameters is very high, therefore, the rise time is used to represent the other to analysis the relationship with the damage, as shown in Fig. 7. Fig. 7 shows that, the relationship between the damage and the rise time is not obvious, so we would better not use this parameter to analyze rock damage. However, this parameter can be used to analyze the properties of acoustic emission source.
Fig. 6. Curve of absolute energy and load vs. time.
Fig. 7. Curve of rise time and load vs. time.
Because of the low correlation between the parameters of frequency characteristic, by extracting the distribution law of each parameter and the load on time, we found that with increasing load, the change regularity of peak load, inverse frequency and the center frequency is not obvious (because the sheet restricted, set the center frequency as example, as shown in Fig. 8). So we can't analyze the nature of the acoustic emission source through the change of
these parameters. With the increase of load, average frequency and the initial frequency showed some regularity, as shown in Fig. 9, so these two parameters can be used to analyze the nature of the acoustic emission source.
Fig. 8. Curve of center frequency and load vs. time.
Fig. 9. Curve of mean frequency and load vs. time. 5. Conclusions
Through the analysis of the granite acoustic emission signal parameters changing rule under uniaxial loading, the research on correlation between the characterization parameters and the relationship between the damage and the characterization parameters, we got main conclusions as follow.
1) There are a lot of acoustic emission characterization parameters, and the meaning of each parameter characterization is different. Impacts, events, and ringing are mainly used to describe the damage of the rock. Amplitude characteristics, temporal and frequency characteristics are mainly used for analysis of acoustic emission source properties. Energy feature can describe the damage level of the rock, but also can be used to analyze acoustic emission source.
2) The ringing count has higher correlation with signal intensity, duration and energy. RMS is related closely to ASL. To the characterization parameters for the energy features, the three parameters have a higher correlation. For temporal property

Sensors & Transducers, Vol. 183, Issue 12, December 2014, pp. 147-154
154
characterization parameters, they have higher correlation. To characteristic parameter with the higher correlation in the group, they can be substituted in the process of acoustic emission parameter analysis, which would reduce the workload analysis. However, for other low correlation parameters in the group, you may need to separate analysis. For the frequency characteristic parameter, the correlation between each parameter is very low, they can’t be substituted each other in parameter analysis of the acoustic emission and they need to be analyzed separately.
3) The ringing and energy characteristics can well describe the damage, but because numerical value and lithology in characteristic parameter are related to many factors, changing range is very large, so we can’t give quantitative damage precursors. However, amplitude, the RMS and ASL can give quantitative characterization, such as the RMS voltage of 0.7 V as the precursor of the destruction, the phenomenon of the amplitude more than 95 dB as an early sign of damage, etc.
The relationship between the damage and temporal characteristics is not obvious, so we would better not use this parameter to analyze rock damage. But we can use this parameter to analyze acoustic emission source properties. Peak frequency, inverse frequency and the center frequency can't reflect the nature of the acoustic emission source, and the average frequency and the initial frequency can reflect the nature of the acoustic emission source.
Acknowledgments
This research is supported by the RFDP (Grant No. 20111402120004), NSFC (Grant No. 51304143), SXNSF (Grant No. 2013021029-2), 12th Five-Year science and technology support program (Grant No. 2012BAB13B04). The authors are grateful for these supports.
References [1]. Miller Ronnie K., McIntire Paul, eds., Acoustic
Emission Testing, Nondestructive Testing Handbook, Second edition, American Society for Nondestructive Testing, Columbus, Vo1. 5, 1987.
[2]. K. Mogi, Study of Elastic Cracks Caused by the Facture of Heterorgengous Materials and its Relationsto Earthquake Phenomena, Bulletin of the Earthquake Research Institute, 40, 1962, pp. 125-173.
[3]. G. M. Boyee, A study of the Acoustic Emission Response of Various Rock Types, Drexel University, 1991, pp. 46-70.
[4]. R. E. Goodman, Subaudible Moise During
Compression of Rock, Geo. Soc. Am. Bull, 74, 1963, pp. 487-490.
[5]. Li C., Norlund E., Assessment of Damage in Rock by the Kaiser Effect of Acoustic Emission, Int. J. Rock Mech. Min. Sci. Geomech. Abstr., 30, 7, 1993, pp. 943-946.
[6]. Xiaoping Zhou, Qiuling Ha, Yongxing Zhang, Keshan Zhu, Analysis of the localization of deformation and study on the complete stress-strain relation for brittle rock subjected to dynamic compressive loads, International Journal of Rock Mechanics and Mining Science, 41, 2, 2004, pp. 311-319.
[7]. Zhao Xingdong, Li Yuanhui, Liu Jianpo, Zhang Jian, Zhu Wancheng, etc., Research on rock failure process based on the acoustic emission and its positioning technology, Journal of Rock Mechanics and Engineering, 27, 5, 2008, pp. 990-995.
[8]. Xu Jiang, Tang Xiaojun, Li Shucun, Tao Yunqi, Jiang Yongdong, etc., The space-time evolution of rock acoustic emission under cyclic loading, Journal of Chongqing University, 31, 6, 2008, pp. 672–677.
[9]. Zuo Jianping, Pei Jianliang, Liu Jianfeng, Peng Ruidong, Li Yuechun, etc., The acoustic emission behavior and space-time evolution mechanism In the process of the fracture of coal or rock, Journal of Rock Mechanics Engineering, 30, 8, 2011, pp. 1564-1571.
[10]. H. P. Xie, J. F. Liu, Y. Ju, et al., Fractal property of spatial distribution of acoustic emissions during the failure process of bedded rock salt, International Journal of Rock Mechanics & Mining Sciences, 48, 2011, pp. 1344–1351.
[11]. Liu Jianpo, Xu Shida, Li Yuanhui, Dong Longbin, Wei Jiong, The acoustic emission temporal and spatial evolution characteristics study in the process of prefabricated hole rock damage, Journal of Rock Mechanics and Engineering, 31, 12, 2012, pp. 2538–2547.
[12]. Zhang Yanbo, Huang Xioahong, Li Sasa, etc., The spectrum characteristics analysis of the water-bearing sandstone in the process of damage, Rock and Soil Mechanics, 34, 6, 2013, pp. 1574-1579.
[13]. Li Qi-Yue, Dong Long-Jun, Li Xi-Bing, Effects of sonic speed on location accuracy of acoustic emission source in rocks, Transactions of Nonferrous Metals Society of China, 21, 12, 2011, pp. 2719-2726.
[14]. Ling Tonghua, Zhang Sheng, Yi Zhiqiang, etc., The EMD analysis of the rock acoustic emission signal energy distribution characteristic, Journal of Vibration and Shock, 31, 11, 2012, pp. 26-31.
[15]. Gong Yuxin, He Manchao, Wang Zhenghong, etc., The research on rock damage acoustic emission time-frequency analysis algorithm and instantaneous frequency precursory, Journal of Rock Mechanics and Engineering, 32, 4, 2013, pp. 0787-0800.
[16]. Ji Hongguang, Wang Hongwei, Cao Shanzhong, etc., Granite acoustic emission signal frequency characteristics experimental study under the condition of uniaxial compression, Journal of Rock Mechanics and Engineering, 31, 1, 2013, pp. 2900-2906.
___________________
2014 Copyright ©, International Frequency Sensor Association (IFSA) Publishing, S. L. All rights reserved. (http://www.sensorsportal.com)