research on the effect of the inner resilience program … · final report . acknowledgements the...
TRANSCRIPT
90 Broad Street Suite 1200 New York, New York 10004 212-425-8833 www.metisassociates.com
mak
ing
a m
eani
ngfu
l diff
eren
ce
March 2009
S U B M I T T E D T O
Linda Lantieri, Director of the Inner Resilience Program Charlotte Malkmus, Deputy Director of Programs
S U B M I T T E D B Y
Al Simon, Ph.D., Senior Vice PresidentSusanne Harnett, Ph.D., Senior Associate
Eden Nagler, Research AssociateLatisha Thomas, Research Assistant
Research on the Effect of the Inner Resilience Program
on Teacher and Student Wellness and Classroom Climate
Final Report

Acknowledgements The authors wish to acknowledge the following for their support on this report:
• The research participants, including teachers, students, and administrators, for their invaluable participation, their patience and interest in the program, and their thoughtful responses;
• The research funder, the Fetzer Institute, for its generous contributions to this research project and for moving the field as a whole forward;
• The Inner Resilience Program staff, especially Linda Lantieri, Charlotte Malkmus, Dragica Mikavica, and Dana McCloskey, for their input, ideas, support, and prompt responses to data requests;
• Mark Greenberg, Patricia Jennings, and Nancy Carlsson-Paige for their thoughtful review and insightful contributions;
• Metis’s internal staff, including Stan Schneider, Michael Scuello, and Melissa McCormick for their contributions and editing support.
Abstract ................................................................................................................................................................i
Executive Summary .................................................................................................................................... ii-xiv
I. Introduction
Literature Review..................................................................................................................................1
Background on the Inner Resilience Program .................................................................................3
Support for Research of the Inner Resilience Program..................................................................3
Research Overview...............................................................................................................................3
Intervention...........................................................................................................................................4
II. Methods
Participants ............................................................................................................................................7
Recruitment ....................................................................................................................................7
Teacher Characteristics .................................................................................................................7
Student Characteristics............................................................................................................... 10
Measures ............................................................................................................................................. 13
Teachers ....................................................................................................................................... 13
Teacher Wellness Survey.............................................................................................. 13
Holmes-Rahe Life Stress Inventory ........................................................................... 16
Classroom Climate Inventory, Teacher Version ...................................................... 17
Treatment Teacher Focus Group............................................................................... 18
Students........................................................................................................................................ 18
Student Wellness Survey .............................................................................................. 18
Classroom Climate Inventory, Student Version....................................................... 20
Procedures ................................................................................................................................... 21
III. Results of Between Group Analyses (Treatment vs. Control) .......................................................... 23
Teacher Wellness Results ................................................................................................................. 23
Classroom Climate Results............................................................................................................... 25
Student Wellness Results.................................................................................................................. 25
IV. Results of Within Group Analyses (Treatment Only) ........................................................................ 27
Teachers Perceptions of Program Impact ..................................................................................... 27
Personal Well-Being...................................................................................................... 27
Professional Well-Being ............................................................................................... 28
Classroom and School Envrionment ......................................................................... 28
Students .......................................................................................................................... 29
Differential Effects for "High Impact" and "Non-High Impact" Teachers ............................ 30
Differential Effects for "High-Risk" and "Non-High Risk" Students ...................................... 34
V. Summary and Discussion
Summary ............................................................................................................................................. 36
Discussion .......................................................................................................................................... 38
Limitations.......................................................................................................................................... 39
Suggestions for Further Research ................................................................................................... 40
References
Appendix A: Detailed tables of participating teacher data
Appendix B: Analyses of differences between 3rd- 4th and 5th grade teachers on stress
measures
Appendix C: Participating teachers by treatment group
Appendix D: Detailed tables of participating student data
Appendix E: Complete teacher wellness survey
Appendix F: Life Stress Inventory fall and spring total scores, by group
Appendix G: Boxplots of participants’ responses to the life stress inventory at pre- and post
survey
Appendix H: Treatment teacher focus group protocol
Appendix I: Repeated measures ANOVA results for between group analyses
Appendix J: Repeated measures ANOVA results for high impact vs. non-high impact
analyses
Appendix K: Repeated measures ANOVA results for high risk vs. non-high risk students

Abstract
This study used a randomized control trial design to examine the impact of the Inner Resilience Program on the well-being of teachers and students, as well as on the climate of their classrooms. A total of 57 teachers of Grades 3–5 from NYC public schools participated in the study, with 29 teachers (and their students) randomly assigned to the treatment group and 28 teachers and their students randomly assigned to the control group. Teachers in the treatment group participated in the Inner Resilience Program during the 2007–2008 school year. Activities were intended to reduce teacher stress and increase their concentration, attention, and job satisfaction; as well as improve relationships with their colleagues. Specifically, activities included a series of weekly yoga classes, monthly Nurturing the Inner Life meetings, a weekend residential retreat, and training and support in the use of a curriculum module for students. It was theorized that changes in the teachers would have a positive influence on the climate of their classrooms, which, in turn, would affect students’ wellness with regard to stress and frustration levels, attention, and acting out behaviors. In addition, the program was intended to reach students directly through curriculum activities.
Teachers from the treatment and control groups completed a battery of surveys in the fall and
spring of the 2007–2008 school year. Treatment teachers also completed survey questions that asked them about their perceptions of the effects of the program, and a sample of treatment teachers participated in an end-of-year focus group. Analyses examined differences between treatment and control group participants on all measured outcomes, as well as differential effects within the treatment group.
Between-group analyses indicated several interesting and statistically significant results with regard
to teacher wellness, including reduced stress levels (as measured by one scale), increased levels of attention and mindfulness, and greater perceived relational trust among treatment teachers. Additionally, 3rd-grade students of treatment teachers perceived that they had significantly more autonomy and influence in their classes at the end of the school year than at the beginning, and analyses of student wellness indicated that the program had a significant, positive impact on reducing 3rd- and 4th-grade students’ frustration levels.
Within-group analyses examined two separate questions: 1) did treatment teachers who perceived
that the treatment had high impact in their lives actually demonstrate greater change on outcome measures than teachers who did not perceive as great an impact? and 2) did the program have greater effect on treatment teachers’ students who were categorized as “high risk” based on their pre-survey scores than on students who were not categorized as such? It was found that high-impact teachers demonstrated reductions in emotion-oriented coping skills (which are emotional reactions that often only increase, rather than reduce, stress), fatigue/secondary trauma (pleasure that individuals get through their work), and emotional exhaustion and increases in mindfulness and compassion satisfaction compared to non-high-impact teachers. Also, high-impact teachers perceived that their classes had greater autonomy and influence, and students of these teachers perceived greater classroom supportiveness than students of non-high-impact teachers. Students of high-impact teachers were lower in frustration but also lower in perceptual sensitivity than non-high-impact teachers. Analyses of high-risk students indicated that 3rd- and 4th-grade high-risk students showed greater positive change than their non-high-risk peers on each of the student wellness outcomes, and 5th-grade high-risk students showed greater positive change on nearly all student wellness outcomes compared with the non-high-risk students. Although two statistical phenomena—“restriction of range” and “regression to the mean”—must be considered when evaluating these results, they are highly notable and merit additional research.
i
Executive Summary
Background
Teachers often face a variety of stresses, such as heavy workloads, relative isolation from
their colleagues, time constraints, emphasis on academic achievement testing, low decision-making power, and frequent lack of support from their superiors and peers (Byrne, 1993; Murray, 2005; Winzelberg and Luskin, 1999). Given the stresses that they face and the little support that they receive to address these challenges, it is not surprising that teachers respond with common physiological, emotional, and behavioral manifestations of stress (Winzelberg and Luskin, 1999), or by leaving the profession altogether. Those who stay are at risk of developing another serious problem: teacher burnout, a multi-dimensional construct that consists of emotional exhaustion, depersonalization, and reduced personal accomplishment (Maslach, Jackson, & Leiter, 1997). Burnout occurs when teachers have attempted unsuccessfully to cope with stress over long periods of time (Kyriacou, 2001). Teacher burnout can be tremendously destructive to teacher-student relationships, classroom management, and the classroom environment, as well as on the health of individual students (Jennings and Greenberg, 2008).
Studies of stress reduction across multiple sectors have suggested that some programs can be
effective in reducing participants’ perceived and demonstrated stress and can break cycles, such as the “burnout cascade.” Research has also shown that mindfulness is associated with more positive affect, reduced anxiety and depression, and better relationships with others (Brown & Ryan, 2003; Barnes, Brown, Krusemark, Campbell, & Rogge, 2007). Consequently, these changes in teachers’ mind sets can have a positive impact on classroom climate. Indeed, Marzano and colleagues (2003) conducted a meta-analysis of more than 100 studies of classroom management and found that a teacher’s “mental set” had the greatest effect on reducing student misbehavior. Teachers who were able to remain objective and calm under pressure were the best behavior managers.
The current study furthers the work begun by the studies described above and examines the
effect of the Inner Resilience Program1 on teachers and their students. This study considers mounting evidence of the need to reduce teacher stress and increase their well-being in an effort to retain good teachers and ensure optimal performance of both teachers and their students. The study considers not only the effect of the program on teachers but also on their classroom environments and on their students. The Inner Resilience Program
The Inner Resilience Program was established in February 2002 in response to the effects of the events of September 11, 2001, on educators and students in lower Manhattan. It soon became clear that the program, which offers teachers transformative professional development designed to nurture the social, emotional, and inner lives of teachers and students, is needed by teachers throughout New York City (NYC) and beyond. In spring 2006, the Inner Resilience Program received generous funding from the Fetzer Institute to conduct rigorous research using a randomized control trial to examine the impact of the program on teachers and their students.
1 Formerly called Project Renewal, a Project of the Tides Center.
ii
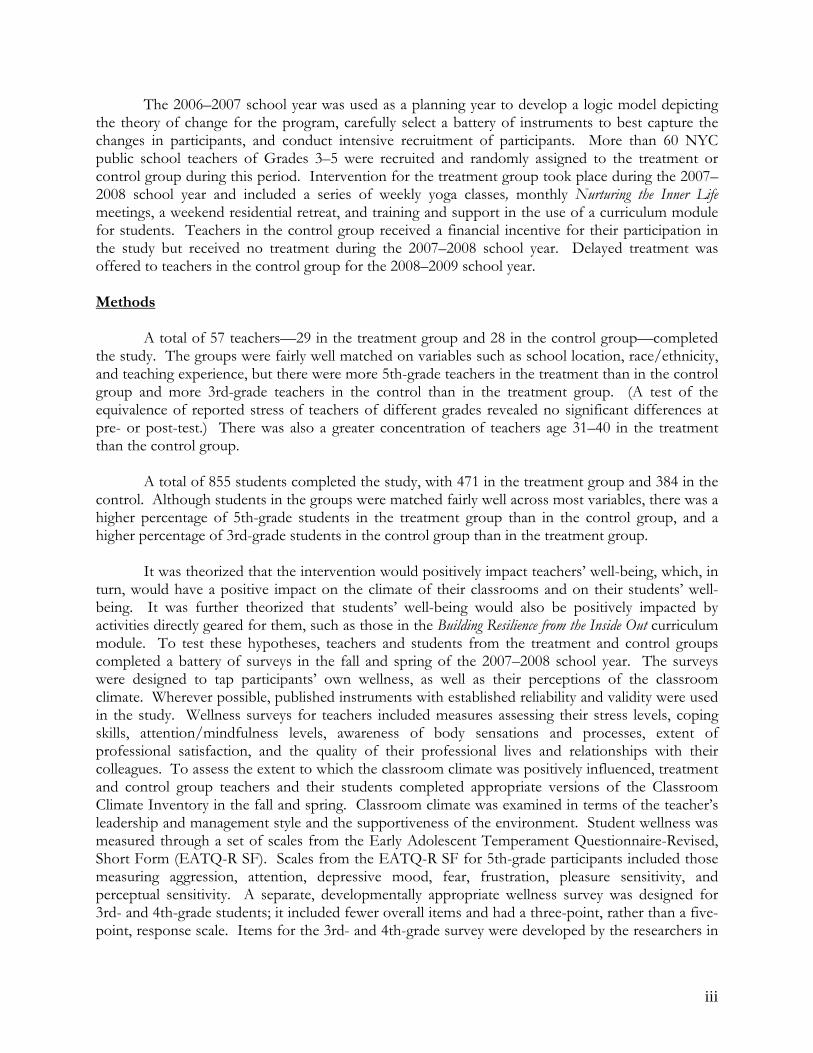
The 2006–2007 school year was used as a planning year to develop a logic model depicting the theory of change for the program, carefully select a battery of instruments to best capture the changes in participants, and conduct intensive recruitment of participants. More than 60 NYC public school teachers of Grades 3–5 were recruited and randomly assigned to the treatment or control group during this period. Intervention for the treatment group took place during the 2007–2008 school year and included a series of weekly yoga classes, monthly Nurturing the Inner Life meetings, a weekend residential retreat, and training and support in the use of a curriculum module for students. Teachers in the control group received a financial incentive for their participation in the study but received no treatment during the 2007–2008 school year. Delayed treatment was offered to teachers in the control group for the 2008–2009 school year. Methods
A total of 57 teachers—29 in the treatment group and 28 in the control group—completed the study. The groups were fairly well matched on variables such as school location, race/ethnicity, and teaching experience, but there were more 5th-grade teachers in the treatment than in the control group and more 3rd-grade teachers in the control than in the treatment group. (A test of the equivalence of reported stress of teachers of different grades revealed no significant differences at pre- or post-test.) There was also a greater concentration of teachers age 31–40 in the treatment than the control group.
A total of 855 students completed the study, with 471 in the treatment group and 384 in the
control. Although students in the groups were matched fairly well across most variables, there was a higher percentage of 5th-grade students in the treatment group than in the control group, and a higher percentage of 3rd-grade students in the control group than in the treatment group.
It was theorized that the intervention would positively impact teachers’ well-being, which, in
turn, would have a positive impact on the climate of their classrooms and on their students’ well-being. It was further theorized that students’ well-being would also be positively impacted by activities directly geared for them, such as those in the Building Resilience from the Inside Out curriculum module. To test these hypotheses, teachers and students from the treatment and control groups completed a battery of surveys in the fall and spring of the 2007–2008 school year. The surveys were designed to tap participants’ own wellness, as well as their perceptions of the classroom climate. Wherever possible, published instruments with established reliability and validity were used in the study. Wellness surveys for teachers included measures assessing their stress levels, coping skills, attention/mindfulness levels, awareness of body sensations and processes, extent of professional satisfaction, and the quality of their professional lives and relationships with their colleagues. To assess the extent to which the classroom climate was positively influenced, treatment and control group teachers and their students completed appropriate versions of the Classroom Climate Inventory in the fall and spring. Classroom climate was examined in terms of the teacher’s leadership and management style and the supportiveness of the environment. Student wellness was measured through a set of scales from the Early Adolescent Temperament Questionnaire-Revised, Short Form (EATQ-R SF). Scales from the EATQ-R SF for 5th-grade participants included those measuring aggression, attention, depressive mood, fear, frustration, pleasure sensitivity, and perceptual sensitivity. A separate, developmentally appropriate wellness survey was designed for 3rd- and 4th-grade students; it included fewer overall items and had a three-point, rather than a five-point, response scale. Items for the 3rd- and 4th-grade survey were developed by the researchers in
iii

collaboration with program personnel from six of the original EATQ-R SF scales, including: aggression, attention, depressive mood, fear, frustration, and perceptual sensitivity.
Treatment teachers also completed end-of-year surveys about the impact of the program on
their personal and professional lives, their classroom environments, and on the students in their classes. Furthermore, a sample of teachers from the treatment group participated in an end-of-year focus group to provide more detailed insights into the impact of the program. Results of Between-Group Analyses (Treatment vs. Control)
To test whether there were differences between pre- and post-survey means and between the means of treatment and control participants, repeated measures analysis of variance (ANOVA) tests were conducted. Repeated measures ANOVAs examine the equality of means across conditions and time. Specifically, three questions can be answered by these analyses: (1) Do mean responses change across time points (pre vs. post)? (2) Do mean responses differ across groups (treatment vs. control)? and (3) Does the change in mean response across time points (pre/post) depend on group (treatment, control)? In addition to testing for statistical significance, differences between the groups over time were tested for meaningfulness; that is, whether the differences matter on a practical level. The extent to which differences are considered meaningful is expressed through a statistic termed “effect size” (also called Cohen’s d) (Cohen, 1992). Effect size is calculated by measuring the magnitude of the gains or losses, expressed in gain score standard deviation units. A gain of more than 1/3 of a standard deviation (i.e., an effect size of more than 0.33 or less than –0.33) is usually considered meaningful.
Teacher Wellness Results Table ES1 shows the results of analyses conducted on pre- and post-surveys measuring
teachers’ wellness. Treatment teachers’ mean scores changed from pre to post in the predicted direction on 13 of the 15 measured wellness qualities.2 Furthermore, repeated measures analyses indicate that the program had a statistically significant and meaningful impact on reducing treatment group teachers’ stress levels (as measured by one scale), increasing their levels of attention and mindfulness, and strengthening their relational trust with their colleagues. Although not all differences between the treatment and control groups achieved statistical significance, it is notable that the great majority of changes in the treatment group are in the predicted direction. Also, several of the changes that were not statistically significant were considered meaningful (e.g., stress as measured by the Perceived Stress Scale, body awareness, emotion-oriented coping, avoidance-oriented coping via distraction, and burnout) as indicated by the effect size statistic. This indicates that these differences, although not statistically significant, are considered meaningful according to Cohen’s d. It is possible that many more of the differences between the treatment and control groups would have achieved statistical significance if the study had greater power, which might be obtained by having more participants, instruments that more closely measure the construct that is affected, and/or intervention of a longer duration. It should also be noted that some differences between the treatment and control group teachers, such as age and the stressors that they had in their life before and over the course of the study, may account for the fact that treatment effects were not even stronger. 2 One quality, Avoidance-Oriented Coping, contains both adaptive and non-adaptive qualities; therefore, no predictions were made regarding this quality.
iv

Table ES 1 Teacher Wellness Qualities Measured and Results
Wellness Quality Measured Scale3
Treatment Group Mean (SD)
Control Group Mean (SD)
Test of Significance
for Interaction
(time*group)
Test of Meaningfulness
for Interaction
(Effect Size)
Stress Stress Likert Scale Pre = 5.12 (1.03) Post = 4.54 (1.36)
Pre = 4.61 (1.42) Post = 5.11 (1.13)
F=6.592, p=.013*
0.71
Stress PSS Pre = 22.89 (6.17) Post = 17.43 (6.88)
Pre = 22.48 (7.07) Post = 19.59 (6.00)
F=1.470 p=.231
0.33
Body Awareness BAQ Pre = 4.41 (1.03) Post = 4.92 (1.04)
Pre = 4.22 (0.98) Post = 4.37 (1.14)
F=1.649 p=.205 0.35
Task-Oriented Coping CISS Pre = 55.93 (6.84) Post = 58.21 (7.36)
Pre = 58.75 (8.44) Post = 59.18 (7.15)
F=1.142 P=.290 0.29
Emotion-Oriented Coping CISS Pre = 48.03 (9.26)
Post = 40.68(10.34) Pre = 47.86 (9.62)
Post = 45.29 (11.40) F=3.803 p=.056 0.53
Avoidance-Oriented Coping CISS Pre = 52.71 (9.41)
Post = 52.43 (6.69) Pre = 48.68 (10.11) Post = 49.43 (10.57)
F=0.244 p=.624 0.13
Avoidance Coping via Distraction CISS Pre = 24.93 (5.47)
Post = 23.86 (5.01) Pre = 22.39 (5.99) Post = 23.00 (6.37)
F=1.760 p=.190 0.36
Avoidance Coping via Social Diversion CISS Pre = 18.89 (4.76)
Post = 19.64 (2.50) Pre = 17.75 (4.77) Post = 17.93 (5.44)
F=0.279 p=.600 0.14
Mindfulness MAAS Pre = 3.64 (0.61) Post = 4.20 (0.48)
Pre = 3.74 (0.82) Post = 3.80 (0.84)
F=8.879 p=.004*
0.81
Compassion Satisfaction ProQol Pre = 35.93 (6.77) Post = 35.29 (8.44)
Pre = 33.70 (7.49) Post = 34.19 (8.66)
F=0.284 p=.596 0.14
Burnout ProQol Pre = 28.61 (4.52) Post = 24.21 (5.80)
Pre = 26.89 (6.00) Post = 24.74 (5.40)
F=2.147 p=.149 0.40
Fatigue/Secondary Trauma ProQol Pre = 18.93 (5.44)
Post = 15.57 (5.29) Pre = 16.96 (6.62) Post = 13.89 (4.91)
F=0.030 p=.864 0.06
Emotional Exhaustion MBI-ES Pre = 31.07 (8.93) Post = 24.86 (12.18)
Pre = 29.11 (12.24) Post = 25.15 (12.27)
F=0.523 p=.473 0.20
Personal Accomplishment MBI-ES Pre = 35.50 (7.61)
Post = 37.14 (6.29) Pre = 31.48 (9.50) Post = 34.15 (7.97)
F=0.239 p=.627 0.13
Depersonalization MBI-ES Pre = 8.11 (6.17) Post = 8.21 (7.34)
Pre = 8.67 (6.82) Post = 9.59 (8.31)
F=0.207 p=.651 0.13
Relational Trust Bryk’s Teacher-to-Teacher Trust Scale
Pre = 1.17 (0.86) Post = 1.27 (0.79)
Pre = 1.30 (0.75) Post = 1.07 (0.75)
F=4.374 p=.041*
0.57
* indicates p<.05 based on results of repeated measures ANOVA tests Classroom Climate Results Table ES2 displays results of classroom climate analyses. Changes in classroom climate were
assessed through the perceptions of both participating teachers and their students. Treatment teachers’ mean scores changed from pre to post in the predicted direction on both of the measured classroom climate aspects. Furthermore, 3rd- and 4th-grade students of treatment teachers perceived a statistically significant and meaningfully greater increase in 3 PSS=Perceived Stress Scale; BAQ=Body Awareness Questionnaire; CISS=Coping Inventory for Stressful Situations; MAAS=Mindfulness Attention Awareness Scale; ProQol=Professional Quality of Life Scale; MBI-ES=Maslach Burnout Inventory-Educator Survey
v

their levels of autonomy and influence from pre to post than the 3rd- and 4th-grade students of control teachers. Nearly all teachers in the treatment group perceived that the program positively affected their teaching (93%) and their classroom environment (89%), and differences between treatment and control teachers’ scores on the subsections of the Classroom Climate Survey were in the predicted direction. However, results regarding classroom climate changes may need further investigation. Teachers’ perceptions of changes in their classrooms point to a stronger change than what was noted through the pre- and post-surveys. It may be that the surveys do not adequately assess the changes that occurred. It also may be that the duration and strength of the intervention needs to be increased for changes to be noticeable on the classroom climate inventories. Furthermore, future research designs could be strengthened by using impartial observers who visit a sample of classrooms multiple times over the course of the school year to determine whether there are changes in the climate.
Table ES 2
Classroom Climate Qualities Measured and Results
Classroom Climate Quality Measured Scale
Treatment GroupMean (SD)
Control Group Mean (SD)
Test of Significance
for Interaction
(time*group)
Test of Meaningfulness
for Interaction
(Effect Size) Teachers’ Perspective
Student Autonomy and Influence
Classroom Climate Inventory (Teachers)
Pre = 2.07 (0.33) Post = 2.26 (0.53)
Pre = 1.91 (0.40) Post = 2.02 (0.44)
F=1.161 p=.286 0.29
Classroom Supportiveness Classroom Climate Inventory (Teachers)
Pre = 2.71 (0.47) Post = 2.79 (0.73)
Pre = 2.59 (0.59) Post = 2.62 (0.59)
F=0.081 p=.776 0.09
3rd- and 4th-Grade Students’ Perspective Student Autonomy and
Influence
Classroom Climate Inventory (3rd-4th
Grade)
Pre = 1.66 (0.37) Post = 1.78 (0.42)
Pre = 1.64 (0.37) Post = 1.60 (0.37)
F=24.310 p<.001* 0.41
Classroom Supportiveness Classroom Climate Inventory (3rd-4th
Grade)
Pre = 2.34 (0.38) Post = 2.28 (0.40)
Pre = 2.21 (0.40) Post = 2.11 (0.41)
F=1.485 p=.223 0.11
5th-Grade Students’ Perspective Student Autonomy and
Influence Classroom Climate
Inventory (5th Grade)Pre = 1.51 (0.66) Post = 1.45 (0.58)
Pre = 1.88 (0.54) Post = 1.85 (0.51)
F=0.098 p=.755 <0.01
Classroom Supportiveness Classroom Climate Inventory (5th Grade)
Pre = 2.16 (0.72) Post = 1.94 (0.79)
Pre = 2.92 (0.65) Post = 2.63 (0.78)
F=0.419 p=.518 0.09
* indicates p<.05 based on results of repeated measures ANOVA tests Student Wellness Results Table ES3 displays results of student wellness analyses. The mean scores of 3rd- and 4th-
grade students of treatment teachers changed from pre to post in the predicted direction on three of the six measured wellness aspects, and mean scores of 5th-grade students of treatment teachers changed in the predicted direction on four of the seven measured wellness aspects. Furthermore, 3rd- and 4th-grade students of treatment teachers experienced significant reductions in their frustration levels from pre to post compared to the 3rd- and 4th-grade students of control teachers, though this difference was not considered meaningful.
vi

When considering results from analyses of student wellness, it is interesting to note that the 5th-grade students in the treatment group were higher in aggression, depressive mood, and frustration, and lower in attention and pleasure sensitivity than the control group students at both pre- and post-survey. The fact that there was a considerably higher percentage of 5th-grade students in the treatment group than in the control group, and that they were different across multiple dimensions, may account for the fact that treatment effects were not stronger. Additionally, it should be considered that the duration and strength of treatment may need to be increased to see certain changes in student wellness across all grades. That is, treatment may need to be introduced at the beginning of the school year rather than mid-year, and it may take more time for changes in teachers’ wellness to reach the classroom and impact individual students.
Table ES 3
Student Wellness Qualities Measured and Results
Wellness Quality Measured Scale4
Treatment Group
Mean (SD) Control Group
Mean (SD)
Test of Significance
for Interaction
(time*group)
Test of Meaningfulness
for Interaction
(Effect Size) 3rd- and 4th-Grade Students
Aggression EATQ-R SF Pre = 1.40 (0.42) Post = 1.44 (0.43)
Pre = 1.56 (0.53) Post = 1.60 (0.52)
F=0.004 p=.949 <0.01
Attention EATQ-R SF Pre = 1.77 (0.26) Post = 1.76 (0.26)
Pre = 1.73 (0.33) Post = 1.75 (0.30)
F=0.362 p=.547 0.06
Depressive Mood EATQ-R SF Pre = 1.68 (0.48) Post = 1.68 (0.49)
Pre = 1.75 (0.53) Post = 1.71 (0.53)
F=1.142 p=.286 0.09
Fear EATQ-R SF Pre = 2.22 (0.45) Post = 2.15 (0.51)
Pre = 2.22 (0.51) Post = 2.14 (0.50)
F=0.054 p=.817 <0.01
Frustration EATQ-R SF Pre = 2.05 (0.47) Post = 1.99 (0.47)
Pre = 2.12 (0.47) Post = 2.15 (0.50)
F=4.854 p=.028* 0.18
Perceptual Sensitivity EATQ-R SF Pre = 2.31 (0.57) Post = 2.36 (0.58)
Pre = 2.27 (0.59) Post = 2.37 (0.57)
F=0.680 p=.410 0.06
5th-Grade Students
Aggression EATQ-R SF Pre = 1.45 (0.84) Post = 1.36 (0.80)
Pre = 0.91 (0.71) Post = 0.78 (0.63)
F=0.242 p=.623 0.06
Attention EATQ-R SF Pre = 3.06 (0.49) Post = 3.02 (0.52)
Pre = 3.28 (0.54) Post = 3.35 (0.48)
F=1.861 p=.174 0.19
Depressive Mood EATQ-R SF Pre = 2.06 (0.72) Post = 1.94 (0.74)
Pre = 1.81 (0.64) Post = 1.79 (0.56)
F=1.073 p=.301 0.14
Fear EATQ-R SF Pre = 1.92 (0.78) Post = 1.62 (0.87)
Pre = 1.97 (0.81) Post = 1.61 (0.74)
F=0.308 p=.579 0.06
Frustration EATQ-R SF Pre = 2.42 (0.72) Post = 2.28 (.74)
Pre = 2.15 (0.74) Post = 1.99 (0.80)
F=0.062 p=.803 <0.01
Perceptual Sensitivity EATQ-R SF Pre = 2.67 (0.70) Post = 2.52 (0.76)
Pre = 2.55 (0.59) Post = 2.58 (0.77)
F=2.307 p=.130 0.21
Pleasure Sensitivity EATQ-R SF Pre = 1.84 (1.07) Post = 1.69 (1.01)
Pre = 2.38 (1.01) Post = 2.24 (1.12)
F=0.011 p=.916 <0.01
* indicates p<.05 based on results of repeated measures ANOVA tests
4 EATQ-R SF=Early Adolescent Temperament Questionnaire-Revised Short Form
vii

Results of Within-Group Analyses (Treatment Only)
Teachers’ Perceptions of Program Impact
Focus group and survey findings revealed that treatment teachers attributed positive impacts on themselves and their students to the Inner Resilience Program. Treatment teachers who participated in the end-of-year focus group reported that the program allowed them time and permission to take care of themselves and feel “more balanced.” Several teachers in the treatment group described the residential retreat as “life changing” and were particularly positive about the opportunities they had to bond with other teachers who shared similar experiences. Likewise, many teachers reported feeling less stressed at work and more satisfied with their jobs than they had in recent years. Teachers also described how their classroom climate was more relaxed after they implemented the curriculum and Inner Resilience components, such as peace corners and quiet times, and one teacher noted that she is now more aware of how her emotions can directly impact the behavior of students in her classroom in either a positive or negative way. Most teachers were strongly positive about the changes in their classrooms, but wished that they had more time to implement the curriculum and more in-class support from program personnel to ensure that they were implementing it appropriately. Many treatment teachers also reported that students were more aware of their own emotions and trigger points and had a better understanding of how to relax. Several teachers talked about the power of this work in children’s lives, shared stories of how students asked to extend the Inner Resilience curriculum work that they practiced in class, and frequently used the practices on their own when they were feeling anxious or frustrated. Results of the surveys support these focus group findings and showed that treatment teachers’ perceptions of changes in their own wellness, stress levels, and relationships, as well as those in their students’ wellness and on the classroom environment, as a result of the program were extremely positive.
Differential Effects for “High Impact” and “Non-High Impact” Teachers
To examine whether the intervention actually had a greater impact for treatment teachers
who self-reported greater impacts, a set of indicator variables was created to identify which teachers responded on the post-survey that they thought the treatment had a great impact on each of the following: Teacher Stress, Teacher Well-Being, Teacher Professional Relationships, Classroom Environment, and Student Well-Being. An additional series of repeated measures ANOVAs were conducted to examine the equality of means in all related measures across impact groups and time. Specifically, three questions can be answered by these analyses: (1) Do mean responses for treatment teachers (and their students) change across time points (pre vs. post)? (2) Do mean responses for treatment teachers (and their students) differ across impact groups (perceivers of high impact vs. others)? and (3) Does the change in mean response across time points depend on impact group? Differences were again tested for both statistical significance and for meaningfulness via effect size calculation.
Table ES4 shows the results of analyses conducted on pre- and post-surveys measuring teachers’ wellness, teachers’ and students’ perceptions of classroom climate, and students’ wellness. The mean scores of treatment teachers who reported perceptions of great program impact changed from pre to post in the predicted direction on all 15 wellness qualities tested. Furthermore, repeated measures analyses indicate tha the mean scores of the “high-impact” group indeed changed more positively from pre to post than did their non-high-impact counterparts on 6 of 15 wellness qualit es measured. M xed results were found with
t
i i
viii
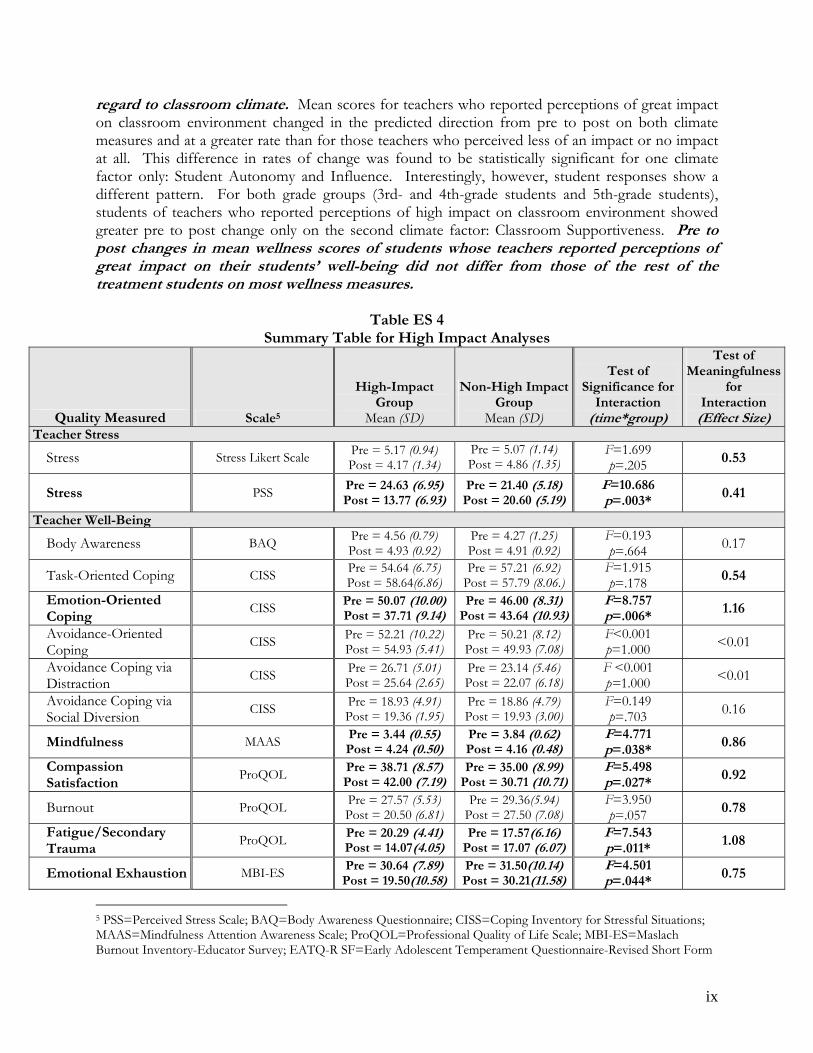
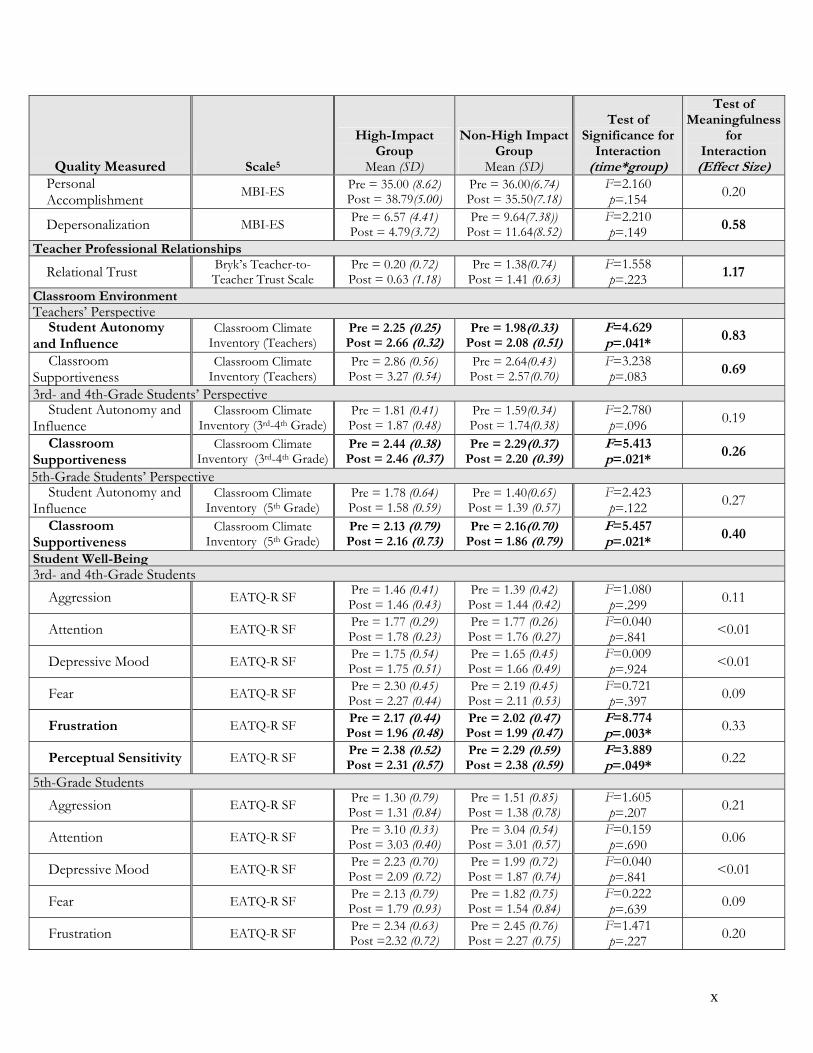
regard to classroom climate. Mean scores for teachers who reported perceptions of great impact on classroom environment changed in the predicted direction from pre to post on both climate measures and at a greater rate than for those teachers who perceived less of an impact or no impact at all. This difference in rates of change was found to be statistically significant for one climate factor only: Student Autonomy and Influence. Interestingly, however, student responses show a different pattern. For both grade groups (3rd- and 4th-grade students and 5th-grade students), students of teachers who reported perceptions of high impact on classroom environment showed greater pre to post change only on the second climate factor: Classroom Supportiveness. Pre to post changes in mean wellness scores of students whose teachers reported perceptions of great impact on their students’ well-being did not differ from those of the rest of the treatment students on most wellness measures.
Table ES 4 Summary Table for High Impact Analyses
Quality Measured Scale5
High-Impact Group
Mean (SD)
Non-High Impact Group
Mean (SD)
Test of Significance for
Interaction (time*group)
Test of Meaningfulness
for Interaction
(Effect Size) Teacher Stress
Stress Stress Likert Scale Pre = 5.17 (0.94) Post = 4.17 (1.34)
Pre = 5.07 (1.14) Post = 4.86 (1.35)
F=1.699 p=.205 0.53
Stress PSS Pre = 24.63 (6.95) Post = 13.77 (6.93)
Pre = 21.40 (5.18) Post = 20.60 (5.19)
F=10.686 p=.003* 0.41
Teacher Well-Being
Body Awareness BAQ Pre = 4.56 (0.79) Post = 4.93 (0.92)
Pre = 4.27 (1.25) Post = 4.91 (0.92)
F=0.193 p=.664 0.17
Task-Oriented Coping CISS Pre = 54.64 (6.75) Post = 58.64(6.86)
Pre = 57.21 (6.92) Post = 57.79 (8.06.)
F=1.915 p=.178 0.54
Emotion-Oriented Coping
CISS Pre = 50.07 (10.00) Post = 37.71 (9.14)
Pre = 46.00 (8.31) Post = 43.64 (10.93)
F=8.757 p=.006* 1.16
Avoidance-Oriented Coping CISS Pre = 52.21 (10.22)
Post = 54.93 (5.41) Pre = 50.21 (8.12) Post = 49.93 (7.08)
F<0.001 p=1.000 <0.01
Avoidance Coping via Distraction CISS Pre = 26.71 (5.01)
Post = 25.64 (2.65) Pre = 23.14 (5.46) Post = 22.07 (6.18)
F <0.001 p=1.000 <0.01
Avoidance Coping via Social Diversion CISS Pre = 18.93 (4.91)
Post = 19.36 (1.95) Pre = 18.86 (4.79) Post = 19.93 (3.00)
F=0.149 p=.703 0.16
Mindfulness MAAS Pre = 3.44 (0.55) Post = 4.24 (0.50)
Pre = 3.84 (0.62) Post = 4.16 (0.48)
F=4.771 p=.038* 0.86
Compassion Satisfaction
ProQOL Pre = 38.71 (8.57) Post = 42.00 (7.19)
Pre = 35.00 (8.99) Post = 30.71 (10.71)
F=5.498 p=.027* 0.92
Burnout ProQOL Pre = 27.57 (5.53) Post = 20.50 (6.81)
Pre = 29.36(5.94) Post = 27.50 (7.08)
F=3.950 p=.057 0.78
Fatigue/Secondary Trauma
ProQOL Pre = 20.29 (4.41) Post = 14.07(4.05)
Pre = 17.57(6.16) Post = 17.07 (6.07)
F=7.543 p=.011* 1.08
Emotional Exhaustion MBI-ES Pre = 30.64 (7.89) Post = 19.50(10.58)
Pre = 31.50(10.14) Post = 30.21(11.58)
F=4.501 p=.044* 0.75
5 PSS=Perceived Stress Scale; BAQ=Body Awareness Questionnaire; CISS=Coping Inventory for Stressful Situations; MAAS=Mindfulness Attention Awareness Scale; ProQOL=Professional Quality of Life Scale; MBI-ES=Maslach Burnout Inventory-Educator Survey; EATQ-R SF=Early Adolescent Temperament Questionnaire-Revised Short Form
ix
Quality Measured Scale5
High-Impact Group
Mean (SD)
Non-High Impact Group
Mean (SD)
Test of Significance for
Interaction (time*group)
Test of Meaningfulness
for Interaction
(Effect Size) Personal Accomplishment MBI-ES Pre = 35.00 (8.62)
Post = 38.79(5.00) Pre = 36.00(6.74) Post = 35.50(7.18)
F=2.160 p=.154 0.20
Depersonalization MBI-ES Pre = 6.57 (4.41) Post = 4.79(3.72)
Pre = 9.64(7.38)) Post = 11.64(8.52)
F=2.210 p=.149 0.58
Teacher Professional Relationships
Relational Trust Bryk’s Teacher-to-Teacher Trust Scale
Pre = 0.20 (0.72) Post = 0.63 (1.18)
Pre = 1.38(0.74) Post = 1.41 (0.63)
F=1.558 p=.223 1.17
Classroom Environment Teachers’ Perspective
Student Autonomy and Influence
Classroom Climate Inventory (Teachers)
Pre = 2.25 (0.25) Post = 2.66 (0.32)
Pre = 1.98(0.33) Post = 2.08 (0.51)
F=4.629 p=.041* 0.83
Classroom Supportiveness
Classroom Climate Inventory (Teachers)
Pre = 2.86 (0.56) Post = 3.27 (0.54)
Pre = 2.64(0.43) Post = 2.57(0.70)
F=3.238 p=.083 0.69
3rd- and 4th-Grade Students’ Perspective Student Autonomy and
Influence Classroom Climate
Inventory (3rd-4th Grade) Pre = 1.81 (0.41) Post = 1.87 (0.48)
Pre = 1.59(0.34) Post = 1.74(0.38)
F=2.780 p=.096 0.19
Classroom Supportiveness
Classroom Climate Inventory (3rd-4th Grade)
Pre = 2.44 (0.38) Post = 2.46 (0.37)
Pre = 2.29(0.37) Post = 2.20 (0.39)
F=5.413 p=.021* 0.26
5th-Grade Students’ Perspective Student Autonomy and
Influence Classroom Climate
Inventory (5th Grade) Pre = 1.78 (0.64) Post = 1.58 (0.59)
Pre = 1.40(0.65) Post = 1.39 (0.57)
F=2.423 p=.122 0.27
Classroom Supportiveness
Classroom Climate Inventory (5th Grade)
Pre = 2.13 (0.79) Post = 2.16 (0.73)
Pre = 2.16(0.70) Post = 1.86 (0.79)
F=5.457 p=.021* 0.40
Student Well-Being 3rd- and 4th-Grade Students
Aggression EATQ-R SF Pre = 1.46 (0.41) Post = 1.46 (0.43)
Pre = 1.39 (0.42) Post = 1.44 (0.42)
F=1.080 p=.299 0.11
Attention EATQ-R SF Pre = 1.77 (0.29) Post = 1.78 (0.23)
Pre = 1.77 (0.26) Post = 1.76 (0.27)
F=0.040 p=.841 <0.01
Depressive Mood EATQ-R SF Pre = 1.75 (0.54) Post = 1.75 (0.51)
Pre = 1.65 (0.45) Post = 1.66 (0.49)
F=0.009 p=.924 <0.01
Fear EATQ-R SF Pre = 2.30 (0.45) Post = 2.27 (0.44)
Pre = 2.19 (0.45) Post = 2.11 (0.53)
F=0.721 p=.397 0.09
Frustration EATQ-R SF Pre = 2.17 (0.44) Post = 1.96 (0.48)
Pre = 2.02 (0.47) Post = 1.99 (0.47)
F=8.774 p=.003* 0.33
Perceptual Sensitivity EATQ-R SF Pre = 2.38 (0.52) Post = 2.31 (0.57)
Pre = 2.29 (0.59) Post = 2.38 (0.59)
F=3.889 p=.049* 0.22
5th-Grade Students Aggression EATQ-R SF Pre = 1.30 (0.79)
Post = 1.31 (0.84) Pre = 1.51 (0.85) Post = 1.38 (0.78)
F=1.605 p=.207 0.21
Attention EATQ-R SF Pre = 3.10 (0.33) Post = 3.03 (0.40)
Pre = 3.04 (0.54) Post = 3.01 (0.57)
F=0.159 p=.690 0.06
Depressive Mood EATQ-R SF Pre = 2.23 (0.70) Post = 2.09 (0.72)
Pre = 1.99 (0.72) Post = 1.87 (0.74)
F=0.040 p=.841 <0.01
Fear EATQ-R SF Pre = 2.13 (0.79) Post = 1.79 (0.93)
Pre = 1.82 (0.75) Post = 1.54 (0.84)
F=0.222 p=.639 0.09
Frustration EATQ-R SF Pre = 2.34 (0.63) Post =2.32 (0.72)
Pre = 2.45 (0.76) Post = 2.27 (0.75)
F=1.471 p=.227 0.20
x
Quality Measured Scale5
High-Impact Group
Mean (SD)
Non-High Impact Group
Mean (SD)
Test of Significance for
Interaction (time*group)
Test of Meaningfulness
for Interaction
(Effect Size)
Perceptual Sensitivity EATQ-R SF Pre = 2.46 (0.68) Post =2.43 (0.85)
Pre = 2.77 (0.70) Post = 2.56 (0.72)
F=1.281 p=.260 0.19
Pleasure Sensitivity EATQ-R SF Pre = 2.09 (1.00) Post =1.69 (1.04)
Pre = 1.73 (1.09) Post = 1.69 (1.00)
F=3.708 p=.056 0.33
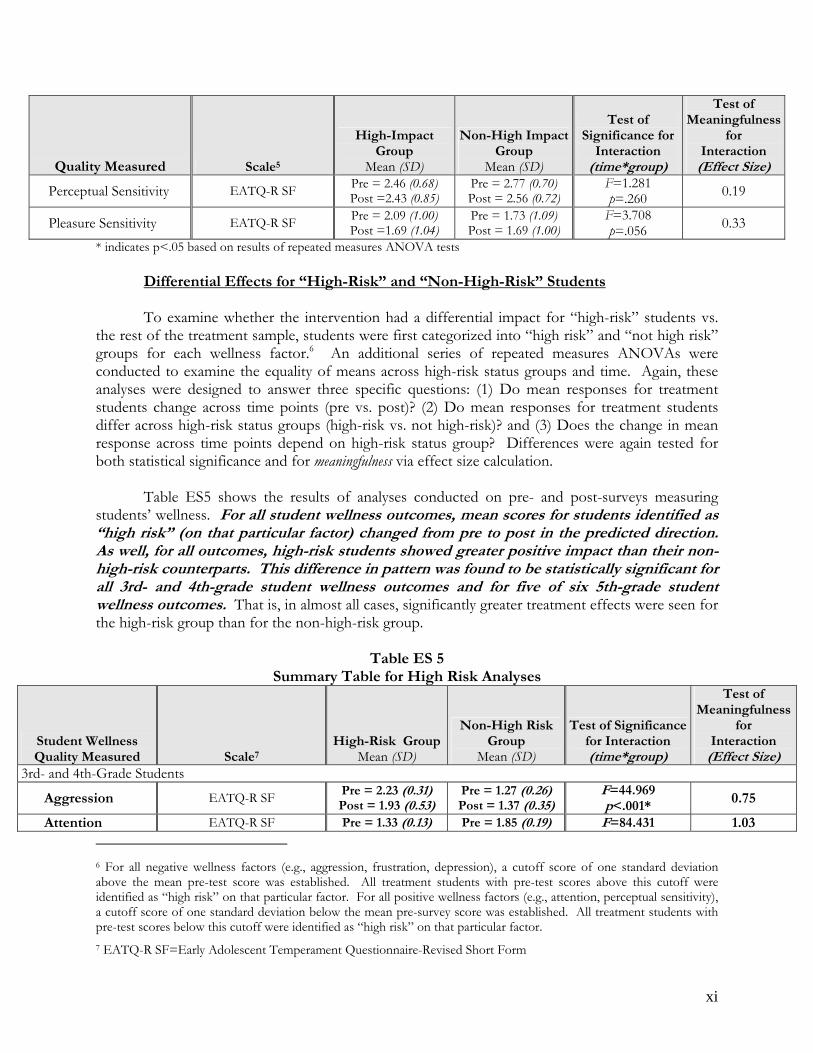
* indicates p<.05 based on results of repeated measures ANOVA tests Differential Effects for “High-Risk” and “Non-High-Risk” Students
To examine whether the intervention had a differential impact for “high-risk” students vs.
the rest of the treatment sample, students were first categorized into “high risk” and “not high risk” groups for each wellness factor.6 An additional series of repeated measures ANOVAs were conducted to examine the equality of means across high-risk status groups and time. Again, these analyses were designed to answer three specific questions: (1) Do mean responses for treatment students change across time points (pre vs. post)? (2) Do mean responses for treatment students differ across high-risk status groups (high-risk vs. not high-risk)? and (3) Does the change in mean response across time points depend on high-risk status group? Differences were again tested for both statistical significance and for meaningfulness via effect size calculation.
Table ES5 shows the results of analyses conducted on pre- and post-surveys measuring students’ wellness. For all student wellness outcomes, mean scores for students identified as“high risk” (on that particular factor) changed from pre to post in the predicted direction As well, for all outcomes, high-risk students showed greater positive impact than their non-high-risk counterparts. This difference in pattern was found to be statistically significant for all 3rd- and 4th-grade student wellness outcomes and for five of six 5th-grade student wellness outcomes. That is, in almost all cases, significantly greater treatment effects were seen for the high-risk group than for the non-high-risk group.
.
Table ES 5
Summary Table for High Risk Analyses
Student Wellness Quality Measured Scale7
High-Risk GroupMean (SD)
Non-High Risk Group
Mean (SD)
Test of Significance for Interaction (time*group)
Test of Meaningfulness
for Interaction
(Effect Size) 3rd- and 4th-Grade Students
Aggression EATQ-R SF Pre = 2.23 (0.31) Post = 1.93 (0.53)
Pre = 1.27 (0.26) Post = 1.37 (0.35)
F=44.969 p<.001* 0.75
Attention EATQ-R SF Pre = 1.33 (0.13) Pre = 1.85 (0.19) F=84.431 1.03
6 For all negative wellness factors (e.g., aggression, frustration, depression), a cutoff score of one standard deviation above the mean pre-test score was established. All treatment students with pre-test scores above this cutoff were identified as “high risk” on that particular factor. For all positive wellness factors (e.g., attention, perceptual sensitivity), a cutoff score of one standard deviation below the mean pre-survey score was established. All treatment students with pre-test scores below this cutoff were identified as “high risk” on that particular factor. 7 EATQ-R SF=Early Adolescent Temperament Questionnaire-Revised Short Form
xi

Student Wellness Quality Measured Scale7
High-Risk GroupMean (SD)
Non-High Risk Group
Mean (SD)
Test of Significance for Interaction (time*group)
Test of Meaningfulness
for Interaction
(Effect Size) Post = 1.67 (0.27) Post = 1.78 (0.25) p <.001*
Depressive Mood EATQ-R SF Pre = 2.47 (0.21) Post = 2.02 (0.54)
Pre = 1.53 (0.35) Post = 1.62 (0.46)
F= 52.786 p<.001* 0.81
Fear EATQ-R SF Pre = 3.00 (0.00) Post = 2.55 (0.35)
Pre = 2.13 (0.39) Post = 2.10 (0.51)
F=23.946 p<.001* 0.55
Frustration EATQ-R SF Pre = 2.74 (0.16) Post = 2.31 (0.43)
Pre = 1.91 (0.37) Post = 1.92 (0.45)
F=45.947 p<.001* 1.41
Perceptual Sensitivity
EATQ-R SF Pre = 1.38(0.22) Post = 2.00 (0.61)
Pre = 2.51 (0.40) Post = 2.44 (0.55)
F=67.554 p<.001* 1.59
5th-Grade Students
Aggression EATQ-R SF Pre = 2.59 (0.37) Post = 1.95 (0.73)
Pre = 1.10 (0.59) Post = 1.18 (0.73)
F=36.186 p<0.001* 1.68
Attention EATQ-R SF Pre = 2.34 (0.24) Post = 2.77 (0.43)
Pre = 3.26 (0.42) Post = 3.19 (0.52)
F=24.171 p<.001* 0.67
Depressive Mood EATQ-R SF Pre = 3.11 (0.35) Post = 2.69 (0.62)
Pre = 1.84 (0.56) Post = 1.78 (0.66)
F=6.027 p=.015* 0.42
Fear EATQ-R SF Pre = 3.10 (0.30) Post = 2.56 (0.64)
Pre = 1.71 (0.63) Post = 1.46 (0.80)
F=2.994 p=0.086 0.29
Frustration EATQ-R SF Pre = 3.35 (0.20) Post = 2.82 (0.74)
Pre = 2.18 (0.59) Post = 2.14 (0.68)
F=10.287 p=.002* 0.54
Perceptual Sensitivity
EATQ-R SF Pre = 1.47 (0.28) Post = 2.30 (0.85)
Pre = 2.85 (0.56) Post = 2.55 (0.75)
F=30.606 p<.001* 0.94
Pleasure Sensitivity
EATQ-R SF Pre = 0.29 (0.32) Post = 0.94 (0.91)
Pre = 2.19 (0.85) Post = 1.86 (0.96)
F=20.039 p<.001* 0.76
* indicates p<.05 based on results of repeated measures ANOVA tests Discussion
Overall, this study provides important findings for the educational community. The results indicate that the Inner Resilience Program had the intended effect of helping teachers to focus on their inner selves and to improve their own wellness. These results are extremely important considering the research on teacher stress and burnout. It is now well documented that teachers have highly stressful jobs and are at risk of leaving the teaching profession or—equally problematic—staying and burning out. The results produced by the Inner Resilience Program, including stress reduction, increased mindfulness, and improved relationships with colleagues, have the potential to break the negative cycle whereby teacher and student actions play off of each other, leading to increased teacher stress, poor classroom climate, and continued student misbehaviors (Marzano, Marzano, & Pickering, 2003; Jennings & Greenberg, in press). This study also found that the Inner Resilience Program can improve teachers’ perceptions of relational trust with their colleagues. These results are particularly important considering the work of Bryk and Schneider (2002), who contend that schools that are high in relational trust are more likely to make improvements in student achievement. Specifically, according to Murray (2005), the ability of new teachers to foster positive relationships with their students and their colleagues can “make or break” their teaching careers, and the most important factor for schools to consider with regard to retention is the quality of the relationships between new teachers and their colleagues.
xii
The present study also examined the path of changes in teachers to the climate of the
classrooms and to the wellness of their students. There is evidence that changes in the wellness of teachers can create classroom contexts where students are viewed more as individuals and have more student autonomy and influence. There may also be a greater feeling of community in treated teachers’ classrooms. Furthermore, changes in the teachers, along with direct intervention through the use of the curriculum, can reduce students’ levels of frustration. Although these results are interesting and important to note, the brief nature of the intervention may have impacted the strength of the results. Impact on the classrooms and on the students’ wellness decreased in strength as the intervention became more removed. Increasing the strength and, importantly, the duration of the intervention would likely increase the impact that the program would have on teachers’ classroom climates and their students’ wellness.
The within-treatment analyses also provide useful results. It is evident that teachers who
perceived that treatment had a greater effect on them did in fact show more improvement across a number of areas, including reductions in stress and two components of burnout (fatigue/secondary trauma and emotional exhaustion), as well as increases in mindfulness. The amount that these differences extended to these “high-impact” teachers’ classrooms and their students varied, however, and did not provide clear evidence of powerful differences. On the other hand, analyses of “high-risk” students did provide remarkable results, suggesting that the most vulnerable students may see the greatest benefit from the program. These results are important considering the needs of these students and the potential benefits of breaking negative cycles and treating such problems before they escalate. Limitations
Notwithstanding the multiple important findings, this study had a number of methodological limitations. For instance, the study had limited statistical power due to the sample size. Also, despite random assignment of teachers to treatment condition, some initial differences existed between the treatment and control group teachers and their students. It is also necessary to note three possible limitations of the instrumentation: (1) the teacher pre-survey was retrospective (i.e., the effect of asking teachers to think back to how they were feeling in the previous June when they completed the pre-survey), (2) all instruments were self-perception (i.e., self-report) surveys, and (3) the student survey used in this study was comprised of select sections of a published survey (that were altered in the 3rd- and 4th-grade version), rather than a complete battery. Finally, it should be considered that the duration and strength of treatment may need to be increased to see certain changes in student wellness across all grades. That is, treatment may need to be introduced at the beginning of the school year rather than mid-year, and it may take more time for changes in teachers’ wellness to reach the classroom and affect individual students. Suggestions for Further Research
Further research is needed to examine whether increased strength and duration of treatment would demonstrate greater impact; explore whether these results can be generalized to other groups of teachers, including those outside of the NYC area; and determine whether changes in the research design might lead to greater strength in results. Specific suggestions for additional research include the following:
xiii

• Include a larger sample of participants to add greater power to the analyses and reduce the error caused by initial differences between the groups;
• Start in the previous school year so that change might be measured from June to June, rather than from September to June, thus eliminating the error caused by asking teachers to “think back” to the previous spring;
• Include classroom observations in which impartial observers visit classrooms multiple times over the course of a school year and, using a published, structured protocol, assess the classroom climate;
• Include objective, biological measures of participants’ stress and anxiety levels; • Allow for an intervention of longer duration, with a full year of curriculum implementation
in the classroom; and • Revisit the instruments used and ensure that they are appropriate for the population being
assessed and well aligned with the changes that are expected from the program intervention.
xiv

I. Introduction Literature Review
The stress that teachers face in their daily lives has been given more attention in recent years
(Garrison Institute, 2005; Sacks, 2000). Teachers face a variety of stresses, such as heavy workloads, relative isolation from their colleagues, time constraints, emphasis on academic achievement testing, low decision-making power, and frequent lack of support from their superiors and peers (Byrne, 1993; Murray, 2005; Winzelberg & Luskin, 1999). Furthermore, societal expectations of teachers are extremely high. Teachers are not only expected to advance all of their students academically, but they are also expected to manage students’ emotional lives. For example, teachers are expected to create warm and nurturing classrooms, deal with student misbehaviors and conflicts between students in a sensitive and responsive manner, develop supportive relationships with parents and their school colleagues, and act as role models for their students when responding to challenges (Jennings & Greenberg, in press). Yet, pre-service programs do not adequately prepare teachers for the demands that they face on a daily basis; instead, these programs have focused primarily on developing teachers’ content knowledge and providing specific instructional skills (Murray, 2005; Jennings & Greenberg, in press).
Given the stresses that they face and the little support that they receive to address these
challenges, it is not surprising that teachers respond with common physiological, emotional, and behavioral manifestations of stress (Winzelberg & Luskin, 1999). Many teachers also respond by leaving the profession altogether. Indeed, stress and poor management of stressors are consistently rated as the main reasons teachers leave the profession (Darling-Hammond, 1991; Montgomery & Rupp, 2005). It has been estimated that as many as 40–50% of new teachers leave the field during their first five years of teaching (Ingersoll & Smith, 2003; National Center for Education Statistics, 2000). Replacing teachers because of this attrition costs billions of dollars each year; not including the costs related to the loss in teacher quality and student achievement, which is particularly important to consider given that research suggests that teachers must stay for at least three to five years before they can begin to impact students’ learning outcomes (Murray, 2005). Furthermore, attrition rates are even higher in low-income, inner city schools (Murray, 2005) where the students most need experienced, high-quality teachers to close the achievement gap and reduce the social and economic inequities that exist in this country.
Not all teachers leave the profession, but those who stay are at risk of developing another
serious problem: teacher burnout. Burnout is a multi-dimensional construct that consists of three components: emotional exhaustion, depersonalization, and reduced personal accomplishment (Maslach, Jackson, & Leiter, 1997). Teachers experience emotional exhaustion when they perceive that they cannot give as much to their students as they could at one time; they experience depersonalization when they develop negative, cynical, and callous attitudes toward students; and they experience reduced personal accomplishment when they perceive themselves as ineffective (Byrne, 1993). Burnout occurs when teachers have attempted unsuccessfully to cope with stress over long periods of time (Kyriacou, 2001). It can be tremendously destructive to teacher-student relationships, classroom management, and the classroom environment, as well as on the health of individual students (Jennings & Greenberg, in press). Teachers who are burned out are less caring and sympathetic to students, have a lower tolerance for mistakes and misbehaviors, are less prepared for classes, and feel less committed and dedicated to their work overall (Byrne, 1993; Jennings &
1

Greenberg, in press). Byrne (1993) examined paths related to the multiple dimensions of burnout and not surprisingly found that there were intricate connections between teacher behaviors, student responses, and overall classroom climate. Although teachers may start out with the best of intentions, when they do not have the resources to manage their classrooms, students demonstrate more off-task behaviors. This leads to a deterioration of the classroom climate, which triggers what has been termed a “burnout cascade.” As student misbehaviors build, teachers’ emotional exhaustion increases (Marzano, Marzano, & Pickering, 2003; Jennings & Greenberg, in press), which, in turn, leads to poor classroom climate and additional student misbehaviors.
Studies of stress reduction across multiple sectors have suggested that some programs can be
effective in reducing participants’ perceived and demonstrated stress. These programs can also be effective in breaking negative cycles, such as the burnout cascade described above. For example, programs that teach “mindfulness,” a method for cultivating and directing conscious attention and awareness to the present moment, has been found to reduce a variety of medical conditions, including chronic pain, heart disease, and digestive disorders (Kabat-Zinn, 1993, 2003); bolster immune systems; reduce blood pressure (Newsome, Christopher, Dahlen, & Christopher, 2006); and combat problems like stress, anxiety, and depression (Schreiner & Malcolm, 2008; Shapiro, Oman, Thoresen, Plante, & Flinders, 2008).
Several studies of the effects of mindfulness on individuals’ well-being show promising
preliminary results. For example, Shapiro, Schwartz, and Bonner (1998) used a randomized control trial design to study the effects of an eight-week meditation-based stress reduction program on pre-medical and medical students. They found that even such a short intervention effectively reduced participants’ stress and anxiety levels and increased their empathy toward others. Similarly, Newsome and her colleagues (2006) studied the effects of a semester-long course entitled “Mind/Body Medicine and the Art of Self-Care” on counselors. Students in this course engaged in meditation, yoga, qigong, and conscious relaxation exercises. Counselors reported reduced stress and improvements in their work with clients as a result of this course. Likewise, Singh and colleagues (2006) studied the effects of a 12-week mindful parenting course on parenting skills of individuals with autistic children. They found that mothers not only reported additional satisfaction with their parenting skills, but their children also demonstrated less aggression, noncompliance, and self-injury after intervention.
Few rigorous studies, however, have examined the effects of such treatment on teachers, although one pilot study examined results for pre-service teachers. Winzelberg and Luskin (1999) examined the effect of the RISE response, which teaches meditation, on pre-service teachers in a university teaching credential program. Results of this pilot study indicated that participants in the treatment group were able to significantly reduce their stress symptoms across emotional, physiological, and behavioral domains.
Although studies such as those described above provide a peak into the possible effects of
mindfulness and stress reduction techniques across various populations, there is still much work to be done. The current study furthers the work described above and examines the effect of the Inner Resilience Program8 on practicing teachers and their students. This study considers mounting evidence of the need to reduce teacher stress in an effort to retain good teachers and ensure optimal
8 Formerly called Project Renewal, a Project of the Tides Center.
2
performance of both teachers and their students. It considers not only the effect of the program on teachers but also on their classroom environments and on their students.
Background on the Inner Resilience Program
The Inner Resilience Program, a project of the Tides Center, was established in February
2002 in response to the effects of the events of September 11, 2001, on educators and students in lower Manhattan. Immediately following the attack, educators in the Ground Zero schools had to cope with the aftermath of the traumatic event while also helping their students to cope. In response, the Inner Resilience Program established professional development workshops, parent workshops, retreats, and classes that focused on nurturing the social, emotional, and inner lives of parents, teachers, and students in the school community as they recovered.
For reasons outlined above, it soon became clear that the need for help in balancing work
and life stressors was not exclusive to educators in the Ground Zero schools, but was rather a pervasive problem that affected teachers throughout the New York City (NYC) Department of Education (DOE) and nationally. As a result of this ongoing need, the program continued to thrive, moving from a focus on trauma recovery into the broader category of teacher, parent, and student wellness. Teaching practical skills in stress management and self-care, the Inner Resilience Program of today equips caregivers with the tools necessary to strengthen their own inner resources. These caregivers, in turn, model healthy and resilient ways of being for the children in their care.
Support for Research of the Inner Resilience Program
In fall 2005, the Fetzer Institute issued a call for proposals for research on the impact of “transformative professional development” on educators and the educational system. The request defined transformative professional development as “focusing on the emotional, spiritual, and personal dimensions of educators so they can bring their identity and integrity more fully into their work.” The Fetzer Institute expressed particular interest in innovative and rigorous research designs that would result in the establishment of a knowledge base of effective transformative professional development programs.
The Inner Resilience Program, in collaboration with the independent research and evaluation
firm, Metis Associates, responded to the call and proposed rigorous research using a randomized control trial design to examine the impact of the program on teachers and their students. The Inner Resilience Program received generous funding from the Fetzer Institute in spring 2006 and began to carry out the work shortly thereafter. This report describes the implementation activities, the research process and methods, and the results of the study. A discussion of the meaning and implications of the results is also included. Research Overview
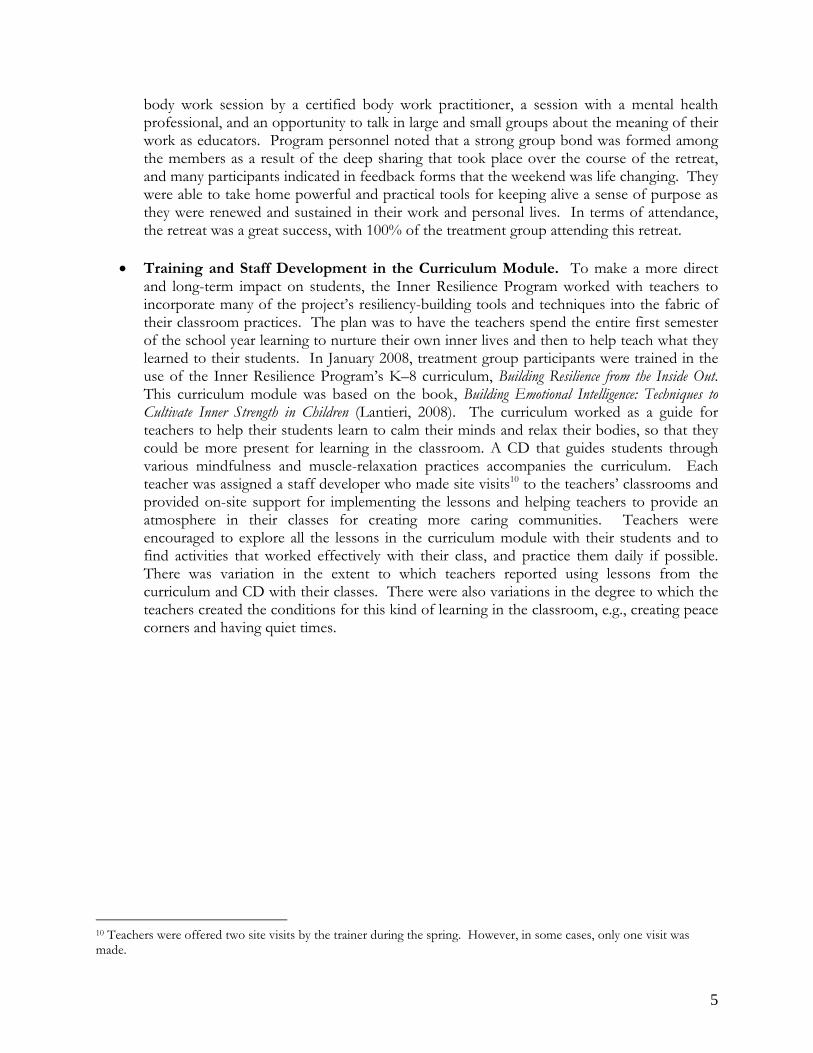
The 2006–2007 school year was spent planning for the study. The program and evaluation staff worked collaboratively to create a logic model (Figure 1, page 6) for the intervention, which served as a visual representation of the underlying logic or theory of the program’s effects. The model details the program’s activities and their proposed effects on the participating teachers and their students.
3

Also during the planning year, a battery of instruments was carefully selected to best capture the changes in participants that were proposed to occur as a result of the intervention. An intensive recruitment for study participants was conducted during the 2006–2007 school year. More than 60 teachers of Grades 3–5 in the NYC public schools were recruited during this period. Initial meetings of participants were held in late spring and early summer 2007, and in late summer 2007 participants were randomly assigned to either the treatment or the control group. Teachers in the treatment cohort participated in the program activities (described below), and teachers in the control cohort received a financial incentive for their participation in the study, but they did not receive treatment.9 All teachers completed a battery of surveys in fall 2007 and again in spring 2008. Intervention Teachers in the treatment group participated in the following interventions during the 2007–2008 school year:
• Yoga Classes. Treatment group members attended 11 weeks of yoga classes in fall 2007 and 16 weeks of classes in spring 2008. These 75-minute classes were offered through the leadership of a skilled, certified yoga instructor and took place at the Inner Resilience Program’s downtown training space. Participants were introduced to a weekly yoga practice with a focus on stress management and mind-body health. This provided the teachers in the group a time each week to focus on themselves in an atmosphere of safety and relaxation. Attendance at the weekly yoga classes varied, with one participant attending only five total yoga classes and the remaining treatment group teachers attending between 10 and 27 classes. The average number of yoga classes attended was 21 (78% of the total classes offered) across the fall and spring.
• Nurturing the Inner Life (NTIL) Series. In this series, teachers gathered for 2.5 hours
monthly from October 2007 to June 2008 to explore a variety of reflective approaches to bring balance into their busy lives. An atmosphere of warmth and collegiality was actively cultivated as participants engaged in group dialogue, were taught guided contemplative practices, and recorded their thoughts and feelings in journals over the course of the series. Each session ended with a shared meal. A total of eight NTIL sessions were held. Attendance at this series was high, with teachers attending an average of seven sessions each (88% of total classes offered).
• Residential Retreat. Treatment group members attended a weekend residential retreat
November 2–4, 2007. The retreat was designed to honor the genuine need for rest and rejuvenation while also introducing educators to practical strategies for staying calm, strong, and creative within the turmoil and stresses of work and life. Participants, many of whom reportedly signed up for the study because they were feeling stressed and burned out, were taken to a beautiful retreat center in the country outside of NYC. There they spent the weekend as a caring learning community—morning yoga was offered; healthy meals were served; and psycho-educational workshops on stress management, conflict resolution, and grief were offered. Teachers were given a self-care checklist, and each teacher was offered a
9 At the conclusion of the study, teachers in the control group also were offered yoga classes and a residential retreat for the 2008–2009 school year.
4
5
body work session by a certified body work practitioner, a session with a mental health professional, and an opportunity to talk in large and small groups about the meaning of their work as educators. Program personnel noted that a strong group bond was formed among the members as a result of the deep sharing that took place over the course of the retreat, and many participants indicated in feedback forms that the weekend was life changing. They were able to take home powerful and practical tools for keeping alive a sense of purpose as they were renewed and sustained in their work and personal lives. In terms of attendance, the retreat was a great success, with 100% of the treatment group attending this retreat.
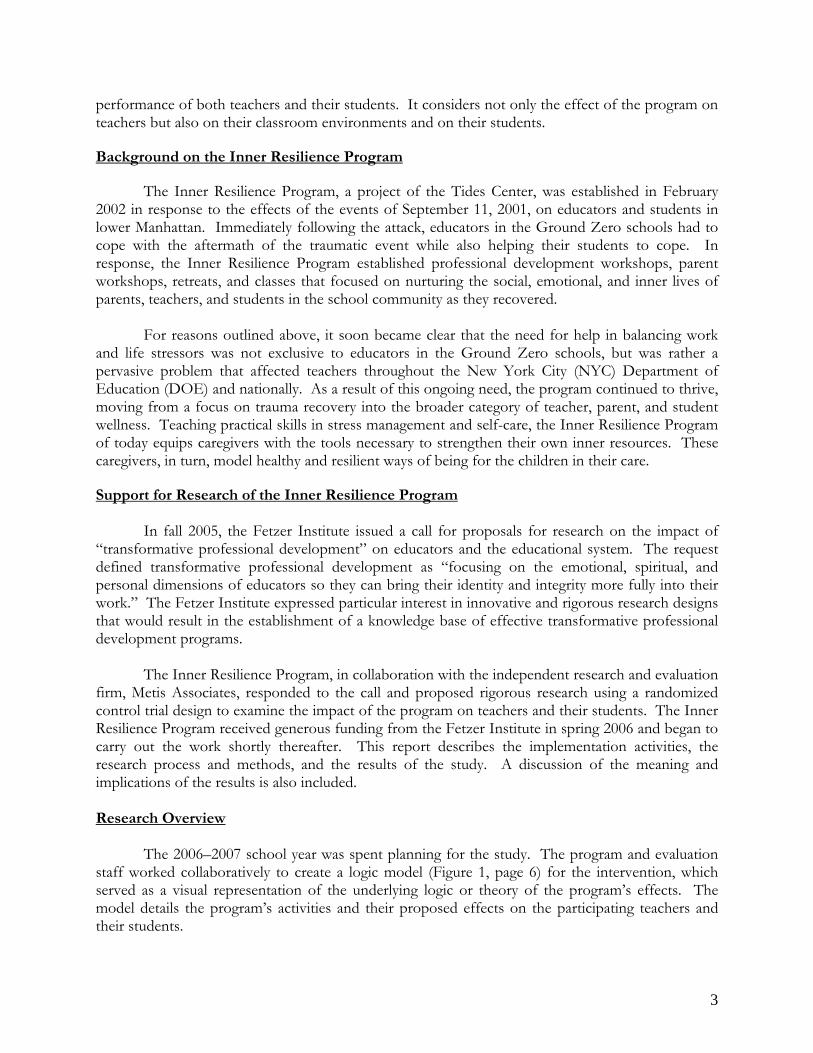
• Training and Staff Development in the Curriculum Module. To make a more direct
and long-term impact on students, the Inner Resilience Program worked with teachers to incorporate many of the project’s resiliency-building tools and techniques into the fabric of their classroom practices. The plan was to have the teachers spend the entire first semester of the school year learning to nurture their own inner lives and then to help teach what they learned to their students. In January 2008, treatment group participants were trained in the use of the Inner Resilience Program’s K–8 curriculum, Building Resilience from the Inside Out. This curriculum module was based on the book, Building Emotional Intelligence: Techniques to Cultivate Inner Strength in Children (Lantieri, 2008). The curriculum worked as a guide for teachers to help their students learn to calm their minds and relax their bodies, so that they could be more present for learning in the classroom. A CD that guides students through various mindfulness and muscle-relaxation practices accompanies the curriculum. Each teacher was assigned a staff developer who made site visits10 to the teachers’ classrooms and provided on-site support for implementing the lessons and helping teachers to provide an atmosphere in their classes for creating more caring communities. Teachers were encouraged to explore all the lessons in the curriculum module with their students and to find activities that worked effectively with their class, and practice them daily if possible. There was variation in the extent to which teachers reported using lessons from the curriculum and CD with their classes. There were also variations in the degree to which the teachers created the conditions for this kind of learning in the classroom, e.g., creating peace corners and having quiet times.
10 Teachers were offered two site visits by the trainer during the spring. However, in some cases, only one visit was made.
6
• Decreased stress • Decreased acting out
behavior • Increased coping skills • Enhanced concentration
and attention
Figure 1 Logic Model
silience Program: A Project of the Tides Center esilience & Renewal Fellows Program
Inner Resilience Treatment eachers Change in Classroom Climate Change in Students
Transformational Professional Development • Residential retreat • Nurturing the Inner Life Series • Yoga classes • Curriculum training,
implementation, and follow up
Interpersonal Change • Better able to handle stressful situations
in classroom • Increased use of contemplative practices
in classroom • Increased caring and compassion for
students • More relational trust with colleagues • Increased feeling of community
Intrapersonal Change • Reduced feelings of stress • Increased self-awareness • Increased coping skills • Enhanced concentration and
attention • Better management of emotions • Increased job satisfaction • Increased optimism • Increased sense of meaning and
purpose
• Increased feeling of community
• Increased caring behavior
The Inner ReThe R
Change in T

II. Methods Participants Recruitment. Recruitment activities began in fall 2006 and continued through summer 2007. Activities included the following:
• Distribution of a flyer to schools throughout NYC, the United Federation of Teachers (UFT), New Visions for Public Schools, and other nonprofit organizations;
• Creation of a web page within the Inner Resilience Program website describing the study; • Distribution of a letter describing the project to a group of approximately 750 friends and
supporters of the Inner Resilience Program; • Placement of advertisements in a UFT newsletter, The Village Voice, The L Magazine, and New
York Teacher; and • Word of mouth (teachers who had already registered for the study were asked to advertise
the program to their colleagues).
The project aimed to have a total of 60 NYC public school teachers of Grades 3–5 in the study (30 each in the treatment and control groups). More than 60 teachers were recruited and randomly assigned to the treatment and control conditions, recognizing that there would be some attrition.11 As expected, some attrition did occur before the start of the treatment and over the course of the year. In some cases, teachers dropped out before the start of treatment because they had a change in grade level or teaching status and, in a few cases, teachers were unable to complete the responsibilities that the intervention required. In total, 29 teachers in the treatment group and 28 teachers in the control group completed the study. Information about these participating teachers is provided in the section below.
Teacher Characteristics. Figures 2–6 display information on the location of participants’
schools, the grades they taught, their age categories, their teaching experience, and their race/ethnicity. Data are shown for teachers in both the treatment and control groups. See Appendix A for detailed tables of participating teacher data.
As the figures show, most of the teachers in both the treatment and control groups came
from elementary schools in Manhattan, taught 3rd or 4th grade, were white (not Hispanic), and were between the ages of 21 and 30. Differences between the treatment and control groups were greater across some variables than others. The groups were fairly well matched on variables such as school location, race/ethnicity, and teaching experience, but they were less well matched across age and the grades they taught. Specifically, there were more 5th-grade teachers in the treatment than in the control group and more 3rd-grade teachers in the control than in the treatment group. There was also a greater concentration of teachers ages 31–40 in the treatment group than in the control group.
Because there was a larger proportion of 5th-grade teachers in the treatment group (31.0%) than in the control group (10.7%), potential differences in stress levels between teachers of Grades 3 and 4 and teachers of Grade 5 were examined via independent group t-tests on all stress-related factors measured. This assessed whether teachers at different grade levels were reporting vastly 11 See Procedures section for more details on recruitment and attrition.
7

different environments in which they work. No statistically significant differences were found between the two groups at pre- or post-test on any of the tested measures (stress level, perceived stress [PSS], or life events total score); however, meaningful effect sizes were calculated for the grade group differences on pre- and post- perceived stress (PSS). The results of these tests are presented in Appendix B.
Figure 2 Location of Participants’ School, by Group (Treatment/Control)
0 10 20 30 40 50
Bronx
Brooklyn
Queens
Manhattan
Bor
ough
Percentage of Participating Teachers
Control (N=28)Treatment (N=29)
Figure 3 Grade Participants Taught, by Group (Treatment/Control)
0 10 20 30 40 50
Bridge Class
Grade 5
Grade 4
Grade 3
Gra
de
Tau
ght
Percentage of Participating Teachers
Control (N=28)Treatment (N=29)
8
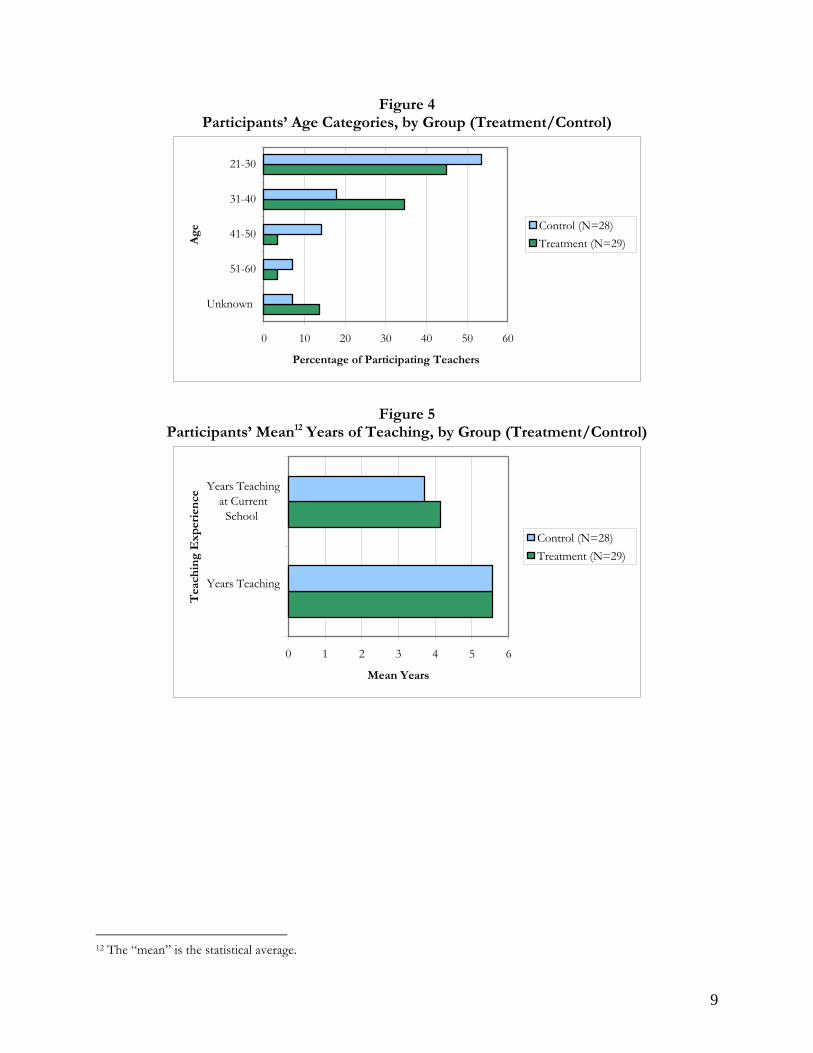
Figure 4 Participants’ Age Categories, by Group (Treatment/Control)
0 10 20 30 40 50 60
Unknown
51-60
41-50
31-40
21-30
Age
Percentage of Participating Teachers
Control (N=28)Treatment (N=29)
Figure 5 Participants’ Mean12 Years of Teaching, by Group (Treatment/Control)
0 1 2 3 4 5 6
Years Teaching
Years Teachingat Current
School
Tea
chin
g E
xper
ien
ce
Mean Years
Control (N=28)Treatment (N=29)
12 The “mean” is the statistical average.
9

Figure 6 Participants’ Race/Ethnicity Categories, by Group (Treatment/Control)
0 10 20 30 40 50
Unknown
Other/Mixed
Asian/Pacific Islander
Hispanic
Black, not Hispanic
White, not Hispanic
Rac
e/E
thn
icit
y
Percentage of Participating Teachers
Control (N=28)Treatment (N=29)
Participating teachers in the treatment and control groups came from a total of 33 NYC public schools. In the majority of these schools (N=20), only one teacher from each school participated in the study. In the remaining 13 schools, more than one teacher from a school participated in the study, with about half of these (N=6 schools) having more than one teacher participating in the treatment group. See Appendix C for a table showing the number of participants in each school by group (treatment/control).
Student Characteristics.13 A total of 855 students completed the study, with 471 in the
treatment group and 384 in the control group. Figures 7–11 display information on participating students’ school location, grade level, gender, race/ethnicity, free/reduced-price lunch (FRPL) status, special education status, and English language learner (ELL) status14 by group (treatment/control). See Appendix D for detailed tables of participating student data. As the figures show, the majority of the students came from Manhattan elementary schools, were of Hispanic or Asian origin, and were in 4th grade. Students in the treatment and control groups were generally matched fairly well, but there were some notable differences. The treatment group was comprised of a greater percentage of 5th-grade students, and the control group was comprised of a greater percentage of 3rd-grade students. Furthermore, the treatment group had more Asian students than the control group, whereas the control group had more Black (not Hispanic) students.
13 Data are displayed only for students who returned active permission slips, completed both pre- and post-surveys, and who were, therefore, included in the study. 14 All data were obtained through NYC DOE files. Students’ grade, school location, gender, race/ethnicity, and FRPL eligibility are based on 2007–2008 data. Special education and ELL status were not available for 2007–2008, so 2006–2007 data were used.
10
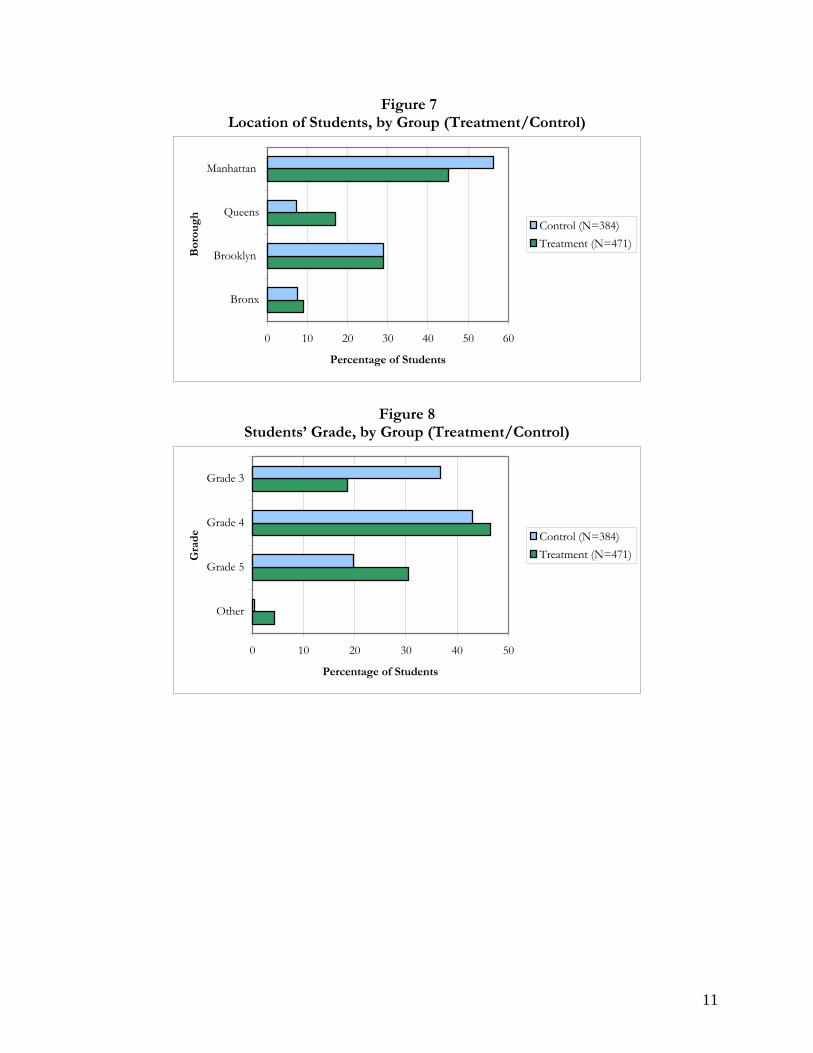
Figure 7 Location of Students, by Group (Treatment/Control)
0 10 20 30 40 50 60
Bronx
Brooklyn
Queens
Manhattan
Bor
ough
Percentage of Students
Control (N=384)Treatment (N=471)
Figure 8 Students’ Grade, by Group (Treatment/Control)
0 10 20 30 40 50
Other
Grade 5
Grade 4
Grade 3
Gra
de
Percentage of Students
Control (N=384)Treatment (N=471)
11

Figure 9 Students’ Gender, by Group (Treatment/Control)
0 10 20 30 40 50 60
Female
Male St
ud
ent
Gen
der
Percentage of Students
Control (N=384)Treatment (N=471)
Figure 10 Students’ Race/Ethnicity, by Group (Treatment/Control)
0 10 20 30 40 50 60American Indian/Alaska...
Hispanic
Black
White
Asian
Studen
t R
ace/
Eth
nic
ity
Percentage of Students
Control (N=384)Treatment (N=471)
12

Figure 11 Student Demographics, by Group (Treatment/Control) – FRPL, Special Education, and
ELL Status
0 10 20 30 40 50
ELL
Special Ed
FRPL EligibleSt
uden
t D
emog
raph
ics
Percentage of Students
Control (N=384)Treatment (N=471)
Measures
Participating teachers and their students completed batteries of surveys on a pre (fall 2007) and post (spring 2008) basis over the course of the school year. The surveys consisted of instruments to measure participants’ perceptions of their well-being and the climate in their classrooms. The surveys were carefully selected to ensure that they measured the qualities expected to change as a result of the intervention (as displayed in the logic model). The sections below describe the instruments that were used for both participating teachers and their students. Teachers Teacher Wellness Survey. The Teacher Wellness Survey was comprised of items from eight instruments designed to measure participants’ perceptions of their well-being, i.e., perceptions of stress, body awareness, coping styles, professional quality of life, mindfulness, attention, and concentration. The instruments are described in the sections below; most of these are published instruments and have established reliability and validity. Unless otherwise noted, a complete version of each instrument was included in the survey. A copy of the complete Wellness Survey used for the study is provided in Appendix E.
• The Coping Inventory for Stressful Situations (CISS). The CISS (Endler & Parker, 1999) is a 48-item self-report measure that assesses coping skills in adults. Respondents’ coping skills are assessed through their responses to items asking them to indicate the extent to which they engage in different types of activities when they encounter stressful situations. Respondents rate each of the 48 items on a five-point Likert-type scale ranging from 1 for “Not at all” to 5 for “Very much.” The CISS defines three types of coping dimensions: Task Oriented, Emotion Oriented, and Avoidance (there are two subscales for the Avoidance Oriented scale—Distraction and Social Diversion). The Task Oriented subscale describes purposeful task-oriented efforts designed to solve the problem. The Emotion
13
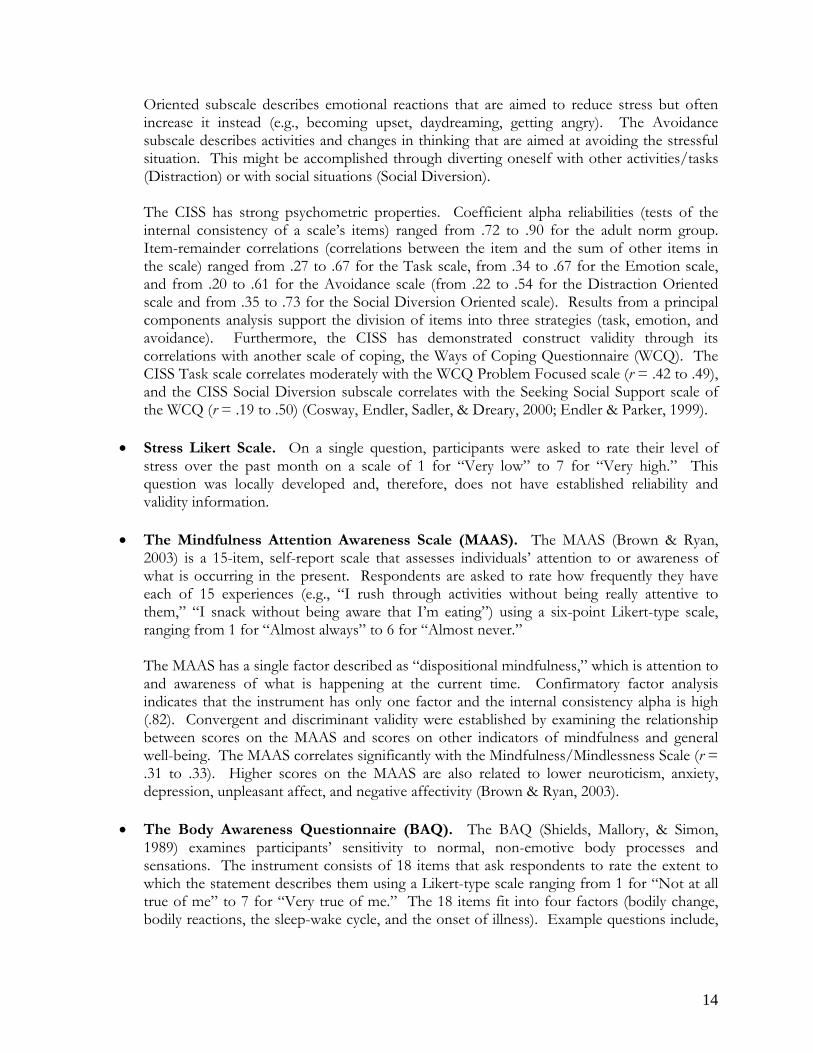
Oriented subscale describes emotional reactions that are aimed to reduce stress but often increase it instead (e.g., becoming upset, daydreaming, getting angry). The Avoidance subscale describes activities and changes in thinking that are aimed at avoiding the stressful situation. This might be accomplished through diverting oneself with other activities/tasks (Distraction) or with social situations (Social Diversion).
The CISS has strong psychometric properties. Coefficient alpha reliabilities (tests of the internal consistency of a scale’s items) ranged from .72 to .90 for the adult norm group. Item-remainder correlations (correlations between the item and the sum of other items in the scale) ranged from .27 to .67 for the Task scale, from .34 to .67 for the Emotion scale, and from .20 to .61 for the Avoidance scale (from .22 to .54 for the Distraction Oriented scale and from .35 to .73 for the Social Diversion Oriented scale). Results from a principal components analysis support the division of items into three strategies (task, emotion, and avoidance). Furthermore, the CISS has demonstrated construct validity through its correlations with another scale of coping, the Ways of Coping Questionnaire (WCQ). The CISS Task scale correlates moderately with the WCQ Problem Focused scale (r = .42 to .49), and the CISS Social Diversion subscale correlates with the Seeking Social Support scale of the WCQ (r = .19 to .50) (Cosway, Endler, Sadler, & Dreary, 2000; Endler & Parker, 1999).
• Stress Likert Scale. On a single question, participants were asked to rate their level of stress over the past month on a scale of 1 for “Very low” to 7 for “Very high.” This question was locally developed and, therefore, does not have established reliability and validity information.
• The Mindfulness Attention Awareness Scale (MAAS). The MAAS (Brown & Ryan,
2003) is a 15-item, self-report scale that assesses individuals’ attention to or awareness of what is occurring in the present. Respondents are asked to rate how frequently they have each of 15 experiences (e.g., “I rush through activities without being really attentive to them,” “I snack without being aware that I’m eating”) using a six-point Likert-type scale, ranging from 1 for “Almost always” to 6 for “Almost never.”
The MAAS has a single factor described as “dispositional mindfulness,” which is attention to and awareness of what is happening at the current time. Confirmatory factor analysis indicates that the instrument has only one factor and the internal consistency alpha is high (.82). Convergent and discriminant validity were established by examining the relationship between scores on the MAAS and scores on other indicators of mindfulness and general well-being. The MAAS correlates significantly with the Mindfulness/Mindlessness Scale (r = .31 to .33). Higher scores on the MAAS are also related to lower neuroticism, anxiety, depression, unpleasant affect, and negative affectivity (Brown & Ryan, 2003).
• The Body Awareness Questionnaire (BAQ). The BAQ (Shields, Mallory, & Simon, 1989) examines participants’ sensitivity to normal, non-emotive body processes and sensations. The instrument consists of 18 items that ask respondents to rate the extent to which the statement describes them using a Likert-type scale ranging from 1 for “Not at all true of me” to 7 for “Very true of me.” The 18 items fit into four factors (bodily change, bodily reactions, the sleep-wake cycle, and the onset of illness). Example questions include,
14
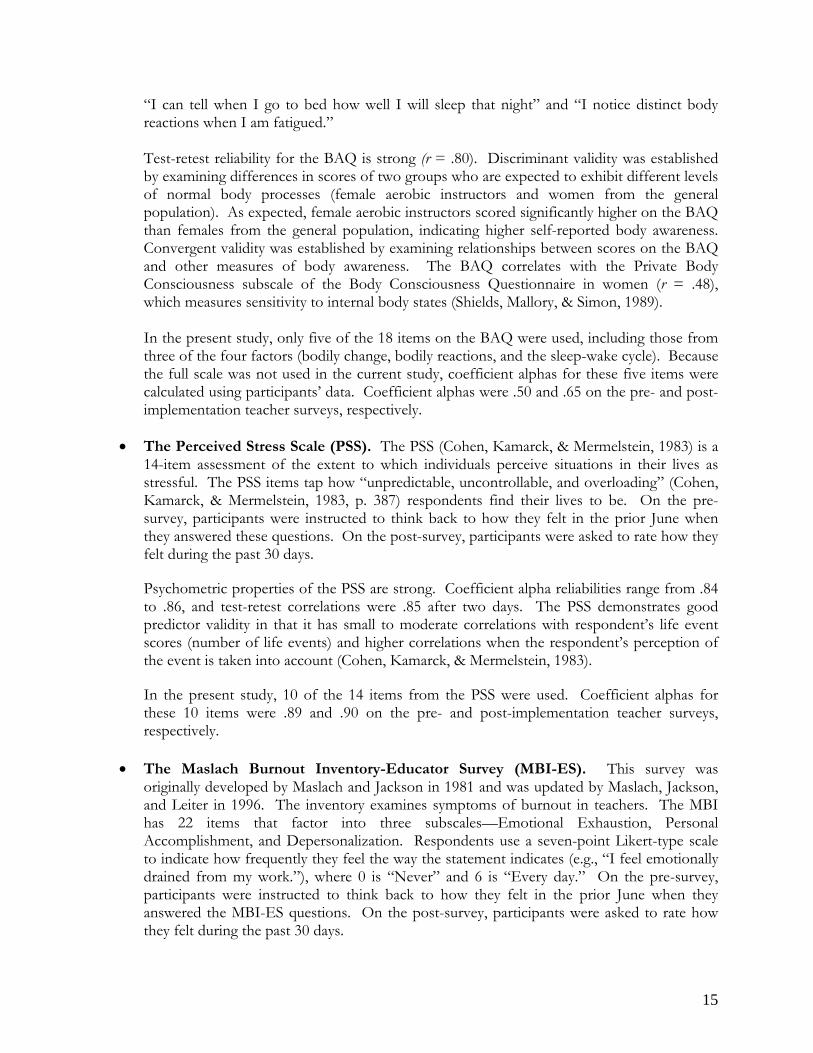
“I can tell when I go to bed how well I will sleep that night” and “I notice distinct body reactions when I am fatigued.” Test-retest reliability for the BAQ is strong (r = .80). Discriminant validity was established by examining differences in scores of two groups who are expected to exhibit different levels of normal body processes (female aerobic instructors and women from the general population). As expected, female aerobic instructors scored significantly higher on the BAQ than females from the general population, indicating higher self-reported body awareness. Convergent validity was established by examining relationships between scores on the BAQ and other measures of body awareness. The BAQ correlates with the Private Body Consciousness subscale of the Body Consciousness Questionnaire in women (r = .48), which measures sensitivity to internal body states (Shields, Mallory, & Simon, 1989).
In the present study, only five of the 18 items on the BAQ were used, including those from three of the four factors (bodily change, bodily reactions, and the sleep-wake cycle). Because the full scale was not used in the current study, coefficient alphas for these five items were calculated using participants’ data. Coefficient alphas were .50 and .65 on the pre- and post-implementation teacher surveys, respectively.
• The Perceived Stress Scale (PSS). The PSS (Cohen, Kamarck, & Mermelstein, 1983) is a 14-item assessment of the extent to which individuals perceive situations in their lives as stressful. The PSS items tap how “unpredictable, uncontrollable, and overloading” (Cohen, Kamarck, & Mermelstein, 1983, p. 387) respondents find their lives to be. On the pre-survey, participants were instructed to think back to how they felt in the prior June when they answered these questions. On the post-survey, participants were asked to rate how they felt during the past 30 days.
Psychometric properties of the PSS are strong. Coefficient alpha reliabilities range from .84 to .86, and test-retest correlations were .85 after two days. The PSS demonstrates good predictor validity in that it has small to moderate correlations with respondent’s life event scores (number of life events) and higher correlations when the respondent’s perception of the event is taken into account (Cohen, Kamarck, & Mermelstein, 1983). In the present study, 10 of the 14 items from the PSS were used. Coefficient alphas for these 10 items were .89 and .90 on the pre- and post-implementation teacher surveys, respectively.
• The Maslach Burnout Inventory-Educator Survey (MBI-ES). This survey was originally developed by Maslach and Jackson in 1981 and was updated by Maslach, Jackson, and Leiter in 1996. The inventory examines symptoms of burnout in teachers. The MBI has 22 items that factor into three subscales—Emotional Exhaustion, Personal Accomplishment, and Depersonalization. Respondents use a seven-point Likert-type scale to indicate how frequently they feel the way the statement indicates (e.g., “I feel emotionally drained from my work.”), where 0 is “Never” and 6 is “Every day.” On the pre-survey, participants were instructed to think back to how they felt in the prior June when they answered the MBI-ES questions. On the post-survey, participants were asked to rate how they felt during the past 30 days.
15

Coefficient alpha reliabilities are strong for the three subscales, with the Emotional Exhaustion scale being the most internally consistent (.88 and .90 for Emotional Exhaustion, .76 and .74 for Depersonalization, and .76 and .72 for Personal Accomplishment in two large studies) (Iwanicki & Schwab, 1981). Test-retest coefficients based on a 2- to 4-week interval range from .60 to .82 (mean r = .74) (Maslach & Jackson, 1981). Furthermore, the convergent validity of the instrument was demonstrated through significant correlations between scores on the MBI-ES and external criteria, including observations, dimensions of job experience, and personal outcomes (Maslach & Jackson, 1981).
• The Professional Quality of Life Scale (ProQOL). The ProQOL (Stamm, 2005) measures participants’ perceptions of the quality of their professional lives. The items were reworded for the present study as per the author’s directions to specifically address the teaching profession. The ProQOL is comprised of three distinct scales: Compassion Satisfaction, Burnout, and Compassion Fatigue/Secondary Trauma. These scales do not yield an overall composite score. Compassion Satisfaction relates to the pleasure that an individual derives from helping others through his or her work. Higher scores indicate a greater degree of satisfaction that is derived. Burnout is associated with negative feelings about one’s work that suggest hopelessness, lack of effectiveness, and low levels of support. Higher scores indicate a greater risk for burnout. Compassion Fatigue/Secondary Trauma indicates exposure to traumatic events through the individuals with whom one works. Higher scores on this subscale indicate a greater amount of compassion fatigue or secondary trauma.
Coefficient alpha reliabilities are .87 for Compassion Satisfaction, .80 for Compassion Fatigue/Secondary Trauma, and .72 for Burnout. According to Stamm (2005), the scales do in fact measure different constructs, with low levels of collinearity. On the pre-survey, participants were instructed to think back to how they felt in the prior June when they answered the ProQOL questions. On the post-survey, participants were asked to rate how they felt during the past 30 days.
• Teacher-Teacher Trust. Bryk & Schneider (2002) developed survey items that assess the extent to which teachers trust each other. The scale consists of six items that measure feelings of mutual respect among teachers, for those leading school improvement efforts, and for those who are deemed to be experts in their craft. Respondents are asked the extent to which they agree with each of the statements using a four-point, Likert-type scale (Strongly disagree, Disagree, Agree, and Strongly agree). On the pre-survey, participants were instructed to think back to how they felt last school year when they answered the teacher-teacher trust questions. On the post-survey, participants were asked to rate how they felt during the current year.
The scale has a strong coefficient alpha reliability of .82 (Smylie et al., 2003). No validity data were readily available to the evaluators. Holmes-Rahe Life Stress Inventory (The Social Readjustment Rating Scale [SRRS]).
Holmes and Rahe developed the Life Stress Inventory in 1967 to provide a concrete way of
16
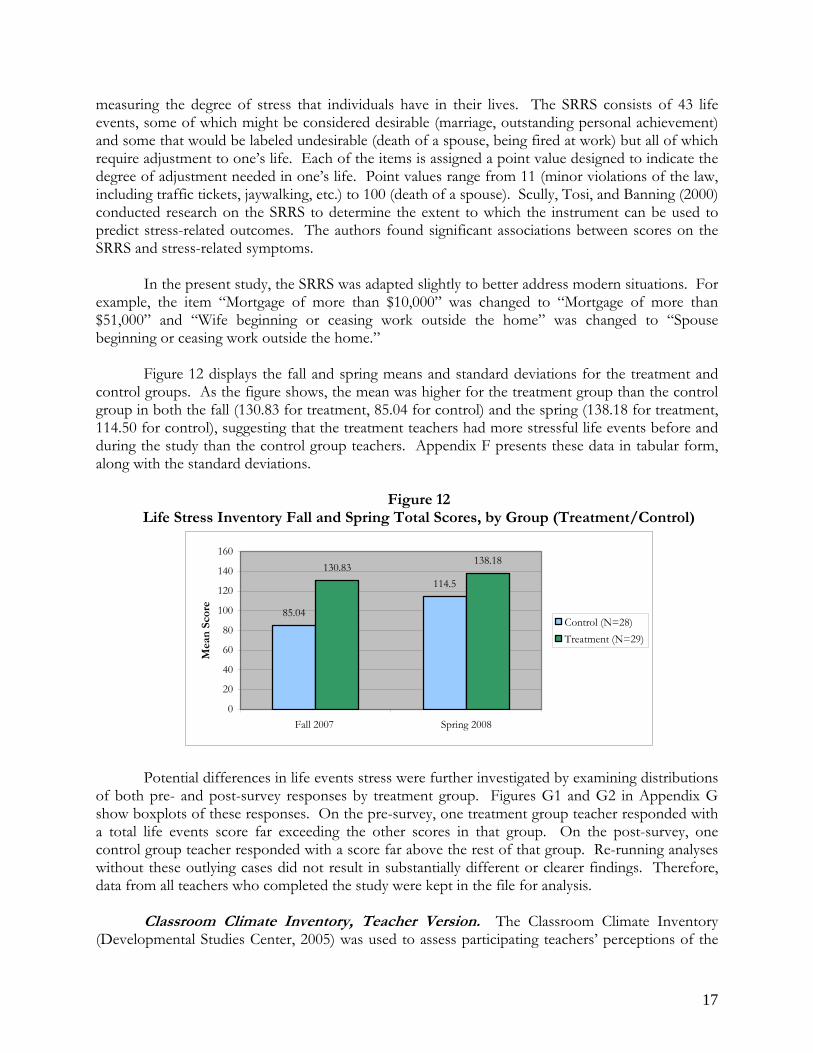
measuring the degree of stress that individuals have in their lives. The SRRS consists of 43 life events, some of which might be considered desirable (marriage, outstanding personal achievement) and some that would be labeled undesirable (death of a spouse, being fired at work) but all of which require adjustment to one’s life. Each of the items is assigned a point value designed to indicate the degree of adjustment needed in one’s life. Point values range from 11 (minor violations of the law, including traffic tickets, jaywalking, etc.) to 100 (death of a spouse). Scully, Tosi, and Banning (2000) conducted research on the SRRS to determine the extent to which the instrument can be used to predict stress-related outcomes. The authors found significant associations between scores on the SRRS and stress-related symptoms.
In the present study, the SRRS was adapted slightly to better address modern situations. For
example, the item “Mortgage of more than $10,000” was changed to “Mortgage of more than $51,000” and “Wife beginning or ceasing work outside the home” was changed to “Spouse beginning or ceasing work outside the home.”
Figure 12 displays the fall and spring means and standard deviations for the treatment and control groups. As the figure shows, the mean was higher for the treatment group than the control group in both the fall (130.83 for treatment, 85.04 for control) and the spring (138.18 for treatment, 114.50 for control), suggesting that the treatment teachers had more stressful life events before and during the study than the control group teachers. Appendix F presents these data in tabular form, along with the standard deviations.
Figure 12 Life Stress Inventory Fall and Spring Total Scores, by Group (Treatment/Control)
85.04
114.5130.83
138.18
0
20
40
60
80
100
120
140
160
Fall 2007 Spring 2008
Mea
n S
core
Control (N=28)Treatment (N=29)
Potential differences in life events stress were further investigated by examining distributions of both pre- and post-survey responses by treatment group. Figures G1 and G2 in Appendix G show boxplots of these responses. On the pre-survey, one treatment group teacher responded with a total life events score far exceeding the other scores in that group. On the post-survey, one control group teacher responded with a score far above the rest of that group. Re-running analyses without these outlying cases did not result in substantially different or clearer findings. Therefore, data from all teachers who completed the study were kept in the file for analysis.
Classroom Climate Inventory, Teacher Version. The Classroom Climate Inventory
(Developmental Studies Center, 2005) was used to assess participating teachers’ perceptions of the
17

climate in their classrooms. The items for this scale were adapted from a scale used with students. The wording of the items was changed from the student’s to the teacher’s point of view. For example, the item “In my class I get to do things that I want to do” was changed to “In my class the students get to do what they want to do.” Although the full scale covers more subjects, only sections relating to perceptions of “Student Autonomy and Influence in the Classroom” and “Classroom Supportiveness” were included in the teacher and student versions of the survey distributed in the current study. These sections were selected because the items most closely related to changes that were expected to occur as a result of the treatment. Specifically, it was predicted that implementation of the curriculum along with changes in the teachers’ wellness levels would result in more caring classroom environments. Likewise, teachers’ attention to and recognition of students as individuals would result in classrooms where students had greater autonomy and influence. The version of the survey for teachers that was created and used for this study included the full Student Autonomy and Influence in the Classroom section (consisting of 10 items) and was designed to assess the extent to which teachers perceived that students in their class had power to influence the classroom activities and environment These items were on a five-point Likert-type scale, where 0 is “Never,” 1 is “Rarely,” 2 is “Sometimes,” 3 is “Often,” and 4 is “Always.” The Classroom Supportiveness section of the survey included 14 items designed to assess the extent to which teachers perceived that students are supportive of and mutually concerned about each other. These items were on a five-point Likert-type scale, where 1 is “Strongly disagree,” 2 is “Disagree,” 3 is “Neither agree nor disagree,” 4 is “Agree,” and 5 is “Strongly agree.” No information on validity and reliability of this survey with adults is available. Psychometric data on the scale for students is provided below. Because the items were changed for teachers in the current study, coefficient alphas for these five items were calculated using participants’ data. Coefficient alphas for the items on the “Student Autonomy and Influence in the Classroom” scale were .63 and .83 on the pre and post teacher surveys, respectively, and .84 and .94 on the “Classroom Supportiveness” scale. Treatment Teacher Focus Group. In spring 2008, eight teachers from the treatment group participated in a focus group to discuss the impact of the program activities on their professional and personal lives, as well as on the students that they teach. In addition to describing changes that they noted in themselves and their students over the course of the year, participants responded to ideas for ways that the Inner Resilience Program could be improved and described their feelings about participating in the research study. All teachers from the treatment group were invited to participate in the focus group, and the first eight participants to sign up were included. See Appendix H for a copy of the focus group protocol. Students
Student Wellness Survey. To assess students’ wellness levels, a set of scales from the Early Adolescent Temperament Questionnaire-Revised Short Form (EATQ-R SF) (Ellis & Rothbart, 2001) was used. The EATQ-R was designed for administration to adolescents (age 9–15) and contains experiences that are common to them. A short form of the instrument, created in 2001, contains 65 items assessing 10 aspects of temperament.
18
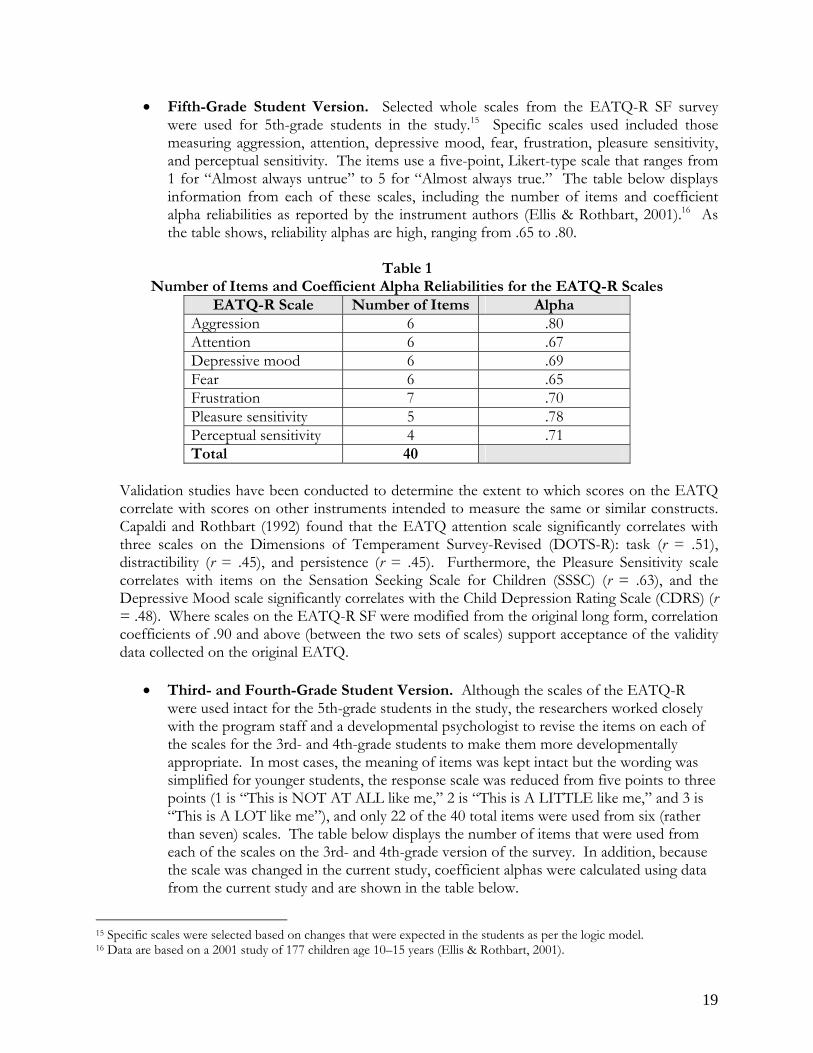
• Fifth-Grade Student Version. Selected whole scales from the EATQ-R SF survey were used for 5th-grade students in the study.15 Specific scales used included those measuring aggression, attention, depressive mood, fear, frustration, pleasure sensitivity, and perceptual sensitivity. The items use a five-point, Likert-type scale that ranges from 1 for “Almost always untrue” to 5 for “Almost always true.” The table below displays information from each of these scales, including the number of items and coefficient alpha reliabilities as reported by the instrument authors (Ellis & Rothbart, 2001).16 As the table shows, reliability alphas are high, ranging from .65 to .80.
Table 1
Number of Items and Coefficient Alpha Reliabilities for the EATQ-R Scales EATQ-R Scale Number of Items Alpha
Aggression 6 .80 Attention 6 .67 Depressive mood 6 .69 Fear 6 .65 Frustration 7 .70 Pleasure sensitivity 5 .78 Perceptual sensitivity 4 .71 Total 40
Validation studies have been conducted to determine the extent to which scores on the EATQ correlate with scores on other instruments intended to measure the same or similar constructs. Capaldi and Rothbart (1992) found that the EATQ attention scale significantly correlates with three scales on the Dimensions of Temperament Survey-Revised (DOTS-R): task (r = .51), distractibility (r = .45), and persistence (r = .45). Furthermore, the Pleasure Sensitivity scale correlates with items on the Sensation Seeking Scale for Children (SSSC) (r = .63), and the Depressive Mood scale significantly correlates with the Child Depression Rating Scale (CDRS) (r = .48). Where scales on the EATQ-R SF were modified from the original long form, correlation coefficients of .90 and above (between the two sets of scales) support acceptance of the validity data collected on the original EATQ.
• Third- and Fourth-Grade Student Version. Although the scales of the EATQ-R
were used intact for the 5th-grade students in the study, the researchers worked closely with the program staff and a developmental psychologist to revise the items on each of the scales for the 3rd- and 4th-grade students to make them more developmentally appropriate. In most cases, the meaning of items was kept intact but the wording was simplified for younger students, the response scale was reduced from five points to three points (1 is “This is NOT AT ALL like me,” 2 is “This is A LITTLE like me,” and 3 is “This is A LOT like me”), and only 22 of the 40 total items were used from six (rather than seven) scales. The table below displays the number of items that were used from each of the scales on the 3rd- and 4th-grade version of the survey. In addition, because the scale was changed in the current study, coefficient alphas were calculated using data from the current study and are shown in the table below.
15 Specific scales were selected based on changes that were expected in the students as per the logic model. 16 Data are based on a 2001 study of 177 children age 10–15 years (Ellis & Rothbart, 2001).
19
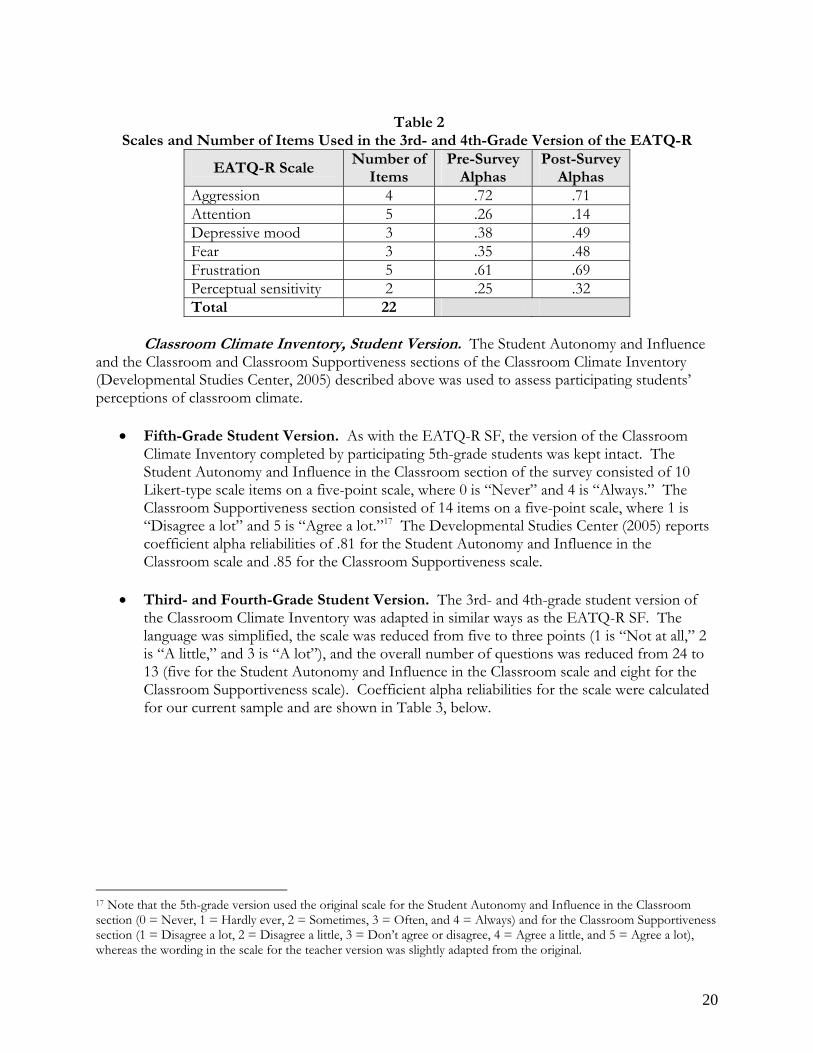
Table 2
Scales and Number of Items Used in the 3rd- and 4th-Grade Version of the EATQ-R
EATQ-R Scale Number of
Items Pre-Survey
Alphas Post-Survey
Alphas Aggression 4 .72 .71 Attention 5 .26 .14 Depressive mood 3 .38 .49 Fear 3 .35 .48 Frustration 5 .61 .69 Perceptual sensitivity 2 .25 .32 Total 22
Classroom Climate Inventory, Student Version. The Student Autonomy and Influence
and the Classroom and Classroom Supportiveness sections of the Classroom Climate Inventory (Developmental Studies Center, 2005) described above was used to assess participating students’ perceptions of classroom climate.
• Fifth-Grade Student Version. As with the EATQ-R SF, the version of the Classroom
Climate Inventory completed by participating 5th-grade students was kept intact. The Student Autonomy and Influence in the Classroom section of the survey consisted of 10 Likert-type scale items on a five-point scale, where 0 is “Never” and 4 is “Always.” The Classroom Supportiveness section consisted of 14 items on a five-point scale, where 1 is “Disagree a lot” and 5 is “Agree a lot.”17 The Developmental Studies Center (2005) reports coefficient alpha reliabilities of .81 for the Student Autonomy and Influence in the Classroom scale and .85 for the Classroom Supportiveness scale.
• Third- and Fourth-Grade Student Version. The 3rd- and 4th-grade student version of
the Classroom Climate Inventory was adapted in similar ways as the EATQ-R SF. The language was simplified, the scale was reduced from five to three points (1 is “Not at all,” 2 is “A little,” and 3 is “A lot”), and the overall number of questions was reduced from 24 to 13 (five for the Student Autonomy and Influence in the Classroom scale and eight for the Classroom Supportiveness scale). Coefficient alpha reliabilities for the scale were calculated for our current sample and are shown in Table 3, below.
17 Note that the 5th-grade version used the original scale for the Student Autonomy and Influence in the Classroom section (0 = Never, 1 = Hardly ever, 2 = Sometimes, 3 = Often, and 4 = Always) and for the Classroom Supportiveness section (1 = Disagree a lot, 2 = Disagree a little, 3 = Don’t agree or disagree, 4 = Agree a little, and 5 = Agree a lot), whereas the wording in the scale for the teacher version was slightly adapted from the original.
20

Table 3 Scales and Number of Items Used in the 3rd- and 4th-Grade Version
of the Classroom Climate Survey
Classroom Climate Scale Number of
Items Pre-Survey
Alphas Post-Survey
Alphas Student Autonomy and Influence in the Classroom 5 .37 .55 Classroom Supportiveness 8 .70 .78 Total 13
Procedures The research was carried out in the following steps:
• Recruitment of participants began in the fall of 2006 and continued through the start of the project. As described earlier, recruitment activities included distributing flyers; advertising in newspapers, newsletters, and websites; and word of mouth among teachers already signed up for the study.
• In July 2007, following the recruitment of the first 60 teacher participants, the researchers
proceeded to randomly assign participants to treatment and control conditions through the random-select function in SPSS. After some immediate attrition, another set of participants was recruited and randomly assigned to treatment and control groups, again using the random-select function in SPSS.18
• In fall 2007, teachers participated in a kickoff meeting during which they learned more
details about the study activities and timeline, completed the pre-wellness surveys, and were served dinner. Separate kickoff meetings were scheduled for the treatment and control groups. All participants chose a code name that would be used throughout the study in place of their actual names. Metis employees maintained a list of matched names and code names that was used only as necessary. Otherwise, code names were used exclusively for data purposes throughout the study. Program staff did not have access to code names and never reviewed individual teacher survey results.
• NYC DOE approval to conduct the study was received in September 2007. Immediately
after approval from the DOE was obtained, principals of schools with participating teachers were contacted and asked for their approval for teachers to participate. All principals received copies of the grant proposal, and program staff made personal phone calls and visits to schools as requested. All but one principal agreed to participate.19 Following the consent of the principals, Metis staff distributed active permission slips to parents of 1,324 students in participating classrooms. A total of 1,133 students (85.6%) returned permission slips. Of these, 1,032 (77.9% of total, 91.1% of returned slips) granted permission to participate in the study. Pre- and post-survey data could be matched for 855 (82.8% of
18 In total, 73 teachers filled out contact information sheets, showing interest in the study. Of these, 61 teachers (30 in the treatment group and 31 in the control group) submitted completed pre-surveys from themselves and their students. Ultimately, 57 of these teachers (29 treatment and 28 control) completed the study and submitted post-surveys. 19 No student surveys were administered in this school; this participant completed teacher surveys only.
21
students with consent) of these students. These are the students (471 in treatment classrooms, 384 in control classrooms) for whom demographic data are reported above and for whom survey data are analyzed and reported on below.
• In October 2007, Metis mailed teachers packets of pre-surveys that included individualized20
Student Wellness surveys, Student Classroom Climate surveys, and Teacher Classroom Climate surveys. Teachers were instructed to distribute surveys to students during non-academic time periods. Explicit administration instructions were included in the survey packet and included directions for teachers to explain that students should answer the questions as honestly and completely as possible, that there were no correct answers, and that the results would have no effect on their grades.
• Teachers in the treatment group began program activities in October 2007 and continued
throughout the duration of the school year. Program attendance data were periodically collected throughout the year, and other implementation data, including teacher participation in site visits and use of curriculum units, were collected at the end of the school year.
• Packets of Classroom Climate post-surveys were mailed to teachers in May 2008. The
packets included the same surveys as distributed directly to schools in fall 2007. Again, explicit administration instructions were included with explanations of the purpose and use of the surveys for students.
• Participating treatment and control group teachers completed their post-wellness surveys at
an end-of-year event in June 2008. Again, separate events were held for treatment and control group teachers. During these meetings, teachers in both groups completed the surveys and had an opportunity to ask questions about the study.
20 Student surveys were individualized with OSIS number identifiers, and teacher surveys used code names that had been identified earlier.
22

III. Results of Between-Group Analyses (Treatment vs. Control)
This section of the report presents results of analyses that examine differences between the treatment and control groups. To determine whether there were differences in the responses of treatment and control teachers from pre- to post-surveys, a series of repeated measures analysis of variance (ANOVA) tests were conducted. Repeated measures ANOVA tests examine the equality of means across conditions and time. Specifically, three questions can be answered by these analyses:
1. Do mean responses change from pre- to post-survey? [Main effect (Time)] 2. Do mean responses differ across treatment and control groups? [Main effect (Group)] 3. Does the change in mean response from pre- to post-survey depend on group (treatment
or control)? [Interaction effect (Time*Group)] In addition to testing for statistical significance, differences between the groups over time
were tested for meaningfulness; that is, whether the differences matter on a practical level. The extent to which differences are considered meaningful is expressed through a statistic termed “effect size” (also called Cohen’s d). Effect size is calculated by measuring the magnitude of the gains or losses, expressed in gain score standard deviation units. A gain of more than 1/3 of a standard deviation (i.e., an effect size of more than 0.33 or less than –0.33) is considered meaningful.
Full results of the ANOVAs and effect size analyses are included in Appendix I. Tables 4–6, below, provide summaries of the findings and show whether changes are in the predicted direction, as well as whether they are statistically significant. The results are presented according to the predictions in each of the major areas of change: teacher wellness, classroom climate, and student wellness. Teacher Wellness Results
As displayed in the logic model, the intervention is intended to increase teachers’ well-being by reducing stress, promoting healthy coping skills, increasing attention and mindfulness, and strengthening personal relationships. Also, the program is intended to enhance teachers’ job satisfaction and strengthen their professional skills by reducing burnout, emotional exhaustion, and depersonalization, and by increasing feelings of personal accomplishment and trusting relationships with colleagues.
Table 4 displays results of analyses that were conducted on pre- and post-surveys measuring
teachers’ wellness. Treatment teachers’ mean scores changed from pre to post in the predicted direction on 13 of the 15 measured wellness qualities.21 Furthermore, the program had a statistically significant and meaningful impact on reducing treatment group teachers’ stress levels (as measured by one scale), increasing their levels of attention and mindfulness, and strengthening their relational trust with their colleagues. Although not all differences between the treatment and control groups achieved statistical significance, it is notable that the great majority of changes in the treatment group are in the predicted direction. Also, several of the
21 One quality, Avoidance-Oriented Coping, contains both adaptive and non-adaptive qualities; therefore, no predictions were made regarding this quality.
23
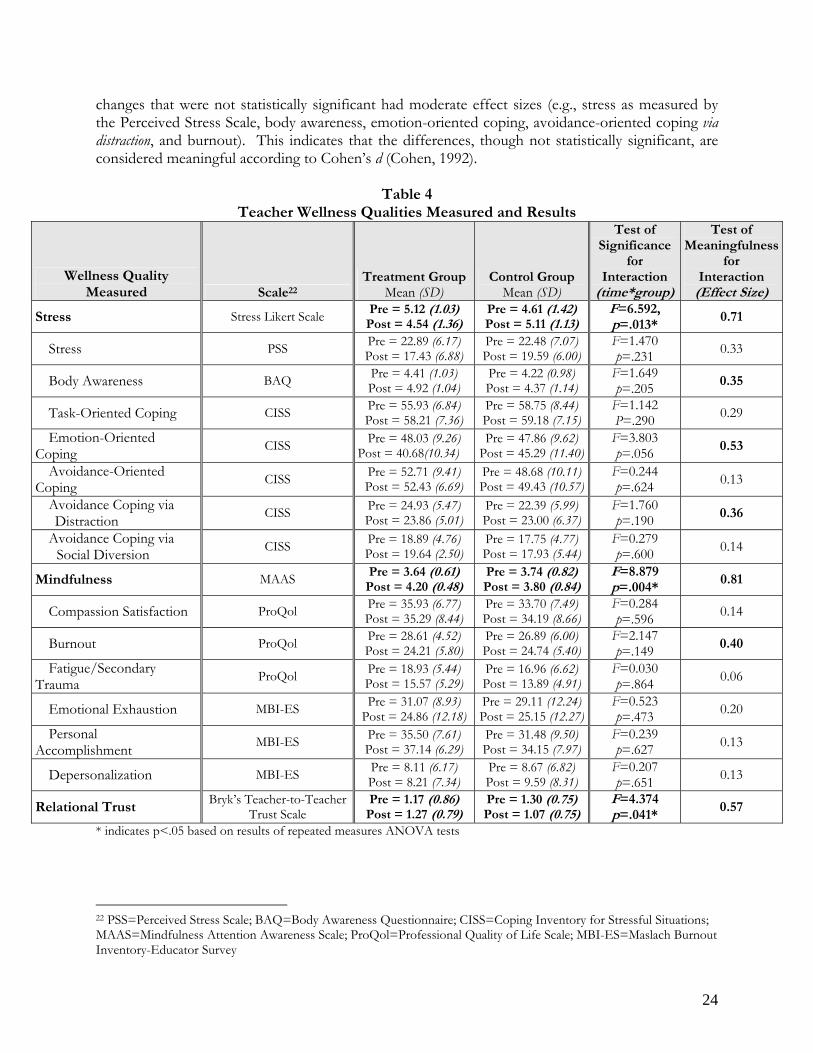
changes that were not statistically significant had moderate effect sizes (e.g., stress as measured by the Perceived Stress Scale, body awareness, emotion-oriented coping, avoidance-oriented coping via distraction, and burnout). This indicates that the differences, though not statistically significant, are considered meaningful according to Cohen’s d (Cohen, 1992).
Table 4 Teacher Wellness Qualities Measured and Results
Wellness Quality Measured Scale22
Treatment Group Mean (SD)
Control Group Mean (SD)
Test of Significance
for Interaction
(time*group)
Test of Meaningfulness
for Interaction
(Effect Size)
Stress Stress Likert Scale Pre = 5.12 (1.03) Post = 4.54 (1.36)
Pre = 4.61 (1.42) Post = 5.11 (1.13)
F=6.592, p=.013*
0.71
Stress PSS Pre = 22.89 (6.17) Post = 17.43 (6.88)
Pre = 22.48 (7.07) Post = 19.59 (6.00)
F=1.470 p=.231
0.33
Body Awareness BAQ Pre = 4.41 (1.03) Post = 4.92 (1.04)
Pre = 4.22 (0.98) Post = 4.37 (1.14)
F=1.649 p=.205 0.35
Task-Oriented Coping CISS Pre = 55.93 (6.84) Post = 58.21 (7.36)
Pre = 58.75 (8.44) Post = 59.18 (7.15)
F=1.142 P=.290 0.29
Emotion-Oriented Coping CISS Pre = 48.03 (9.26)
Post = 40.68(10.34) Pre = 47.86 (9.62)
Post = 45.29 (11.40) F=3.803 p=.056 0.53
Avoidance-Oriented Coping CISS Pre = 52.71 (9.41)
Post = 52.43 (6.69) Pre = 48.68 (10.11) Post = 49.43 (10.57)
F=0.244 p=.624 0.13
Avoidance Coping via Distraction CISS Pre = 24.93 (5.47)
Post = 23.86 (5.01) Pre = 22.39 (5.99) Post = 23.00 (6.37)
F=1.760 p=.190 0.36
Avoidance Coping via Social Diversion CISS Pre = 18.89 (4.76)
Post = 19.64 (2.50) Pre = 17.75 (4.77) Post = 17.93 (5.44)
F=0.279 p=.600 0.14
Mindfulness MAAS Pre = 3.64 (0.61) Post = 4.20 (0.48)
Pre = 3.74 (0.82) Post = 3.80 (0.84)
F=8.879 p=.004*
0.81
Compassion Satisfaction ProQol Pre = 35.93 (6.77) Post = 35.29 (8.44)
Pre = 33.70 (7.49) Post = 34.19 (8.66)
F=0.284 p=.596 0.14
Burnout ProQol Pre = 28.61 (4.52) Post = 24.21 (5.80)
Pre = 26.89 (6.00) Post = 24.74 (5.40)
F=2.147 p=.149 0.40
Fatigue/Secondary Trauma ProQol Pre = 18.93 (5.44)
Post = 15.57 (5.29) Pre = 16.96 (6.62) Post = 13.89 (4.91)
F=0.030 p=.864 0.06
Emotional Exhaustion MBI-ES Pre = 31.07 (8.93) Post = 24.86 (12.18)
Pre = 29.11 (12.24) Post = 25.15 (12.27)
F=0.523 p=.473 0.20
Personal Accomplishment MBI-ES Pre = 35.50 (7.61)
Post = 37.14 (6.29) Pre = 31.48 (9.50) Post = 34.15 (7.97)
F=0.239 p=.627 0.13
Depersonalization MBI-ES Pre = 8.11 (6.17) Post = 8.21 (7.34)
Pre = 8.67 (6.82) Post = 9.59 (8.31)
F=0.207 p=.651 0.13
Relational Trust Bryk’s Teacher-to-Teacher Trust Scale
Pre = 1.17 (0.86) Post = 1.27 (0.79)
Pre = 1.30 (0.75) Post = 1.07 (0.75)
F=4.374 p=.041*
0.57
* indicates p<.05 based on results of repeated measures ANOVA tests 22 PSS=Perceived Stress Scale; BAQ=Body Awareness Questionnaire; CISS=Coping Inventory for Stressful Situations; MAAS=Mindfulness Attention Awareness Scale; ProQol=Professional Quality of Life Scale; MBI-ES=Maslach Burnout Inventory-Educator Survey
24

Classroom Climate Results
The logic of the program further suggests that the climate in participating teachers’ classrooms will improve due to the changes in the teacher and the activities that are directly focused on student change.
Table 5 displays results of classroom climate analyses. Changes in classroom climate were assessed through the perceptions of both participating teachers and their students. Treatment teachers’ mean scores changed from pre to post in the predicted direction on both of the measured classroom climate aspects. Furthermore, 3rd- and 4th-grade students of treatment teachers perceived a statistically significant and meaningfully greater increase in their levels of autonomy and influence from pre to post than did the 3rd- and 4th-grade students of control teachers. Nearly all teachers in the treatment group perceived that the program positively affected their teaching and their classroom environment, and differences between treatment and control teachers’ scores on the subsections of the Classroom Climate Survey were in the predicted direction.
Table 5
Classroom Climate Qualities Measured and Results
Classroom Climate Quality Measured Scale
Treatment GroupMean (SD)
Control Group Mean (SD)
Test of Significance
for Interaction
(time*group)
Test of Meaningfulness
for Interaction
(Effect Size) Teachers’ Perspective
Student Autonomy and Influence
Classroom Climate Inventory (Teachers)
Pre = 2.07 (0.33) Post = 2.26 (0.53)
Pre = 1.91 (0.40) Post = 2.02 (0.44)
F=1.161 p=.286 0.29
Classroom Supportiveness Classroom Climate Inventory (Teachers)
Pre = 2.71 (0.47) Post = 2.79 (0.73)
Pre = 2.59 (0.59) Post = 2.62 (0.59)
F=0.081 p=.776 0.09
3rd- and 4th-Grade Students’ Perspective Student Autonomy and
Influence
Classroom Climate Inventory (3rd-4th
Grade)
Pre = 1.66 (0.37) Post = 1.78 (0.42)
Pre = 1.64 (0.37) Post = 1.60 (0.37)
F=24.310 p<.001* 0.41
Classroom Supportiveness Classroom Climate Inventory (3rd-4th
Grade)
Pre = 2.34 (0.38) Post = 2.28 (0.40)
Pre = 2.21 (0.40) Post = 2.11 (0.41)
F=1.485 p=.223 0.11
5th-Grade Students’ Perspective Student Autonomy and
Influence Classroom Climate
Inventory (5th Grade)Pre = 1.51 (0.66) Post = 1.45 (0.58)
Pre = 1.88 (0.54) Post = 1.85 (0.51)
F=0.098 p=.755 <0.01
Classroom Supportiveness Classroom Climate Inventory (5th Grade)
Pre = 2.16 (0.72) Post = 1.94 (0.79)
Pre = 2.92 (0.65) Post = 2.63 (0.78)
F=0.419 p=.518 0.09
* indicates p<.05 based on results of repeated measures ANOVA tests
Student Wellness Results Following the logic of the program, positive changes in the teacher and in the classroom environment should lead to positive changes in the students themselves. On the post-survey, treatment teachers were asked to indicate whether they perceived changes in their students’ stress levels, behavior, and overall well-being. These results are presented in Table 6.
25

As Table 6 shows, the mean scores of 3rd- and 4th-grade students of treatment teachers changed from pre to post in the predicted direction on three of the six measured wellness aspects, and mean scores of 5th-grade students of treatment teachers changed in the predicted direction on four of the seven measured wellness aspects. Furthermore, 3rd- and 4th-grade students of treatment teachers experienced significant reductions in their frustration levels from pre to post compared to the 3rd- and 4th-grade students of control teachers, though this difference was not considered meaningful.
Table 6
Student Wellness Qualities Measured and Results
Wellness Quality Measured Scale23
Treatment Group
Mean (SD) Control Group
Mean (SD)
Test of Significance
for Interaction
(time*group)
Test of Meaningfulness
for Interaction
(Effect Size) 3rd- and 4th-Grade Students
Aggression EATQ-R SF Pre = 1.40 (0.42) Post = 1.44 (0.43)
Pre = 1.56 (0.53) Post = 1.60 (0.52)
F=0.004 p=.949 <0.01
Attention EATQ-R SF Pre = 1.77 (0.26) Post = 1.76 (0.26)
Pre = 1.73 (0.33) Post = 1.75 (0.30)
F=0.362 p=.547 0.06
Depressive Mood EATQ-R SF Pre = 1.68 (0.48) Post = 1.68 (0.49)
Pre = 1.75 (0.53) Post = 1.71 (0.53)
F=1.142 p=.286 0.09
Fear EATQ-R SF Pre = 2.22 (0.45) Post = 2.15 (0.51)
Pre = 2.22 (0.51) Post = 2.14 (0.50)
F=0.054 p=.817 <0.01
Frustration EATQ-R SF Pre = 2.05 (0.47) Post = 1.99 (0.47)
Pre = 2.12 (0.47) Post = 2.15 (0.50)
F=4.854 p=.028* 0.18
Perceptual Sensitivity EATQ-R SF Pre = 2.31 (0.57) Post = 2.36 (0.58)
Pre = 2.27 (0.59) Post = 2.37 (0.57)
F=0.680 p=.410 0.06
5th-Grade Students
Aggression EATQ-R SF Pre = 1.45 (0.84) Post = 1.36 (0.80)
Pre = 0.91 (0.71) Post = 0.78 (0.63)
F=0.242 p=.623 0.06
Attention EATQ-R SF Pre = 3.06 (0.49) Post = 3.02 (0.52)
Pre = 3.28 (0.54) Post = 3.35 (0.48)
F=1.861 p=.174 0.19
Depressive Mood EATQ-R SF Pre = 2.06 (0.72) Post = 1.94 (0.74)
Pre = 1.81 (0.64) Post = 1.79 (0.56)
F=1.073 p=.301 0.14
Fear EATQ-R SF Pre = 1.92 (0.78) Post = 1.62 (0.87)
Pre = 1.97 (0.81) Post = 1.61 (0.74)
F=0.308 p=.579 0.06
Frustration EATQ-R SF Pre = 2.42 (0.72) Post = 2.28 (.74)
Pre = 2.15 (0.74) Post = 1.99 (0.80)
F=0.062 p=.803 <0.01
Perceptual Sensitivity EATQ-R SF Pre = 2.67 (0.70) Post = 2.52 (0.76)
Pre = 2.55 (0.59) Post = 2.58 (0.77)
F=2.307 p=.130 0.21
Pleasure Sensitivity EATQ-R SF Pre = 1.84 (1.07) Post = 1.69 (1.01)
Pre = 2.38 (1.01) Post = 2.24 (1.12)
F=0.011 p=.916 <0.01
* indicates p<.05 based on results of repeated measures ANOVA tests
23 EATQ-R SF=Early Adolescent Temperament Questionnaire-Revised Short Form
26
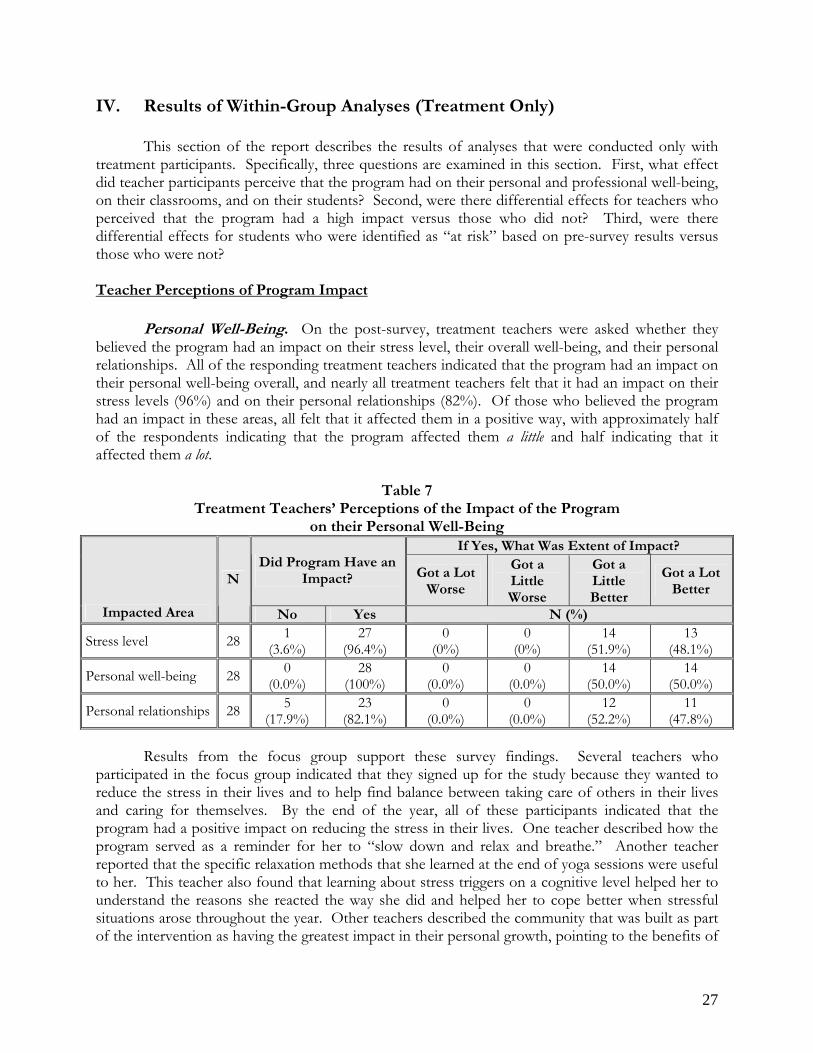
IV. Results of Within-Group Analyses (Treatment Only) This section of the report describes the results of analyses that were conducted only with
treatment participants. Specifically, three questions are examined in this section. First, what effect did teacher participants perceive that the program had on their personal and professional well-being, on their classrooms, and on their students? Second, were there differential effects for teachers who perceived that the program had a high impact versus those who did not? Third, were there differential effects for students who were identified as “at risk” based on pre-survey results versus those who were not? Teacher Perceptions of Program Impact
Personal Well-Being. On the post-survey, treatment teachers were asked whether they believed the program had an impact on their stress level, their overall well-being, and their personal relationships. All of the responding treatment teachers indicated that the program had an impact on their personal well-being overall, and nearly all treatment teachers felt that it had an impact on their stress levels (96%) and on their personal relationships (82%). Of those who believed the program had an impact in these areas, all felt that it affected them in a positive way, with approximately half of the respondents indicating that the program affected them a little and half indicating that it affected them a lot.
Table 7 Treatment Teachers’ Perceptions of the Impact of the Program
on their Personal Well-Being If Yes, What Was Extent of Impact?
Did Program Have an Impact? Got a Lot
Worse
Got a Little Worse
Got a Little Better
Got a Lot Better
Impacted Area
N
No Yes N (%)
Stress level 28 1 (3.6%)
27 (96.4%)
0 (0%)
0 (0%)
14 (51.9%)
13 (48.1%)
Personal well-being 28 0 (0.0%)
28 (100%)
0 (0.0%)
0 (0.0%)
14 (50.0%)
14 (50.0%)
Personal relationships 28 5 (17.9%)
23 (82.1%)
0 (0.0%)
0 (0.0%)
12 (52.2%)
11 (47.8%)
Results from the focus group support these survey findings. Several teachers who participated in the focus group indicated that they signed up for the study because they wanted to reduce the stress in their lives and to help find balance between taking care of others in their lives and caring for themselves. By the end of the year, all of these participants indicated that the program had a positive impact on reducing the stress in their lives. One teacher described how the program served as a reminder for her to “slow down and relax and breathe.” Another teacher reported that the specific relaxation methods that she learned at the end of yoga sessions were useful to her. This teacher also found that learning about stress triggers on a cognitive level helped her to understand the reasons she reacted the way she did and helped her to cope better when stressful situations arose throughout the year. Other teachers described the community that was built as part of the intervention as having the greatest impact in their personal growth, pointing to the benefits of
27
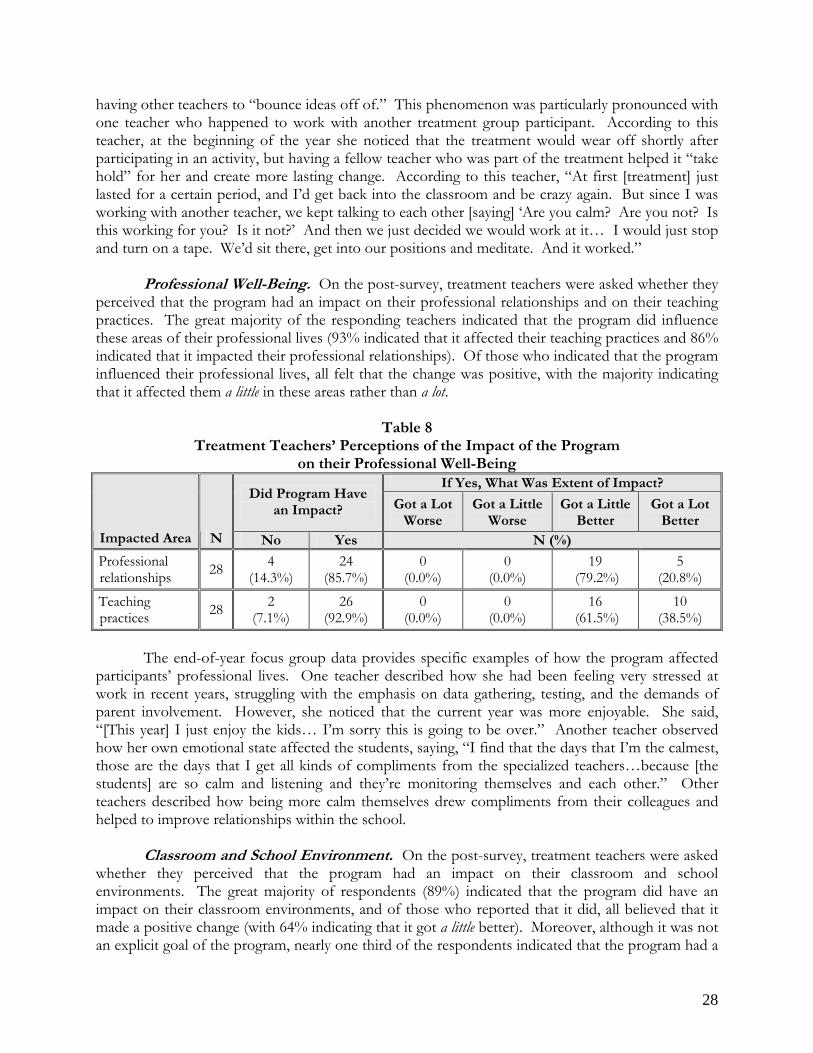
having other teachers to “bounce ideas off of.” This phenomenon was particularly pronounced with one teacher who happened to work with another treatment group participant. According to this teacher, at the beginning of the year she noticed that the treatment would wear off shortly after participating in an activity, but having a fellow teacher who was part of the treatment helped it “take hold” for her and create more lasting change. According to this teacher, “At first [treatment] just lasted for a certain period, and I’d get back into the classroom and be crazy again. But since I was working with another teacher, we kept talking to each other [saying] ‘Are you calm? Are you not? Is this working for you? Is it not?’ And then we just decided we would work at it… I would just stop and turn on a tape. We’d sit there, get into our positions and meditate. And it worked.”
Professional Well-Being. On the post-survey, treatment teachers were asked whether they perceived that the program had an impact on their professional relationships and on their teaching practices. The great majority of the responding teachers indicated that the program did influence these areas of their professional lives (93% indicated that it affected their teaching practices and 86% indicated that it impacted their professional relationships). Of those who indicated that the program influenced their professional lives, all felt that the change was positive, with the majority indicating that it affected them a little in these areas rather than a lot.
Table 8 Treatment Teachers’ Perceptions of the Impact of the Program
on their Professional Well-Being If Yes, What Was Extent of Impact?
Did Program Have an Impact? Got a Lot
Worse Got a Little
Worse Got a Little
Better Got a Lot
Better Impacted Area N No Yes N (%)
Professional relationships 28 4
(14.3%) 24
(85.7%) 0
(0.0%) 0
(0.0%) 19
(79.2%) 5
(20.8%)
Teaching practices 28 2
(7.1%) 26
(92.9%) 0
(0.0%) 0
(0.0%) 16
(61.5%) 10
(38.5%) The end-of-year focus group data provides specific examples of how the program affected participants’ professional lives. One teacher described how she had been feeling very stressed at work in recent years, struggling with the emphasis on data gathering, testing, and the demands of parent involvement. However, she noticed that the current year was more enjoyable. She said, “[This year] I just enjoy the kids… I’m sorry this is going to be over.” Another teacher observed how her own emotional state affected the students, saying, “I find that the days that I’m the calmest, those are the days that I get all kinds of compliments from the specialized teachers…because [the students] are so calm and listening and they’re monitoring themselves and each other.” Other teachers described how being more calm themselves drew compliments from their colleagues and helped to improve relationships within the school.
Classroom and School Environment. On the post-survey, treatment teachers were asked
whether they perceived that the program had an impact on their classroom and school environments. The great majority of respondents (89%) indicated that the program did have an impact on their classroom environments, and of those who reported that it did, all believed that it made a positive change (with 64% indicating that it got a little better). Moreover, although it was not an explicit goal of the program, nearly one third of the respondents indicated that the program had a
28

positive impact on their school environments as well as their individual classrooms, with 80% reporting that the school environments got a little better due to the intervention.
Table 9
Treatment Teachers’ Perceptions of the Impact of the Program on their Classroom and School Environments
If Yes, What Was Extent of Impact? Did Program Have
an Impact? Got a Lot Worse
Got a Little Worse
Got a Little Better
Got a Lot Better
Impacted Area N No Yes N (%)
Classroom environment 28 3
(10.7%) 25
(89.3%) 0
(0.0%) 0
(0.0%) 16
(64.0%) 9
(36.0%) School environment 28 18
(64.3%) 10
(35.7%) 0
(0.0%) 0
(0.0%) 8
(80.0%) 2
(20.0%) During the end-of-year focus group, treatment teachers described the impact of the program
on their classrooms, indicating that students appear to “understand each other better” after participating in the lessons. Furthermore, because of the program, students have more strategies for dealing with their stress, which has helped them function better with each other individually and as a whole class. Interestingly, however, one teacher pointed out that the program may have had a negative effect on her class, as the greater amount of openness allowed more frustrations to be aired and students came to realize that it was their fellow classmates who were causing them stress. Although other teachers in the focus group did not find similar situations in their own classrooms, most agreed that they did not have sufficient time to delve into the curriculum as much as they would have liked. In future years, they would like to start using the curriculum earlier in the school year and have more in-class support for the lessons. Students. As Table 10 shows, the great majority of respondents indicated that the program affected their students’ behavior (79%), stress levels (93%), and overall well-being (100%). Furthermore, of those who believed there was an impact, all felt it was a positive one, with approximately three quarters reporting that students improved a little in each of these areas.
Table 10
Treatment Teachers’ Perceptions of the Impact of the Program on their Students If Yes, What Was Extent of Impact?
Did Program Have an Impact? Got a Lot
Worse Got a Little
Worse Got a Little
Better Got a Lot
Better Impacted Area N No Yes N (%)
Your students’ stress levels 28 2
(7.1%) 26
(92.9%) 0
(0.0%) 0
(0.0%) 20
(76.9%) 6
(23.1%) Your students’ behavior 28 5
(17.9%) 23
(82.1%) 0
(0.0%) 0
(0.0%) 17
(73.9%) 6
(26.1%) Your students’ well-being 28 0
(0.0%) 28
(100%) 0
(0.0%) 0
(0.0%) 21
(75.0%) 7
(25.0%)
29
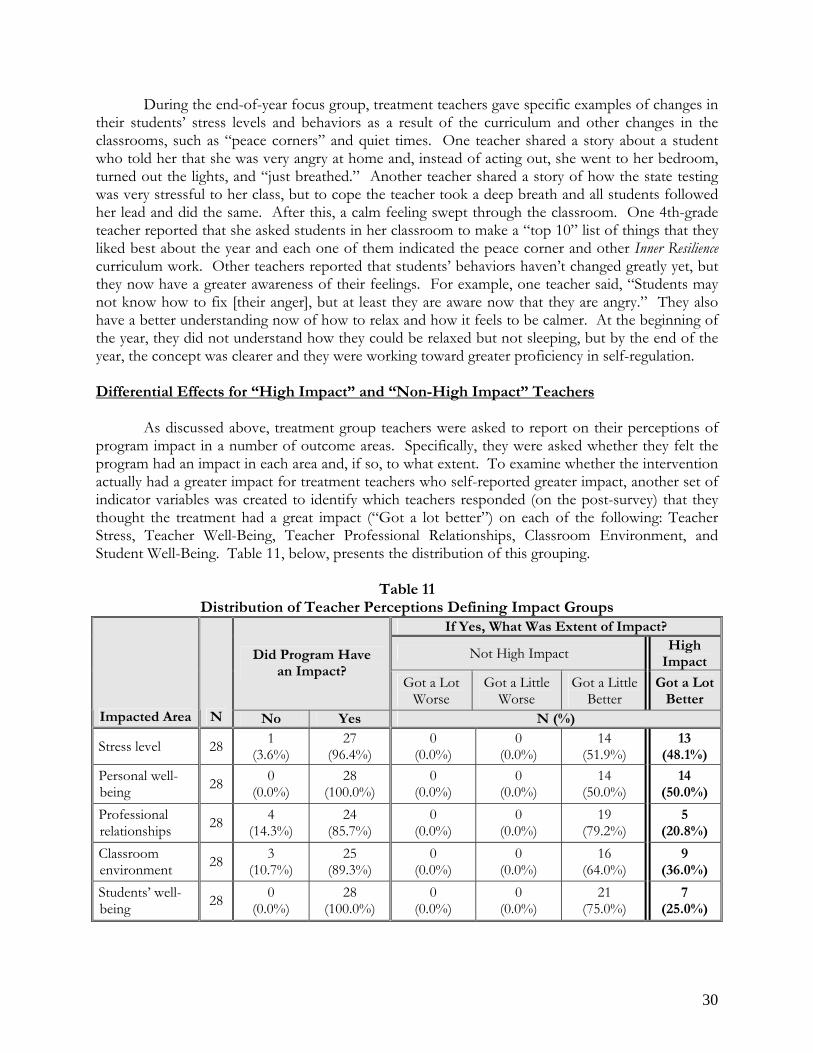
During the end-of-year focus group, treatment teachers gave specific examples of changes in their students’ stress levels and behaviors as a result of the curriculum and other changes in the classrooms, such as “peace corners” and quiet times. One teacher shared a story about a student who told her that she was very angry at home and, instead of acting out, she went to her bedroom, turned out the lights, and “just breathed.” Another teacher shared a story of how the state testing was very stressful to her class, but to cope the teacher took a deep breath and all students followed her lead and did the same. After this, a calm feeling swept through the classroom. One 4th-grade teacher reported that she asked students in her classroom to make a “top 10” list of things that they liked best about the year and each one of them indicated the peace corner and other Inner Resilience curriculum work. Other teachers reported that students’ behaviors haven’t changed greatly yet, but they now have a greater awareness of their feelings. For example, one teacher said, “Students may not know how to fix [their anger], but at least they are aware now that they are angry.” They also have a better understanding now of how to relax and how it feels to be calmer. At the beginning of the year, they did not understand how they could be relaxed but not sleeping, but by the end of the year, the concept was clearer and they were working toward greater proficiency in self-regulation. Differential Effects for “High Impact” and “Non-High Impact” Teachers
As discussed above, treatment group teachers were asked to report on their perceptions of program impact in a number of outcome areas. Specifically, they were asked whether they felt the program had an impact in each area and, if so, to what extent. To examine whether the intervention actually had a greater impact for treatment teachers who self-reported greater impact, another set of indicator variables was created to identify which teachers responded (on the post-survey) that they thought the treatment had a great impact (“Got a lot better”) on each of the following: Teacher Stress, Teacher Well-Being, Teacher Professional Relationships, Classroom Environment, and Student Well-Being. Table 11, below, presents the distribution of this grouping.
Table 11 Distribution of Teacher Perceptions Defining Impact Groups
If Yes, What Was Extent of Impact?
Not High Impact High Impact Did Program Have
an Impact? Got a Lot
Worse Got a Little
Worse Got a Little
Better Got a Lot
Better Impacted Area N No Yes N (%)
Stress level 28 1 (3.6%)
27 (96.4%)
0 (0.0%)
0 (0.0%)
14 (51.9%)
13 (48.1%)
Personal well-being 28 0
(0.0%) 28
(100.0%) 0
(0.0%) 0
(0.0%) 14
(50.0%) 14
(50.0%)
Professional relationships 28 4
(14.3%) 24
(85.7%) 0
(0.0%) 0
(0.0%) 19
(79.2%) 5
(20.8%)
Classroom environment 28 3
(10.7%) 25
(89.3%) 0
(0.0%) 0
(0.0%) 16
(64.0%) 9
(36.0%)
Students’ well-being 28 0
(0.0%) 28
(100.0%) 0
(0.0%) 0
(0.0%) 21
(75.0%) 7
(25.0%)
30

An additional series of repeated measures ANOVA tests were conducted to examine the equality of means in all related measures across impact groups and time. Considering pre- and post-test responses as the repeated factor and impact group membership as the between-groups factor allows the investigation of three overall questions:
1. In general, do mean responses for treatment teachers (and their students) change from pre- to post-survey? [Main effect (Time)]
2. In general, do mean responses for treatment teachers (and their students) differ across impact groups? (perceivers of high impact vs. others) [Main effect (Perceptions of Impact)]
3. Does the change in mean response from pre- to post-survey depend on impact group? That is, are the pre/post changes similar for treatment teachers who reported perceptions of great impact and for those that reported lower perceptions? [Interaction effect (Time*Group)]
The tables and figures in Appendix J present the results of the individual analyses by area of
impact perception. Table 12, below, provides a summary snapshot of the findings from these analyses.
Table 12 Summary Table for High Impact Analyses
Quality Measured Scale24
High-Impact Group
Mean (SD)
Non-High Impact Group
Mean (SD)
Test of Significance for
Interaction (time*group)
Test of Meaningfulness
for Interaction
(Effect Size) Teacher Stress
Stress Stress Likert Scale Pre = 5.17 (0.94) Post = 4.17 (1.34)
Pre = 5.07 (1.14) Post = 4.86 (1.35)
F=1.699 p=.205 0.53
Stress PSS Pre = 24.63 (6.95) Post = 13.77 (6.93)
Pre = 21.40 (5.18) Post = 20.60 (5.19)
F=10.686 p=.003* 0.41
Teacher Well-Being
Body Awareness BAQ Pre = 4.56 (0.79) Post = 4.93 (0.92)
Pre = 4.27 (1.25) Post = 4.91 (0.92)
F=0.193 p=.664 0.17
Task-Oriented Coping CISS Pre = 54.64 (6.75) Post = 58.64(6.86)
Pre = 57.21 (6.92) Post = 57.79 (8.06.)
F=1.915 p=.178 0.54
Emotion-Oriented Coping
CISS Pre = 50.07 (10.00)Post = 37.71 (9.14)
Pre = 46.00 (8.31) Post = 43.64 (10.93)
F=8.757 p=.006* 1.16
Avoidance-Oriented Coping CISS Pre = 52.21 (10.22)
Post = 54.93 (5.41)Pre = 50.21 (8.12) Post = 49.93 (7.08)
F<0.001 p=1.000 <0.01
Avoidance Coping via Distraction CISS Pre = 26.71 (5.01)
Post = 25.64 (2.65)Pre = 23.14 (5.46) Post = 22.07 (6.18)
F <0.001 p=1.000 <0.01
Avoidance Coping via Social Diversion CISS Pre = 18.93 (4.91)
Post = 19.36 (1.95)Pre = 18.86 (4.79) Post = 19.93 (3.00)
F=0.149 p=.703 0.16
Mindfulness MAAS Pre = 3.44 (0.55) Post = 4.24 (0.50)
Pre = 3.84 (0.62) Post = 4.16 (0.48)
F=4.771 p=.038* 0.86
Compassion Satisfaction
ProQOL Pre = 38.71 (8.57) Post = 42.00 (7.19)
Pre = 35.00 (8.99) Post = 30.71 (10.71)
F=5.498 p=.027* 0.92
24 PSS=Perceived Stress Scale; BAQ=Body Awareness Questionnaire; CISS=Coping Inventory for Stressful Situations; MAAS=Mindfulness Attention Awareness Scale; ProQOL=Professional Quality of Life Scale; MBI-ES=Maslach Burnout Inventory-Educator Survey; EATQ-R SF=Early Adolescent Temperament Questionnaire-Revised Short Form
31
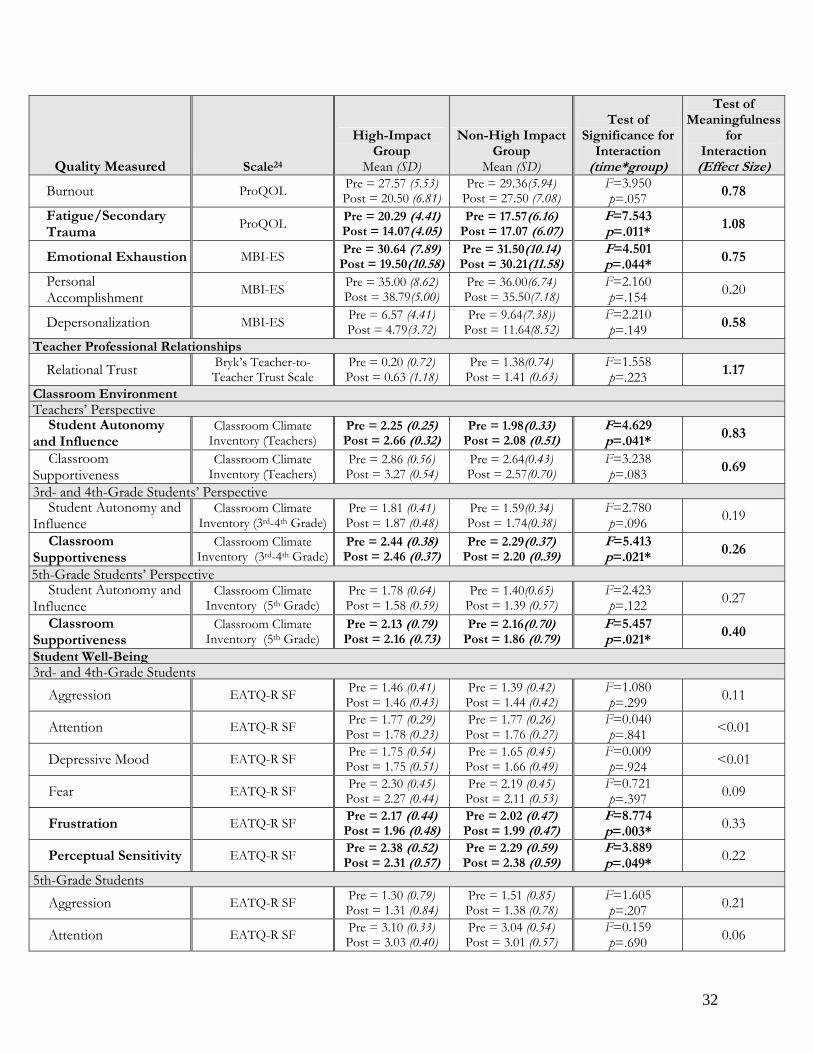
Quality Measured Scale24
High-Impact Group
Mean (SD)
Non-High Impact Group
Mean (SD)
Test of Significance for
Interaction (time*group)
Test of Meaningfulness
for Interaction
(Effect Size)
Burnout ProQOL Pre = 27.57 (5.53) Post = 20.50 (6.81)
Pre = 29.36(5.94) Post = 27.50 (7.08)
F=3.950 p=.057 0.78
Fatigue/Secondary Trauma
ProQOL Pre = 20.29 (4.41) Post = 14.07(4.05)
Pre = 17.57(6.16) Post = 17.07 (6.07)
F=7.543 p=.011* 1.08
Emotional Exhaustion MBI-ES Pre = 30.64 (7.89) Post = 19.50(10.58)
Pre = 31.50(10.14) Post = 30.21(11.58)
F=4.501 p=.044* 0.75
Personal Accomplishment MBI-ES Pre = 35.00 (8.62)
Post = 38.79(5.00) Pre = 36.00(6.74) Post = 35.50(7.18)
F=2.160 p=.154 0.20
Depersonalization MBI-ES Pre = 6.57 (4.41) Post = 4.79(3.72)
Pre = 9.64(7.38)) Post = 11.64(8.52)
F=2.210 p=.149 0.58
Teacher Professional Relationships
Relational Trust Bryk’s Teacher-to-Teacher Trust Scale
Pre = 0.20 (0.72) Post = 0.63 (1.18)
Pre = 1.38(0.74) Post = 1.41 (0.63)
F=1.558 p=.223 1.17
Classroom Environment Teachers’ Perspective
Student Autonomy and Influence
Classroom Climate Inventory (Teachers)
Pre = 2.25 (0.25) Post = 2.66 (0.32)
Pre = 1.98(0.33) Post = 2.08 (0.51)
F=4.629 p=.041* 0.83
Classroom Supportiveness
Classroom Climate Inventory (Teachers)
Pre = 2.86 (0.56) Post = 3.27 (0.54)
Pre = 2.64(0.43) Post = 2.57(0.70)
F=3.238 p=.083 0.69
3rd- and 4th-Grade Students’ Perspective Student Autonomy and
Influence Classroom Climate
Inventory (3rd-4th Grade) Pre = 1.81 (0.41) Post = 1.87 (0.48)
Pre = 1.59(0.34) Post = 1.74(0.38)
F=2.780 p=.096 0.19
Classroom Supportiveness
Classroom Climate Inventory (3rd-4th Grade)
Pre = 2.44 (0.38) Post = 2.46 (0.37)
Pre = 2.29(0.37) Post = 2.20 (0.39)
F=5.413 p=.021* 0.26
5th-Grade Students’ Perspective Student Autonomy and
Influence Classroom Climate
Inventory (5th Grade) Pre = 1.78 (0.64) Post = 1.58 (0.59)
Pre = 1.40(0.65) Post = 1.39 (0.57)
F=2.423 p=.122 0.27
Classroom Supportiveness
Classroom Climate Inventory (5th Grade)
Pre = 2.13 (0.79) Post = 2.16 (0.73)
Pre = 2.16(0.70) Post = 1.86 (0.79)
F=5.457 p=.021* 0.40
Student Well-Being 3rd- and 4th-Grade Students
Aggression EATQ-R SF Pre = 1.46 (0.41) Post = 1.46 (0.43)
Pre = 1.39 (0.42) Post = 1.44 (0.42)
F=1.080 p=.299 0.11
Attention EATQ-R SF Pre = 1.77 (0.29) Post = 1.78 (0.23)
Pre = 1.77 (0.26) Post = 1.76 (0.27)
F=0.040 p=.841 <0.01
Depressive Mood EATQ-R SF Pre = 1.75 (0.54) Post = 1.75 (0.51)
Pre = 1.65 (0.45) Post = 1.66 (0.49)
F=0.009 p=.924 <0.01
Fear EATQ-R SF Pre = 2.30 (0.45) Post = 2.27 (0.44)
Pre = 2.19 (0.45) Post = 2.11 (0.53)
F=0.721 p=.397 0.09
Frustration EATQ-R SF Pre = 2.17 (0.44) Post = 1.96 (0.48)
Pre = 2.02 (0.47) Post = 1.99 (0.47)
F=8.774 p=.003* 0.33
Perceptual Sensitivity EATQ-R SF Pre = 2.38 (0.52) Post = 2.31 (0.57)
Pre = 2.29 (0.59) Post = 2.38 (0.59)
F=3.889 p=.049* 0.22
5th-Grade Students Aggression EATQ-R SF Pre = 1.30 (0.79)
Post = 1.31 (0.84) Pre = 1.51 (0.85) Post = 1.38 (0.78)
F=1.605 p=.207 0.21
Attention EATQ-R SF Pre = 3.10 (0.33) Post = 3.03 (0.40)
Pre = 3.04 (0.54) Post = 3.01 (0.57)
F=0.159 p=.690 0.06
32
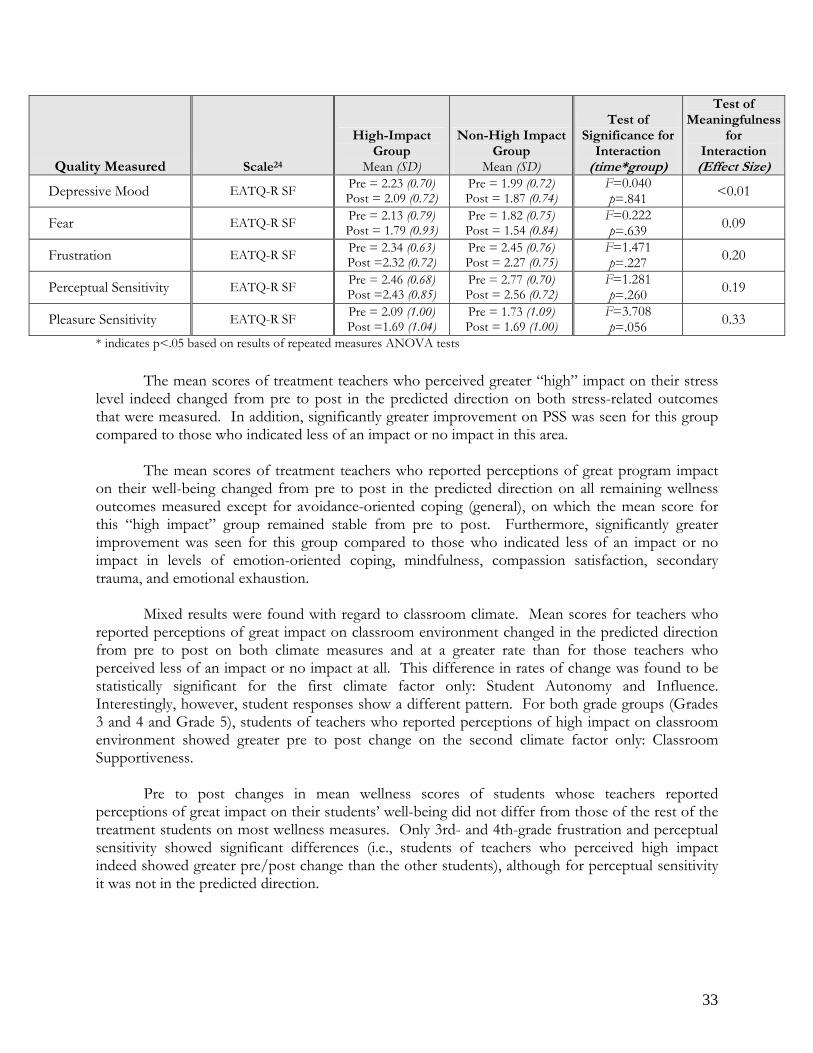
Quality Measured Scale24
High-Impact Group
Mean (SD)
Non-High Impact Group
Mean (SD)
Test of Significance for
Interaction (time*group)
Test of Meaningfulness
for Interaction
(Effect Size)
Depressive Mood EATQ-R SF Pre = 2.23 (0.70) Post = 2.09 (0.72)
Pre = 1.99 (0.72) Post = 1.87 (0.74)
F=0.040 p=.841 <0.01
Fear EATQ-R SF Pre = 2.13 (0.79) Post = 1.79 (0.93)
Pre = 1.82 (0.75) Post = 1.54 (0.84)
F=0.222 p=.639 0.09
Frustration EATQ-R SF Pre = 2.34 (0.63) Post =2.32 (0.72)
Pre = 2.45 (0.76) Post = 2.27 (0.75)
F=1.471 p=.227 0.20
Perceptual Sensitivity EATQ-R SF Pre = 2.46 (0.68) Post =2.43 (0.85)
Pre = 2.77 (0.70) Post = 2.56 (0.72)
F=1.281 p=.260 0.19
Pleasure Sensitivity EATQ-R SF Pre = 2.09 (1.00) Post =1.69 (1.04)
Pre = 1.73 (1.09) Post = 1.69 (1.00)
F=3.708 p=.056 0.33
* indicates p<.05 based on results of repeated measures ANOVA tests
The mean scores of treatment teachers who perceived greater “high” impact on their stress
level indeed changed from pre to post in the predicted direction on both stress-related outcomes that were measured. In addition, significantly greater improvement on PSS was seen for this group compared to those who indicated less of an impact or no impact in this area.
The mean scores of treatment teachers who reported perceptions of great program impact on their well-being changed from pre to post in the predicted direction on all remaining wellness outcomes measured except for avoidance-oriented coping (general), on which the mean score for this “high impact” group remained stable from pre to post. Furthermore, significantly greater improvement was seen for this group compared to those who indicated less of an impact or no impact in levels of emotion-oriented coping, mindfulness, compassion satisfaction, secondary trauma, and emotional exhaustion.
Mixed results were found with regard to classroom climate. Mean scores for teachers who reported perceptions of great impact on classroom environment changed in the predicted direction from pre to post on both climate measures and at a greater rate than for those teachers who perceived less of an impact or no impact at all. This difference in rates of change was found to be statistically significant for the first climate factor only: Student Autonomy and Influence. Interestingly, however, student responses show a different pattern. For both grade groups (Grades 3 and 4 and Grade 5), students of teachers who reported perceptions of high impact on classroom environment showed greater pre to post change on the second climate factor only: Classroom Supportiveness.
Pre to post changes in mean wellness scores of students whose teachers reported perceptions of great impact on their students’ well-being did not differ from those of the rest of the treatment students on most wellness measures. Only 3rd- and 4th-grade frustration and perceptual sensitivity showed significant differences (i.e., students of teachers who perceived high impact indeed showed greater pre/post change than the other students), although for perceptual sensitivity it was not in the predicted direction.
33

Differential Effects for “High Risk” and “Non-High Risk” Students
To examine whether the intervention had a differential impact for “high-risk” students vs. the rest of the treatment sample, students were first categorized into “high risk” and “not high risk” groups for each wellness factor, as follows:
For all negative wellness factors (e.g., aggression, frustration, depression), a cutoff score of one standard deviation above the mean pre-test score was established. All treatment students with pre-test scores above this cutoff were identified as “high risk” on that particular factor.
For all positive wellness factors (e.g., attention, perceptual sensitivity), a cutoff score of one standard deviation below the mean pre-survey score was established. All treatment students with pre-test scores below this cutoff were identified as “high risk” on that particular factor.
A new set of variables was created to indicate a student’s high-risk status on each wellness
factor. These indicators were computed and analyzed separately for the 3rd- and 4th-grade students and for 5th grade students.
A new series of repeated measures ANOVA tests were conducted to examine the equality of means across high-risk status groups and time. Considering pre- and post-test responses as the repeated factor and high-risk status group membership as the between-groups factor allows the investigation of three overall questions:
1. In general, do mean responses for treatment students change from pre- to post-survey? [Main effect (Time)]
2. In general, do mean responses for treatment students differ across high-risk status groups? (high risk vs. not high risk) [Main effect (High Risk)]
3. Does the change in mean response from pre- to post-survey depend on high-risk status group? That is, are the pre/post changes similar for high-risk students and non-high-risk students? [Interaction effect (Time*Group)]
The tables and figures in Appendix K present the results of the individual analyses, first for
3rd- and 4th-grade students and then for 5th-grade students. Table 13, below, provides a summary snapshot of the findings from these analyses.
Table 13 Summary Table for High Risk Analyses
Student Wellness Quality Measured Scale25
High-Risk GroupMean (SD)
Non-High Risk Group
Mean (SD)
Test of Significance for Interaction (time*group)
Test of Meaningfulness
for Interaction
(Effect Size) 3rd- and 4th-Grade Students
Aggression EATQ-R SF Pre = 2.23 (0.31) Post = 1.93 (0.53)
Pre = 1.27 (0.26) Post = 1.37 (0.35)
F=44.969 p<.001* 0.75
Attention EATQ-R SF Pre = 1.33 (0.13) Pre = 1.85 (0.19) F=84.431 1.03
25 EATQ-R SF=Early Adolescent Temperament Questionnaire-Revised Short Form
34
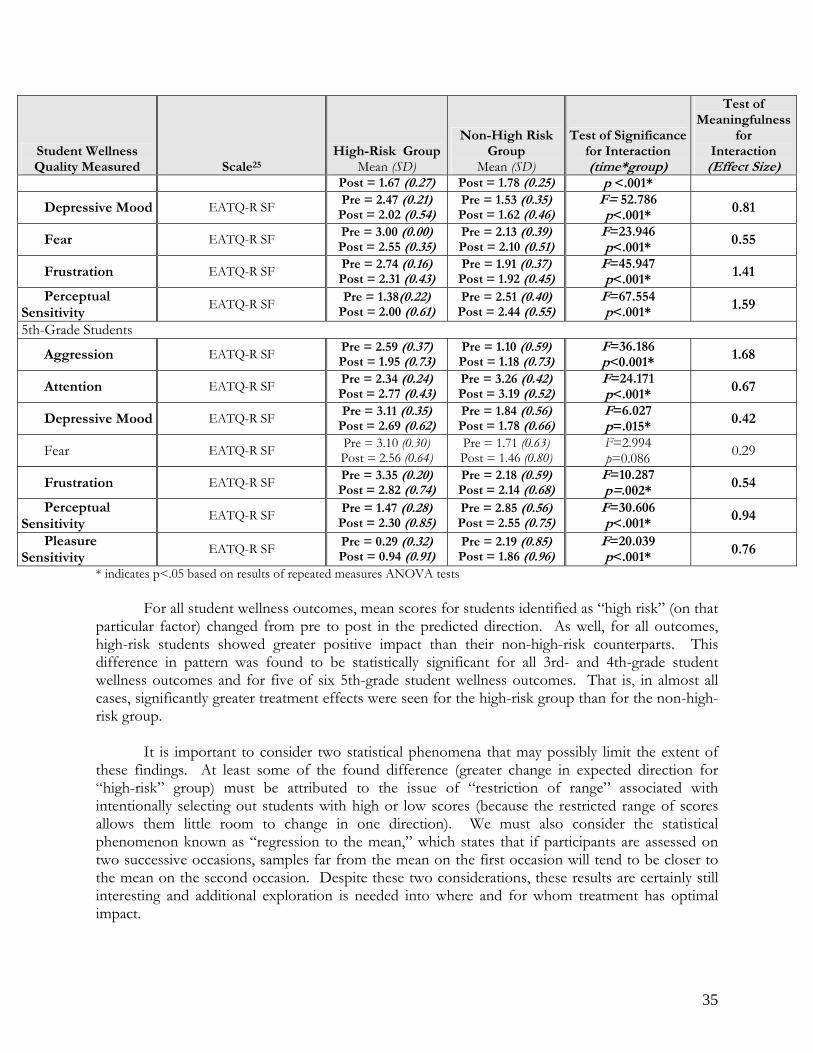
Student Wellness Quality Measured Scale25
High-Risk GroupMean (SD)
Non-High Risk Group
Mean (SD)
Test of Significance for Interaction (time*group)
Test of Meaningfulness
for Interaction
(Effect Size) Post = 1.67 (0.27) Post = 1.78 (0.25) p <.001*
Depressive Mood EATQ-R SF Pre = 2.47 (0.21) Post = 2.02 (0.54)
Pre = 1.53 (0.35) Post = 1.62 (0.46)
F= 52.786 p<.001* 0.81
Fear EATQ-R SF Pre = 3.00 (0.00) Post = 2.55 (0.35)
Pre = 2.13 (0.39) Post = 2.10 (0.51)
F=23.946 p<.001* 0.55
Frustration EATQ-R SF Pre = 2.74 (0.16) Post = 2.31 (0.43)
Pre = 1.91 (0.37) Post = 1.92 (0.45)
F=45.947 p<.001* 1.41
Perceptual Sensitivity
EATQ-R SF Pre = 1.38(0.22) Post = 2.00 (0.61)
Pre = 2.51 (0.40) Post = 2.44 (0.55)
F=67.554 p<.001* 1.59
5th-Grade Students
Aggression EATQ-R SF Pre = 2.59 (0.37) Post = 1.95 (0.73)
Pre = 1.10 (0.59) Post = 1.18 (0.73)
F=36.186 p<0.001* 1.68
Attention EATQ-R SF Pre = 2.34 (0.24) Post = 2.77 (0.43)
Pre = 3.26 (0.42) Post = 3.19 (0.52)
F=24.171 p<.001* 0.67
Depressive Mood EATQ-R SF Pre = 3.11 (0.35) Post = 2.69 (0.62)
Pre = 1.84 (0.56) Post = 1.78 (0.66)
F=6.027 p=.015* 0.42
Fear EATQ-R SF Pre = 3.10 (0.30) Post = 2.56 (0.64)
Pre = 1.71 (0.63) Post = 1.46 (0.80)
F=2.994 p=0.086 0.29
Frustration EATQ-R SF Pre = 3.35 (0.20) Post = 2.82 (0.74)
Pre = 2.18 (0.59) Post = 2.14 (0.68)
F=10.287 p=.002* 0.54
Perceptual Sensitivity
EATQ-R SF Pre = 1.47 (0.28) Post = 2.30 (0.85)
Pre = 2.85 (0.56) Post = 2.55 (0.75)
F=30.606 p<.001* 0.94
Pleasure Sensitivity
EATQ-R SF Pre = 0.29 (0.32) Post = 0.94 (0.91)
Pre = 2.19 (0.85) Post = 1.86 (0.96)
F=20.039 p<.001* 0.76
* indicates p<.05 based on results of repeated measures ANOVA tests
For all student wellness outcomes, mean scores for students identified as “high risk” (on that particular factor) changed from pre to post in the predicted direction. As well, for all outcomes, high-risk students showed greater positive impact than their non-high-risk counterparts. This difference in pattern was found to be statistically significant for all 3rd- and 4th-grade student wellness outcomes and for five of six 5th-grade student wellness outcomes. That is, in almost all cases, significantly greater treatment effects were seen for the high-risk group than for the non-high-risk group.
It is important to consider two statistical phenomena that may possibly limit the extent of these findings. At least some of the found difference (greater change in expected direction for “high-risk” group) must be attributed to the issue of “restriction of range” associated with intentionally selecting out students with high or low scores (because the restricted range of scores allows them little room to change in one direction). We must also consider the statistical phenomenon known as “regression to the mean,” which states that if participants are assessed on two successive occasions, samples far from the mean on the first occasion will tend to be closer to the mean on the second occasion. Despite these two considerations, these results are certainly still interesting and additional exploration is needed into where and for whom treatment has optimal impact.
35
V. Summary and Discussion Summary
The present study used a randomized control trial to examine whether transformative professional development designed to strengthen teachers’ inner resilience had an impact on participating teachers’ stress levels and overall well-being, the climate of their classrooms, and the well-being of their students. A total of 57 teachers from NYC public schools participated in the study, with 29 teachers (and their students) randomly assigned to the treatment condition and 28 teachers and their students randomly assigned to the control condition. Teachers in the treatment condition participated in the Inner Resilience Program during the 2007–2008 school year. Activities included a series of weekly yoga classes, monthly Nurturing the Inner Life meetings, a weekend residential retreat, and training and support in the use of a curriculum module for students.
The theory of change for the program is visually depicted in a logic model that was created
before the start of the study. The intervention for the teachers was intended to reduce their stress levels, increase their positive coping skills, improve their concentration and attention, increase their job satisfaction, and enhance their relationships with their colleagues. These changes in the teachers theoretically have a positive influence on the climate of their classrooms, which in turn affects students’ wellness with regard to stress and frustration levels, attention, and acting out behaviors (among others). In addition, the program is intended to reach students directly through curriculum activities designed for reducing their stress in the classroom.
To test the assumptions contained in the logic model, teachers from the treatment and
control groups completed a battery of surveys in the fall and spring of the 2007–2008 school year. In addition to the battery of surveys designed to measure change from pre to post, treatment teachers completed survey questions that asked them about their perceptions of the effects of the program. Furthermore, data collected on the perceived impact of treatment were enhanced by an end-of-year focus group with a sample of treatment teachers.
A series of repeated measures ANOVAs were conducted to determine whether changes from pre- to post-survey were different for the treatment and the control group participants. Several interesting and notable results were found with regard to teacher wellness. For example, analyses indicated that treatment teachers had reduced stress levels (as measured by one scale), increased levels of attention and mindfulness, and greater perceived relational trust with their colleagues. Interesting results were also found with regard to changes in classroom climate. For example, 3rd-grade students of treatment teachers perceived that they had significantly more autonomy and influence in their classes at the end of the school year than at the beginning. Furthermore, analyses of student wellness indicated that the program had a significant, positive impact on reducing 3rd- and 4th-grade students’ frustration levels.
To further examine the effects of the program, several within-group (treatment only)
analyses were conducted. First, treatment teachers were asked how effective they perceived the treatment was through surveys and focus groups. Overall, treatment teachers’ perceptions of change resulting from the program were overwhelmingly positive. In terms of their own wellness, treatment teachers perceived that the program allowed them time and permission to take care of themselves and, as a result, to feel “more balanced” than they had previously. Several teachers in the treatment
36
group described the residential retreat as “life changing” and were particularly positive about the opportunities they had to bond with other teachers who shared similar experiences. Likewise, many teachers reported feeling less stressed at work and more satisfied with their jobs than they had in recent years.
Qualitative data collected to assess the impact of the program on the classroom climate of
treatment teachers were also generally very positive. In focus groups, teachers described how the climate of their class was more relaxed after implementing the mindfulness and relaxation lessons, as well as the other curriculum components, such as creating peace corners and having a daily period of “quiet time.” At least one teacher noted how her emotions directly affected the behaviors of her students both positively and negatively. Most teachers were strongly positive about the changes in their classrooms, but most also wished that they had more time to implement the curriculum and more in-class support from program personnel to ensure that they were implementing it appropriately. Furthermore, one teacher reported that the changes actually had an initial negative impact on the climate, as they brought to the surface issues between students that had previously been hidden.
Qualitative data collected around changes in students’ wellness were very positive overall.
Many treatment teachers reported that students were more aware of their emotions and emotional triggers and had a better understanding of how to relax. Several teachers who talked about the power of this work in children’s lives shared stories of how students asked to extend the Inner Resilience curriculum work that they practiced in class and frequently used the practices on their own when they were feeling anxious or frustrated.
To more deeply examine the effects of the program, a series of repeated measures ANOVA
tests were conducted to determine whether the program had greater impact for teachers who perceived that it had a very strong impact (“high-impact teachers”) as opposed to those who did not (“non-high-impact teachers”). Analyses of these results indicated that high-impact teachers did improve at a significantly greater rate than non-high-impact teachers on several indicators of wellness, including a reduction in the use of emotion-oriented coping skills, increased mindfulness and compassion satisfaction, and reduced fatigue/secondary trauma and emotional exhaustion. Differences between the high-impact and non-high-impact teachers with regard to their classroom climates and the well-being of their students were mixed. Although high-impact teachers perceived that their classes had greater autonomy and influence, students of these teachers perceived greater classroom supportiveness than students of non-high-impact teachers. With regard to student wellness, it is notable that students of high-impact teachers were lower in frustration, but also lower in perceptual sensitivity, than non-high-impact teachers.
The last set of within-group analyses provided perhaps the most interesting results. A
separate set of repeated measures ANOVA tests were conducted to determine whether the program had more effect on treatment teachers’ students who were categorized as “high risk” based on their pre-survey scores. A remarkable pattern emerged, indicating that 3rd- and 4th-grade high-risk students showed greater positive change than their non-high-risk peers on each of the student wellness outcomes, and 5th-grade high-risk students showed greater positive change on five of the six student wellness outcomes than the non-high-risk students. Although two statistical phenomena—“restriction of range” and “regression to the mean”—must be considered when evaluating these results, they are highly notable and merit additional research.
37
Discussion Overall, this study provides important findings for the educational community. The results
indicate that the Inner Resilience Program had the intended effect of helping teachers to focus on their inner selves and improve their own wellness. Specifically, the study found that the program had the effect of reducing teachers’ perceived stress. These results are extremely important considering the research discussed earlier. It is now well documented that teachers have highly stressful jobs and are at risk of leaving the teaching profession or—equally problematic—staying and burning out. In either case, students lose out when they do not have effective teachers in the classroom. Feelings of stress and the inability to deal with stress are consistent reasons why teachers become dissatisfied in their careers and leave teaching (Darling-Hammond, 1991; Montgomery & Rupp, 2005). Furthermore, as Jennings and Greenberg (in press) note, high levels of emotional stress can lead to burnout, which has the cascading effect of impacting teacher-student relationships, classroom management, and classroom climate. Furthermore, the climate of the classroom and the relationships that students have with their teachers can have a lasting impact on students’ social and emotional development. For example, Hamre and Pianta (2001) followed kindergarten students through 4th grade and found that teachers’ reports of negative affect in relation to a student continued to affect their social and academic performance through the years.
The results produced by the Inner Resilience Program, including stress reduction, increased
mindfulness, and improved relationships with colleagues, have the potential to break the negative cycle described above. Research has shown that mindfulness is associated with more positive affect, reduced anxiety and depression, and better relationships with others (Brown & Ryan, 2003; Barnes, Brown, Krusemark, Campbell, & Rogge, 2007). Consequently, these changes in teachers’ mind sets can have a positive impact on classroom climate. Indeed, Marzano and colleagues (2003) conducted a meta-analysis of more than 100 studies of classroom management and found that a teacher’s “mental set” had the greatest effect on reducing misbehaviors. Teachers who were able to remain objective and calm under pressure were the best behavior managers.
In other important results, this study found that the Inner Resilience Program can improve
teachers’ perceptions of relational trust with their colleagues. These results are particularly important considering the work of Bryk and Schneider (2002), who contend that schools that are high in relational trust are more likely to make improvements in student achievement. They also found that without changes in school social climates, reforms in curriculum, instruction, teacher preparation, and teacher professional development have little chance of succeeding. Furthermore, in his review of relevant research, Murray (2005) found that the social-emotional climate of schools is a significant factor in new teachers’ decisions of whether to stay in the classroom or not. Specifically, according to this researcher, the ability of new teachers to foster positive relationships with their students and their colleagues can “make or break” their teaching careers, and the most important factor for schools to consider with regard to retention is the quality of the relationships between new teachers and their colleagues.
The present study also examined the path of changes in teachers to the climate of the
classrooms and to the wellness of their students. Many interesting results were found in these analyses as well. For example, there is evidence that changes in the wellness of teachers can create classroom contexts where students are viewed more as individuals and have more student autonomy and influence. There may also be a greater feeling of community in treated teachers’ classrooms. Furthermore, changes in the teachers, along with direct intervention through the use of the
38
curriculum, can reduce students’ levels of frustration. Although these results are interesting and important to note, the brief nature of the intervention may have impacted the strength of the results. The most powerful results were observed with the teachers themselves. Impact on the classrooms and on the students’ wellness decreased in strength as the intervention became more removed. Increasing the strength and, importantly, the duration of the intervention would likely increase the impact that the program would have on teachers’ classroom climates and their students’ wellness.
The within-treatment analyses also provided useful results. It is evident that teachers who
perceived that treatment had a greater effect on them did in fact show more improvement across a number of areas, including reductions in stress and two components of burnout (fatigue/secondary trauma and emotional exhaustion) and increases in mindfulness. The amount that these differences extended to these “high-impact” teachers’ classrooms and their students varied, however, and did not provide clear evidence of powerful differences. On the other hand, analyses of “high-risk” students did provide remarkable results, suggesting that the most vulnerable students may see the greatest benefit from the program. These results are important considering the needs of these students and the potential benefits of breaking negative cycles and treating such problems before they escalate. Limitations
Conducting randomized controlled trials is rife with challenges, such as recruiting and
maintaining sufficient participants to have a powerful study, gaining consent for student participants, and choosing the most appropriate instruments to measure change. The present study met with each of these challenges and, notwithstanding the multiple important findings, had a number of limitations. Specifically:
• The study had limited statistical power. It is possible that many more of the differences between the treatment and control groups would have achieved statistical significance if the study had greater power, which might have been obtained by having more participants, instruments that more closely measured the construct that is affected, and/or having an intervention of a longer duration.
• It should be noted that some differences between the treatment and control group teachers, such as age and the stressors that they had in their lives before and over the course of the study, may account for the fact that treatment effects were not even stronger.
• There were differences in the student groups. The 5th-grade students in the treatment group were higher in aggression, depressive mood, and frustration and lower in attention and pleasure sensitivity than the control group students at both pre- and post-survey. The fact that there was a considerably higher percentage of 5th-grade students in the treatment group than in the control group and that they were different across multiple dimensions may account for the fact that treatment effects were not evident.
• The effect of asking teachers to think back to how they were feeling in the previous June when they completed the pre-survey may have affected the extent of differences between the groups. The results suggest that participants in both groups may have recalled how they felt at the end of the previous school year more negatively than they actually felt at the time. This effect would theoretically be negated by the fact that both treatment and control group teachers would have the same experience, but it is possible that treatment effects were overwhelmed by the impact of recall.
39
• All instruments were self-perception surveys. Future research designs would be strengthened by impartial observers who visit a sample of classrooms multiple times over the course of the school year to determine whether there are changes in the climate of the classroom. Also, objective biological measures of stress and anxiety should be included in future designs.
• The student survey used in this study was comprised of select sections of a published survey (that were altered in the 3rd- and 4th-grade version), rather than a complete battery, which may have impacted the strength of the results.
• It should be considered that the duration and strength of treatment may need to be increased to see certain changes in student wellness across all grades. That is, treatment may need to be introduced at the beginning of the school year rather than mid-year, and it may take more time for changes in teachers’ wellness to reach the classroom and affect individual students.
Suggestions for Further Research
The results of this study can provide helpful insight into the direction of future research in the field. For example, further research is needed to examine whether increased strength and duration of treatment would, in fact, demonstrate greater impact; to explore whether these results can be generalized to other groups of teachers, including those outside of the NYC area; and to determine whether changes in the research design might lead to greater strength in results. A few specific suggestions for additional research include the following:
• Include a larger sample of participants to add greater power to the analyses and reduce the
error caused by initial differences between the groups; • Start in the previous school year so that change might be measured from June to June, rather
than from September to June, thus eliminating the error caused by asking teachers to “think back” to the previous spring;
• Include classroom observations in which impartial observers would visit classrooms multiple times over the course of a school year and, using a published, structured protocol, assess the classroom climate;
• Include objective, biological measures of participants’ stress and anxiety levels; • Allow for an intervention of longer duration, with a full year of curriculum implementation
in the classroom; and • Revisit the instruments used and ensure that they are appropriate for the population being
assessed and well aligned with the changes that are expected from the program intervention.
40
References
Barnes, S., Brown, K. W., Krusemark, E., Campbell, W. K., & Rogge, R. D. (2007). The role of mindfulness in romantic relationship satisfaction and responses to relationship stress. Journal of Marital and Family Therapy, 33(4), 482–500.
Brown, K. W., & Ryan, R. M. (2003). The benefits of being present: Mindfulness and its role in
psychological well-being. Journal of Personality and Social Psychology, 84(4), 822–848. Bryk, A. S., & Schneider, B. (2002). Trust in schools: A core resource for improvement. New York: Russel
Sage Foundation. Byrne, B. M. (1993). Burnout: Testing for the validity, replication, and invariance of causal structure
across elementary, intermediate, and secondary teachers. American Educational Research Journal, 31(3), 645–673.
Capaldi, D. M., & Rothbart, M. K. (1992). Development and validation of an early adolescent
temperament measure. Journal of Early Adolescence, 12(2), 153–173. Cohen, J. (1992). A power primer. Psychological Bulletin, 112, 155-159. Cohen, S., Kamarck, T., & Mermelstein, R. (1983). A global measure of perceived stress. Journal of
Health and Social Behavior, 24(4), 385–396. Cosway, R., Endler, N. S., Sadler, A. J., & Dreary, I. J. (2000). The Coping inventory for stressful
situations: Factorial structure and associations with personality traits and psychological health. Journal of Applied Biobehavioral Research, 5, 121–143.
Darling-Hammond, L. (2001). The challenge of staffing our schools. Educational Leadership, 58, 12-
17. Developmental Studies Center. (2005). Scales from Student Questionnaire, Child Development Project for
Elementary School Students (Grades 3-6). Oakland, CA: Developmental Studies Center. Ellis, L. K., & Rothbart, M. K. (2001). Revision of the adolescent temperament questionnaire.
Poster presented at the 2001 Biennial Meeting of the Society for Research in Child Development, Minneapolis, MN.
Endler, N., & Parker, J. (1999). Coping inventory for stressful situations (CISS): Manual. Canada: Multi-
Health Systems, Inc. Garrison Institute (2005). Contemplation and education—A survey of programs using contemplative techniques in
K-12 educational settings: A mapping report. Garrison, NY: Garrison Institute. Hamre, B., & Pianta, R. C. (2001). Early teacher-child relationships and trajectory of school
outcomes through eighth grade. Child Development, 72, 625–38.
41
Ingersoll, R., & Smith, T. (2003). The wrong solution to the teacher shortage. Educational Leadership, 60(8), 30–33.
Iwanicki, E. F., & Schwab, R. L. (1981). A cross validation study of the Maslach Burnout Inventory.
Educational and Psychological Measurement, 41, 1167–1174. Jennings, P. A., & Greenberg, M. T. (in press). The prosocial classroom: Teacher social and
emotional competence in relation to student and classroom outcomes. Review of Educational Research.
Kabat-Zinn, J. (1993). Mindfulness meditation: Health benefits of an ancient Buddhist practice. In
D. Goleman and J. Durin (Eds.), Mind/Body Medicine, (pp. 259-275). Yonkers, NY: Consumer Reports Books.
Kabat-Zinn, J. (2003). Mindfulness-based interventions in context: Past, present, and future. Clinical
Psychology: Science and Practice, 10, 144–156. Kyriacou, C. (2001). Teacher stress: Directions for future research. Educational Review, 53(1), 27–35. Lantieri, L. (2008). Building emotional intelligence: Techniques to cultivate inner strength in children. Boulder,
CO: Sounds True. Marzano, R. J., Marzano, J. S., & Pickering, D. J. (2003). Classroom management that works. Alexandria,
VA: ASCD. Maslach, C., & Jackson, S. E. (1981). The measurement of experienced burnout. Journal of
Occupational Behaviour, 2, 99–113. Maslach, C., Jackson, S. E., & Leiter, M. P. (1996). Maslach burnout inventory manual (3rd ed.). Palo Alto,
CA: Consulting Psychologist Press. Maslach , C., Jackson, S. E., & Leiter, M. P. (1997). Maslach Burnout Inventory. In C. P. Zalaquett
& R. J. Wood (Eds.), Evaluating Stress: A book of resources (pp. 191-218). Lanham, MD: Scarecrow Education.
Montgomery, C., & Rupp, A. A. (2005). A meta-analysis for exploring the diverse causes and effects
of stress in teachers. Canadian Journal of Education, 28, 458–486. Murray, J. (2005). Social-emotional climate and the success of new teachers: A new look at the ongoing challenge of
new teacher retention (Wellesley Centers for Women, Report WCW 9). Wellesley, MA: Wellesley Centers for Women.
National Center for Education Statistics. (2000). Progress through the teacher pipeline: 1992–93 college
graduates and elementary/secondary school teaching as of 1997 (NCES 2000–152). Washington, D.C.: U.S. Department of Education.
Newsome, S., Christopher, J. C., Dahlen, P., & Christopher, S. (2006). Teaching counselors self-care
through mindfulness practices. Teacher’s College Record, 108(9), 1881–1900.
42

Sacks, P. (2000). Standardized minds: The high price of America’s testing culture and what we can do to change it.
Cambridge: Perseus. Retrieved February 10, 2006 from http://www.questia.com/PM.qst?a=o&d=91066111
Scully, J. A., Tosi, H., & Banning, K. (2000). Life event checklists: Revisiting the social readjustment
rating scale after 30 years. Educational. Psychological Measurement, 60 (6), 864–876. Schreiner, I., & Malcolm, J. P. (2008). The benefits of mindfulness meditation: Changes in emotional
states of depression, anxiety, and stress. Behaviour Change, 25(3), 156–168. Shapiro, S. L., Oman, D., Thoresen, C. E., Plante, T. G., & Flinders, T. F. (2008). Cultivating
mindfulness: Effects on well-being. Journal of Clinical Psychology, 64(7), 840–862. Shapiro, S. L., Schwartz, G. E., & Bonner, G. (1998). Effects of mindfulness-based stress reduction
on medical and premedical students. Journal of Behavioral Medicine, 21 (6), 581–599. Shields, S. A., Mallory, M. E., & Simon, A. (1989). The body awareness questionnaire: Reliability and
validity. Journal of Personality and Assessment, 53(4), 802–815. Singh, N. N., Lancioni, G. E., Winton, A. S. W., Fisher, B. C., Wahler, R. G., McAleavey, K., et al.
(2006). Mindful parenting decreases aggression, noncompliance, and self-injury in children with autism. Journal of Emotional and Behavioral Disorders, 14(3), 169–177.
Smylie, M. A., Wenzel, S. A., Allensworth, E., Fendt, C., Hallman, S., Luppescu, S., et al. (2003). The
Chicago Annenberg challenge: Successes, failures, and lessons for the future. Chicago, IL: Consortium on Chicago School Research.
Stamm, B. H. (2005). The ProQOL manual. Retrieved July 16, 2007 from
http://www.isu.edu/~bhstamm. Winzelberg, A. J., & Luskin, F. M. (1999). The effect of a meditation training in stress levels in
secondary school teachers. Stress Medicine, 15, 69–77.
43