research on the relationship between engineering ceramics
TRANSCRIPT
Research on the Relationship between Engineering Ceramics Surface Roughness and Image Texture Features Based on Machine Learning
Nie Yu, Li Chao, He Fubao, Hu Kaihua Jingdezhen Ceramic Institute, Jingdezhen, Jiangxi 333403, China
Keywords: Machine Learning, Engineering Ceramics, Texture Analysis, Surface Roughness, Gray Level Co-Occurrence Matrix
Abstract: in Order to Describe the Relationship between Ceramic Grinding Surface Texture Features and Roughness, and Realize Rapid Evaluation and Prediction of Ceramic Grinding Surface Roughness, the Gray Level Co-Occurrence Matrix Based on Machine Learning is Used to Extract and Analyze Surface Texture Features. by Using Variable Correlation Analysis, Six Parameters Such as Contrast Are Determined as the Main Texture Features of Si3n4 Grinding Surface, and the Variation Laws of Each Texture Parameter with Ra, Ry, s, Tp Are Discussed, Thus Qualitatively Evaluating the Roughness of Si3n4 Grinding Surface. the Influencing Factors of Gray Level Co-Occurrence Matrix Are Determined According to the Change Curve of Sampling Point Spacing and Gray Level with Characteristic Value. the Gray Level Co-Occurrence Matrix is Established in Four Directions and the Mean Value of All Texture Characteristic Parameters is Calculated. by Analyzing the Correlation between the Characteristic Parameters, Four Parameters Are Determined as the Main Characteristic Parameters of Ceramic Grinding Surface Texture. the Relationship between Texture Characteristic Parameters and Roughness Evaluation Index Was Studied by Using Multiple Nonlinear Regression Method, and Four Regression Prediction Models Were Constructed. the Results Show That the Deviation between the Calculated Value and the Measured Value is Less Than 0.25, Which Has a Good Prediction Effect.
1. Introduction Engineering Ceramic Materials Have Good Comprehensive Properties and Are Now Widely
Used in Various Engineering Fields. Surface Roughness is an Important Index to Characterize and Evaluate the Surface Quality of Engineering Ceramics, Which Has Great Influence on the Reliability and Service Life of Products [1]. Traditional Contact Roughness Measurement Has the Problems of Damaging the Measured Surface, Being Easily Influenced by Probes and Low Measurement Speed. Non-Contact Measurement Method Can Effectively Avoid Such Defects [2]. for the Popularity of the Classifier Algorithm in the Field of Target Extraction, Tracking and Recognition, This Paper Applies the Classifier Algorithm to Image Segmentation, and Combines Color and Texture Features to Test and Analyze. in the Fields of Image Restoration and Fusion, Image Quality Evaluation Technology Can Optimize the Parameters of the Objective Function and Guide the Image Fusion Algorithm to Obtain High-Quality Images. Texture Analysis Methods Can Be Divided into Statistical Method, Structural Method, Model Method and Spatial Domain/Frequency Domain Combination Method. Currently, Commonly Used Methods Include Texture Feature Extraction Methods Based on Fractal Dimension, Wavelet Change, Gabor Filter Change and Gray Level Co-Occurrence Matrix/Gray Level Gradient Co-Occurrence Matrix [3]. Using the Gray Level Co-Occurrence Matrix Analysis Method of Machine Learning, the Characteristic Parameters of the Image Texture on the Surface of the Planar Workpiece Can Be Extracted, and the Roughness Measurement Information Can Be Obtained by Analyzing These Characteristic Parameters [4]. the Variation Curves of Several Main Characteristic Parameters of Co-Occurrence Matrix with Surface Roughness Are Obtained, Which Provides a New Method for Rapid Evaluation and Prediction of Surface Roughness in Ceramic Processing.
2019 International Conference on Information Science, Medical and Health Informatics (ISMHI 2019)
Copyright © (2019) Francis Academic Press, UK DOI: 10.25236/ISMHI.2019.121627
2. Texture Feature Extraction of Ceramic Surface 2.1 Gray Level Co-Occurrence Matrix and Its Characteristic Parameters
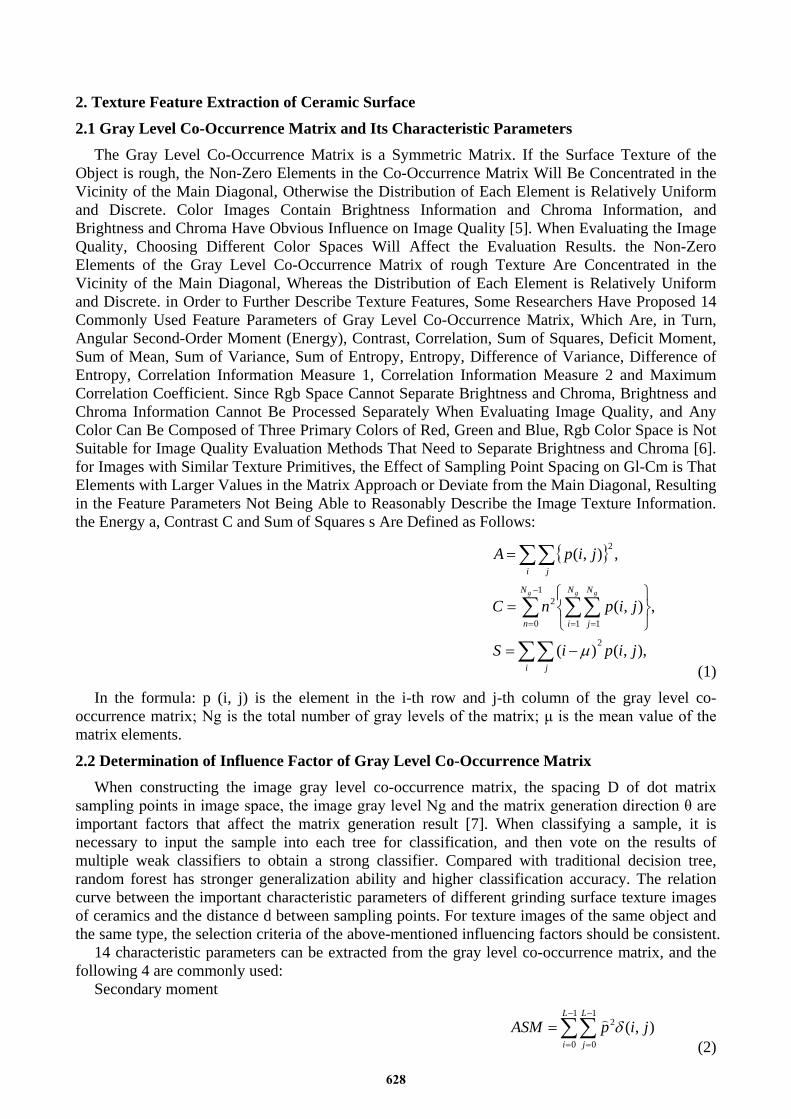
The Gray Level Co-Occurrence Matrix is a Symmetric Matrix. If the Surface Texture of the Object is rough, the Non-Zero Elements in the Co-Occurrence Matrix Will Be Concentrated in the Vicinity of the Main Diagonal, Otherwise the Distribution of Each Element is Relatively Uniform and Discrete. Color Images Contain Brightness Information and Chroma Information, and Brightness and Chroma Have Obvious Influence on Image Quality [5]. When Evaluating the Image Quality, Choosing Different Color Spaces Will Affect the Evaluation Results. the Non-Zero Elements of the Gray Level Co-Occurrence Matrix of rough Texture Are Concentrated in the Vicinity of the Main Diagonal, Whereas the Distribution of Each Element is Relatively Uniform and Discrete. in Order to Further Describe Texture Features, Some Researchers Have Proposed 14 Commonly Used Feature Parameters of Gray Level Co-Occurrence Matrix, Which Are, in Turn, Angular Second-Order Moment (Energy), Contrast, Correlation, Sum of Squares, Deficit Moment, Sum of Mean, Sum of Variance, Sum of Entropy, Entropy, Difference of Variance, Difference of Entropy, Correlation Information Measure 1, Correlation Information Measure 2 and Maximum Correlation Coefficient. Since Rgb Space Cannot Separate Brightness and Chroma, Brightness and Chroma Information Cannot Be Processed Separately When Evaluating Image Quality, and Any Color Can Be Composed of Three Primary Colors of Red, Green and Blue, Rgb Color Space is Not Suitable for Image Quality Evaluation Methods That Need to Separate Brightness and Chroma [6]. for Images with Similar Texture Primitives, the Effect of Sampling Point Spacing on Gl-Cm is That Elements with Larger Values in the Matrix Approach or Deviate from the Main Diagonal, Resulting in the Feature Parameters Not Being Able to Reasonably Describe the Image Texture Information. the Energy a, Contrast C and Sum of Squares s Are Defined as Follows:
{ }
),,()(
,),(
,),(
2
1 1
1
0
2
2
jipiS
jipnC
jipA
i j
N
i
N
j
N
n
i j
g gg
∑∑
∑∑∑
∑∑
−=
=
=
= =
−
=
µ (1)
In the formula: p (i, j) is the element in the i-th row and j-th column of the gray level co-occurrence matrix; Ng is the total number of gray levels of the matrix; μ is the mean value of the matrix elements.
2.2 Determination of Influence Factor of Gray Level Co-Occurrence Matrix When constructing the image gray level co-occurrence matrix, the spacing D of dot matrix
sampling points in image space, the image gray level Ng and the matrix generation direction θ are important factors that affect the matrix generation result [7]. When classifying a sample, it is necessary to input the sample into each tree for classification, and then vote on the results of multiple weak classifiers to obtain a strong classifier. Compared with traditional decision tree, random forest has stronger generalization ability and higher classification accuracy. The relation curve between the important characteristic parameters of different grinding surface texture images of ceramics and the distance d between sampling points. For texture images of the same object and the same type, the selection criteria of the above-mentioned influencing factors should be consistent.
14 characteristic parameters can be extracted from the gray level co-occurrence matrix, and the following 4 are commonly used:
Secondary moment
),(1
0
1
0
2 jipASML
i
L
j∑∑−
=
−
=
= δ
(2)
628
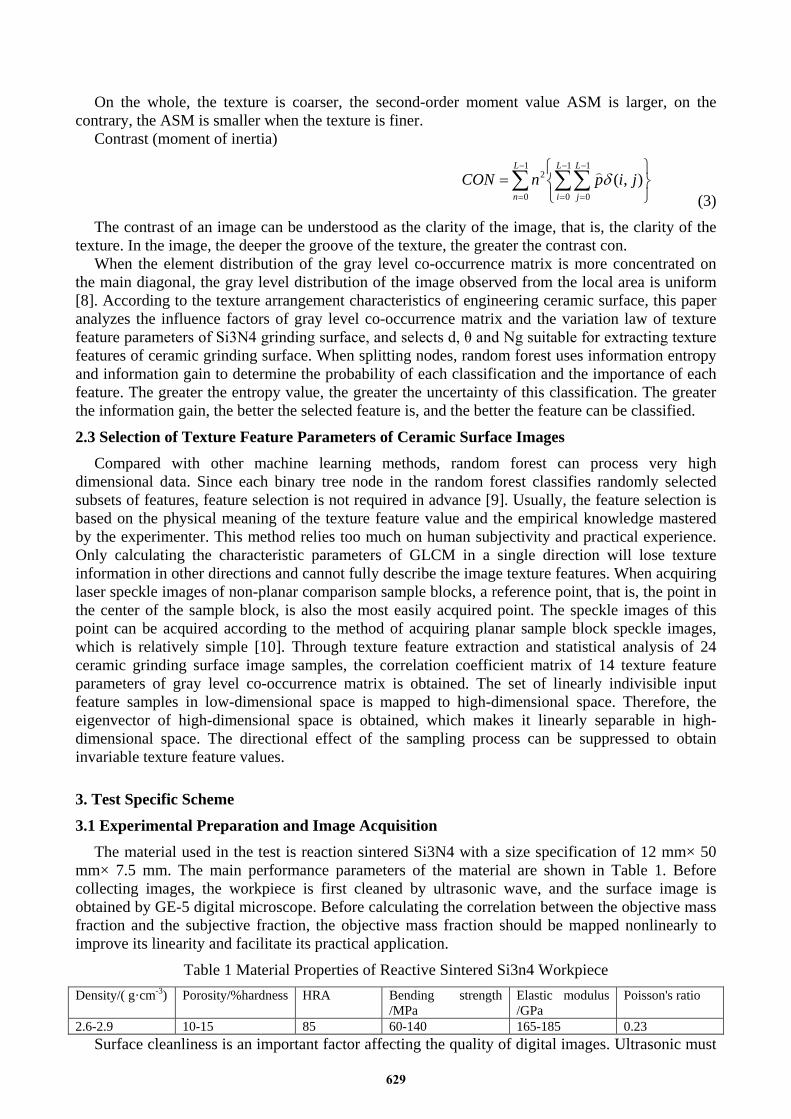
On the whole, the texture is coarser, the second-order moment value ASM is larger, on the contrary, the ASM is smaller when the texture is finer.
Contrast (moment of inertia)
= ∑∑∑−
=
−
=
−
=
1
0
1
0
1
0
2 ),(L
i
L
j
L
njipnCON δ
(3) The contrast of an image can be understood as the clarity of the image, that is, the clarity of the
texture. In the image, the deeper the groove of the texture, the greater the contrast con. When the element distribution of the gray level co-occurrence matrix is more concentrated on
the main diagonal, the gray level distribution of the image observed from the local area is uniform [8]. According to the texture arrangement characteristics of engineering ceramic surface, this paper analyzes the influence factors of gray level co-occurrence matrix and the variation law of texture feature parameters of Si3N4 grinding surface, and selects d, θ and Ng suitable for extracting texture features of ceramic grinding surface. When splitting nodes, random forest uses information entropy and information gain to determine the probability of each classification and the importance of each feature. The greater the entropy value, the greater the uncertainty of this classification. The greater the information gain, the better the selected feature is, and the better the feature can be classified.
2.3 Selection of Texture Feature Parameters of Ceramic Surface Images Compared with other machine learning methods, random forest can process very high
dimensional data. Since each binary tree node in the random forest classifies randomly selected subsets of features, feature selection is not required in advance [9]. Usually, the feature selection is based on the physical meaning of the texture feature value and the empirical knowledge mastered by the experimenter. This method relies too much on human subjectivity and practical experience. Only calculating the characteristic parameters of GLCM in a single direction will lose texture information in other directions and cannot fully describe the image texture features. When acquiring laser speckle images of non-planar comparison sample blocks, a reference point, that is, the point in the center of the sample block, is also the most easily acquired point. The speckle images of this point can be acquired according to the method of acquiring planar sample block speckle images, which is relatively simple [10]. Through texture feature extraction and statistical analysis of 24 ceramic grinding surface image samples, the correlation coefficient matrix of 14 texture feature parameters of gray level co-occurrence matrix is obtained. The set of linearly indivisible input feature samples in low-dimensional space is mapped to high-dimensional space. Therefore, the eigenvector of high-dimensional space is obtained, which makes it linearly separable in high-dimensional space. The directional effect of the sampling process can be suppressed to obtain invariable texture feature values.
3. Test Specific Scheme 3.1 Experimental Preparation and Image Acquisition
The material used in the test is reaction sintered Si3N4 with a size specification of 12 mm× 50 mm× 7.5 mm. The main performance parameters of the material are shown in Table 1. Before collecting images, the workpiece is first cleaned by ultrasonic wave, and the surface image is obtained by GE-5 digital microscope. Before calculating the correlation between the objective mass fraction and the subjective fraction, the objective mass fraction should be mapped nonlinearly to improve its linearity and facilitate its practical application.
Table 1 Material Properties of Reactive Sintered Si3n4 Workpiece Density/( g·cm-3) Porosity/%hardness HRA Bending strength
/MPa Elastic modulus /GPa
Poisson's ratio
2.6-2.9 10-15 85 60-140 165-185 0.23 Surface cleanliness is an important factor affecting the quality of digital images. Ultrasonic must
629
be used to remove surface attachments or impurities before image acquisition. In order to accurately describe the variation law of the whole grinding surface texture, six images were collected at equal intervals to reflect the texture information and roughness of Si3N4 workpiece surface. Texture features include the micro-geometric morphology information of the grinding surface, but there are redundancy and repetition of information at the same time. It is necessary to select descriptive, relatively independent and reliable parameters to establish the relationship with roughness. If the image does not have any texture, the gray level co-occurrence matrix is almost zero matrix and the entropy value is close to 0. If the image is full of fine texture, the gray level co-occurrence matrix is approximately equal in value and the entropy value of the image is larger. If the image is distributed with less texture, the entropy value of the image is smaller.
3.2 Image Processing of Ceramic Surface When analyzing the relationship between surface roughness and texture information, the
research objects are all gray images that do not contain color, so it is necessary to gray the collected color images and delete the color and position information of the images. After nonlinear mapping, it is suggested to use four correlation metrics to measure the performance of objective evaluation methods. Because it is difficult to directly remove pollutants or bad points on CCD, the improved median filter algorithm is used to process contaminated images. The results show that the algorithm has good effect of filtering noise interference and can protect image texture details. Due to the high sensitivity of human eyes to green and low sensitivity to blue, when the three primary colors are weighted according to the “Y” algorithm, the obtained image has better visual effect and richer brightness information. When analyzing the relationship between texture information and surface roughness, the obtained color image should be grayed out, the color and position information in the image should be deleted, and only 256 levels of brightness information should be retained. The comparison sample block is placed vertically on the experimental table to ensure that the optical plane determined by the incident laser and the reflected laser can be perpendicular to the tangent plane of the sampling point. The results show that noise interference can be partially filtered and image details can be protected by the algorithm.
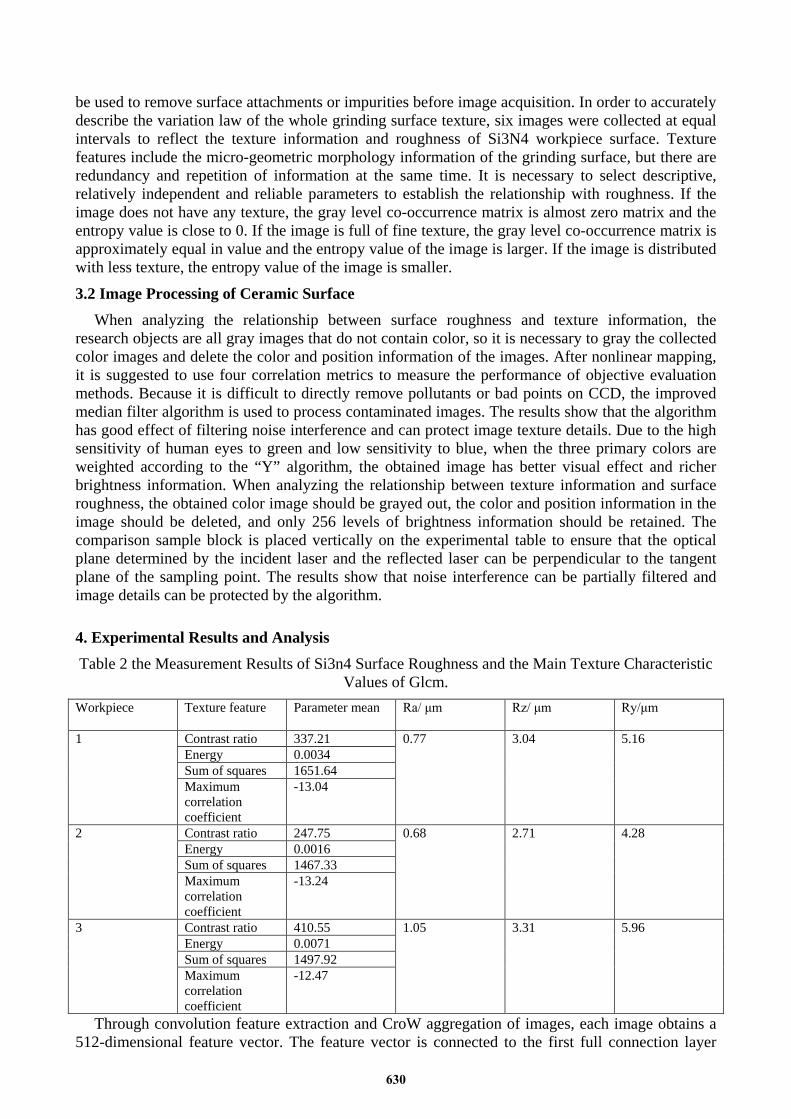
4. Experimental Results and Analysis Table 2 the Measurement Results of Si3n4 Surface Roughness and the Main Texture Characteristic
Values of Glcm. Workpiece Texture feature Parameter mean Ra/ μm Rz/ μm
Ry/μm
1 Contrast ratio 337.21 0.77 3.04 5.16 Energy 0.0034 Sum of squares 1651.64 Maximum correlation coefficient
-13.04
2 Contrast ratio 247.75 0.68 2.71 4.28 Energy 0.0016 Sum of squares 1467.33 Maximum correlation coefficient
-13.24
3 Contrast ratio 410.55 1.05 3.31 5.96 Energy 0.0071 Sum of squares 1497.92 Maximum correlation coefficient
-12.47
Through convolution feature extraction and CroW aggregation of images, each image obtains a 512-dimensional feature vector. The feature vector is connected to the first full connection layer
630
FC1 and transmitted to the second full connection layer FC2 through the Relu activation function. Taking the arithmetic mean deviation Ra of grinding surface profile as an example, the variation curves with contrast, deficit moment, entropy, sum average, correlation information measure I, correlation information measure II and maximum correlation coefficient are drawn. For the comparative sample block processed by external grinding, the method of acquiring laser speckle image is the same as that of acquiring the comparative sample block image processed by boring. When the external tangent plane of the sample block is perpendicular to the normal line of the optical path, the image is acquired. In the experiment, the roughness meter was used to measure the grinding surface roughness of Si3N4, and the images of 3 pieces of Si3N4 ceramics were collected. The main characteristic values of gray level co-occurrence matrix of each workpiece surface roughness and 6 surface images are shown in Table 2.
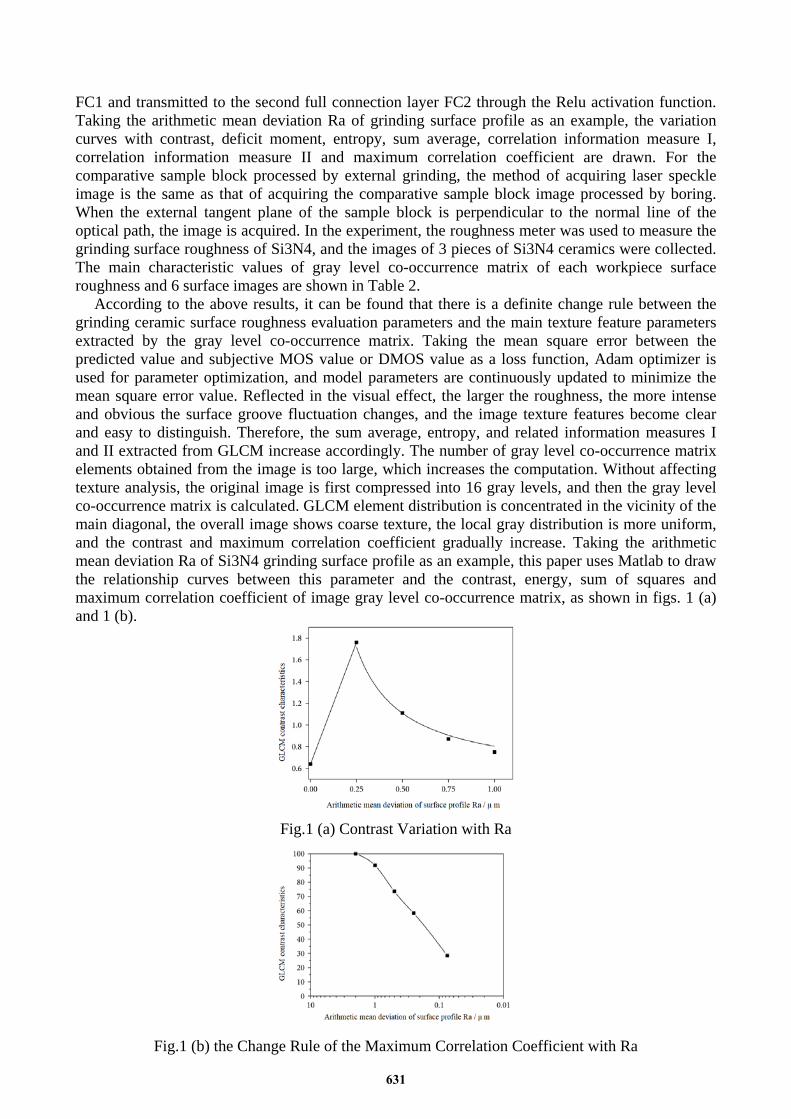
According to the above results, it can be found that there is a definite change rule between the grinding ceramic surface roughness evaluation parameters and the main texture feature parameters extracted by the gray level co-occurrence matrix. Taking the mean square error between the predicted value and subjective MOS value or DMOS value as a loss function, Adam optimizer is used for parameter optimization, and model parameters are continuously updated to minimize the mean square error value. Reflected in the visual effect, the larger the roughness, the more intense and obvious the surface groove fluctuation changes, and the image texture features become clear and easy to distinguish. Therefore, the sum average, entropy, and related information measures I and II extracted from GLCM increase accordingly. The number of gray level co-occurrence matrix elements obtained from the image is too large, which increases the computation. Without affecting texture analysis, the original image is first compressed into 16 gray levels, and then the gray level co-occurrence matrix is calculated. GLCM element distribution is concentrated in the vicinity of the main diagonal, the overall image shows coarse texture, the local gray distribution is more uniform, and the contrast and maximum correlation coefficient gradually increase. Taking the arithmetic mean deviation Ra of Si3N4 grinding surface profile as an example, this paper uses Matlab to draw the relationship curves between this parameter and the contrast, energy, sum of squares and maximum correlation coefficient of image gray level co-occurrence matrix, as shown in figs. 1 (a) and 1 (b).
Fig.1 (a) Contrast Variation with Ra
Fig.1 (b) the Change Rule of the Maximum Correlation Coefficient with Ra
631
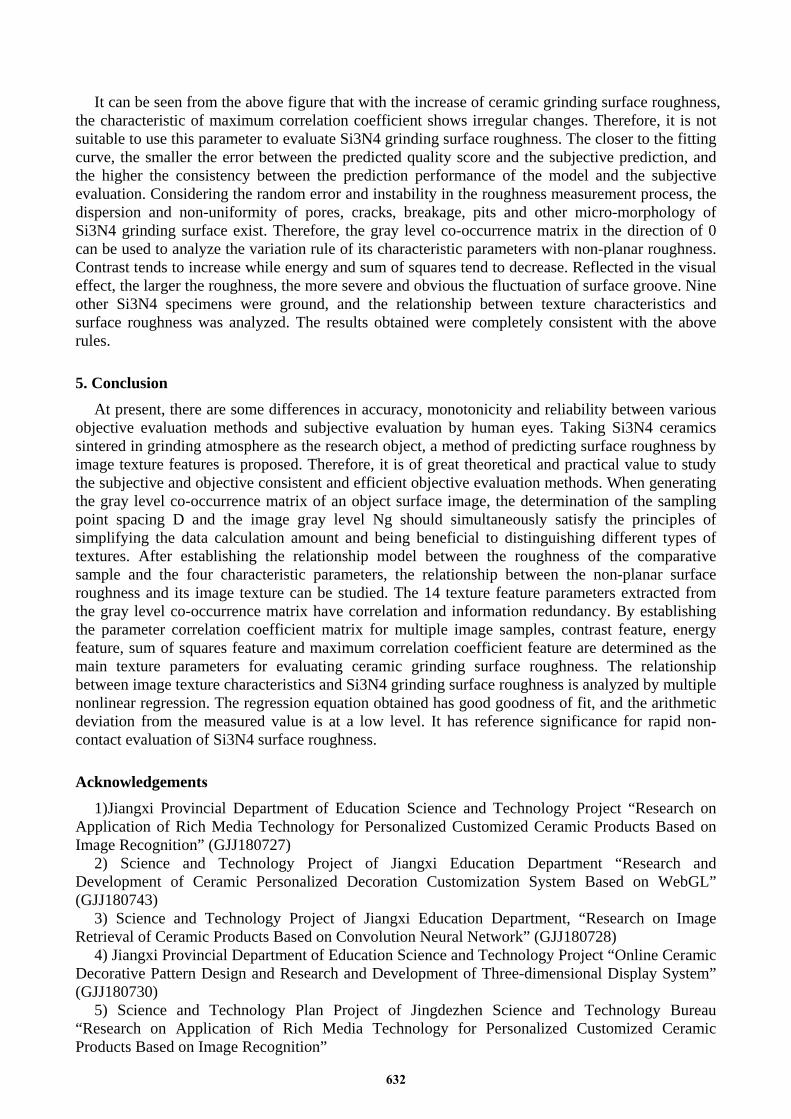
It can be seen from the above figure that with the increase of ceramic grinding surface roughness, the characteristic of maximum correlation coefficient shows irregular changes. Therefore, it is not suitable to use this parameter to evaluate Si3N4 grinding surface roughness. The closer to the fitting curve, the smaller the error between the predicted quality score and the subjective prediction, and the higher the consistency between the prediction performance of the model and the subjective evaluation. Considering the random error and instability in the roughness measurement process, the dispersion and non-uniformity of pores, cracks, breakage, pits and other micro-morphology of Si3N4 grinding surface exist. Therefore, the gray level co-occurrence matrix in the direction of 0 can be used to analyze the variation rule of its characteristic parameters with non-planar roughness. Contrast tends to increase while energy and sum of squares tend to decrease. Reflected in the visual effect, the larger the roughness, the more severe and obvious the fluctuation of surface groove. Nine other Si3N4 specimens were ground, and the relationship between texture characteristics and surface roughness was analyzed. The results obtained were completely consistent with the above rules.
5. ConclusionAt present, there are some differences in accuracy, monotonicity and reliability between various
objective evaluation methods and subjective evaluation by human eyes. Taking Si3N4 ceramics sintered in grinding atmosphere as the research object, a method of predicting surface roughness by image texture features is proposed. Therefore, it is of great theoretical and practical value to study the subjective and objective consistent and efficient objective evaluation methods. When generating the gray level co-occurrence matrix of an object surface image, the determination of the sampling point spacing D and the image gray level Ng should simultaneously satisfy the principles of simplifying the data calculation amount and being beneficial to distinguishing different types of textures. After establishing the relationship model between the roughness of the comparative sample and the four characteristic parameters, the relationship between the non-planar surface roughness and its image texture can be studied. The 14 texture feature parameters extracted from the gray level co-occurrence matrix have correlation and information redundancy. By establishing the parameter correlation coefficient matrix for multiple image samples, contrast feature, energy feature, sum of squares feature and maximum correlation coefficient feature are determined as the main texture parameters for evaluating ceramic grinding surface roughness. The relationship between image texture characteristics and Si3N4 grinding surface roughness is analyzed by multiple nonlinear regression. The regression equation obtained has good goodness of fit, and the arithmetic deviation from the measured value is at a low level. It has reference significance for rapid non-contact evaluation of Si3N4 surface roughness.
Acknowledgements1)Jiangxi Provincial Department of Education Science and Technology Project “Research on
Application of Rich Media Technology for Personalized Customized Ceramic Products Based on Image Recognition” (GJJ180727)
2) Science and Technology Project of Jiangxi Education Department “Research and Development of Ceramic Personalized Decoration Customization System Based on WebGL” (GJJ180743)
3) Science and Technology Project of Jiangxi Education Department, “Research on Image Retrieval of Ceramic Products Based on Convolution Neural Network” (GJJ180728)
4) Jiangxi Provincial Department of Education Science and Technology Project “Online Ceramic Decorative Pattern Design and Research and Development of Three-dimensional Display System” (GJJ180730)
5) Science and Technology Plan Project of Jingdezhen Science and Technology Bureau “Research on Application of Rich Media Technology for Personalized Customized Ceramic Products Based on Image Recognition”
632
References [1] Sarma D, Mielke J, Sahre M, et al. (2017). TSEM-based Contour Analysis as a Tool for the Quantification of the Profile Roughness of Silica Shells on Polystyrene Core Particles [J]. Applied Surface Science, pp. 426. [2] Berzio S, Lange R L, M. Schlüter, et al. (2017). Impact of surface condition and roughness on sediment formation: an experimental sewer system operated with real wastewater [J]. Water Science & Technology A Journal of the International [3] Association on Water Pollution Research, vol. 76, no. 2, pp. 443. [3] Jansons E, Gross K A. (2019). The Impact of Ice Texture on Coefficient of Friction for Stainless Steel with Different Surface Roughness [J]. Key Engineering Materials, pp. 800. [4] Cao W, Cai Z. (2018). Improved Multiscale Roughness Algorithm for Lunar Surface[J]. IEEE Journal of Selected Topics in Applied Earth Observations and Remote Sensing, vol. 11, no. 7, pp. 1-10. [5] Kumar H, Manna A, Kumar R. (2017). Modeling of Process Parameters for Surface Roughness and Analysis of Machined Surface in WEDM of Al/SiC-MMC[J]. Transactions of the Indian Institute of Metals, vol. 71, no. 3, pp. 1-14. [6] Allen E J. (2019). An SDE model for surface roughness progression[J]. Stochastic Analysis and Applications, no. 3, pp. 1-8. [7] Cui L, Li Y, Wang X, et al. (2018). Analysis of Surface Roughness of Cold Roll-Beating Tooth[J]. IOP Conference Series Materials Science and Engineering, vol. 452, pp. 042143. [8] Touati S, Mekhilef S. (2017). Statistical analysis of surface roughness in turning based on cutting parameters and tool vibrations with response surface methodology (RSM)[J]. Matériaux & Techniques, vol. 105, no. 4, pp. 401. [9] Gašper Glavan, Salamon P, Belyaeva I A, et al. (2018) Tunable surface roughness and wettability of a soft magnetoactive elastomer[J]. Journal of Applied Polymer Science, vol. 135, no. 18, pp. 46221. [10] Jumelle C, Hamri A, Egaud G, et al. (2017). Comparison of four methods of surface roughness assessment of corneal stromal bed after lamellar cutting[J]. Biomedical Optics Express, vol. 8, no. 11, pp. 4974.
633