research open access digital expression profiling of novel
TRANSCRIPT

RESEARCH Open Access
Digital expression profiling of novel diatomtranscripts provides insight into their biologicalfunctionsUma Maheswari1,2, Kamel Jabbari1,3, Jean-Louis Petit3, Betina M Porcel3, Andrew E Allen1,4†, Jean-Paul Cadoret5†,Alessandra De Martino1†, Marc Heijde1†, Raymond Kaas5†, Julie La Roche6†, Pascal J Lopez1†,Véronique Martin-Jézéquel7†, Agnès Meichenin1†, Thomas Mock8,9†, Micaela Schnitzler Parker8†, Assaf Vardi1,10†,E Virginia Armbrust8, Jean Weissenbach3, Michaël Katinka3, Chris Bowler1*
Abstract
Background: Diatoms represent the predominant group of eukaryotic phytoplankton in the oceans and areresponsible for around 20% of global photosynthesis. Two whole genome sequences are now available.Notwithstanding, our knowledge of diatom biology remains limited because only around half of their genes canbe ascribed a function based onhomology-based methods. High throughput tools are needed, therefore, toassociate functions with diatom-specific genes.
Results: We have performed a systematic analysis of 130,000 ESTs derived from Phaeodactylum tricornutum cellsgrown in 16 different conditions. These include different sources of nitrogen, different concentrations of carbondioxide, silicate and iron, and abiotic stresses such as low temperature and low salinity. Based on unbiasedstatistical methods, we have catalogued transcripts with similar expression profiles and identified transcriptsdifferentially expressed in response to specific treatments. Functional annotation of these transcripts providesinsights into expression patterns of genes involved in various metabolic and regulatory pathways and into theroles of novel genes with unknown functions. Specific growth conditions could be associated with enhanced genediversity, known gene product functions, and over-representation of novel transcripts. Comparative analysis of datafrom the other sequenced diatom, Thalassiosira pseudonana, helped identify several unique diatom genes that arespecifically regulated under particular conditions, thus facilitating studies of gene function, genome annotation andthe molecular basis of species diversity.
Conclusions: The digital gene expression database represents a new resource for identifying candidate diatom-specific genes involved in processes of major ecological relevance.
BackgroundIn the current catalogue of eight major groups of eukar-yotic taxa [1], the majority of well explored modelorganisms belong to the plant (Archaeplastida) and theanimal (Opisthokonta) groups, which both evolved fromprimary endosymbiotic events that generated chloro-plasts and mitochondria. The heterokonts, on the otherhand, probably evolved from serial secondary
endosymbiosis events in which a heterotrophic eukar-yote engulfed both autotrophic red and green eukaryoticalgae [2-4]. As a consequence, these organisms derivefrom the combination of three distinct nuclear genomes.The group includes highly diverse, ecologically impor-tant photosynthetic groups, such as diatoms, as well asnon-photosynthetic members, such as oomycetes (forexample, Phytophthora infestans, the causative agent ofpotato late blight).Diatoms typically constitute a major component of
phytoplankton in freshwater and marine environments.They are involved in various biogeochemical cycles,
* Correspondence: [email protected]† Contributed equally1Institut de Biologie de l’Ecole Normale Supérieure, CNRS UMR 8197 INSERMU1024, Ecole Normale Supérieure, 46 rue d’Ulm, 75005 Paris, FranceFull list of author information is available at the end of the article
Maheswari et al. Genome Biology 2010, 11:R85http://genomebiology.com/2010/11/8/R85
© 2010 Maheswari et al; licensee BioMed Central Ltd. This is an open access article distributed under the terms of the CreativeCommons Attribution License (http://creativecommons.org/licenses/by/2.0), which permits unrestricted use, distribution, andreproduction in any medium, provided the original work is properly cited.

most notably those involving carbon, nitrogen and sili-con, and contribute 30 to 40% of marine primary pro-ductivity [5,6]. Consequently, they are responsible forapproximately one-fifth of the oxygen that is generatedthrough photosynthesis on our planet. Morphologically,they exhibit different shapes and symmetries, the centricdiatoms being radially symmetric and the pennates dis-playing bilateral symmetry. In spite of their tremendousecological importance, the molecular mechanisms thatenable them to succeed in a range of diverse environ-ments remain largely unexplored.Results from the first diatom genome projects from
Thalassiosira pseudonana and Phaeodactylum tricornu-tum showed the presence of various genes needed forefficient management of carbon and nitrogen - forexample, encoding urea cycle components [7,8].However, these studies could only predict the functionsof around 55% of diatom genes. The comparative studyof the two diatom genomes [8] revealed that only 57%of genes are shared between the two diatoms, and thathorizontal gene transfer from prokaryotes is pervasive indiatoms. Thus, the necessity for functional genomicsand reverse genetics approaches to further explore dia-tom gene repertories is clear.P. tricornutum is a pennate diatom that has been
extensively studied physiologically and phylogenetically.In addition, it does not have an obligate requirement forsilicic acid like other diatoms, and can undergo morpho-logical transitions between three possible morphotypes[9]. The organism harbors a small genome (27.4 Mb)[8], it can be routinely transformed with efficienciessuperior to those reported for other diatoms [10-13],and gene silencing is now possible using RNA interfer-ence [14]. For these reasons P. tricornutum is emergingas a model species for dissecting diatom molecular andcellular biology [15-20].In a pilot study of the P. tricornutum genome using
1,000 cDNAs, only 23.7% of sequences could be func-tionally defined using homology-based methods [21].This study was later expanded to 12,136 cDNAs [22],which facilitated comparative genomic studies of P. tri-cornutum with available genomes from the green algaChlamydomonas reinhardtii [23], the red alga Cyani-dioschyzon merolae [24], and the centric diatom T. pseu-donana [7]. A number of interesting observations weremade from such analyses about the evolutionary originsof individual genes [25]. This encouraged us to expandthe EST repository by generating cDNA libraries fromcells grown under different conditions of ecological rele-vance to increase the probability of obtaining uniquegene expression profiles and to study the conditions inwhich they are induced. We describe herein statisticalmethods as well as comparative and functional studiesto identify genes that are differentially expressed in 16
different conditions based on 132,547 cDNAs clonedand sequenced from P. tricornutum. These resourcespermit a systematic understanding of the molecularmechanisms underlying acclimation of this diatom todifferent nutrient conditions and its responses to variousbiotic and abiotic stresses, and should aid our under-standing of the function of diatom-specific genes.
ResultsGene expression diversity across different cDNA librariesTo add to the previous 12,136 ESTs generated fromcells grown in standard growth conditions (here denotedthe ‘OS library’ for original standard [22], 15 non-nor-malized cDNA libraries were generated to explore theresponses of P. tricornutum to a range of growth condi-tions, including different nutrient regimes of Si, N, Fe,and dissolved inorganic carbon (DIC), stress (hyposali-nity and low temperature), and blue light. We also gen-erated libraries from each of the three P. tricornutummorphotypes, and from cells exposed to the pro-grammed cell death-inducing aldehyde decadienal [20].The libraries were generated from three different eco-types whose phylogenetic relationships and general char-acteristics have been previously described [26].Furthermore, three different culturing regimes wereused - batch, semi-continuous, and chemostats -depending on the treatment being performed. Acomprehensive description of culturing conditions isprovided in Materials and methods and Additional file1, and is summarized in Table 1. To facilitate compari-sons, all cells were harvested in mid-late exponentialphase, and the libraries were made using the same RNAextraction and cDNA library construction methodolo-gies (see Materials and methods).The number of sequenced cDNAs per library varied
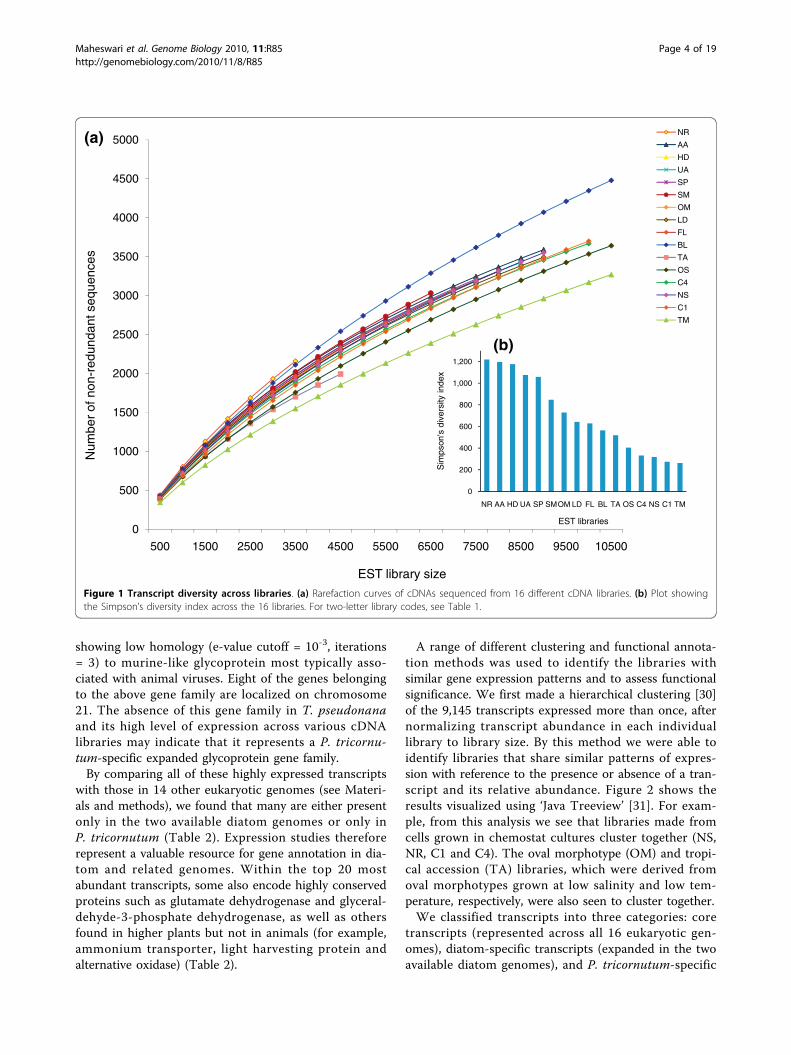
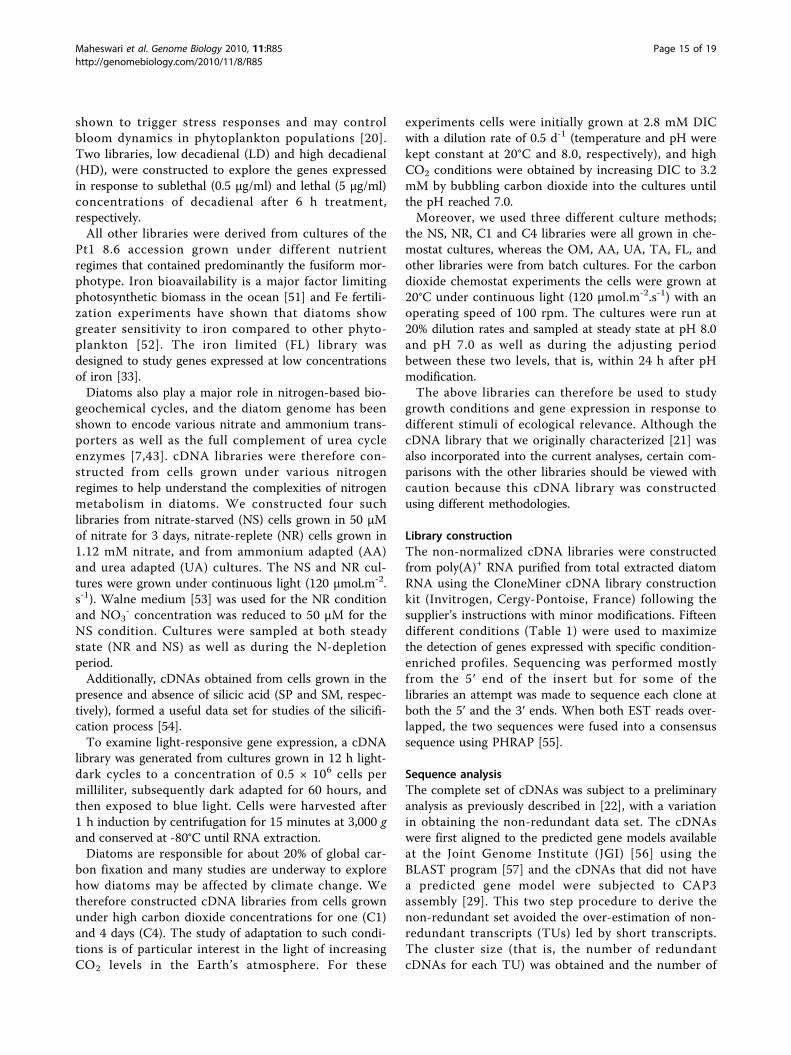
from 3,541 to 12,566, with an average of 8,284 cDNAsper library for a total of 120,411 sequences. In general,the percentage of redundant sequences in the differentlibraries was around 50 to 60% (Table 1), although thetriradiate morphotype (TM) library presented the high-est level of redundancy (70%), whereas the lowestredundancy (39%) was observed in the nitrate replete(NR) library. Because the library size varied, we calcu-lated rarefaction curves to check whether we hadexceeded the optimal library size (that is, over sam-pling), which might have led to the redundancy variation[27]. All libraries were below saturation (Figure 1a),implying that further increases in library size would leadto the capture of new cDNAs. The differences in redun-dancy are not therefore due to over sequencing of somelibraries. Consequently, the differences seen in the rare-faction curves along with the differences in redundancyrates of different libraries are likely to reflect differentialgene expression in response to each culture condition.
Maheswari et al. Genome Biology 2010, 11:R85http://genomebiology.com/2010/11/8/R85
Page 2 of 19

To determine whether the abundance of transcriptswas evenly distributed, that is, to check if the librarieshave fewer sets of more abundant cDNAs (lower diver-sity) or several sets of evenly abundant cDNAs (higherdiversity), we calculated the Simpson’s reciprocal diver-sity index [28], which takes into account both the rich-ness and evenness of transcripts in the libraries (thehigher the index the higher the library diversity). Acrossthe libraries we found the diversity index to vary from1,218 to 268 (Figure 1b), with the nitrate replete (NR),ammonium adapted (AA), urea adapted (UA) and highdecadienal (HD) libraries showing the highest diversity,and the nitrate starved (NS) and high CO2 (C1, C4)libraries showing the least diversity along with the mostredundant triradiate morphotype (TM) library.
Clustering of libraries and genes based on expressionWe obtained a set of non-redundant transcriptionalunits (TUs) by aligning the 132,547 cDNAs with the10,402 P. tricornutum predicted gene models using the
BLAST program. A total of 11,513 sequences lackedpredicted gene models and were clustered instead usingCAP3 [29]. These represented a further 1,968 TUs inaddition to the 8,944 TUs that aligned to the gene mod-els [8]. In total, we obtained 9,145 transcripts presentmore than once across different libraries and 3,225 sin-gle copy transcripts, thereby comprising 12,370 TUs.The top 20 most abundant transcripts are represented
by cDNAs varying from 2,079 to 316 copies in all the16 libraries (Table 2). The most abundant transcript(G49202), with 2,079 copies, belongs to a P. tricornu-tum-specific gene family (family ID 4628) with 9 mem-bers [8]. All nine encoded proteins contain predictedsignal peptides and transcripts for them were detectedin one or more cDNA libraries. They do not show anyhomology with known proteins (e-value cutoff = 10-5)with the exception of G49297, which shows some simi-larity to a bacterial protein containing a carbohydratebinding domain. When the above nine transcripts weresubjected to PSI-Blast, we found a few transcripts
Table 1 List of different libraries and culture conditions together with library statistics
Library Shortname
Strains Condition/mediuma cDNAs Contigs Singletons TUs %Rb
Original standardc OS Pt1 clone 8.6(CCAP1055/1)
12,136 3,274 1,165 4,439 67.31
Silica plus SP Pt1 clone 8.6(CCAP1055/1)
350 uM metasilicate in ASW 7,508 3,077 384 3,461 57.21
Silica minus SM Pt1 clone 8.6(CCAP1055/1)
No metasilicate addition 6,968 2,838 459 3,297 54.63
Oval morphotype OM Pt3 (CCAP1052/1B) Low salinity (10% ASW) 4,544 2,202 214 2,416 48.78
Nitrate replete NR Pt1 clone 8.6(CCAP1055/1)
1.12 mM in chemostat 3,632 2,028 242 2,270 39.01
Nitrate starved NS Pt1 clone 8.6(CCAP1055/1)
50 μM for 3 days in chemostat 9,122 3,271 512 3,783 60.79
Ammoniumadapted
AA Pt1 clone 8.6(CCAP1055/1)
75 μM 9,031 3,329 567 3,896 60.20
Urea adapted UA Pt1 clone 8.6(CCAP1055/1)
50 μM 8,552 3,157 464 3,621 59.82
Tropical accession TA Pt9 (CCMP633) Grown at 15°C 4,821 2,015 160 2,175 56.95
Low decadienal LD Pt1clone 8.6(CCAP1055/1)
0.5 μg/m 2E,4E-decadienal for 6 h 9,227 3,322 537 3,859 61.65
High decadienal HD Pt1 clone 8.6(CCAP1055/1)
5 μg/m 2E,4E-decadienal for 6 h 3,541 1,734 323 2,057 44.95
Iron limited FL Pt1 clone 8.6(CCAP1055/1)
5 nM 8,264 3,064 487 3,551 59.19
Triradiatemorphotype
TM Pt8 (CCAP1055) 12,566 3,055 520 3,575 70.49
Blue light BL Pt1 clone 8.6(CCAP1055/1)
48 h dark adapted cells exposed to 1 hblue light
12,045 4,253 607 4,860 59.61
CO2 high 4 days C4 Pt1 clone 8.6(CCAP1055/1)
3.2 mM DIC for 4 days in chemostat 10,283 3,564 160 3,724 63.78
CO2 high 1 day C1 Pt1 clone 8.6(CCAP1055/1)
3.2 mM DIC for 1 day in chemostat 10,307 3,598 165 3,763 63.49
aAll cells grown in artificial seawater media, except chemostat cultures, which were grown in Walne medium [54]. bPercent redundancy of sequences in eachlibrary. cThe original P. tricornutum cDNA library described previously [21,22] is herein referred to as OS. Although incorporated into the comparative expressionanalyses, it was not examined extensively because it was generated using a different cDNA library protocol. ASW (artificial sea water),; TU, transcriptional unit.
Maheswari et al. Genome Biology 2010, 11:R85http://genomebiology.com/2010/11/8/R85
Page 3 of 19
showing low homology (e-value cutoff = 10-3, iterations= 3) to murine-like glycoprotein most typically asso-ciated with animal viruses. Eight of the genes belongingto the above gene family are localized on chromosome21. The absence of this gene family in T. pseudonanaand its high level of expression across various cDNAlibraries may indicate that it represents a P. tricornu-tum-specific expanded glycoprotein gene family.By comparing all of these highly expressed transcripts
with those in 14 other eukaryotic genomes (see Materi-als and methods), we found that many are either presentonly in the two available diatom genomes or only inP. tricornutum (Table 2). Expression studies thereforerepresent a valuable resource for gene annotation in dia-tom and related genomes. Within the top 20 mostabundant transcripts, some also encode highly conservedproteins such as glutamate dehydrogenase and glyceral-dehyde-3-phosphate dehydrogenase, as well as othersfound in higher plants but not in animals (for example,ammonium transporter, light harvesting protein andalternative oxidase) (Table 2).
A range of different clustering and functional annota-tion methods was used to identify the libraries withsimilar gene expression patterns and to assess functionalsignificance. We first made a hierarchical clustering [30]of the 9,145 transcripts expressed more than once, afternormalizing transcript abundance in each individuallibrary to library size. By this method we were able toidentify libraries that share similar patterns of expres-sion with reference to the presence or absence of a tran-script and its relative abundance. Figure 2 shows theresults visualized using ‘Java Treeview’ [31]. For exam-ple, from this analysis we see that libraries made fromcells grown in chemostat cultures cluster together (NS,NR, C1 and C4). The oval morphotype (OM) and tropi-cal accession (TA) libraries, which were derived fromoval morphotypes grown at low salinity and low tem-perature, respectively, were also seen to cluster together.We classified transcripts into three categories: core
transcripts (represented across all 16 eukaryotic gen-omes), diatom-specific transcripts (expanded in the twoavailable diatom genomes), and P. tricornutum-specific
Figure 1 Transcript diversity across libraries. (a) Rarefaction curves of cDNAs sequenced from 16 different cDNA libraries. (b) Plot showingthe Simpson’s diversity index across the 16 libraries. For two-letter library codes, see Table 1.
Maheswari et al. Genome Biology 2010, 11:R85http://genomebiology.com/2010/11/8/R85
Page 4 of 19

transcripts. Overall expression patterns of each class aresimilar (Additional file 2A), supporting the hypothesisthat the diatom-specific genes do indeed represent bonafide genes. Furthermore, when expression patterns inindividual libraries were explored, expression of thesethree classes of genes was seen to vary greatly (Addi-tional file 2B). As an example, the aldehyde treatedlibraries (LD, HD) share a common pattern of expressedtranscripts representing diatom-specific gene families(Additional files 2A and 3). A recurrent signature withinthis class of transcripts are stress-related proteindomains associated with cell wall and membrane com-ponents, as well as proteases, lipases, glucanase, and eli-citin. Expression analysis can therefore be used as abasis to explore the function of diatom-specific genes bycomparing expression of the two diatom-specific classesof genes with the expression patterns of core genes.This comparison also demonstrates that the expressionof core genes is generally higher when compared to theP. tricornutum-specific genes.While hierarchical clustering reveals the correlations
and differences in patterns of gene expression acrosslibraries, to identify transcripts that are differentiallyexpressed, we used a statistical method based on log-likelihood [32]. For each TU we computed the log-like-lihood ratio (R) and compared it with a randomly gen-erated set (Additional file 4). Based on this comparisonwe considered TUs with R-values greater than 12 to be
differentially expressed (see Materials and methods). Onaverage, we detected between 200 and 450 differentiallyexpressed transcripts per library (8 to 12%), the varia-tion of which was mostly due to differences in librarysize (Additional file 5). Figure 3 shows examples oftranscripts that are expressed across all 16 conditionsand that have different R-values. An ammonium trans-porter encoding gene with an R-value of 502 was cata-logued as being differentially expressed in the nitratestarved (NS) library, an alpha-3-frustulin encoding genewas catalogued as differentially expressed in the ovalmorphotype (OM) and blue light (BL) libraries, and acitrate synthase encoding gene was upregulated in thehigh decadienal (HD) and ammonium adapted (AA)libraries. By contrast, a gene encoding an epsilon-frustu-lin was not catalogued as being differentially expressed(R-value below 12). Seventy-one transcripts wereexpressed at least once across all the libraries (Addi-tional file 6) and most of them were classified as beingdifferentially expressed. Fifty-two of them also containeda known domain, and the majority fell into our categoryof core transcripts (30 sequences, against 15 diatom-specific transcripts, and 13 P. tricornutum-specifictranscipts). These genes encode putative transporters(for bicarbonate and ammonium), some transcriptionfactors, transposable elements, and the mitochondrialalternative oxidase, which has been proposed to be acentral actor in diatom metabolism [33].
Table 2 Top 20 most highly expressed cDNAs across all the libraries, and their presence in different genomes
Contig Cluster sizea Gb BLASTX description InterPro description
G49202 2,079 P - -
G55010 856 P - Pyridoxal phosphate-dependent decarboxylase
G47667 833 O Solute carrier family 34 Na+/Pi cotransporter
G27877 658 O Ammonium transporter Rh-like protein/ammonium transporter
G13951 630 C Glutamate dehydrogenase Glutamate dehydrogenase
G51797 613 D Alpha 3 frustulin -
G52619 605 O Uric acid-xanthine permease Xanthine/uracil/vitamin C permease
G44694 586 D M6 family Aldehyde dehydrogenase
G20424 561 O Urea active isoform Na+/solute symporter
G48027 545 P - -
G48315 479 V Choline carnitine betaine transporter BCCT transporter
G176.1 463 O Alternative oxidase Alternative oxidase
G29456 379 C Glyceraldehyde-3- phosphate dehydrogenase Glyceraldehyde 3-phosphate dehydrogenase
G49064 358 H - Na+/H+ antiporter NhaC
G49151 353 D Nucleoside diphosphate epimerase NmrA-like
G49211 346 P - -
C358 344 V Periplasmic l-amino acid catalytic subunit -
G30648 342 V Light harvesting protein Chlorophyll A-B binding protein
G23629 333 C Calcium transporting ATPase E1-E2 ATPase-associated region
G45835 316 V - Sterol-sensing 5TM boxaCluster size of contig. bConserved in different representatives from eukaryotic genomes (e-value cutoff 10-5; more than 30% identity and 50% coverage): C, core(plant/animal/diatom); D, diatom (P. tricornutum and T. pseudonana); O, animal (opisthokonts); P, Phaeodactylum tricornutum; V, plant (Viridiplantae).
Maheswari et al. Genome Biology 2010, 11:R85http://genomebiology.com/2010/11/8/R85
Page 5 of 19

Based on our R-value criteria, only 7 genes could bedefined as being constitutively expressed across all16 libraries and these included frustulins and genesinvolved in cell division. This set of transcripts repre-sents a valuable resource for promoter analysis, espe-cially to identify constitutive promoters for reversegenetics studies.
Gene Ontology term enrichment analysisTo further explore the functional significance of thelibrary clusters and the differentially expressed genes ineach library, functional annotation was performed usingsequence and domain conservation analysis. For thetranscripts showing sequence level similarity to ‘known’proteins (Blastp, e-value <10 -5), Gene Ontology (GO)
term enrichment analysis was performed using blast2GO[34]. The GO terms of all the expressed transcripts werecompared to the genes that are differentially expressedin each library. Additional file 7 shows the list of GOterms that are over-represented in each library (P <0.001). In Additional file 7 we also show over-repre-sented GO terms shared between libraries. The ureaadapted (UA) and ammonium adapted (AA) librariesshow over-representation of genes involved in nitrogen,amino acid, nucleotide and organic acid metabolism(Additional file 7), which is consistent with our knowl-edge of nitrogen metabolism. The blue light (BL) librarycontains the highest number of over-represented GOterms, and shares several categories related to photo-synthesis and pigment biosynthesis with the iron limited
Figure 2 Hierarchical clustering showing the expression pattern of transcripts expressed more than once in any of the 16 differentgrowth conditions. The blowup shows some of the genes differentially expressed in the high CO2 libraries (C1 and C4). Expression levels areshown in an increasing scale from grey to dark blue, and are based on frequencies of ESTs in each library (see Materials and methods). NA, noannotation information available. For two-letter library codes, see Table 1.
Maheswari et al. Genome Biology 2010, 11:R85http://genomebiology.com/2010/11/8/R85
Page 6 of 19

(FL) library, such as porphyrin and tetrapyrrole bio-synthesis. The significance of these shared terms withrespect to metabolic management in iron starved cellshas been discussed previously [33]. Additionally, theblue light library also has some unique GO terms,related to sugar and isoprenoid metabolism, transcrip-tion and translation, that likely reflect a general activa-tion of metabolism stimulated by light exposure of dark-adapted cultures. These terms are not shared with otherlibraries.The high decadienal (HD) library displays GO terms
related to steroid metabolism as well as uncharacterizedproteins involved in responses to biotic stimuli. Thesetranscripts might provide insight into mechanisms ofprogrammed cell death in diatoms because decadienalhas been implicated in regulating the process [20,35].The nitrate libraries (NR, NS) share a group of transpor-ters and the nitrate replete (NR) library shows over-representation of nucleoside phosphate metabolic pro-cesses, specifically purine nucleoside triphosphate meta-bolism. The oval morphotype (OM) library, which is asalt stress library, shows over-representation of lipidmetabolism classes whereas the triradiate morphotype(TM) library is over-represented in genes encodingactive transport processes. In the high CO2 after 1 day(C1) library, COPI-vesicle-coat-related GO terms areover-represented, and in the high CO2 after 4 days (C4)library, inorganic anion transporters are over-repre-sented. Perhaps surprisingly, in spite of clusteringtogether in the hierarchical clustering analysis (Figure2), the two high CO2 libraries (C1, C4) do not share any
particular pathway terms. The over-representation ofnovel genes may be the reason for not finding anyknown GO terms between these two libraries, whichillustrates our present ignorance of diatom biology, inspite of studying responses to a stimulus of significantecological relevance.
InterPro domain analysisAs an additional approach to examine the functionalsignificance of differentially expressed transcripts, weexplored domain content using InterPro [36]. We firstclassified putative proteins into two groups, those con-taining InterPro domains were denoted ‘proteins withdefined functions’ (PDFs), and those with no recogniz-able domains were denoted ‘proteins with obscure func-tions’ (POFs) [37,38]. Comparisons with otherorganisms showed that most PDFs have orthologs inother heterokonts, particularly T. pseudonana, and thata significant number are also found in Viridiplantae andOpisthokonta (Additional file 8). Notwithstanding, a sig-nificant number of PDFs (1,011 out of 3,693) were notfound in these 14 organismal groups compared, indica-tive of the highly chimeric nature of diatom genomes.In a previous whole genome study of 10 different
model eukaryotes, it was shown that POFs representbetween 18 and 38% of a typical eukaryotic proteome[37]. In the putative proteome of P. tricornutum wefound 44% of POFs, considerably more than usual,which likely reflects the fast evolving diatom genomesand the largely unexplored nature of diatom generepertoires [8]. Table 3 shows the average protein
Figure 3 Individual examples of expression patterns of transcripts that are expressed in all 16 conditions but with differentlog-likelihood ratios (R-values). For two-letter library codes, see Table 1.
Maheswari et al. Genome Biology 2010, 11:R85http://genomebiology.com/2010/11/8/R85
Page 7 of 19

composition statistics of the POFs and PDFs present inthe P. tricornutum genome. We do not see higher varia-tion in the length, amino acid composition and percen-tage of putative proteins with trans-membrane domains,indicating that the higher percentage of POFs is notlikely to reflect pseudo-genes or transcripts that are nottranslated. We therefore propose that the majorityencode bona fide genes.Most of the differentially expressed transcripts encode
PDFs; in particular, the blue light (BL) library containedmore than 75% of proteins with defined domains, con-sistent with the fact that the BL library has the highestnumber of over represented GO terms (Additional file5). This is possibly because we can infer a lot moreabout photosynthesis in diatoms by extrapolation ofknowledge from plants and other algae than we canabout other processes such as diatom responses tonutrients, which may therefore be rather novel. As acase in point, the most highly represented IPR domainsin the blue light (BL) library included domains for bicar-bonate transport, carbon fixation, light harvesting, andphotosynthetic electron transport (Additional file 9), allof which are known to be key processes ofphotosynthesis.As an example of using domain analysis to obtain
functional information, the top 15 InterPro domainsfound in the high CO2 libraries (C1 and C4) are shownin Figures 4a,b. As a reference, Figure 4c shows the 30most highly represented domains in the P. tricornutumgenome, corresponding to gene families expanded indiatoms, such as protein kinases and heat shock tran-scription factors [8]. In the CO2 libraries we detecteddomains involved in pH maintenance and nitrogenmetabolism, as well as a decarboxylase domain, found injust one gene. The function of this gene in diatomresponses to high CO2 will be well worth exploring. Theenlarged region in Figure 2 shows some of the othertranscripts that are shared in the high CO2 conditions,including genes encoding nitrogen metabolism compo-nents. Genes involved in phosphate metabolism are alsoevident, suggesting that P. tricornutum responds tohigher CO2 levels by up-regulating primary metabolicpathways.
The top 20 IPR domains in each of the other librariesare shown in Additional file 9. The data both confirmthe validity of the culture conditions used for librarygeneration (for example, the nitrogen libraries are over-represented in IPR domains related to nitrogen meta-bolism) and provide a new resource for exploringunanticipated aspects of diatom responses to specific sti-muli. For example, the observed over-representation ofIPR domains from heat shock transcription factors inthese same libraries infers the importance of this class oftranscription factors in regulating nitrogen metabolism.
Correlations between librariesCorrespondence analysis (CA) was conducted with the9,145 transcripts to identify correlated growth condi-tions. In this method, the frequencies of possibly corre-lated expression patterns are split into smallercomponents of un-correlated variables, and these com-ponents can be represented in multidimensional spaceusing an axis for each transformed component. The firsttwo components (axis) showing the maximum variance(least correlated) in expression are plotted in Figure 5.We found that the high decadienal (HD), original stan-dard (OS) and high CO2 (C1, C4) libraries showed themaximum variance from the rest of the libraries. Thedissimilarity of the OS library was not unexpectedbecause it was created using different protocols com-pared to the other 15 libraries. It was therefore not con-sidered further in this analysis. Comparative andfunctional analysis of the 100 genes showing maximumvariance in expression in the other three conditionsindicated that these transcripts mainly represent noveltranscripts expressed in specific conditions and not pre-dicted by conventional gene prediction programs or byother homology-based methods (data not shown). Anexample is shown in Figure 5, in which transcript C322is unique to the high decadienal (HD) library andresembles a diatom-specific retrotransposon [39]. Con-versely, transcript C301 is highly expressed uniquely inhigh CO2 conditions (C4 library), but does not have apredicted gene model. It does not show clear homologyto any known sequence in other organisms, but its bestBLAST hit is to a proteophoshphoglycan from Leishma-nia (data not shown). Interestingly, recent analyses haveshown that this gene is also heavily methylated, unlikethe majority of P. tricornutum genes (unpublished infor-mation Florian Maumus, Leila Tirichine and CB).Methylation of DNA is currently receiving attention as amechanism controlling gene expression [40], so geneC301 is likely to be of great interest for future studies.To further examine the contribution of known and
unknown genes in each library, we repeated the corre-spondence analysis after classifying the transcripts basedon the presence and absence of domains. Figure 6a
Table 3 Average properties of encoded POF and PDFproteins in P. tricornutum
Protein property POF PDF
Length 440.6 477.4
Residue weight 110.9 110.8
Charge 11.4 10.8
Isoelectric point 7 6.9
Molecular weight 48,852.8 52,840.5
Transmembrane domains 1.424 1.487
Maheswari et al. Genome Biology 2010, 11:R85http://genomebiology.com/2010/11/8/R85
Page 8 of 19

shows that among the four libraries with maximum var-iation in expression, the high decadienal (HD) librarydisplayed considerably more transcripts without adefined domain (POFs). The high CO2 (C1, C4) librarieshave a roughly equal number of PDF and POF
transcripts. Similar trends were seen when the analysiswas repeated for diatom-specific transcripts (present inat least one of the two diatoms under study; e-value cut-off 10-5) or core transcripts also present in 14 othereukaryotic genomes (described in Materials and meth-ods) (Figure 6b). We observed that the largest numberof diatom-specific transcripts was found in the high dec-adienal (HD) library, followed by the high CO2 (C1, C4)libraries. These differences may imply that proteins withno recognizable homologs or domains may exhibit pre-ferential involvement in species-specific regulatory andsignaling networks [37]. As a case in point, the highdecadienal treatment is known to induce programmedcell death and may be involved in regulating diatompopulation sizes [20,35].
Expression analysis of diatom orthologous genesThe above described cDNA libraries from P. tricornu-tum are accessible through the diatom EST database,together with seven libraries from T. pseudonana [41].Because two of the conditions were examined in bothspecies (iron limitation (FL) and nitrogen starvation(NS) [42]), we could make a comparative analysis of theresponse of each diatom. A total of 346 and 278 tran-scripts were found to be differentially expressed inP. tricornutum under iron limitation (FL) and nitrogenstarvation (NS) conditions, respectively. Among thesetranscripts, around 50% (174 in FL and 163 in NS) have
Figure 4 InterPro domain representation of transcripts expressed in the high CO2 conditions. (a) High CO2 after 1 day (C1); (b) high CO2
after 4 days (C4). (c) The 30 most highly represented InterPro domains across all the predicted gene models in the P. tricornutum genomeshown for comparison.
Figure 5 Principle component analysis of all the libraries basedon frequencies of expression across all 16 different conditions.The plot shows the axes with maximum variation. For two-letterlibrary codes, see Table 1.
Maheswari et al. Genome Biology 2010, 11:R85http://genomebiology.com/2010/11/8/R85
Page 9 of 19

orthologs in T. pseudonana (e-value cutoff 10-5 ) and asignificant number of these are also responsive to thesame treatment in this second diatom. Figure 7 showshierarchical clustering of the 346 P. tricornutum FLtranscripts together with 71 T. pseudonana putativeorthologs that are also expressed under iron limitation(FL). Within this set we can find diatom-specific POFsas well as transcripts with recognizable domains such astranscription factors (Figure 7). We can also find genesencoding photosynthetic components and putative cellwall proteins (fasciclin, gelsolin, annexin), implying thatthe global reprogramming of cellular metabolismobserved in P. tricornutum [33] may be common toother diatoms as well. In a similar analysis performedwith the 163 T. pseudonana orthologs of the nitratestarvation responsive P. tricornutum genes, 46 werefound to be differentially expressed in the same condi-tion in T. pseudonana (Additional file 10). Theseinclude genes encoding components of nitrogen meta-bolism, regulatory pathways, and a range of POFs. Onlyone of the genes expressed in response to nitrate starva-tion in both diatoms is diatom-specific, whereas nine ofthe iron responsive genes were classified as being dia-tom-specific (compare Figure 7 and Additional file 10).This could suggest that diatom responses to iron haveevolved specifically in diatoms, whereas nitrate starva-tion responses may constitute a more general organis-mal response.Whole-genome expression profiling using a tiled array
in T. pseudonana led to the identification of previously
un-annotated TUs [42]. Among these 3,470 TUs, 1,458were also found in the P. tricornutum genome (e-valuecutoff 10-5), and of these, 1,086 were expressed undervarious conditions in P. tricornutum. Additional file 11shows the expression patterns of these genes and it isapparent that many of these TUs are highly expressedin the high decadienal (HD) cDNA library. This result isconsistent with the previous observations revealing theunique expression patterns of diatom-specific genefamilies and ‘unknown’ genes in the HD library (forexample, Figure 6).
Expression patterns of bacterial genesIt was previously reported that horizontal gene transferfrom bacteria is one factor affecting diatom genomediversity, with at least 587 genes of proposed bacterialorigin were identified in the P. tricornutum genome [8].The expression of these genes was analyzed to study thefunctional significance of these acquired genes. A totalof 446 bacterial genes were expressed under variousgrowth conditions, and 50% of them were expressed inthe blue light (BL) library (Additional file 12A). Themost highly expressed bacterial genes encode a putativeNa+/H+ antiporter, hybrid cluster protein, and nitritereductase (Additional file 13). The latter two have beendiscussed previously in the context of their importancefor nitrogen metabolism in diatoms [43]. In spite of hav-ing fewer numbers of expressed bacterial genes, higherfrequencies of certain cDNAs were found in the ovalmorphotype (OM) and tropical accession (TA) libraries.
Figure 6 Expression of POFs and of diatom-specific genes in all 16 libraries. (a) Plot showing the axis 1 and axis 2 obtained fromcorrespondence analysis of the expression of transcripts with known domains (PDFs) and without any predictable domain (POFs). (b) Plotshowing the axis 1 and axis 2 obtained from correspondence analysis of the expression of transcripts that are conserved across 16 eukaryoticgenomes (Core) and transcripts that are present only in diatom genomes (Diatom).
Maheswari et al. Genome Biology 2010, 11:R85http://genomebiology.com/2010/11/8/R85
Page 10 of 19

Figure 7 Hierarchical clustering of transcripts defined as being differentially expressed under iron limitation (FL) in P. tricornutum,along with the hierarchical clustering of corresponding orthologs expressed under iron limitation (FL) in T. pseudonana. Expressionlevels are shown in an increasing scale from grey to dark blue, and are based on frequencies of ESTs in each library (see Materials and methods).For two-letter library codes for P. tricornutum, see Table 1. T. pseudonana library codes are TL, temperature limited; FL, iron limited; CL, carbondioxide limited; SL, silicate limited; NL, nitrate limited; OL, old library; NP, nitrate plus [42]. The red letter ‘D’ in the T. pseudonana cluster denotesthe diatom-specific transcripts.
Maheswari et al. Genome Biology 2010, 11:R85http://genomebiology.com/2010/11/8/R85
Page 11 of 19

The functional significance of these bacterial genes wasexplored with reference to their orthologs in other bac-terial genomes using the COG database of bacterialorthologous gene clusters [44]. The set of bacterialgenes identified in P. tricornutum were found to repre-sent 19 different COG classes (Additional file 10), withgenes belonging to ‘energy production and conversion’being the most highly expressed. By contrast, genesbelonging to the categories of intracellular trafficking,secretion, cell motility, and chromatin structure wereunder-expressed.
Gene composition and expressionIn a pilot analysis with the 12,136 cDNAs from the OSlibrary, it was shown that transcripts that are repre-sented by higher numbers of ESTs show higher levels ofguanine and cytosine nucleotides at the third codonposition (GC3) [25]. To examine the significance of cor-relation between expression level and codon usage bias,we derived a codon usage table using the predicted genemodels for P. tricornutum, which is available at [45].We applied correspondence analysis to study the relativesynonymous codon usage [46] in the highly expressedgenes across all the libraries. Codon Adaptation Indexvalues were then calculated using CodonW [47]. Corre-spondence analysis allowed the identification of the firstfour axes (components) that explain the majority of thevariance (30.6%) in codon usage among P. tricornutumputative coding sequences (CDSs). The principal axis(F1) contributes 15.5% to the total variance, while thesecond axis (F2) explains only 6%. Consequently, we canconclude that F1 is the main factor driving codon usageheterogeneity in P. tricornutum. We therefore chose theprojection of points (the 59 codons) along F1 and usedthese coordinates as an estimator of the relative usageof degenerate codons within each CDS (Figure 8). Thepreferred codons are generally C-ending, in agreementwith previous reports [25]. Therefore, C-ending codonsare likely to be translationally optimal. An additionalinteresting feature of P. tricornutum CDSs is the relativelack of G3 ending codons among quartets.
DiscussionThe P. tricornutum cDNAs described in this report wereobtained from cells grown in 16 different conditions ofecological relevance, and are publicly available in a digi-tal gene expression database [48]. In total, they corre-spond to 86% of the predicted genes in the genome, andare therefore a useful basis for exploring gene expres-sion patterns. As demonstrated here they can also beused to probe the function of genes that do not showsignificant homology to transcripts in other sequencedgenomes. How many of the remaining 14% of P. tricor-nutum gene models that lack EST support actually
represent bona fide genes is unknown [8]. The fact thatwe could detect an additional 1,968 TUs that lack genemodels shows the limitations of current gene predictionprograms to detect diatom genes, and sets an upperlimit of 12,370 genes in P. tricornutum, in the samerange as the upper count of 14,862 genes predicted byexpression analysis in T. pseudonana [42]. The numberof diatom genes that encode small RNAs rather thanproteins is also unclear at this time, although theexpressed P. tricornutum genes that lack homology toknown sequences do appear in general to encode pro-teins with the typical biochemical characteristics ofP. tricornutum proteins (Table 3).Due to the phylogenetic distance of diatoms from
most of the eukaryotes for which whole genomesequences are available, comprehensive cDNA collec-tions also provide an important resource to improvegene prediction. For example, in P. tricornutum only28% of the gene models could be predicted by homol-ogy-based methods; the others were predicted using thecDNAs reported here as a training set for ab initiomethods [8]. This data set will also be of importance forthe growing number of diatom genome projects, forexample, from Pseudo-nitzschia multiseries and Fragilar-iopsis cylindrus, as well as for other heterokont sequen-cing projects.An important aspect of the current study is that 15 of
the libraries were generated from non-nomalized mRNApopulations and using the same methodologies (the ori-ginal library (OS) described previously in [21] was gen-erated using a different method). The gene expressionpatterns in each culture condition can therefore be com-pared and contrasted with the other conditions. Tofacilitate this, we converted EST counts to frequenciesin each library, examined redundancy by rarefaction,and diversity using Simpson’s index. Although alllibraries were clearly under-saturated, there was widevariation in redundancy and diversity (Figure 1). Somelibraries were characterized by having several sets ofevenly abundant cDNAs - for example, the nitratereplete (NR) library - while others had fewer sets ofhighly abundant cDNAs - for example, the nitratestarved (NS) library. These results therefore provideinformation about how P. tricornutum responds to thedifferent conditions examined.Although the 15 cDNA libraries were generated and
sequenced using the same protocol, a potential caveat ofour approach is that the culturing conditions underwhich the libraries were generated were not identical(Additional file 1) because they were generated in differ-ent laboratories worldwide. To reduce unnecessaryheterogeneity, all cells were nonetheless harvested atmid- or late exponential phase. Furthermore, in ouropinion the results from our statistical analyses
Maheswari et al. Genome Biology 2010, 11:R85http://genomebiology.com/2010/11/8/R85
Page 12 of 19

demonstrate clearly the biological significance of themeasured transciptional outputs - for example, thenitrogen limited libraries show clear effects in genesinvolved in nitrogen metabolism.Our analyses are especially valuable for the explora-
tion of diatom genes with undefined functions becauseexpression profiling can shed light on their functionalsignificance [49]. Many of these genes encode proteinsthat lack recognizable InterPro domains, and have beenclassified as encoding POFs. Diatom genomes encodehigher numbers of POFs than have been observed inother genomes (see Results). In rice and Arabidopsis,such genes are thought to contribute to ecological
differences and species diversity [37,38]. The predictedbiochemical characteristics of these putative P. tricornu-tum proteins suggest that they represent functionalproteins. Approximately half of them are also found inT. pseudonana, and interestingly can be seen in manycases to be specifically induced by high decadienal treat-ment (Figure 6; Additional file 11). This aldehyde is ofinterest because it has been implicated in regulating dia-tom population densities [20,50], so these genes deserveattention as being of potential importance in the controlof population density and programmed cell death.The different statistical methods employed in this
study provide support for several recent hypotheses
Figure 8 Radar plot showing the preference of C ending codons, obtained from Codon Adaptation Index analysis done on highlyexpressed transcripts only. Codons shown in red correspond to the most commonly used codons.
Maheswari et al. Genome Biology 2010, 11:R85http://genomebiology.com/2010/11/8/R85
Page 13 of 19

proposed on the basis of experimental observations; forexample, the commonalities of nitrate, ammonium andurea assimilation [7,43] can be seen in the similarexpression profiles of the NS, AA, and UA libraries, andthe reprogramming of diatom photosynthesis inresponse to iron limitation [33] is reflected in the com-mon gene expression profiles between the FL libraryand the blue light (BL) library (Figure 2). Conversely,the two abiotic stress libraries - low temperature (TA)and low salinity (OM) - display similar expression pro-files (Figure 2), in agreement with the known overlap inthe response to these stresses in other organisms [8].These expected results are satisfying, but more impor-tantly they increase confidence that the methodologiesused can help resolve other less well understood pro-cesses involved in each individual response. For exam-ple, when hierarchical clustering is done using only thesmall set of 177 expressed transcription factors in P. tri-cornutum, the relationships observed between the differ-ent libraries are essentially the same as can be seenwhen using all 9,145 TUs [17] (Figure 2). Hence, themethodologies reported here can help identify transcrip-tion factors associated with differential expression in thedifferent growth conditions. Conversely, genes ofunknown function can be recruited to a specificresponse, for example, those induced in response tohigh decadienal. Such correlations provide a reasonablebasis to explore the function of such genes.Finally, our studies have helped to understand better
the roles in diatoms of genes of probable bacterial ori-gin. These acquired bacterial genes have undergonemodifications, such as gene fusions and novel domainreorganizations [8]. The observed diversity of their phy-logenetic origins, derived from a wide range of differentbacterial groups, is reflected in their functional diversityin that they belong to 19 different COG categories.Many are expressed in different conditions (Additionalfile 12), which may reflect the functional adaptation ofacquired bacterial genes to important metabolic andregulatory processes. In other cases, they are notstrongly expressed - for example, genes in the intracellu-lar trafficking, cell motility, secretion, and chromatinstructure categories - which may indicate that genesderived from the secondary endosymbiotic parents havebeen retained for these functions.Although there can be no substitute for laboratory-
based exploration of gene function, the sheer numbersof diatom-specific genes of unknown function necessi-tates the availability of high throughput in silicoapproaches that can allow diatom researchers to identifyinteresting candidate genes that likely play key func-tions. We believe that the resources described hererepresent a significant step forward for characterizingdiatom genes, as highlighted by PtTU G49202, a
P. tricornutum gene of unknown function that is extre-mely highly expressed (Table 2), and PtTU G55010, acarboxylase of unknown function that we have linked tothe diatom response to high CO2. Reverse geneticsapproaches such as RNA interference [14] can now bedirected towards genes such as these in order to definetheir precise functions experimentally and to helpunderstand the specific innovations that have led to thedominance of diatoms in contemporary ecosystems.
ConclusionsThe unbiased statistical methods used in the currentstudy to analyze diatom gene expression profiles in dif-ferent conditions can provide insights of biological rele-vance for understanding how diatoms respond to theirenvironment, and in particular can pinpoint genes withunassigned functions for targeted studies. The digitalgene expression database that we have established [48]represents a new resource for identifying candidate dia-tom-specific genes involved in processes of major ecolo-gical relevance.
Materials and methodsLibrary conditionsA total of 15 cDNA libraries were constructed toexplore the molecular responses of P. tricornutum to arange of conditions, in addition to the previouslyreported library [21]. The different libraries are summar-ized in Table 1 and Additional file 1, and the rationalefor choosing each condition is summarized below. Alllibraries are derived from cells in mid-late exponentialphase.Geographically widely distributed strains of P. tricor-
nutum show interesting intra-species genetic and pheno-typic diversity [26] and undergo morphologicaltransitions between three possible morphotypes [9]. Toexplore the functional adaptations of different morpho-types, we made libraries from each of them. The triradi-ate morphotype (TM) library was constructed frommRNAs extracted from cells grown by repeated subcul-turing of the Pt8 accession under gentle agitation (80rpm) in order to obtain a culture with 70% of triradiatecells. The oval morphotype (OM) library was madeusing the Pt3 accession grown at low salinity, and thetropical accession (TA) library was obtained from Pt9cells grown at low temperature (15°C), treatments thatboth induce the formation of oval cells [26]. Cells wereobtained from cultures either following a shift to hypo-salinity 10% in Brown’s artificial sea water (ASW) [26]for Pt3 or after a shift from 28°C to 15°C for Pt9.The Pt1 8.6 accession also produces oval morphotype
cells when treated with decadienal, a programmed celldeath-inducing aldehyde [35]. Chemical signalinginduced by this diatom-derived aldehyde has been
Maheswari et al. Genome Biology 2010, 11:R85http://genomebiology.com/2010/11/8/R85
Page 14 of 19
shown to trigger stress responses and may controlbloom dynamics in phytoplankton populations [20].Two libraries, low decadienal (LD) and high decadienal(HD), were constructed to explore the genes expressedin response to sublethal (0.5 μg/ml) and lethal (5 μg/ml)concentrations of decadienal after 6 h treatment,respectively.All other libraries were derived from cultures of the
Pt1 8.6 accession grown under different nutrientregimes that contained predominantly the fusiform mor-photype. Iron bioavailability is a major factor limitingphotosynthetic biomass in the ocean [51] and Fe fertili-zation experiments have shown that diatoms showgreater sensitivity to iron compared to other phyto-plankton [52]. The iron limited (FL) library wasdesigned to study genes expressed at low concentrationsof iron [33].Diatoms also play a major role in nitrogen-based bio-
geochemical cycles, and the diatom genome has beenshown to encode various nitrate and ammonium trans-porters as well as the full complement of urea cycleenzymes [7,43]. cDNA libraries were therefore con-structed from cells grown under various nitrogenregimes to help understand the complexities of nitrogenmetabolism in diatoms. We constructed four suchlibraries from nitrate-starved (NS) cells grown in 50 μMof nitrate for 3 days, nitrate-replete (NR) cells grown in1.12 mM nitrate, and from ammonium adapted (AA)and urea adapted (UA) cultures. The NS and NR cul-tures were grown under continuous light (120 μmol.m-2.s-1). Walne medium [53] was used for the NR conditionand NO3
- concentration was reduced to 50 μM for theNS condition. Cultures were sampled at both steadystate (NR and NS) as well as during the N-depletionperiod.Additionally, cDNAs obtained from cells grown in the
presence and absence of silicic acid (SP and SM, respec-tively), formed a useful data set for studies of the silicifi-cation process [54].To examine light-responsive gene expression, a cDNA
library was generated from cultures grown in 12 h light-dark cycles to a concentration of 0.5 × 10⁶ cells permilliliter, subsequently dark adapted for 60 hours, andthen exposed to blue light. Cells were harvested after1 h induction by centrifugation for 15 minutes at 3,000 gand conserved at -80°C until RNA extraction.Diatoms are responsible for about 20% of global car-
bon fixation and many studies are underway to explorehow diatoms may be affected by climate change. Wetherefore constructed cDNA libraries from cells grownunder high carbon dioxide concentrations for one (C1)and 4 days (C4). The study of adaptation to such condi-tions is of particular interest in the light of increasingCO2 levels in the Earth’s atmosphere. For these
experiments cells were initially grown at 2.8 mM DICwith a dilution rate of 0.5 d-1 (temperature and pH werekept constant at 20°C and 8.0, respectively), and highCO2 conditions were obtained by increasing DIC to 3.2mM by bubbling carbon dioxide into the cultures untilthe pH reached 7.0.Moreover, we used three different culture methods;
the NS, NR, C1 and C4 libraries were all grown in che-mostat cultures, whereas the OM, AA, UA, TA, FL, andother libraries were from batch cultures. For the carbondioxide chemostat experiments the cells were grown at20°C under continuous light (120 μmol.m-2.s-1) with anoperating speed of 100 rpm. The cultures were run at20% dilution rates and sampled at steady state at pH 8.0and pH 7.0 as well as during the adjusting periodbetween these two levels, that is, within 24 h after pHmodification.The above libraries can therefore be used to study
growth conditions and gene expression in response todifferent stimuli of ecological relevance. Although thecDNA library that we originally characterized [21] wasalso incorporated into the current analyses, certain com-parisons with the other libraries should be viewed withcaution because this cDNA library was constructedusing different methodologies.
Library constructionThe non-normalized cDNA libraries were constructedfrom poly(A)+ RNA purified from total extracted diatomRNA using the CloneMiner cDNA library constructionkit (Invitrogen, Cergy-Pontoise, France) following thesupplier’s instructions with minor modifications. Fifteendifferent conditions (Table 1) were used to maximizethe detection of genes expressed with specific condition-enriched profiles. Sequencing was performed mostlyfrom the 5′ end of the insert but for some of thelibraries an attempt was made to sequence each clone atboth the 5′ and the 3′ ends. When both EST reads over-lapped, the two sequences were fused into a consensussequence using PHRAP [55].
Sequence analysisThe complete set of cDNAs was subject to a preliminaryanalysis as previously described in [22], with a variationin obtaining the non-redundant data set. The cDNAswere first aligned to the predicted gene models availableat the Joint Genome Institute (JGI) [56] using theBLAST program [57] and the cDNAs that did not havea predicted gene model were subjected to CAP3assembly [29]. This two step procedure to derive thenon-redundant set avoided the over-estimation of non-redundant transcripts (TUs) led by short transcripts.The cluster size (that is, the number of redundantcDNAs for each TU) was obtained and the number of
Maheswari et al. Genome Biology 2010, 11:R85http://genomebiology.com/2010/11/8/R85
Page 15 of 19

transcripts contributed by each individual library tocluster size was also counted for all the TUs. An initialfunctional annotation of the non-redundant transcriptswas done using blast2GO [34]. A more advanced anno-tation, such as the assignment of InterPro domains andKEGG pathways, was obtained from the P. tricornutumgenome annotation performed at the JGI.The P. tricornutum and T. pseudonana sequences
were also compared by BLASTX to those in 14 othereukaryotic genomes, specifically Phytophthora ramorum,Phytophthora sojae, Chlamydomonas reinhardtii, Ostreo-coccus lucimarinus, Ostreococcus tauri, Cyanidioschyzonmerolae, Monosiga brevicollis, Dictyostelium discoideum,Ciona intestinalis, Caenorhabditis elegans, Aspergillusniger, Pichia stipitis, Arabidopsis thaliana and Saccharo-myces cerevisiae.
Library richness and diversityThe richness and diversity of cDNAs sampled fromeach cDNA library was estimated by statistical methods.Richness was estimated by rarefaction using the Analy-tic Rarefaction 1.3 program [58] to plot the rarefactioncurve. Diversity was estimated using Simpson’s Recipro-cal Index and was calculated using the formula (1/D),where D is Simpson’s index calculated using the for-mula [28]:
Dn n
N N= ∑ −
−( )( )
11
where n is the cluster size (the number of cDNAs ofeach TU in each library) and N is the library size (thetotal number of cDNAs sequenced in each library).
Data normalization and clusteringThe count of cDNAs in each library and for each cluster(TU) was normalized to the library size by calculatingthe frequency (the EST count divided by the librarysize). This normalized data facilitated the comparisonsof expression across different libraries in spite of the dif-ferences in library sizes. The frequency distribution of9,145 TUs that are expressed more than once acrossone or more libraries were used for principal compo-nent analysis. Principal component analysis was doneusing R version 2.5.0 [59]. The same data set was usedto identify genes and libraries with similar expressionpatterns using two-way hierarchical clustering. The hier-archical clustering was done using the program cluster2.11 [30] and was visualized using ‘Java Treeview’ [31].
Differential gene expressionTo study the distribution of transcripts across differentlibraries and to identify clusters that were significantlyover-represented in certain growth conditions, we
examined the expression patterns of the 9,145 clusters.To eliminate differences in distribution caused by thedifferences in library size, the counts were normalizedby converting them to frequency. To determine whetherthe differences in frequency distribution were due tostatistically significant differential gene expression or toa random distribution, we calculated the log likelihoodratio, R-value [32], for each cluster. To define a cutoffR-value, we calculated the R-value for 9,145 randomclusters generated from a Poisson distribution whoseparameter is equal to the expected cluster size for thatlibrary 1,000 times. Additional file 4 shows the R-valuesof the actual 9,145 clusters and in the randomized dataset. The probability of having an R-value above 23 waszero in all randomized clusters. We considered an R-value cutoff of 12, corresponding to 0.96 probability(that is, with 96% chance that it is not a random event),providing a useful basis to define genes displaying differ-ential mRNA levels in our cDNA libraries. The 8,402transcripts with R-values above 12 were analyzed andcatalogued as differentially expressed in the librarieshaving the top two highest frequencies. Transcriptsrepresented by three or fewer cDNAs were removed.
Gene Ontology and COG annotationThe expressed TUs were subjected to GO annotation[60] and GO term enrichment analysis was done usingthe Blast2GO program [34]. COG annotation was doneby RPS-BLAST [61] with the TUs as query using theConserved Domain Database (CDD) [62]. COG identi-ties were assigned to any TU with a BLAST e-valuebelow 10-3.
Codon usage analysisThe codon usage table for P. tricornutum was obtainedusing the CDSs from JGI and using the EMBOSS pro-gram [63]. Codon Adaptation Index values were calcu-lated using CodonW [47]. This analysis was performedusing all the CDSs starting with ATG, and the maxi-mum number or the sum of cDNAs across all thelibraries was taken as an expression level index. Genesrepresented by more than 30 cDNAs were used as areference set for highly expressed genes to study codonusage bias and its relation to expression level.
Additional material
Additional file 1: Supplementary Table S1. A comprehensivedescription of culturing conditions of the libraries.
Additional file 2: Supplementary Figure S1. Expression patterns ofdiatom-specific genes. (A) Hierarchical clustering to show the expressionpattern of transcripts belonging to the gene families conserved acrossdifferent taxonomical groups (Core), diatom-specific (Diatom) and P.tricornutum-specific (Pt) [8]. (B) Plot showing the average frequency ofthe above set of transcripts across the 16 different conditions. In (A),
Maheswari et al. Genome Biology 2010, 11:R85http://genomebiology.com/2010/11/8/R85
Page 16 of 19

expression levels are shown in an increasing scale from grey to darkblue, and are based on frequencies of ESTs in each library (see Materialsand methods). For two-letter library codes, see Table 1.
Additional file 3: Supplementary Table S2. Diatom-specific genesexpressed in both high and low decadienal libraries (HD and LD).
Additional file 4: Supplementary Table S3. R-values of the actual 9,145clusters and that of the randomized data set.
Additional file 5: Supplementary Figure S2. Percentage ofdifferentially expressed transcripts in primary y-axis, normalized tonumber of non-redundant transcripts (TUs) across the EST libraries andthe percentage of transcripts with defined InterPro domains (PDFs) in thedifferentially expressed transcripts in the secondary y-axis. The arrow inthe secondary y-axis at 56% corresponds to the percentage of PDFsfound in all the putative proteins predicted in the P. tricornutum genome(5,825 out of 10,402 protein models). For two-letter library codes, seeTable 1.
Additional file 6: Supplementary Table S4. The 71 transcripts thatwere expressed at least once across all the libraries.
Additional file 7: Supplementary Table S5. GO terms that are over-represented in each library (P < 0.001). In this table we also show over-represented GO terms shared between libraries.
Additional file 8: Supplementary Figure S3. Distribution of P.tricornutum PDFs in other organismal groups. Numbers in parenthesesindicate the number of genes with defined protein domains (PDF) andthe number outside the parentheses represent the total number ofgenes in each organismal group.
Additional file 9: Supplementary Table S6. The top 20 IPR domainsexpressed across all the libraries and the number of ESTs for eachdomain.
Additional file 10: Supplementary Figure S4. Hierarchical clustering oftranscripts defined as being differentially expressed under the nitratestarved condition (NS) in P. tricornutum along with the hierarchicalclustering of corresponding orthologs expressed in the nitrate limitedcondition (NL) in T. pseudonana. Expression levels are shown in anincreasing scale from grey to dark blue, and are based on frequencies ofESTs in each library (see Materials and methods). For two-letter librarycodes, see Table 1 and the Figure 7 legend.
Additional file 11: Supplementary Figure S5. Hierarchical clusteringshowing the expression patterns of P. tricornutum orthologs of the novelgenes identified by tiling array in T. pseudonana [42]. Expression levelsare shown in an increasing scale from grey to dark blue, and are basedon frequencies of ESTs in each library (see Materials and methods). Fortwo-letter library codes, see Table 1.
Additional file 12: Supplementary Figure S6. Expression of bacterialorthologous genes in P. tricornutum. (A) Plot showing the number oftranscripts of bacterial origin expressed across the 16 different growthconditions. The primary y-axis shows the number of transcripts and thesecondary y-axis shows the average frequency of these expressedtranscripts. (B) Expression profiling of the genes of putative bacterialorigin along with their COG categories. The gradient of blue shows thelevel of expression, with the darker colors being the highly expressedgenes. The red color shows the lack of expressed transcripts. For two-letter library codes, see Table 1.
Additional file 13: Supplementary Table S7. Bacterial genes and theirexpression across different libraries along with the domain and genomiclocation.
AbbreviationsAA: ammonium adapted; ASW: artifical sea water; BL: blue light; C1: highCO2 1 day; C4: high CO2 4 days; CDS: coding sequence; DIC: dissolvedinorganic carbon; EST: expressed sequence tag; FL: iron limited; GO: GeneOntology; HD: high decadienal; JGI: Joint Genome Institute; LD: lowdecadienal; NR: nitrate replete; NS: nitrate starved; OM: oval morphotype; OS:original standard; PDF: protein with defined function; POF: protein with
obscure function; SM: silicate minus; SP: silicate plus; TA: tropical accession;TM: triradiate morphotype; TU: transcriptional unit; UA: urea adapted.
AcknowledgementsFunding for the Diatom Digital Gene Expression Database was from theEuropean Union-funded Diatomics project and the Agence Nationale de laRecherche (France). cDNA construction and DNA sequencing was funded byGenoscope (France). We are grateful to Pierre Vincens, Jean-Pierre Roux andEdouard Bray for managing the server and the software and for their help inweb interface creation, Ikhlak Ahmed for his help with statistical analysisusing R statistical language, as well as Igor Grigoriev and Alan Kuo from JGI.We would also like to thank Patrick Wincker, Julie Poulain and the technicalstaff of Genoscope for their essential contribution to the experimental partof the work, as well as Franck Anière and the entire system network team atGenoscope. The database is freely available on the web at [48]. The P.tricornutum cDNAs have been submitted to the NCBI dbEST (GenBankaccession numbers [GenBank:CD374840] to [GenBank:CD384835] and[GenBank:BI306757] to [GenBank:BI307753]).
Author details1Institut de Biologie de l’Ecole Normale Supérieure, CNRS UMR 8197 INSERMU1024, Ecole Normale Supérieure, 46 rue d’Ulm, 75005 Paris, France. 2Currentaddress: EMBL - European Bioinformatics Institute, Wellcome Trust GenomeCampus, Hinxton, Cambridge CB10 1SD, UK. 3CEA - Institut de Génomique,Genoscope and CNRS UMR 8030, 2 rue Gaston Crémieux CP5706, 91057Evry, France. 4Current address: J Craig Venter Institute, 11149 N. Torrey PinesRd, Suite 220, La Jolla, CA 92037, USA. 5Physiologie et Biotechnologie desAlgues, IFREMER, BP 21105, 44311 Nantes, France. 6Marine Biogeochemistry,IFM-GEOMAR Leibniz-Institut für Meereswissenschaften, Düsternbrooker Weg20, D-24105 Kiel, Germany. 7Université de Nantes, EA 2160, Laboratoire ‘Mer,Molécule, Santé’, Faculté des Sciences et Techniques, 2 rue de la Houssinière,44322, BP 92208, 44322 Nantes Cedex 3, France. 8School of Oceanography,University of Washington, 616 NE Northlake Place, Seattle, WA 98105, USA.9University of East Anglia, School of Environmental Sciences, NorwichResearch Park, Norwich NR4 7TJ, UK. 10Department of Plant Sciences,Weizmann Institute of Science, Rehovot 76100, Israel .
Authors’ contributionsUM performed the bioinformatics analyses and prepared the manuscript, KJperformed codon usage analysis and provided advice on data interpretation,JLP, BMP, JW, and MK perfected RNA extraction and library construction, andperformed DNA sequencing, assembly and annotation, AEA, JPC, ADM, MH,RK, JLR, PJL, VMJ, AM, TM, MSP and AV prepared cultures and providedcritical advice on analysis outputs, EVA helped in data interpretation, CBcoordinated the work and finalized the manuscript. All authors have readand approved the manuscript.
Received: 23 October 2009 Revised: 11 May 2010Accepted: 25 August 2010 Published: 25 August 2010
References1. Baldauf S: An overview of the phylogeny and diversity of eukaryotes. J
Systematics Evol 2008, 46:263-273.2. Yoon HS, Hackett JD, Ciniglia C, Pinto G, Bhattacharya D: A molecular
timeline for the origin of photosynthetic eukaryotes. Mol Biol Evol 2004,21:809-818.
3. Patron NJ, Rogers MB, Keeling PJ: Gene replacement of fructose-1,6-bisphosphate aldolase supports the hypothesis of a singlephotosynthetic ancestor of chromalveolates. Eukaryot Cell 2004,3:1169-1175.
4. Moustafa A, Beszteri B, Maier UG, Bowler C, Valentin K, Bhattacharya D:Genomic footprints of a cryptic plastid endosymbiosis in diatoms.Science 2009, 324:1724-1726.
5. Nelson DM, Treguer P, Brzezinski MA, Leynaert A, Queguiner B: Productionand dissolution of biogenic silica in the ocean - Revised globalestimates, comparison with regional data and relationship to biogenicsedimentation. Global Biogeochem Cycles 1995, 9:359-372.
6. Raven JA, Waite AM: The evolution of silicification in diatoms:inescapable sinking and sinking as escape? New Phytologist 2004,162:45-61.
Maheswari et al. Genome Biology 2010, 11:R85http://genomebiology.com/2010/11/8/R85
Page 17 of 19

7. Armbrust EV, Berges JB, Bowler C, Green BR, Martinez D, Putnam NH,Zhou S, Allen AE, Apt KE, Bechner M, Brzezinski MA, Chaal BK, Chiovitti A,Davis AK, Demarest MS, Detter JC, Glavina T, Goodstein D, Hadi MZ,Hellsten U, Hildebrand M, Jenkins BD, Jurka J, Kapitonov VV, Kröger N,Lau VVY, Lane TW, Larimer FW, Lippmeier JC, Lucas S, et al: The genome ofthe diatom Thalassiosira pseudonana: Ecology, evolution, andmetabolism. Science 2004, 306:79-86.
8. Bowler C, Allen AE, Badger JH, Grimwood J, Jabbari K, Kuo A, Maheswari U,Martens C, Maumus F, Otillar RP, Rayko E, Salamov A, Vandepoele K,Beszteri B, Gruber A, Heijde M, Katinka M, Mock T, Valentin K, Verret F,Berges JA, Brownlee C, Cadoret JP, Chiovitti A, Choi CJ, Coesel S, DeMartino A, Detter JC, Durkin C, Falciatore A, et al: The Phaeodactylumgenome reveals the evolutionary history of diatom genomes. Nature2008, 456:239-244.
9. Borowitzka MA, Volcani BE: Polymorphic diatom Phaeodactylumtricornutum - ultrastructure of its morphotypes. J Phycol 1978, 14:10-21.
10. Apt KE, KrothPancic PG, Grossman AR: Stable nuclear transformation ofthe diatom Phaeodactylum tricornutum. Mol Gen Genet 1996, 252:572-579.
11. Dunahay TG, Jarvis EE, Roessler PG: Genetic transformation of the diatomsCyclotella cryptica and Navicula saprophila. J Phycol 1995, 31:1004-1012.
12. Falciatore A, Casotti R, Leblanc C, Abrescia C, Bowler C: Transformation ofnonselectable reporter genes in marine diatoms. Mar Biotechnol (NY)1999, 1:239-251.
13. Poulsen N, Chesley PM, Kroger N: Molecular genetic manipulation of thediatom Thalassiosira pseudonana (Bacillariophyceae). J Phycol 2006,42:1059-1065.
14. De Riso V, Raniello R, Maumus F, Rogato A, Bowler C, Falciatore A: Genesilencing in the marine diatom Phaeodactylum tricornutum. Nucleic AcidsRes 2009, 37:e96.
15. Harada H, Nakajima K, Sakaue K, Matsuda Y: CO2 sensing at ocean surfacemediated by cAMP in a marine diatom. Plant Physiol 2006, 142:1318-1328.
16. Kilian O, Kroth PG: Identification and characterization of a new conservedmotif within the presequence of proteins targeted into complex diatomplastids. Plant J 2005, 41:175-183.
17. Falciatore A, d’Alcala MR, Croot P, Bowler C: Perception of environmentalsignals by a marine diatom. Science 2000, 288:2363-2366.
18. Siaut M, Heijde M, Mangogna M, Montsant A, Coesel S, Allen A,Manfredonia A, Falciatore A, Bowler C: Molecular toolbox for studyingdiatom biology in Phaeodactylum tricornutum. Gene 2007, 406:23-35.
19. Tanaka Y, Nakatsuma D, Harada H, Ishida M, Matsuda Y: Localization ofsoluble beta-carbonic anhydrase in the marine diatom Phaeodactylumtricornutum. Sorting to the chloroplast and cluster formation on thegirdle lamellae. Plant Physiol 2005, 138:207-217.
20. Vardi A, Formiggini F, Casotti R, De Martino A, Ribalet F, Miralto A, Bowler C:A stress surveillance system based on calcium and nitric oxide in marinediatoms. PLoS Biol 2006, 4:e60.
21. Scala S, Carels N, Falciatore A, Chiusano ML, Bowler C: Genome propertiesof the diatom Phaeodactylum tricornutum. Plant Physiol 2002,129:993-1002.
22. Maheswari U, Montsant A, Goll J, Krishnaswamy S, Rajyashri KR, Patell VM,Bowler C: The Diatom EST Database. Nucleic Acids Res 2005, 33:D344-347.
23. Merchant SS, Prochnik SE, Vallon O, Harris EH, Karpowicz SJ, Witman GB,Terry A, Salamov A, Fritz-Laylin LK, Marechal-Drouard L, Marshall WF, Qu LH,Nelson DR, Sanderfoot AA, Spalding MH, Kapitonov VV, Ren QH, Ferris P,Lindquist E, Shapiro H, Lucas SM, Grimwood J, Schmutz J, Cardol P,Cerutti H, Chanfreau G, Chen CL, Cognat V, Croft MT, Dent R, et al: TheChlamydomonas genome reveals the evolution of key animal and plantfunctions. Science 2007, 318:245-251.
24. Matsuzaki M, Misumi O, Shin-I T, Maruyama S, Takahara M, Miyagishima SY,Mori T, Nishida K, Yagisawa F, Yoshida Y, Nishimura Y, Nakao S, Kobayashi T,Momoyama Y, Higashiyama T, Minoda A, Sano M, Nomoto H, Oishi K,Hayashi H, Ohta F, Nishizaka S, Haga S, Miura S, Morishita T, Kabeya Y,Terasawa K, Suzuki Y, Ishii Y, Asakawa S, et al: Genome sequence of theultrasmall unicellular red alga Cyanidioschyzon merolae 10 D. Nature2004, 428:653-657.
25. Montsant A, Jabbari K, Maheswari U, Bowler C: Comparative genomics ofthe pennate diatom Phaeodactylum tricornutum. Plant Physiol 2005,137:500-513.
26. De Martino A, Meichenin A, Shi J, Pan K, Bowler C: Genetic andphenotypic characterization of Phaeodactylum tricornutum(Bacillariophyceae) accessions. J Phycol 2007, 43:992-1009.
27. Chao A: Estimating the population-size for capture recapture data withunequal catchability. Biometrics 1987, 43:783-791.
28. Simpson EH: Measurement of diversity. Nature 1949, 163:688-688.29. Huang X, Madan A: CAP3: A DNA sequence assembly program. Genome
Res 1999, 9:868-877.30. Eisen MB, Spellman PT, Brown PO, Botstein D: Cluster analysis and display
of genome-wide expression patterns. Proc Natl Acad Sci USA 1998,95:14863-14868.
31. Saldanha AJ: Java Treeview - extensible visualization of microarray data.Bioinformatics 2004, 20:3246-3248.
32. Stekel DJ, Git Y, Falciani F: The comparison of gene expression frommultiple cDNA libraries. Genome Res 2000, 10:2055-2061.
33. Allen AE, Laroche J, Maheswari U, Lommer M, Schauer N, Lopez PJ,Finazzi G, Fernie AR, Bowler C: Whole-cell response of the pennatediatom Phaeodactylum tricornutum to iron starvation. Proc Natl Acad SciUSA 2008, 105:10438-10443.
34. Conesa A, Gotz S, Garcia-Gomez JM, Terol J, Talon M, Robles M: Blast2GO: auniversal tool for annotation, visualization and analysis in functionalgenomics research. Bioinformatics 2005, 21:3674-3676.
35. Vardi A, Bidie KD, Kwityn C, Hirsh DJ, Thompson SM, Callow JA, Falkowski P,Bowler C: A diatom gene regulating nitric-oxide signaling andsusceptibility to diatom-derived aldehydes. Curr Biol 2008, 18:895-899.
36. Mulder NJ, Apweiler R, Attwood TK, Bairoch A, Bateman A, Binns D, Bork P,Buillard V, Cerutti L, Copley R, Courcelle E, Das U, Daugherty L, Dibley M,Finn R, Fleischmann W, Gough J, Haft D, Hulo N, Hunter S, Kahn D,Kanapin A, Kejariwal A, Labarga A, Langendijk-Genevaux PS, Lonsdale D,Lopez R, Letunic I, Madera M, Maslen J, et al: New developments in theInterPro database. Nucleic Acids Res 2007, 35:D224-D228.
37. Gollery M, Harper J, Cushman J, Mittler T, Girke T, Zhu JK, Bailey-Serres J,Mittler R: What makes species unique? The contribution of proteins withobscure features. Genome Biol 2006, 7:R57.
38. Gollery M, Harper J, Cushman J, Mittler T, Mittler R: POFs: what we don’tknow can hurt us. Trends Plant Sci 2007, 12:492-496.
39. Maumus F, Allen AE, Mhiri C, Hu H, Jabbari K, Vardi A, Grandbastien MA,Bowler C: Potential impact of stress activated retrotransposons ongenome evolution in a marine diatom. BMC Genomics 2009, 10:624.
40. Roudier F, Teixeira FK, Colot V: Chromatin indexing in Arabidopsis: anepigenomic tale of tails and more. Trends Genet 2009, 25:511-517.
41. Maheswari U, Mock T, Armbrust EV, Bowler C: Update of the Diatom ESTDatabase: a new tool for digital transcriptomics. Nucleic Acids Res 2009,37:D1001-1005.
42. Mock T, Samanta MP, Iverson V, Berthiaume C, Robison M, Holtermann K,Durkin C, BonDurant SS, Richmond K, Rodesch M, Kallas T, Huttlin EL,Cerrina F, Sussmann MR, Armbrust EV: Whole-genome expression profilingof the marine diatom Thalassiosira pseudonana identifies genes involvedin silicon bioprocesses. Proc Natl Acad Sci USA 2008, 105:1579-1584.
43. Allen AE, Vardi A, Bowler C: An ecological and evolutionary context forintegrated nitrogen metabolism and related signaling pathways inmarine diatoms. Curr Opin Plant Biol 2006, 9:264-273.
44. Tatusov RL, Fedorova ND, Jackson JD, Jacobs AR, Kiryutin B, Koonin EV,Krylov DM, Mazumder R, Mekhedov SL, Nikolskaya AN, Rao BS, Smirnov S,Sverdlov AV, Vasudevan S, Wolf YI, Yin JJ, Natale DA: The COG database:an updated version includes eukaryotes. BMC Bioinformatics 2003, 4:41.
45. The Phaeodactylum tricornutum Digital GeneExpression Database. [http://www.diatomics.biologie.ens.fr/EST/Pt-GM.cod].
46. Sharp PM, Li WH: The Codon Adaptation Index - a measure of directionalsynonymous codon usage bias, and its potential applications. NucleicAcids Res 1987, 15:1281-1295.
47. CBRG, Oxford University. [http://www.molbiol.ox.ac.uk/CBRG_home.shtml].48. The Phaeodactylum tricornutum Digital GeneExpression Database..
[http://www.diatomics.biologie.ens.fr/EST3/].49. Horan K, Jang C, Bailey-Serres J, Mittler R, Shelton C, Harper JF, Zhu JK,
Cushman JC, Gollery M, Girke T: Annotating genes of known andunknown function by large-scale coexpression analysis. Plant Physiol2008, 147:41-57.
50. Ianora A, Miralto A, Poulet SA, Carotenuto Y, Buttino I, Romano G, Casotti R,Pohnert G, Wichard T, Colucci-D’Amato L, Terrazzano G, Smetacek V:Aldehyde suppression of copepod recruitment in blooms of aubiquitous planktonic diatom. Nature 2004, 429:403-407.
Maheswari et al. Genome Biology 2010, 11:R85http://genomebiology.com/2010/11/8/R85
Page 18 of 19

51. Behrenfeld MJ, Bale AJ, Kolber ZS, Aiken J, Falkowski PG: Confirmation ofiron limitation of phytoplankton photosynthesis in the equatorial PacificOcean. Nature 1996, 383:508-511.
52. Tsuda A, Takeda S, Saito H, Nishioka J, Nojiri Y, Kudo I, Kiyosawa H,Shiomoto A, Imai K, Ono T, Shimamoto A, Tsumune D, Yoshimura T,Aono T, Hinuma A, Kinugasa M, Suzuki K, Sohrin Y, Noiri Y, Tani H,Deguchi Y, Tsurushima N, Ogawa H, Fukami K, Kuma K, Saino T: Amesoscale iron enrichment in the western Subarctic Pacific induces alarge centric diatom bloom. Science 2003, 300:958-961.
53. Walne PL: The effects of colchicine on cellular organization inChlamydomonas. I. Light microscopy and cytochemistry. Am J Bot 1966,53:908-916.
54. Vartanian M, Descles J, Quinet M, Douady S, Lopez PJ: Plasticity androbustness of pattern formation in the model diatom Phaeodactylumtricornutum. New Phytol 2009, 182:429-442.
55. Documentation for Phrap and cross_match.. [http://bozeman.mbt.washington.edu/phredphrap/phrap.html].
56. JGI Genome Portal. [http://genome.jgi-psf.org/phatr2/phatr2home.html].57. Altschul SF, Madden TL, Schaffer AA, Zhang JH, Zhang Z, Miller W,
Lipman DJ: Gapped BLAST and PSI-BLAST: a new generation of proteindatabase search programs. Nucleic Acids Res 1997, 25:3389-3402.
58. Analytic Rarefaction 1.3. [http://www.uga.edu/strata/software].59. The R Project for Statistical Computing.. [http://www.R-project.org].60. Harris MA, Clark J, Ireland A, Lomax J, Ashburner M, Foulger R, Eilbeck K,
Lewis S, Marshall B, Mungall C, Richter J, Rubin GM, Blake JA, Bult C,Dolan M, Drabkin H, Eppig JT, Hill DP, Ni L, Ringwald M, Balakrishnan R,Cherry JM, Christie KR, Costanzo MC, Dwight SS, Engel S, Fisk DG,Hirschman JE, Hong EL, Nash RS, et al: The Gene Ontology (GO) databaseand informatics resource. Nucleic Acids Res 2004, 32:D258-D261.
61. Altschul S, Madden T, Schaffer A, Zhang JH, Zhang Z, Miller W, Lipman D:Gapped BLAST and PSI-BLAST: A new generation of protein databasesearch programs. Nucleic Acids Res 1997, 25:3389-3402.
62. Marchler-Bauer A, Anderson JB, Cherukuri PF, DeWweese-Scott C, Geer LY,Gwadz M, He SQ, Hurwitz DI, Jackson JD, Ke ZX, Lanczycki CJ, Liebert CA,Liu CL, Lu F, Marchler GH, Mullokandov M, Shoemaker BA, Simonyan V,Song JS, Thiessen PA, Yamashita RA, Yin JJ, Zhang DC, Bryant SH: CDD: aconserved domain database for protein classification. Nucleic Acids Res2005, 33:D192-D196.
63. Peers G, Price NM: Copper-containing plastocyanin used for electrontransport by an oceanic diatom. Nature 2006, 441:341-344.
doi:10.1186/gb-2010-11-8-r85Cite this article as: Maheswari et al.: Digital expression profiling of noveldiatom transcripts provides insight into their biological functions.Genome Biology 2010 11:R85.
Submit your next manuscript to BioMed Centraland take full advantage of:
• Convenient online submission
• Thorough peer review
• No space constraints or color figure charges
• Immediate publication on acceptance
• Inclusion in PubMed, CAS, Scopus and Google Scholar
• Research which is freely available for redistribution
Submit your manuscript at www.biomedcentral.com/submit
Maheswari et al. Genome Biology 2010, 11:R85http://genomebiology.com/2010/11/8/R85
Page 19 of 19