research openaccess … remainder of the paper is organized as follows. in ... vista is based on...
TRANSCRIPT

Jabbar et al. EURASIP Journal on Image and Video Processing 2014, 2014:32http://jivp.eurasipjournals.com/content/2014/1/32
RESEARCH Open Access
VISTA: achieving cumulative VIsion throughenergy efficient Silhouette recognition ofmobile Targets through collAboration of visualsensor nodesSana Jabbar1*, Ali Hammad Akbar1, Saima Zafar2, Muhammad Mubashir Quddoos2 and Majid Hussain3
Abstract
Visual sensor networks (VSNs) are innovative networks founded on a broad range of areas such as networking,imaging, and database systems. These networks demand well-defined architectures in terms of sensor nodes andcamera deployment, image capturing and processing, and well-organized distributed systems. This makes existingVSN architectures deficient because these are limited in approach and in design. In this paper, we propose VISTA, adistributed vision multi-layer architecture aimed at constructing the cumulative vision of mobile objects (MOs). VISTArealizes silhouette recognition of mobile targets through (a) pre-meditated deployment of sensor nodes (SNs) that areequipped with sonar sensors and fixed view (FV) on-board cameras present at the periphery of region of interest (RoI)and SNs with only on-board cameras within RoI, (b) pre-distribution of silhouettes of known objects across SNs, (c)sonar-based presence detection of MO at the outskirts of RoI, (d) MO silhouette capturing and matching at interiornode to determine the % age match, (e) subsequent activation of next interior cameras in order to improve % agematch, and (f) terminating further activation upon threshold recognition of MO. Experimental evaluation of our imageprocessing algorithms against baseline algorithms with respect to execution time and memory shows significantreduction in image data and memory occupancy. Also, experiments show that true match is achieved fully underbroad daylight conditions and large backgrounds when our proposed background subtraction and pixel reductiontechniques are used. The mobility-driven behavior of associated network layer algorithms of VISTA is simulated in anetwork simulator (NS2) by representing the surety of MO identification as a function of number of cameras, databasesize and distribution, MO’s trajectory, stored perspectives, and network depth. The simulation results show thatdoubling and, in some situations, manifold increase is observed in the surety of the target with an increase in thenumber of silhouettes deployed against the baselined database size and mobility model. The results substantiate thatVISTA is a suitable architecture for low-cost, autonomous and efficient human and asset monitoring surveillance,friend-or-foe (FoF) identification, and target tracking systems.
1 IntroductionVisual sensor networks (VSN) forms the crossroads ofnetworking, image capturing, processing and renderingtechniques, and distributed systems. These innovativenetworks are emerging as an important research chal-lenge and gaining notice of both research community and
*Correspondence: [email protected] Institute of Computer Science, University of Engineering andTechnology (UET), Lahore 54890, PakistanFull list of author information is available at the end of the article
applications developers. The contemporary VSN architec-tures are limited in approach and in design. For instance,none of these architectures takes into account civil infras-tructure and geographical information in the placementand simultaneous activation of sensors or cameras orboth. Likewise existing VSN architectures focus on cap-turing images in entirety, which tends to be redundantand at times even detrimental to user application require-ments. Also, these schemes tend to overlook the con-strained ambulatory behavior of mobile objects (MOs)such as varying mobility behavior in the interior and at
© 2014 Jabbar et al.; licensee Springer. This is an Open Access article distributed under the terms of the Creative CommonsAttribution License (http://creativecommons.org/licenses/by/2.0), which permits unrestricted use, distribution, and reproductionin any medium, provided the original work is properly cited.

Jabbar et al. EURASIP Journal on Image and Video Processing 2014, 2014:32 Page 2 of 24http://jivp.eurasipjournals.com/content/2014/1/32
the exterior of region of interest (RoI). Furthermore, thesearchitectures do not reflect on features and attributesof captured images as means for defining the cam-era activation schedule and coordination between sen-sor nodes (SNs). Finally, hardware choices for VSNs areeither limited to cameras mounted onto mobile assem-blies or cameras using pan-tilt-zoom (PTZ) assemblies,both involvingmechanical motion. All in all, existing workmakes strong assumptions about the presence and avail-ability of video-customized hardware and codecs, band-widths of the orders of megabit per second (Mbps), andmains power supply or unconstrained battery sources, alldefining VSN design in concordance. In this research,we adopt contra-concordance by redefining and restrict-ing VSN features to meet the limited capabilities ofreal wireless sensor networks (WSNs), which have lim-ited form factors in computation and memory and areequipped with wireless transceivers. We propose VISTA,an architecture that involves redefining the video cap-turing capability of VSNs. The hardware for VISTA isdeployed considering the civil infrastructure of RoI tobe monitored. VISTA proposes a deployment scheme inwhich SNs are placed at optimal positions in order tomake communication effective. Camera at the next hopSN is activated when MO comes in its range, such thatredundant image is avoided. Only the SNs at the boundaryof the RoI are activated to avoid unnecessary consumptionof energy of interior SNs in the network.This research includes the following:
1. Comprehensive layered architecture for achievingcumulative vision.
2. Elaboration of the role played by each layer in orderto accomplish the goal which includes hardware role,image processing details, and final taskaccomplishment.
3. Description of operations concerning the edge nodes(ENs) and the inner nodes (INs).
4. Simulations in NS2 in order to validate our assertionregarding the goals achieved by the proposedarchitecture.
The remainder of the paper is organized as follows. InSection 2, related work is discussed. Section 3 presentsthe VISTA architecture in detail. Section 4 presents theexperimental results based on NS2 simulations. Section 5presents the discussion on the operation and performanceof VISTA.
2 Literature reviewThe challenges in the effective realization of VSNs is acontemporary research problem. Research is being car-ried out in diverse directions of VSNs that include cam-era calibration, image processing algorithms, hardware
architecture, communication protocols, and applications.The research work that we explored covers multipledomains of VSNs. The objective of this research is to real-ize energy efficient solution for VSNs in terms of compu-tation and communication recovering the shortcomingsof previous efforts in this direction. Literature review ofVISTA is based on three domains that are mentionedbelow.Chen et al. [1] focus on capturing images from SNs and
reducing these images to object of interest (OoI) throughmobile agents in VSN. In this way, volume of image dataat each SN in target region is reduced. Though a degreeof compression is achieved through segmentation, andtransmission of OoI only, whole process remains an imageprocessing and transmission scheme. Compression simplyreduces the image size to be transmitted. However, imagetransmission is impractical for long-lived VSNs becauseVSNs once deployed are sporadically used over very longtimes. Nelson and Khosla [2] describe a number of cri-teria that assist in improving visual resolution of a MO.These criteria are used to control the focus and motionof single or multiple cameras. They address camera reso-lution by suggesting that cameras can actually be moved.Since in WSNs, energy per SN is very limited; there-fore, this idea is impractical for VSNs. In [3], Navarro-Serment et al. present their work that is related to theinspection of moving targets in RoI by activating multiplecameras which distributes the collective tasks of identifi-cation and prevent energy consumption on a single robot.They address the problems of scheduling and maneuver-ing cameras to observe targets based on their presentpositions. Likewise Capezio et al. [4] develop Cyber Scout,an autonomous surveillance and investigation system todetect and track OoI. They use a network of all-terrainvehicles and focus on vision for inspection, autonomousnavigation, and dynamic path planning. In [5], a motionsegmentation algorithm is proposed for extracting fore-ground objects with a PTZ camera. Image mosaicingtechnique is used to build a planar background. The objectis detected by comparing current camera image with thecorresponding background indexed from the mosaic. In[6], a novel method is proposed by Saptharishi et al.for temporally and spatially moving objects by automat-ically learning the relevance of the object’s appearancefeatures to the task of discrimination. This method isproposed for distributed surveillance systems. Ukita andMatsuyama [7] perform multi-target tracking by activevision agents (AVAs) that is a network-connected com-puter with an active fixed-view pan-tilt-zoom (FV-PTZ)camera. Multiple FV-PTZ active cameras are requiredfor detailed measurements of 3D objects. However, theiridea for surveillance and tracking is not implementablein VSNs due to maneuvering cameras. Similarly in [8],Matsuyama gives the overview of cooperative distributed

Jabbar et al. EURASIP Journal on Image and Video Processing 2014, 2014:32 Page 3 of 24http://jivp.eurasipjournals.com/content/2014/1/32
vision (CDV). The goal of CDV is to embed network-connected mobile robots with active cameras in a realworld and realize wide-area dynamic scene understand-ing and visualization. However, all of the above ideasfor surveillance and tracking are not implementable inVSNs due to maneuvering cameras and significant powerconsumption of devices.For image recognition, Tien et al. [9] propose a
novel method based on non-uniform rational B-splines(NURBS) and cross-ratios. They propose a method thatutilizes both memory and computation time, but theresources required are less as compared to those of thecurve matching method. They use a small database tosave memory. But matching by using the NURBS curvesfirst and then applying cross-ratios is still expensive interms of time and computation for a VSN system. InVISTA, a rich database is proposed, i.e., more aspects ofan object deployed in the nodes but avoiding computa-tionally expensive algorithm for matching.In [10], Soro and Heinzelman take into account the
unique characteristics and constraints of VSN that dif-ferentiate VSNs from other multimedia networks as wellas traditional WSNs. They outline all areas of VSNs suchas applications, signal processing algorithms, communi-cation protocols, sensor management, hardware architec-tures, middleware support, and open research problemsin VSNs by exploring several relevant research directions.They argue that traditionalWSN protocols do not providesufficient support in VSNs. Hence, there is a need to pro-pose new communication protocols and vision algorithmssuitable for resource-limited VSN systems.Background subtraction is an important step in image
matching using low-power devices. In [11] Stauffer andGrimson present a background subtractionmethod whichinvolves thresholding the error between an estimate of theimage lacking moving objects and the current image. Thebackground model used in this work models each pixelas a mixture of Gaussians with an on-line approximationused for updating the model. The Gaussian distributionsof this mixture model are evaluated to classify pixelswhich most likely fall in the background process. Sincein reality, multiple surfaces show in the view frustum ofa pixel along with changes in lighting conditions; there-fore, multiple adaptive Gaussians are required. A mixtureof adaptive Gaussians is used in this approximation suchthat as the parameters of the Gaussians are updated, theGaussians are estimated based on a simple heuristic tofind out those which are part of the ‘background process’.In [12], the mixture of Gaussians (MoG) concept has beenused in a number of sensor network problems. A relatedwork in this context is by Ihler et al. [12]. Their workaddresses the problem of automatic self-localization ofsensor nodes. The authors redefine the sensor localizationproblem within a graphical model framework and present
the use of a recent generalization of particle filtering forapproximation of sensor locations. In this technique, eachmessage is depicted using either a sample-based densityestimate (as a mixture of Gaussians) or as an analytic func-tion. The messages along observed edges are representedby samples and the messages along unobserved edgesare described as analytic functions. First, the samplesare drawn from the estimated marginal and then thesesamples are used to approximate each outgoing message.Another paper which employs mixture of Gaussian distri-butions in sensor networks is by Rabbat and Nowak [13].They address the problem of in-network data aggregationin sensor networks which comprise sensor nodes capableof sending sensed data to a base station. Normally, it isrequired to derive an estimate of a parameter or functionfrom the collected data which is huge and redundant. Thispaper investigates the distributed algorithms for data pro-cessing prior to its transmission to a central point whichresults in reducing the amount of energy spent in obtain-ing accurate estimate. This estimation problem is definedas the incremental optimization of a cost function con-cerning collected data from all nodes such that each nodeadjusts the estimate based on its local data and transmits itto the next node. In distributed expectation-maximization(DEM) algorithm, the measurements are modeled assamples extracted from a mixture of Gaussian distribu-tions with unknown means and covariances, the mixtureweights being different at each sensor in the network. Ini-tially, the parameters of the global density are estimated,which are passed through the network such that eachsensor node detects the component of the density whichbest fits its local data. Cho et al. [14] present a smartvideo surveillance system by deploying visual sensor net-work. It comprises of an inference framework in whichautonomous scene analysis is carried out using distributedand collaborative processing among camera nodes and aneffective occupancy reasoning algorithm. For each node inthe network, they define a potential function representinghow the global inference is coherent with the local mea-surement on that node. Next, a multi-tier architecture isbuilt and one node in each cluster is chosen as an anchor-age node for global inferences. The amount of overlappingbetween two nodes is used as a basis when construct-ing a work tree for distributed processing within a cluster.The existence probabilities for each camera are predictedusing the binary images from the background subtrac-tion. A modified mixture of Gaussian (MOG) algorithmis used. In [15], Tsai and Lin deal with contextual redun-dancy linked with background and foreground objects in ascene. They propose a scene analysis technique that clas-sifies macroblocks based on contextual redundancy. Onlyspecific context of macroblock is analyzed for motionwhich involves salient motion through an object-basedcoding architecture. The context of a scene is defined as

Jabbar et al. EURASIP Journal on Image and Video Processing 2014, 2014:32 Page 4 of 24http://jivp.eurasipjournals.com/content/2014/1/32
the association of a pixel in a scene with static or movingbackground or moving foreground with/without illumi-nation change based on the observation on a number ofrecent frames. The context of a macroblock is modeledby an estimated background image. In the scene analy-sis method, most representative Gaussian is selected frommixture of Gaussians. In [16], Ellis presents a multi-viewvideo surveillance system with algorithms for detectingand tracking moving objects. The scene-dependent infor-mation is depicted by creating models of the scene basedon observations obtained from the camera network. Inorder to cater for the background changes, the proba-bility of detecting a pixel value is modeled by a mixtureof Gaussians based on color and monochrome pixel val-ues. In [17], Paletta et al. present a video surveillancesystem for monitoring passenger flows at public trans-portation junctions based on a network of video cameras.In background modeling and motion detection module,they employ an adaptive model for background estima-tion applying mixture of Gaussians and appearance pat-terns, thereby presenting a stable and robust backgroundmodel.Kumar [18] demonstrates the importance of various
features in image matching. A framework is proposedconsisting of hardware cameras and accompanying soft-ware. The software manages processing of image andsatisfies queries from other cameras over the network orby the camera itself. The software logic is implementedover the publisher-subscriber model. To satisfy queries,different handlers are registered to publisher-subscriberblock. It is asserted that scale invariant feature trans-form (SIFT) features do not work well when there is largeorientation change and low resolution. It is also shownthat SIFT features do not work efficiently across cam-eras that are far in terms of time or location. Therefore,it is always efficient to use more than one identifica-tion feature in different scenarios. In [19], Margi et al.study Meerkats project and observe the trade-off betweenpower efficiency and performance and realize verifica-tions through a test-bed based on the Crossbow Stargateplatform. They observe energy consumption of activi-ties such as processing, image acquisition, flash mem-ory access, and communication over the network. Theyalso report steady-state and transient energy consumptionbehaviors. They prove that transients are not at all neg-ligible, neither in terms of power nor in terms of delayincurred. They conclude that delay and energy measure-ments are very important for performance, and transientsplay a significant role in terms of delay and energy. In[20], Margi et al. present power consumption analysis andexecution time for the elementary tasks such as sensing,processing, and communication. These tasks composeduty cycle of a VSN node based on Crossbow Stargateboard. They also predict the life time of a VSN system
by considering energy consumption characterization anddraw attention to the fact that activation/deactivation ofthe hardware and transition between different states of aSN requires non-negligible amount of time and energy.They illustrate that SN performs the same functionalitybut with different energy requirements, depending uponthe SN’s current state. They also prove that on-boarddetection always plays a significant role in energy savingeven if the rate of event detection is high. To determineevent detection, SN requires blob detector which fur-ther decides whether image should be transmitted or not.However, blob detection is a power-consuming processthat must be run in either case. Even in the case of eventdetection, image is compressed by the node and sent tosink or any other node. Image compression saves energy,but when blob detector detects larger blobs in acquir-ing image, it takes sufficient amount of energy to sendthat image. Image compression only reduces the size ofthe image, and small blobs require high energy and longtime for transfer. In order to overcome the abovemen-tioned problems, we introduce a novel idea in VISTA,where we identify MO on a node and only send the infor-mation about MO without sending image data. Qureshiand Terzopoulos [21-24] present work related to smartcamera networks which consists of static and active cam-eras that provide coverage of environment with minimalreliance on human operator. They propose a distributedstrategy in which nodes are capable of local decision mak-ing and inter-node communication. Each camera nodehas an autonomous agent to communicate with nearbynodes. When the node is in idle state, the camera doesnot perform any task. Upon receiving message, node cal-culates its relevance to the task by employing low-levelvisual routines (LVR). Supervisor node decides whetheror not to include node in the group by observing its rel-evance value. A visual routine occurs every time when anode receives the message. This means that every time,the node bears the burden of running LVR and calcu-lates its relevance to the task. Contrary to this, in ourapproach, we invoke only that node which can participateefficiently in identifying MO. An overview of VSNs alongwith research challenges in this area is given in [25]. Theneed for tight coupling between communication protocolsand vision techniques for effective object monitoring andtracking is also highlighted. Many surveys about VSNs arepublished in the past in whichVSN characteristics, its cor-responding layers, and open research issues are discussedin detail. An extensive survey of wireless multimedia sen-sor networks is provided in [26], where Akyildiz et al.discuss various open research problems in multimediaresearch area, including networking architectures, layers,and protocols. Similarly in [10], the authors overview thecurrent state-of-the-art in the field of visual sensor net-works, by exploring several relevant research directions.

Jabbar et al. EURASIP Journal on Image and Video Processing 2014, 2014:32 Page 5 of 24http://jivp.eurasipjournals.com/content/2014/1/32
All these authors agree about the fact that previous archi-tectures cannot fulfill the need of this new smart visualsensor network era. They suggest that development ofsome new energy-efficient architectures for sending visualinformation is the need of the day.In paper [27], the authors highlighted the major wire-
less visual sensor network approaches for energy effi-ciency. They analyze the already proposed strategies inthis domain. They suggested that enhancement shouldbe done in LANMAR [28] and in G-AODV [29] toincrease the energy efficiency of VSNs in future. Theyalso suggested that due to the different elements thatenter into the design of visual sensor networks, mul-tidisciplinary research is essentially needed to designfuture VSN that provide an effective trade-off betweenthe energy associated with the VSN and the QoS receivedby the end user. Paper [30] focuses on the functional-ity of VSNs as intelligent systems capable of operatingautonomously and in a wide range of scenarios. Theauthors feel the need of extensive research regarding theplacement of these nodes, coverage of blind areas andhow to localize and calibrate camera nodes within thenetwork.To overcome the above mentioned energy consumption
and architectural problems, a novel architecture ‘VISTA’is proposed through which SNs energy can be saved bypre-planned database and camera scheduling.
3 VISTA architectureThis chapter elaborates the VISTA design that compriseslayered architecture. First, the assumptions are formu-lated and then we discuss details of layers and modulesthat comprise this architecture.
3.1 VISTA assumptionsThe following assumptions are taken for VISTA:
• All nodes in VISTA are deployed in a pre-engineeredtopology.• At the time of network initialization, there is no mobileobject inside RoI. Even if there is an already present MO,it is not the scope of VISTA to track it.• On ENs, sonars are mounted along with cameras.• INs are equipped with cameras only.• Each SN location is pre-programmed in RoI.• All SNs have same computational resources and mem-ory.• ENs exhibit three different states of activation withrespect to (w.r.t.) to sonar, timer, camera, and transceiveras shown in Table 1.• Similarly, INs exhibits two different states of activationw.r.t. timer, camera, and transceiver as shown in Table 2.• Field Of view (FOV) of edge nodes’ sonars and camerasis calibrated to be exactly the same respectively.
Table 1 States exhibitedby ENs
State Sonar Timer Camera Transceiver
Active 1 1 1 1
Quasi sleep 1 0 0 0
Sleep 0 0 0 0
3.2 VISTA network modelVISTA sensor node functionality and their operationfor mobile object recognition can be thoroughly illus-trated by deploying specific mobility models. Freeway andManhattan [31] are the most suitable mobility models forVISTA sensor nodes because the mobility of the target inthe RoI is constrained on road segments only. We takeManhattan mobility model as an example to demonstratethe VISTA SN behavior for mobile object recognition inregion of interest. VISTA assumes two types of SNs calledENs and INs. Edge nodes cover the region of interestboundary both through sonars and cameras that detectand recognize any enteringMO, while INs only have cam-eras for recognizing it. We propose two edge nodes’ layersthat cover RoI border for reliability and for energy effi-cient MO detection. The operation of two layers of ENsis realized by forming a triplet in which two edge nodesare in foreground and one edge node in the background.The operation of triplet is explained in Section 3.3.2.In this section, we propose considerations for cameradeployment at both types of sensor nodes.
3.2.1 Considerations for camera deployment of ENsCase 1: number of cameras at outer EN layers. In order tosecure the entire perimeter, each side of length ‘L1’ canbe covered by n1 ENs of width ‘W1’ of FOV such thatL1/W1 = n1.
Case 2: number of cameras at inner EN layers. In order tosecure the entire perimeter, each side of length ‘L2’ canbe covered by n2 ENs of width ‘W2’ of FOV such thatL2/W2 = n2, where n2 = n1 − 1 such thatW2 = 2W1.
3.2.2 Considerations for camera deployment of INsINs are deployed in such a way that all aspects of a MOimage could be captured by their cameras. Two types ofINs are deployed for Manhattan models; their cameraconsiderations are given below.
Table 2 States exhibitedby INs
State Timer Camera Transceiver
Active 1 1 1
Demi-sleep 0 0 1

Jabbar et al. EURASIP Journal on Image and Video Processing 2014, 2014:32 Page 6 of 24http://jivp.eurasipjournals.com/content/2014/1/32
Case 1: number of IN cameras for covering straight roadsegments. IN cameras with their FOVs are deployed insuch a manner that each camera covers ‘n’ horizontalroad segments or ‘m’ vertical road segments in RoI, where‘n’ or ‘m’ depends on the total number of rows andcolumns of RoI. For example, IN_3 covers three horizontalroad segments such as RS_H1, RS_H2, and RS_H3, whileIN_7 covers three vertical road segments such as RS_V1,RS_V2, and RS_V3 as shown in Figure 1. The total num-ber of INs required to cover all the horizontal and verticalroad segments is given below:
Total number of INs required = (r − 1) + (c− 1), (1)
where r = total rows of RoI, and c = total columns of RoI.
Case 2: number of IN cameras for covering Carrefour. INcameras with their FOVs are deployed in such a mannerthat each camera covers a single Carrefour in RoI asshown in Figure 1. Thus, the total number of CarrefourINs required is given below:
Total Carrefour INs required = (r − 2).(c − 2), (2)
where r = total rows of RoI, and c = total columns of RoI.This camera deployment also affects the database at eachSN that will be discussed in the database section.
3.3 VISTA-layered tenonmortise architectureThe proposed VISTA-layered tenon mortise architectureconsists of three layers as shown in Figure 2. The modulesin these layers work collaboratively in order to accomplishsilhouette-based recognition and tracking of MO.The hardware specifications are defined at the physi-
cal layer. Physical layer provides hardware entities to thenetwork and processing layers. Sonar and timer give theinput signals to the network layer, while camera givesinput image frame to the image processing (IP) mod-ule that is the part of processing layer. The networklayer that is above the physical layer implements timerand sonar modules. The network layer can also be exe-cuted by the IP module and routing decision module tosend and receive the packetized messages. The processinglayer is at the top level incorporating basic functionalitiesfor detection-, recognition-, and perspective-based MOtracking. Database management module also resides atthis layer.
Figure 1 VISTA camera deployment.

Jabbar et al. EURASIP Journal on Image and Video Processing 2014, 2014:32 Page 7 of 24http://jivp.eurasipjournals.com/content/2014/1/32
Figure 2 VISTA-layered tenonmortise architecture.
3.3.1 Physical layerThe physical layer comprises hardware devices such assonar, timer, camera, and transceiver.
• Sonar is used for proximity detection of MOs. Firstly,sonar detects the arrival of MO in RoI and then camerasare switched ON to further analyze it.• Timers are used to provide time information of MOdetection event in the RoI, MO image capturing activity atSNs and to activate other SNs in the network in time.• Camera is activated only to capture an incumbent MOand then it is turned off immediately to conserve energy.The captured image is used to recognize the MO byapplying different image processing algorithms.• Transceiver is used to send and receive packetized mes-sages. Typical examples could include ZigBee- and Wi-Fi(802.15.4)-based transceivers.
3.3.2 Network layerThis layer is concerned with sonar-sleeping, sonar-sensing, and time synchronization modules that are dis-cussed below:
Sonar-sleeping module We propose two EN layers toensure the presence of any MO in RoI because if oneedge node layer fails to detect the presence of any MO
in region of interest due to any technical failure, then itwould never be detected by VISTA again because VISTAassumes sonars only at edge nodes. Figure 3a shows twoedge node layers, i.e., the outer edge node layer and theinner edge node layer, in which the outer layer edgenodes are called foreground edge nodes, while the innerlayer edge nodes are called background edge nodes. Thearrangement of edge nodes in these two layers formsa federation such that one background edge node liesbetween two foreground edge nodes, which is present inthe form of a triplet, as shown in Figure 3b. The entireperimeter is covered through such triplets. In a triplet, abackground EN has the coverage equivalent to the sumof the coverage of both foregrounds edge nodes since itsFOV width is equal to the sum of the FOV widths of bothedge nodes. The main purpose forming triplets is failureresilience.
Power consumption of outer EN layer = (n + 1) × P= n × P + P≈ n × P, (3)
where P is the power consumed by a single EN. Whenthe inner EN distance is doubled (to that of outer ENs),the power consumption increases fourfold. So,
Figure 3 The arrangement of two edge node layers. (a) Two EN layers. (b) EN arrangement at the layers.

Jabbar et al. EURASIP Journal on Image and Video Processing 2014, 2014:32 Page 8 of 24http://jivp.eurasipjournals.com/content/2014/1/32
Power consumption of inner EN layer = (n/2) × 4P≈ 2 × n × P
(4)
Average power of two layers = n × P + 2 × n × P/2= 1.5 × n × P. (5)
So, our proposed two layers use power = 1.5 × n × P.The power consumption difference between triplet for-
mation and one-layer deployment is 0.5 × n × P. Thetriplet formation bears an overall power tax of 0.5×n×P.However, such added power tax gives us complete borderbreach avoidance [32] system even if 50% of the networknodes fail as described in the Table 3 below. The twoneighboring triplets support the failing triplet. To providesuch triplet coverage, we propose the deployment distancefor all the background ENs in the form of equations.Since
L = dθ , (6)
so,
LA = dAθA (7)
L1 = d1θ1 (8)
L2 = d2θ2. (9)
Since we want to keep LA = 2L1, so the deploymentdistance should be dA = 2d1. Similarly, dA = 2d2, suchthat when an inner EN is ON, its coverage is equal to thecoverage of two outer ENs. The power consumption atedge nodes can be reduced by altering the sleeping sched-ule between the foreground and background edge nodesof the triplet, thus achieving overall network longevity.If any foreground edge node in a triplet fails, then thebackground edge node can be invoked instead. Similarly,the foreground edge nodes in a triplet can be invokedin case of background edge node failure. Edge nodes’layers exchange their sleeping schedules through SMAC
Table 3 An example of a three-supporting triplet
Malfunction triplet Failing nodes Alternative(malfunction/battery outage) working nodes
Triplet 1: ‘1’, ‘2’, ‘A’ If ‘1’ and ‘2’ fail ‘A’ works
Triplet 2: ‘2’, ‘3’, ‘B’ If ‘2’ and ‘3’ fail ‘B’ works
Triplet 3: ‘3’, ‘4’, ‘C’ If ‘3’ and ‘4’ fail ‘C’ works
Triplet 1: ‘1’, ‘2’, ‘A’ If ‘A’ fails ‘1’ and ‘2’ work
Triplet 2: ‘2’, ‘3’, ‘B’ If ‘B’ fails ‘2’ and ‘3’ work
Triplet 3: ‘3’, ‘4’, ‘C’ If ‘C’ fails ‘3’ and ‘4’ work
Triplet 2: ‘2’, ‘3’, ‘B’ If ‘2’,‘3’, and ‘B’ fail ‘A’ and ‘C’ work
protocol [33], in which the background edge nodes areconsidered as a synchronizer, while the foreground edgenodes are as followers in triplets.
Sonar-sensing module MO entrance in RoI is detectedby this module upon receiving MO detection signal fromsonar. At the time of deployment, distance-based fin-gerprinting of reflected received signal strength indica-tor (RSSI) is performed and stored as RSSITHRESHOLDin each edge node. Edge node periodically sends outbeacon, looking for possible mobile object presence atthe boundary of RoI. An EN only reacts to a detectedmobile object, only if the measured RSSI is greater thanRSSITHRESHOLD. When a sonar signal is received by theouter EN layer, then the foreground duo edge nodes in atriplet communicate with each other to decide the appro-priate edge node for initiating mobile object detectionactivity. This decision is taken by seeing the measuredRSSI strength at both edge nodes in such duo. If mobileobject detection signal is received by inner edge nodelayer, then the background EN in triplet would proceedwith the recognition of mobile object. We proposed thatthree readings from sonar are analyzed to be assuredabout the MO presence and assess its trajectory acrossRoI. By assessing the mobile object movement, only adecision should be taken about the camera activation atthe boundary. All the possible trajectories as assessedby the three readings are shown in Table 4. Networklongevity is also achieved by avoiding unnecessary cam-era activation in the network by accessing mobile objectmovement across RoI. For example, if a mobile objectcomes closer to sonar and then moves away, no camerasare activated for mobile object recognition. This moduleis also responsible for generating mobile object detected(MOD) message to activate next most optimal hop SNafter detecting mobile object presence in RoI.
Time synchronization module The information aboutmobile object image is meaningless without the timeinformation at which the image is captured [10] becausemobile object might have moved away from the locatedposition when this information reaches the sink. Suchtime information should be accurate to subsequentlytransmit mobile object information and to activate otherSNs in the network in time. To give accurate time infor-mation, timers are synchronized through time synchro-nization module upon receiving mobile object detectionsignal from sonar. We propose camera-activation delayavoidance time synchronization (CADETS) scheme tosynchronize timers’ clocks of SNs. Our proposed schemefor SN timers’ synchronization is tailored to the uniquesequence of camera activation and image processing.When the presence of any mobile object is detected by
ENs, time synchronization activity starts in the relevant

Jabbar et al. EURASIP Journal on Image and Video Processing 2014, 2014:32 Page 9 of 24http://jivp.eurasipjournals.com/content/2014/1/32
Table 4 MOmovement and VISTA SN behavior
Sonar reading MOmovement VISTA SN behavior
r1 = r2 = r3 = 0 MO not present No MO recognition done at SN
r1 = r2 > r3 MO present but moving away No MO recognition done at SN
r1 > r2 > r3 MO present but moving away No MO recognition done at SN
r1 < r2 > r3 Come close and moving away No MO recognition done at SN
r1 = r2 = r3 MO stands still MO recognition done only at that SN
r1 < r2 = r3 Come close and stop MO recognition done only at that SN
r1 > r2 < r3 Come close and went away and come close MO recognition done only at that SN
r1 < r2 < r3 Moving towards and enter in RoI MO recognition done over the entire network
r1 = r2 < r3 Moving towards MO recognition done over the entire network
part of RoI through the CADETS scheme. Time synchro-nization is carried out by ENs, sending beacons to sub-sequent INs to update time information. Inner nodes usethis time information as a point of reference for synchro-nizing their clocks. In turn, the inner nodes synchronizeother inner nodes in their transmission ranges. Time syn-chronization is performed as a moving localized activitysuch that the inner nodes are well synchronized beforeimage processing module passes messages among SNs asshown in Figure 4. In the figure, first, the beacon givesthe time synchronization information before the secondpacket carrying MO information is transmitted.
3.3.3 Processing layerThe logical and algorithmic execution of VISTA is partof the processing layer through which it deals with objectidentification and tracking. This layer constitutes the fol-lowing modules: database management module, imageprocessing module, and routing decision module. In thefollowing subsections, the role of each of the abovemen-tioned modules is elaborated in realizing the objective ofVISTA.
Databasemanagementmodule Our database is deployedin a distributed manner over the entire network, keepingin view the regional aspects, application constraints, andrequirements to correctly recognize and track the MO.Database organization
Figure 4 Time synchronization through the CADETS scheme.
• A database table is maintained by each SN to storethe neighbor SNs’ positions and their cameraorientations in its memory. This database helps inperspective-based MO tracking by seeing its neighborSNs’ positions and camera orientations as shown inTable 5.
• Another database table is maintained for thesilhouettes of the expected objects with theirrespective identifiers (Ids), classes, silhouette aspectratios w.r.t. their segments, octets, views, angles, andsureties as shown in Table 6. Classes distribute storedsilhouettes into two categories: class 1 for vehiclesand class 2 for humans. Aspect ratios are calculatedfor each segment of a silhouette, while a silhouette issegmented by seeing the number of features in asilhouette. Silhouette segmentation criteria and theiraspect ratio calculation are discussed in the end ofthis section. Here, octet is an assigned code foridentified object in ASCII. View is the angle of MOwith respect to camera. Angle defines camera’s anglewith respect to the MO. Surety of each storedsilhouette is defined by the equation below:
Silhouette surety at observing SN
={0 if no silhouette is present out of K1/K × 100 otherwise
(10)
where K is the total number silhouettes of a singleobject with different aspects distributed overall thenetwork.
• The database also stores static background image forfurther use in image processing activities.
Table 5 SNs’ positions and camera orientations
SN _Id SN position SN camera orientation(cell, column/row) (direction)
IN_1 (11, I) (W)
IN_2 (1, II) (E)
IN_3 (12, III) (E)

Jabbar et al. EURASIP Journal on Image and Video Processing 2014, 2014:32 Page 10 of 24http://jivp.eurasipjournals.com/content/2014/1/32
Table 6 ExpectedMO silhouettewith specifics
Id Class Silhouette Aspect ratios w.r.t. segments Octet View Angle Surety (%)
Segments Aspect ratios
1 0 (vehicles) 3 (segment id, aspect ratio) Car Front 0 12.5
2 3 (segment id, aspect ratio) Bus Back 180 12.5
3 1 (human) 4 (segment id, aspect ratio) Human Front 90 25
Database deployment criteria
1. SNs’ positions and camera orientations table.
• Each SN stores neighbor SNs’ positions and theircamera orientations to track the MO in RoI. IN_4 istaken as an example from Figure 1 to show theneighbor SNs’ positions and their cameraorientations as shown in Table 7.
2. Deployment of Silhouette table. All possible aspectsof MOs’ silhouettes helpful for object identificationare distributed throughout the network withoutredundancy. Expected silhouette table that isdeployed on entire network depends on
• Type of SNs: Silhouette table stored at each SNdepends on its type. A simple IN stores only onesilhouette of a MO in silhouette table. In this case,only one expected silhouette against one MO isenough to recognize the MO. For example, IN_2silhouette table is shown in Table 8 where only onesilhouette is stored against one object. A CarrefourIN stores multiple aspects of silhouettes because aCarrefour IN’s camera can not only capture side,front, or back views but also tilted views of a MO.Table 9 shows the multiple aspects of MO silhouettesstored at Carrefour IN_C3.• Total RoI: When SNs are deployed at constantdistance in RoI, then stored silhouettes over the
Table 7 SNs’ positions and camera orientations of IN_4
SN _Id SN position SN camera orientation(cell, column/row) (direction)
IN_3 (12, III) (E)
IN_5 (15, V) (W)
IN_6 (10, VI) (E)
IN_7 (18, VII) (S)
IN_8 (19, VIII) (N)
IN_9 (7, IX) (W)
IN_10 (5, X) (S)
IN_11 (3, XI) (N)
entire network increases as the total RoI increases.When SNs are deployed at variable distances in RoI,then silhouettes stored over the entire networkdepends on the total number of SNs that aredeployed in RoI. Silhouette table that is deployed ona SN depends on the factors listed below.• Camera orientation: Silhouette table also considerscamera’s orientations at SN and stores only thosesilhouettes of MOs’ in the table that have a greaterprobability of matching with captured MOsilhouette. For example, IN_2’s camera has theprobability to capture the side views of MOs.Therefore, the side views of MO silhouette are storedin the database as shown in Table 8.• Type of MOs: Silhouette table increases in size ateach SN as the type of MO increases that can beentered in the RoI as shown in Table 8.• If MO adopts Gauss’s Markov mobility modelpatterns rather than the Manhattan model, then allaspects of MOs’ silhouettes should be stored insilhouette tables over the entire network in whichsome are shown in Table 10. In this case, suretydepends on the number of stored silhouettes againsta single object.
Silhouette segmentation and aspect ratio calculation.Silhouette segmentation and aspect ratio calculation is ana priori activity to store silhouettes of multiple objectsat each SN. These stored silhouettes are used for identi-fying run time extracted silhouette of a captured mobileobject. Silhouettes are segmented by seeing the total num-ber of prominent features. For example, the front view ofa human can be segmented into five parts, i.e., head, neck,shoulders, torso, and lower limbs as shown in Figure 5a.Figure 5a also shows the prominent features of a human’sside view, loaded view, and armed view, respectively. Sim-ilarly Figure 5b shows the features of a hatchback andsaloon car with different views.Aspect ratios can be calculated by taking the width-to-
height ratios of the segmented parts. When a human issegmented in five parts by seeing its prominent features,then aspect ratios of all five of these segmented parts arecalculated and stored in the database as shown in Figure 6.

Jabbar et al. EURASIP Journal on Image and Video Processing 2014, 2014:32 Page 11 of 24http://jivp.eurasipjournals.com/content/2014/1/32
Table 8 IN_2 silhouette database
Id Class Silhouette Aspect ratios w.r.t. segments Octet View Angle Surety (%)
Segments Aspect ratios
1 0 3 (segment id, aspect ratio) Bus Left side 90 12.5
2 3 (segment id, aspect ratio) Tank Left side 90 12.5
3 4 (segment id, aspect ratio) Car Right side 270 25
4 4 (segment id, aspect ratio) Jeep Right side 270 25
5 1 4 (segment id, aspect ratio) Human Left side 90 25
Table 9 IN_C3 silhouette database
Id Class Silhouette Aspect ratios w.r.t. segments Octet View Angle Surety (%)
Segments Aspect ratios
1 0 3 (segment id, aspect ratio) Car Front 0 12.5
2 3 (segment id, aspect ratio) Car Right side 270 12.5
3 3 (segment id, aspect ratio) Car Back 180 12.5
4 3 (segment id, aspect ratio) Bus Left side 90 12.5
5 2 (segment id, aspect ratio) Bus Back 180 12.5
6 3 (segment id, aspect ratio) Jeep Right side 270 12.5
7 3 (segment id, aspect ratio) Jeep Front 0 12.5
8 3 (segment id, aspect ratio) Car Tilt 315 12.5
9 3 (segment id, aspect ratio) Car Tilt 225 12.5
10 1 3 (segment id, aspect ratio) Human Left side 90 25
11 3 (segment id, aspect ratio) Human Front 0 25
Table 10 Different Aspects of silhouette store in database
Id Class Silhouette Aspect ratios w.r.t. segments Octet View Angle Surety
Segments Aspect ratios
1 0 4 (segment id, aspect ratio) Car Front/left 45
2 1 (segment id, aspect ratio) Car Left side/top 90
3 3 (segment id, aspect ratio) Jeep Left side/tilt 90 Depends on
stored silhouettes
4 3 (segment id, aspect ratio) Car Right side/back 225
5 3 (segment id, aspect ratio) Car Right side/tilt 270

Jabbar et al. EURASIP Journal on Image and Video Processing 2014, 2014:32 Page 12 of 24http://jivp.eurasipjournals.com/content/2014/1/32
Figure 5 Human and car silhouettes segmentation by seeing the prominent features.
Figure 6 Aspect ratio calculation of a human silhouette.

Jabbar et al. EURASIP Journal on Image and Video Processing 2014, 2014:32 Page 13 of 24http://jivp.eurasipjournals.com/content/2014/1/32
Image processing module IP module is at the heart ofVISTA architecture and plays role in image capturing andprocessing. Image processing module captures the MOimage first and then different image processing algorithmsare applied on this captured image to convert it froman image to MO silhouette. Image processing modulematches this extractedMO silhouette to the stored silhou-ettes at SN. Image processing module then recognizes theMO at SN and gives result in terms of surety. Image pro-cessingmodule is initialized by receivingMODmessage atSNs or it can be directly initialized by sonar interruptionat ENs.IP module assumptions
• Captured MO image and stored SN background imageare of same size because the FV cameras capture typi-cally well-known objects of known scales which appear onroad.• Background subtraction algorithm is only applicablewhere the distance between SNs’ cameras and road seg-ments remains unchanged.
Image capturing sub-module. An instantaneous imagecapturing of MO is done by the image processing mod-ule as a first step. When a SN receives a MOD message,its camera is invoked for ‘�t‘ s and captures fixed-sizeMO images where�t affects the total ‘shutter ON’ time ofcamera for accommodating variance in expected arrival.A minimum of 25 fps is recommended for motor vehicletraffic areas [34]. A total of ‘n’ fps is captured by the sensornode’s camera while every ’ith’ captured frame is pro-cessed for MO recognition and tracking. Figure 7 showsthe timeline in which SNs’ cameras are sequently invokedfor ‘�t’ s.Image change detection sub-module. The captured MO
images are then passed through image change detectionsub-module to detect the presence of mobile object. UsingGaussian mixture model (GMM) for detecting change inthe background (or equivalently validating the presenceof foreground) for a given number of Gaussian compo-nents is known to yield desirable results in the presence
Figure 7 Timeline for camera activation.
of moving or more appropriately ‘evolving’ backgrounds.However, for limited form-factor nodes used in multi-camera networks such as VISTA, blanket application ofa fixed number of components in GMM as in [11] is notpossible. Such impossibility owes to the fact that thereexist differences in the fields of view (frustums) for all thecamera due to their unique spatial deployment resultinginto unique confusing background processes (includingswaying background objects, slow moving foregrounds,and shadowing/illuminating effects of light sources) thatare disparate and have localized uniquenesses. It is, there-fore, needed to adapt the operation of image changedetection sub-module at each IN to become more sensi-tive when the localized background processes are activeand less sensitive otherwise. More sensitivity implies thatthe effects of active background processes are counteredthrough the use of a higher number of Gaussian compo-nents in the mixture of Gaussians. When the backgroundis more stationary, the IN can switch back to a lesser num-ber of Gaussians. Although an offline initialization of thenumber of Gaussians and the identification of a suitableincrement size in the number of Gaussians can be per-formed using information theoretic Bayesian informationcriterion (BIC) [35], using an intuitively large number ofGaussians is not advisable in VISTA because it results intooverfitting at the cost of more energy drain and addedcomplexity. In other words, such adaptation should ini-tialize modestly and subsequently work incrementally (ordecrementally) as ‘what you see is what you do’ (WYSI-WYD).The implementation of the adaptive change detection
is proposed through a feedback loop that is establishedbetween an up-trajectory node (an edge node that acti-vates an inner node or an inner node that activates anotherinner node) and a down-trajectory node (an inner nodethat is activated by an edge node or by another innernode). When the up-trajectory node detects a mobileobject (foreground present), it generates mobile objectdetected message for its down-trajectory neighbor. Suchup-trajectory node expects that the down-trajectory nodewould also detect this mobile object. When the down-trajectory node detects the same mobile object, it sendspositive feedback to the up-trajectory node. Such positivefeedback implies that the change detection at the up-trajectory node is rightly sensitive (the Gaussian mixturehas the right number of components) and that the fore-ground was indeed present. In case the down-trajectorynode sends negative feedback, it means that the changedetection at the up-trajectory node is less sensitive andit has to become more sensitive to prevent such falsepositives. Likewise, the false negatives may also be trig-gered on reverse links through Carrefour camera nodes.The high-low sensitivity oscillations may result due tothe feedback by a malfunctioning down-trajectory node

Jabbar et al. EURASIP Journal on Image and Video Processing 2014, 2014:32 Page 14 of 24http://jivp.eurasipjournals.com/content/2014/1/32
or a Carrefour node. This can be mitigated through theusage a more formidable hysteresis loop based on consen-sus and voting algorithms among a group of neighboringinner nodes [36]. This feedback (or hysteresis) loop isrecursively intertwined throughout the network for anyarbitrary up-trajectory node and its corresponding down-trajectory nodes.Image compression and storage sub-module. The cap-
tured MO image is compressed and stored in SN mem-ory by image compression and storage sub-module. Bothcompression and storage can be optimized using quality-aware transcoding which is an enabling technology fordynamically changing the image size using a quality-vs.-size tradeoff [37]. We propose surety-based imagecompression and storage (SICS) in which an image istranscoded and stored by seeing the surety level of thatmobile object. Through SICS, the captured image can betranscoded at four different levels against four surety lev-els that can be stored at four different image quality levelsas shown in Table 11. In SICS, an image is transcoded tomore elevated levels as the mobile object achieves highsurety levels in RoI. An image having highest transcod-ing level would have lowest image quality level. As thequality level of an image decreases, power consumptionof transcoding operation also decreases. For example, attranscoding level 3, an image has only 25% quality levelwhich consumes very low computational power as com-pared to low transcoding levels. Moreover, mobile objectrecognition is not affected by storing low-quality imagesbecause at high surety levels, low-quality images are ade-quate for further IP and mobile object recognition. Also,a low-quality stored image takes less memory to saveand consumes low computational power in performing IPactivities and MO recognition.The proposed mechanism can be best described by
illustrating the example scenario below. A mobile objecthas ‘0%’ surety level, when it enters first time in the RoI.According to SICS, a MO image is not transcoded in thiscase and stored in its original size for better identificationof theMO. As aMO is covered by more hops of IP by eachpassing-by SN in the RoI, it achieves high surety levelsbecause of MO recognition at more SNs. When a mobileobject achieves more than 25% surety level in the RoI,
Table 11 SICS surety-based image compression powercharacteristics
Surety Image transcoding Image quality Power consumption inlevel (%) level level (%) transcoding (mW)
0 to 25 Level 0 100 Nil
26 to 50 Level 1 75 68.8
51 to 75 Level 2 50 44.1
76 to 99 Level 3 25 24.7
then the transcoding level for compressed stored image isdecided correspondingly. For example, if a mobile objectis recognized by up to 50% surety level, then the capturedimage is transcoded at level 1 and stored at 75% qualitylevel, and if a mobile object is recognized by more than75%, then SICS compresses the MO image at the highesttranscoding level (i.e., level 3) and stores at lowest imagequality level (i.e., 25%).The total power cost of image capturing and image
compression and storage sub-modules is described in theequation below.
P = A + C + S, (11)
where A is the power consumed by image capturer mod-ule, C is the power used in image compression, and Sis the power used in storage. Power consumption of Ais irrepressible, but C and S are controllable by applyingSICS.Image subtraction sub-module. The stored MO image
is subtracted by the background subtracter sub-module toextract the MO silhouette from it. Silhouette is extractedby subtracting MO image from the static backgroundimage stored at SN. Background subtraction can be donein low computational cost and in less time by applying‘don’t care’ operation on some parts of the backgroundimage such that silhouette extraction is not affected.To apply the don’t care operation on some parts ofthe background image, the information about changedand unchanged regions in MO image from its corre-sponding static background is very necessary. So, theregions of the captured image are not processed or ‘don’tcared’ if unchanged. To select the appropriate sectionfor background subtraction operation, the changed andunchanged regions can be detected by applying theequation below [38]:
Dxkij = xkij(t2) − xkij(t1). (12)
This pixel-by-pixel change detection method based onimage subtraction is executed only once when a mobileobject enters first time in RoI. When changed portionsare detected from the background image on successivehops, we can avoid some portions of background imagewhere change is not detected considering them don’tcare regions. Since we assume the Manhattan model, wepropose that the background image is divided into fourportions in which some regions are used for backgroundsubtraction, while some are ignored by applying don’t careoperation. Four cases of background subtraction possiblyexist in which total number of change detected regionsand positions of changed regions are varied as shown inTable 12. We assign a unique code to all possible com-binations that are made by seeing the total number ofchanged regions and their positions. This unique code is

Jabbar et al. EURASIP Journal on Image and Video Processing 2014, 2014:32 Page 15 of 24http://jivp.eurasipjournals.com/content/2014/1/32
Table 12 Total possible changed regions with theirpositions
Case no. Total no. of changed Code no. Changedregions region
1 4 0000
2.1 1 0001
2.2 1 0010
2.3 1 0011
2.4 1 0100
3.1 2 0101
3.2 2 0110
3.3 2 0111
3.4 2 1000
4.1 3 1001
4.2 3 1010
4.3 3 1011
4.4 3 1100
used to transfer information about background subtrac-tion operation to neighbor SNs. If change is detected in allportions of background image, then the background sub-traction operation would be done on whole backgroundimage at all sensor nodes. If change is detected in one,two, or three parts, then the background subtraction canbe done in one, two, or three portions, respectively. Wepropose ID-based split background image subtraction inwhich background subtraction is done on some portionsof the background image by seeing the previous sen-sor node ID. Scene entry region information is used tochoose the appropriate portion for background subtrac-tion. Scene entry region information is the informationabout mobile object navigation on the previous SN whereaMO is lastly observed and gives the entrance direction ofamobile object at a SN. Sensor nodes keep this scene entryregion information in the database table by using neigh-bor SNs’ Ids. IN_4 is taken as an example from Figure 1to show the appropriate section of background image fora MO coming from neighbor SNs to IN_4 as shown inTable 13. Here, we assume that changed is detected in onlyone portion. So, background subtraction would be done
Table 13 Spilt background table for IN_4 based onprevious SN_ID
Previous node ID Scene entry region Backgroundinformation section
IN_3 Northwest
IN_5 Southeast
IN_6 Northeast
IN_7 Southeast
IN_8 Southwest
IN_9 Northwest
IN_10 Northeast
IN_11 Northwest
only on one portion of the background image. Figure 8shows the time elapsed during the image subtraction time.It shows that image subtraction takes 4.5 times less timeif we subtract only one portion as compared to the wholeimage.Silhouette comparator sub-module. The extracted
silhouette is finally compared with the stored databasesilhouettes by silhouette comparator sub-module. Wepropose feature-dependent silhouette segmentation forlow energy comparison (FRILL).Through FRILL, the extracted silhouette is segmented
corresponding to the number of segments of the storedsilhouettes one by one, such that in each comparison, thenumber of segments of the extracted silhouette is equal tothat of the stored one. Aspect ratios of each individual seg-ment of the extracted silhouette are computed and then
Figure 8 Image subtraction time by applying don’t careoperation on some portion of an image.

Jabbar et al. EURASIP Journal on Image and Video Processing 2014, 2014:32 Page 16 of 24http://jivp.eurasipjournals.com/content/2014/1/32
Figure 9 Unknown extracted silhouette is comparedwith stored database silhouettes.
compared to the aspect ratios of the corresponding storedsilhouettes. For example, as seen in the database section,if an extracted mobile object silhouette is compared witha stored human silhouette, it is segmented into four partsbefore comparison. The comparison procedure is basedupon the following equation:
Diff = Minj(�ARi
e − ARis) ∀k , (13)
where ARe = aspect ratio of the extracted silhouette,ARs = aspect ratio of the stored silhouette, j = total
number of segments of a silhouette, k = total silhouettesdeployed on a SN.This equation computes the aspect ratio difference
between the extracted silhouette and stored silhouettes
Figure 10 Resultant MO information packet generated by the IPmodule.

Jabbar et al. EURASIP Journal on Image and Video Processing 2014, 2014:32 Page 17 of 24http://jivp.eurasipjournals.com/content/2014/1/32
Table 14 Decision taken by seeing packet type
External module Packet type Destination decision
Sonar-sleeping module Sleeping schedules Send to ENs in a triplet
Sonar-sensing module MOD message Send to next hop SN only
Time synchronization BEACON/ TIME stamps Send to subsequent INs only
Image processing module MO recognition information Send to next hop SN/base station
one by one and then returns the minimum differencevalue. This minimum difference shows that the extractedsilhouette is similar to the stored silhouette from whichit has minimum difference. The percentage match ofextracted silhouette with the most matched silhouette iscomputed by applying the equation below:Percentage match
=∑total segments
i=0 (AR of extracted silhouette)∑total segmentsi=0 (AR of stored silhouette)
× (1k ) × 100.
(14)The proposed scheme can be best described by an
example scenario as shown in Figure 9. In this figure, anunknown extracted silhouette of a mobile object is com-pared against four different stored silhouettes of a humanon a SN. The run time-extracted silhouette is segmentedinto the same parts and with the same aspect ratios one byone as the corresponding silhouette in the database. Forexample, when this unknown extracted silhouette is com-pared with a man’s standing side view, then the unknownobject is segmented into six parts, and when this is com-pared by armed view, then it is segmented into five partsand with same width and height ratios.After completing the silhouette comparison operation,
the IP module creates the packet as shown in Figure 10. Itmay be noted that except for the surety, all the fields areretrieved from the database.
Routing decision module The routing decision modulecan be considered as a central unit as the subsequentbehavior and desirable performance of network dependon the outcome generated by it. It is responsible for takingdecisions regarding the destinations for the packets gen-erated by the modules. The decision module is invoked
Table 15 System specifications for performance evaluation
Feature Specification
Processor Atom
Processor model Intel N2800
Memory 2Gb
Camera Web camera Logitech Tessar
Processor speed 1.28 GHz
Dimension of the image 240 × 240 pixels
by sonar-sleeping, sonar-sensing, time synchronization,and image processing modules. The operations of deci-sion module for respective instances of all these modulesare discussed below. The nature of decisions taken bythe module varies across the modules as can be seen inTable 14.The decision module can be invoked by sonar-sleeping
module and takes destination decisions for sharing thesleeping schedules generated by the background EN ina triplet for the foreground ENs. The decision modulethen takes decision about the destination of the MODmessage that is generated by the sonar-sensing module.The MOD message invokes the most optimal SN’s cam-era in the network for in-time MO image frame capturingand recognition. The decision about the most optimal SNdepends on the MO direction that is determined by cap-turing the MO image at Carrefour IN. The MODmessagefirst goes to the Carrefour IN which then sends it to thenext optimal sensor node by seeing the direction of theMO silhouette after recognizing it.The decision module receives beacons from the time
synchronization module, makes a decision about beacondestination, and sends it to the subsequent inner nodesby consulting the ‘SNs’ positions and camera orientationstable’. The decision module is also responsible for takingthe destination decision about theMO information packetgenerated by the image processing module. This packet issent to the next hop sensor node or to the base stationby seeing the percentage match of the mobile object. Ifthe percentage match exceeds the user specified thresh-old, then this packet is sent to the base station, triggeringtermination of the successful recognition process.
4 VISTA performance evaluationIn this section, we evaluate the performance of VISTAwith respect to the proposed IP algorithms. Simulations
Table 16 Parameters and situations for experiments
Parameters Situations
Lighting effects Sunlight, artificial light, and shadow
Object types Human, cars
Angle Straight, side, and loaded
Background types Uniform, non-uniform

Jabbar et al. EURASIP Journal on Image and Video Processing 2014, 2014:32 Page 18 of 24http://jivp.eurasipjournals.com/content/2014/1/32
Figure 11 Evaluation of VISTA algorithms.
have also been carried out in NS-2 that observes theimpact of database management and distribution on over-all performance of VISTA.
4.1 VISTA IP algorithms performance on testbedAll the image processing algorithms for low form-factorSNs are implemented and tested using the Atom proces-sor with Matlab (version R2012b) to emulate incrementalchange in computational load (i.e., added current load),similar to the work of [20]. The system specifications aregiven in Table 15. The experiments are done under var-ious light conditions by using different background andforeground types. The parameters and situations in whichexperiments are done are given in Table 16. Figure 11
shows the results of VISTA algorithms executed in dif-ferent situations. For example, case 1, case 3, and case 5are executed with different backgrounds and object types,while case 3 and case 4 are executed with the same objecttype (human) but with different background types. Case 3is executed for uniform background, while case 4 is exe-cuted for non-uniform background. Case 2 uses the sameobject type as case 1 but with different angle. The per-formance of VISTA is practically justified in all the abovecases. Case 6 is executed with object type (human) and inbad light conditions (artificial light). In this case, VISTAalgorithms could not segment the neck of the humanbecause of low lighting conditions of the captured imagethat affects the overall performance.
Table 17 Memory consumption comparison after SICS
Elapsed time DCT compression and Memory consumption Memory consumptionreconstruction (seconds) before compression (KB) after compression (KB)
Time 1 1.242557 12 8
Time 2 1.242957 12 8
Time 3 1.286239 12 8

Jabbar et al. EURASIP Journal on Image and Video Processing 2014, 2014:32 Page 19 of 24http://jivp.eurasipjournals.com/content/2014/1/32
Table 18 Comparison of memory consumption afterapplying image subtraction algorithm
Case Detected Reduction in image Elapsednumber region dimensions time (s)
1 Change in whole image 240× 240 0.438973
2 Change in upper half horizontal 240× 120 0.111694
3 Change in second half vertical 120× 240 0.101043
We have evaluated VISTA algorithms against baselinealgorithms with respect to time and memory efficiencywhich subsequently lead to energy efficiency on battery-operated nodes. It is important to mention here thatthe proposed algorithms are compared against baselinesbecause our algorithms are actually part of an integratedarchitecture in which each is tailored to achieve syn-ergy, which is not the case in contemporary literature.Imagery data produced and subsequent memory usage isreduced significantly after applying compression throughSICS algorithm as shown in Table 17. Image compressionresults into memory savings that deteriorate the imagequality; however, the image stays extractable.The image subtraction sub-module takes part in reduc-
ing image data and execution time as shown in Table 18.The image subtraction module reduces imagery data forfurther processing and controls energy consumption.Table 19 shows the total time elapsed between pixel-
by-pixel comparison and proposed FRILL scheme for MOrecognition. It shows that there is a large difference inexecution time when applying both schemes on the samesilhouette.
4.2 VISTA performance evaluation using NS-24.2.1 VISTA simulation parametersSimulations are carried out in NS2 in order to evaluate theperformance of VISTA regarding the effects of networktopology, mobility, and distribution of database. NS2 is adiscrete event simulator targeted at networking researchand provides substantial support for simulation of TCP,routing, and multi-cast protocols over wired and wire-less networks [39]. Specifically, NS2 validates the perfor-mance of VISTA by representing the confidence (surety)of MO identification as a function of number of cameras,database size and distribution, MO’s trajectory, stored
Table 19 Comparison of pixel-by-pixel operation andFRILL
Elapsed time Pixel-by-pixel Silhouette extraction Difference (s)comparison (s) comparison (s)
Time 1 43.878 1.46 42.418
Time 2 42.108 1.23 40.878
Time 3 44.124 1.48 42.64
perspectives, and network depth. Some of the simulationparameters are described below:1. Manhattan model: We use the Manhattan mobility
model in a field of 60 m × 60-m with 16 nodes. Thereis a FV camera at each SN that is placed considering thelocation from where MO can be optimally observed.2. Database distribution: The database is deployed at
each SN considering the view of camera and applicationperspective. At each SN, relevant silhouettes along withtheir octets, angles, sizes, and surety levels are stored inthe form of table. In our simulations, we consider fourangles, i.e., left, right, front, and back and four sizes. Werepresent this using four bits for a total of 16 combina-tions. The surety level is affected by both parameters, i.e.,angle and size.3. MO generation: A MO is generated and inserted into
the RoI with fixed seed. The route of theMOwhich affectsits surety level is programmed through a pseudo-randomfunction that controls its direction and distance. Whenthe MO enters the sensing range of a node, the node gen-erates a packet containing octet, angle, size, and the suretylevel. If the resultant surety level is less than the thresh-old, the packet generated by the node is passed onto thenext suitable node. The camera at the next node is sim-ilarly activated only when MO enters its range, so thatredundant image capturing and processing is prevented.
4.2.2 VISTA results based on NS-2 simulationNumber of stored silhouettes in databaseWhen the total number of stored silhouettes in networkis less, the surety level of the detected object is alsolow. As the number of silhouettes stored in a database isincreased, the surety level of object increases. This meansthat a large number of silhouettes stored in databaseresults in a better chance of match at every SN. Initially,with only 25 silhouettes distributed across the network, itis observed that the maximum surety level of MOs variesbetween 30% and 60%. When number of stored silhou-ettes is increased twofold, the surety level increases to 40%to 80% and when the stored silhouettes are increased fourtimes, the surety level increases to around 80% to 100%.Based on the MO trajectory, the variations in the suretylevel as a function of the number of silhouettes varies forthree objects as shown in Figure 12. This shows that forMO 3, the surety level in case of 25 and 98 stored silhou-ettes is highest; the reason behind this is the default biaswhich exists in the used mobility model.
Depth of network in hop count In order to examine theimpact of network depth on the percentage match of aMO,we observed the surety level while seeing the increasein the hop count as the MO follows the trajectory. Theresults as in Figure 13 show that as MO enters the RoI, thesurety level of detection is low since a limited set of SNs
Jabbar et al. EURASIP Journal on Image and Video Processing 2014, 2014:32 Page 20 of 24http://jivp.eurasipjournals.com/content/2014/1/32
Figure 12 Effect of increasing silhouettes in VISTA database innetwork.
that observe the MO may or may not have its silhouettesin their databases. However, as MO goes deeper into RoI,the probability of finding an exact match to the silhouettesstored in distributed database increases since the numberof SNs observing the MO increase. It is also importantto note that though the graph is expected to be linear, itonly tends towards linearity. This owes to the fact that thedatabase is not uniformly distributed across the entire RoI.
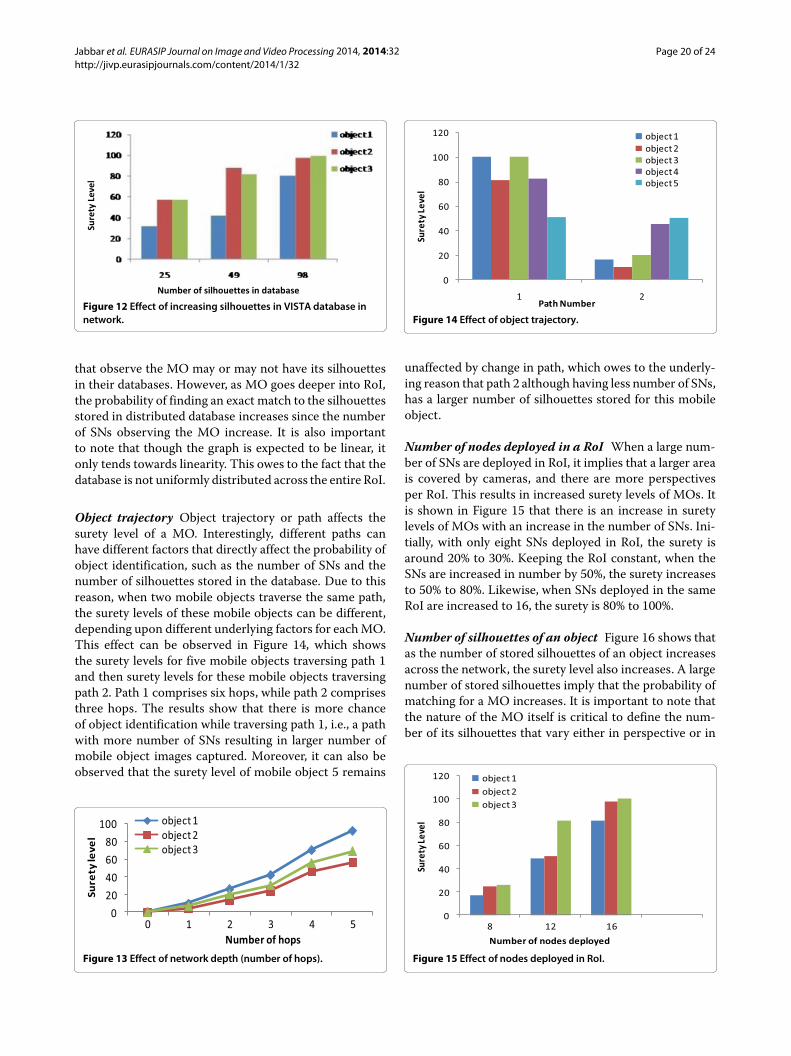
Object trajectory Object trajectory or path affects thesurety level of a MO. Interestingly, different paths canhave different factors that directly affect the probability ofobject identification, such as the number of SNs and thenumber of silhouettes stored in the database. Due to thisreason, when two mobile objects traverse the same path,the surety levels of these mobile objects can be different,depending upon different underlying factors for eachMO.This effect can be observed in Figure 14, which showsthe surety levels for five mobile objects traversing path 1and then surety levels for these mobile objects traversingpath 2. Path 1 comprises six hops, while path 2 comprisesthree hops. The results show that there is more chanceof object identification while traversing path 1, i.e., a pathwith more number of SNs resulting in larger number ofmobile object images captured. Moreover, it can also beobserved that the surety level of mobile object 5 remains
Figure 13 Effect of network depth (number of hops).
Figure 14 Effect of object trajectory.
unaffected by change in path, which owes to the underly-ing reason that path 2 although having less number of SNs,has a larger number of silhouettes stored for this mobileobject.
Number of nodes deployed in a RoI When a large num-ber of SNs are deployed in RoI, it implies that a larger areais covered by cameras, and there are more perspectivesper RoI. This results in increased surety levels of MOs. Itis shown in Figure 15 that there is an increase in suretylevels of MOs with an increase in the number of SNs. Ini-tially, with only eight SNs deployed in RoI, the surety isaround 20% to 30%. Keeping the RoI constant, when theSNs are increased in number by 50%, the surety increasesto 50% to 80%. Likewise, when SNs deployed in the sameRoI are increased to 16, the surety is 80% to 100%.
Number of silhouettes of an object Figure 16 shows thatas the number of stored silhouettes of an object increasesacross the network, the surety level also increases. A largenumber of stored silhouettes imply that the probability ofmatching for a MO increases. It is important to note thatthe nature of the MO itself is critical to define the num-ber of its silhouettes that vary either in perspective or in
Figure 15 Effect of nodes deployed in RoI.

Jabbar et al. EURASIP Journal on Image and Video Processing 2014, 2014:32 Page 21 of 24http://jivp.eurasipjournals.com/content/2014/1/32
Figure 16 Effect of number of stored silhouettes for an object.
size or in both. For example, consider theMO to be a tank.Since in this case, the size of the MO is too large, deploy-ing too many silhouettes of varying sizes is not neededbecause a tank at one edge of the road or at the other edgedoes not change in size considerably. However, multipleperspectives of tank are needed because it is highly agilein changing directions.
Centralized vs. distributed database There can be twotypes of database deployment strategies: centralized anddistributed. In centralized distribution, images are equallydeployed in the network without taking into considerationexpected paths of different objects. In distributed strategy,the deployment of images is based on the type of object,i.e., if a path is more likely to be traversed by certain typeof objects, the SNs in that path are deployed with moreimages of that type of object. In such case, the expectedpath complaint distribution of database distribution oftenserves to be of advantage. Also, there is a need to highlightthat the object may not follow the expected trajectory.In that case, this strategy could be detrimental. Figure 17shows that when an object traverses the expected path, thesurety level is 100% (left blue). But when there is path vio-lation, the surety level is 0% (missing red on the left side).On the contrary, pseudo path with independent deploy-ment yields large surety level for random path traversal. In
Figure 17 Effect of centralized vs. distributed database.
case the object travels the expected path, the surety levelincreases slightly.
5 DiscussionFalse alarms or no alarms (in case of MO present) can begenerated by VISTA layers as shown in Figure 18. Fourcombinations of events and alarms can be generated thatare described in Table 20 showing different situations inwhich generation of false alarms can affect the perfor-mance of VISTA from two aspects, namely, the target andthe camera.When the target reduces or increases its speed sud-
denly, either it stops moving further or it gets a turnof 180° or higher. Under these conditions, our algorithmmight not work where the target may not lie within thepredicted yaw angle. To address this problem, the con-cept of timer may be introduced, i.e., the activated IN atthe predicted target location sets a timer. The IN waitsfor the target until the timer is expired. When the timeris expired, this IN activates all other INs in its one-hopneighborhood and reports this ‘target lost’ error back tothe previous node (IN or EN), from which it receivedthe mobile object detected message. On the reception ofthis target lost error, the previous node also activates allother INs in its one-hop neighborhood. Hence, all theINs are activated near the location, where the target waslast seen and got lost. Once the lost target is found, thenthe target is tracked by the reporting IN and all otheractivated INs switch to the sleep state. Using this mech-anism, VISTA recovers from the anomalous behavior ofthe target and resumes its normal operation. Similarly,another cause of false alarm can be due to packet loss andcorruption which may be compensated through reliablecommunication using acknowledged service. Regardingthe sub-optimal deployment of cameras, auto-calibrationof frustums can be achieved by allowing cameras to col-laborate through sharing their ‘experiences’ of detectingan object with a certain level of surety at an angle.
Figure 18 False-alarm generation by VISTA. Description +ve +ve:Target present and VISTA activated. +ve -ve: Target present but VISTAnot activated (false alarm), −ve +ve: Target not present but VISTAactivated (false alarm). −ve −ve: Target not present and VISTA notactivated.

Jabbar et al. EURASIP Journal on Image and Video Processing 2014, 2014:32 Page 22 of 24http://jivp.eurasipjournals.com/content/2014/1/32
Table 20 Anomalies leading to operational degradation and false alarms in VISTA
Number Anomaly Affected VISTA layer/function False alarm Compensation
1 Small bending curvature Image capture sub-module False alarm (-ve +ve) Timer-based deactivation and
sudden stop acceleration/ using reverse link denotification,
deceleration of target and using Carrefour cameras
to re-initiate MODmessage
2 Packet loss/corruption Sonar-sleeping module, False alarm (+ve -ve) Reliable communication using
(sleep schedule, time sync) sonar-sensing module, ACK, ReTx, and FEC
time synch module,
and image capture sub-module
3 Misalignment/dealignment Image capture sub-module, Frustum inconsistencies Automated camera calibration
of cameras (art gallery image change detection sub-module, such as over laps and holes by tallying recent tuple
problem) and image subtraction sub-module lead both to (-ve +ve) and (+ve -ve) (octet, angle, surety)
similar to [40] to [41]
An insight is presented in Table 21 regarding spe-cific operations of VISTA that yield energy efficiencybut introduce additional complexities to achieve the per-formance. For example, the energy efficiency achievedthrough ‘just-in-time sensing otherwise sleeping’ behaviorof sonars introduces latency and possible missouts.Application-specific and target type-based adjustment topulse repetition rate at sonars can reduce unacceptablelatencies and alleviate unexpected missouts. A flexiblesilhouette re-deployment mechanism can prove to beeffective in situations where target speed and ambulatorybehavior deviate from the envisaged mobility model.
6 ConclusionsIn this research, a novel architecture is proposed in whichenergy-efficient capturing and processing of MO image isdone. The architecture achieves its objective by silhouetterecognition of mobile targets with images stored in thedatabase deployed at each SN of the sensor network. Theproposed architecture redefines the video capturing capa-bility of VSNs. The SNs are placed at optimal positionsin order to make communication effective. The proposedarchitecture assists VSN in achieving a cumulative vision.Experimental evaluation of image processing algorithmsof ‘VISTA’ against baseline algorithms with respect to
Table 21 Trade-offs of energy latency-leading to operational degradation and false alarms in VISTA
Number Memory/energy efficiency in VISTA Implementation layer Trade-off Compensation
1 Triplet formation of SONARs for reducingshutter ‘On’ time of IN cameras andbreach avoidance amidst failing nodes
Sonar-sensing module SONAR 3-pulse detectionintroduces latent responseof INs causing falsealarm (+ve -ve)
Pulse repetition rate (PRR)in SONAR tailored tomatch target speed andrange [42]
2 Sonar sleep scheduling to conserve energy Sonar-sleeping module False alarm (+ve -ve)amidst holes in full-widthhalf maximum(FWHM) coverage
Automated SONARcalibration by triplettraining similar to [42]
3 Database with relative silhouettes only(mobility model compliant) to reduce(a) memory occupancy, (b) comparisoncomputations, and (c) frequency ofIP module usage
Image change detectionsub-module and imagesubtraction sub-module
Tight coupling withassumed mobility modelcan lead to both falsealarms
Silhouette distribution andconfiscation dynamicallyassociated with per pathcumulative surety canreduce the effect ofmobility
4 Image change detection triggerssubsequent IP modules (need-basedcomputations only)
Image change detectionsub-module
Slow moving objectsbecome immersed inscene causing falsealarm (+ve -ve)
Using GMM [11] alleviatesforeground becomingbackground
5 Surety-based transcoding Image compression andstorage sub-module
Higher transcodingneutralizes the job ofsubsequent IP modules
Benchmark changedetection and subtractionagainst acceptabletranscoding levels

Jabbar et al. EURASIP Journal on Image and Video Processing 2014, 2014:32 Page 23 of 24http://jivp.eurasipjournals.com/content/2014/1/32
execution time and memory shows significant reductionin image data and memory occupancy. The deploymentof sonar and SNs is analyzed by NS2 simulations that areperformed in order to assess the performance of the pro-posed architecture when the number of cameras, databasesize and distribution, object’s trajectory, stored perspec-tives, and network depth are varied. The simulations inNS2 show that surety level of object increases with largerdatabase. Also, when MO goes deeper into RoI, the prob-ability of finding an exact match to the outlines stored indistributed database increases. Similarly, different pathscan have different factors that directly affect the proba-bility of object identification, such as the number of SNsdeployed in the RoI and number of silhouettes storedin database; therefore, when two MOs traverse the samepath, the surety levels of these MOs can be different,depending upon different underlying factors for eachMO.When a large number of SNs are deployed in a region,larger area is effectively covered by cameras andmore per-spectives per region are available. This results in increasedsurety level of MOs.
AbbreviationsBIC, Bayesian information criterion; CDV, cooperative distributed vision; EN,edge node; FOV, field of view; FRILL, feature-dependent silhouettesegmentation for low-energy comparison; FV, fixed view; GMM, Gaussianmixture model; IN, inner node; IP, image processing; MO, mobile object; MOD,mobile object detected; OoI, object of interest; PTZ, pan-tilt-zoom; RoI, regionof interest; RSSI, received signal strength indicator; SICS, surety-based imagecompression and storage; SIFT, scale invariant feature transform; SMAC, sensormedium access control; SN, sensor node; VISTA, achieving cumulative visionthrough energy efficient silhouette recognition of mobile targets throughcollaboration of visual sensor nodes; VSNs, visual sensor networks; WSNs,wireless sensor networks; WYSIWYD, what you see is what you do.
Competing interestsThe authors declare that they have no competing interests.
Authors’ contributionsSJ has defined the main architecture and developed the manuscript. AHAconceived the idea and supervised the research. SZ helped refine themanuscript and fine-tuned the details in it. MMQ contributed in cameradeployment, calibration, and alignment. MH contributed in database designand packet format. All authors read and approved the final manuscript.
AcknowledgementsThe authors would like to thank Ms. Noureen Jabbar and Ms. MaryyamMuhammad Din for their participation in obtaining practical results for thisresearch. The authors also would like to acknowledge the Al-KhawarizmiInstituite of Computer Science and University of Engineering and Technology(UET) Lahore for supporting by sparing SJ to carry out the research.
Author details1Al-Khawarizmi Institute of Computer Science, University of Engineering andTechnology (UET), Lahore 54890, Pakistan. 2Department of ElectricalEngineering, University of Engineering and Technology (UET), Lahore 54890,Pakistan. 3Department of Computer Science and Engineering, University ofEngineering and Technology (UET), Lahore 54890, Pakistan.
Received: 18 June 2013 Accepted: 30 May 2014Published: 25 June 2014
References
1. M Chen, S Gonzalez, VC Leung, Applications and design issues for mobileagents in wireless sensor networks. IEEE Wireless Commun. 14, 20–26(2007)
2. B Nelson, PK Khosla, Integratingsensor placement, visualtrackingstrategies, IEEE International Conference on Robotics and Automation.San Diego CA, 1351–1356 (1994)
3. LE Navarro-Serment, JM Dolan, PK Khosla, Optimal sensor placement forcooperative distributed vision, in Paper presented at the IEEE internationalconference on robotics and automation (ICRA), vol. 1 (New Orleans, LA, USA,26 April–May 1, 2004), pp. 939–944
4. F Capezio, F Mastrogiovanni, A Sgorbissa, R Zaccaria, Robot-assistedsurveillance in large environments. J. Comput. Inform. Technol.17, 95–108 (2004)
5. KS Bhat, M Saptharishi, PK Khosla, Motion detection and segmentationusing image mosaics, in Paper presented at the IEEE internationalconference onmultimedia and expo (ICME), vol. 3 (NY, USA, 30 July – 2 Aug,2000), pp. 1577–1580
6. M Saptharishi, JB Hampshire, PK Khosla, Agent-based moving objectcorrespondence using differential discriminative diagnosis, in Paperpresented at the IEEE conference on computer vision and pattern recognition,vol. 2 (SC, USA, 13–15 June, 2000), pp. 652–658
7. N Ukita, T Matsuyama, Real-time cooperative multi-target tracking bycommunicating active vision agents. Comput. Vis. Image Underst.97(2), 137–179 (2005)
8. T Matsuyama, Cooperative distributed vision: dynamic integration of visualperception, action, and communication. Mustererkennung 1999. (SpringerBerlin Heidelberg, 1999), pp. 138–151
9. SC Tien, YLu TL Chia, Using cross-ratios to model curve data for aircraftrecognition. Pattern Recognit. Lett. 24(12), 2047–2060 (2003)
10. S Soro, W Heinzelman, A survey of visual sensor networks. Adv.Multimedia (2009). doi:10.1155/2009/640386
11. C Stauffer, WEL Grimson, Adaptive background mixture models for real-time tracking, in Paper presented at the IEEE Computer Society conference oncomputer vision and pattern recognition, vol. 2 (CO, USA, 23–25 June 1999
12. AT Ihler, Fisher III JW, Moses RL, Willsky AS, Nonparametric beliefpropagation for self-localization of sensor networks.Select. AreasCommun. IEEE J. 23(4), 809–819 (2005)
13. Rabbat M, R Nowak, Distributed optimization in sensor networks, CA, USA,Unknown Month 26), pp. 20–27
14. Y Cho, SO Lim, HS Yang, Collaborative occupancy reasoning in visualsensor network for scalable smart video surveillance. IEEE Trans. Consum.Electron. 56(3), 1997–2003 (2010)
15. TH Tsai, CY Lin, Exploring contextual redundancy in improvingobject-based video coding for video sensor networks surveillance. IEEETrans. Multimedia. 14(3), 669–682 (2012)
16. Ellis T, Multi-camera video surveillance, in Paper presented at the 36thannual international Carnahan conference on security technology (AtlanticCity, NJ, USA, 20–24 Oct, 2002), pp. 228–233
17. L Paletta, S Wiesenhofer, N Brandle, O Sidla, Lypetskyy Y, Visualsurveillance system for monitoring of passenger flows at publictransportation junctions, in Paper presented at the IEEE intelligenttransportation systems (Austria, 13-16 Sep, 2005), pp. 862–867
18. M Kumar, Automating visual sensor networks, (Brown University, 2009)19. V CB Margi, K Petkov, R Obraczka, Manduchi, Characterizing energy
consumption in a visual sensor network testbed, in Paper presented at the2nd international conference on testbeds and research infrastructures for thedevelopment of networks and communities (TRIDENTCOM) (Spain, March,2006), pp. 1–3
20. R CB Margi, K Manduchi, Obraczka, Energy consumption tradeoffs invisual sensor networks, in Paper presented at the 24th Brazilian symposiumon computer networks (SBRC), vol. 1 (Curitiba, Brasil 29 May–2 June, 2006)
21. F Qureshi, D Terzopoulos, Smart camera networks in virtual reality. Proc.IEEE. 96(10), 1640–1656 (2008)
22. F Qureshi, D Terzopoulos, A simulation framework for camera sensornetworks research, in Paper presented at the 11th communications andnetworking simulation symposium (ACM) (Ottawa, ON, Canada, 13–16April, 2008), pp. 41–48
23. FZ Qureshi, D Terzopoulos, Planning ahead for PTZ camera assignmentand handoff, in Paper presented at the third ACM/IEEE international

Jabbar et al. EURASIP Journal on Image and Video Processing 2014, 2014:32 Page 24 of 24http://jivp.eurasipjournals.com/content/2014/1/32
conference on distributed smart cameras (ICDSC), Societ del Casino, TeatroSociale di Como (Como, Italy, 30 Aug–02 Sept, 2009), pp. 1–8
24. N Krahnstoever, Y Ting, L Ser-Nam, P Kedar, T Peter, Collaborative real-timecontrol of active cameras in large scale surveillance systems, in Paperpresented at the workshop onmulti-camera andmulti-modal sensor fusionalgorithms and applications (M2SFA2) (Marseille, France, 18 Oct, 2008)
25. Obraczka K, Manduchi R, Garcia-Luna-Aveces J, Managing the informationflow in visual sensor networks, in Paper presented at the 5th internationalsymposium on wireless personal multimedia communications, vol. 3(Sheraton Waikiki, Honolulu, HI, USA, 27–30 Oct, 2002), pp. 1177–1181
26. IF Akyildiz, T Melodia, KR Chowdhury, A survey on wireless multimediasensor networks. Comput. Netw. 51(4), 921–960 (2007)
27. Akyildiz IF, Su W, Y Sankarasubramaniam, E Cayirci, Wireless sensornetworks: a survey. Comput. Netw. 38(4), 393–422 (2002)
28. G Pei, M Gerla, X Hong, LANMAR: landmark routing for large scale wirelessad hoc networks with group mobility, in Paper presented at the 1st ACMinternational symposium onmobile ad hoc networking and computing(Boston, MA, USA, 11 Aug, 2000), pp. 11–18
29. Tong F, Tang W, Peng LM, Xie R, Yang WH, Kim YC, A node-grade basedAODV routing protocol for wireless sensor network, in Paper presented atthe Paper presented at the second international conference on networkssecurity wireless communications and trusted computing (NSWCTC), vol. 2(Wuhan, Hubei, China, 24–25 April, 2010), pp. 180–183
30. A Marcus, O Marques, An eye on visual sensor networks. IEEE Potentials.31(2), 38–43 (2012)
31. F Bai, A Helmy, A survey of mobility models.Wireless Adhoc Networks.University of Southern California, USA 206 (2004)
32. E Onur, C Ersoy, Deliç H, How many sensors for an acceptable breachdetection probability Comput.Commun. 29(2), 173–182 (2006)
33. W Ye, J Heidemann, D Estrin, An energy-efficient MAC protocol forwireless sensor networks, in Paper presented at the IEEE twenty-first annualjoint conference of the IEEE Computer and Communications Societies(INFOCOM), vol. 3 (Hilton, NY, USA, 25–27 June, 2002), pp. 1567–1576
34. C Ford, I Stange, A framework for generalizing public safety videoapplications to determine quality requirements, in Paper presented at theIEEE conference onmultimedia communications, services, and security(Krakow Poland, May, 2010)
35. CC Loy, T Xiang, S Gong, Incremental activity modeling in multiple disjointcameras. IEEE Trans. Pattern Anal. Mach. Intell. 34(9), 1799–1813 (2012)
36. Bashir AK, Akbar AH, Chaudhary SA, Hussain CS, Kim KH, Collaborativedetection and agreement protocol for routing malfunctioning in wirelesssensor networks, in Paper presented at the 8th international conference onadvanced communication technology (ICACT), vol. 1 (Phoenix Park, Korea,20–22 Feb, 2006), pp. 327–332
37. Chandra S, Ellis CS, Vahdat A, Managing the storage and battery resourcesin an image capture device (digital camera) using dynamic transcoding,in Paper presented at the 3rd ACM international workshop on wireless mobilemultimedia (ACM) (Boston, MA, USA, 11 Aug, 2000), pp. 73–82
38. L Xu, S Zhang, Z He, Y Guo, The comparative study of three methods ofremote sensing image change detection, (Fairfax, VA, USA, 12-14 Aug, 2009),pp. 1–4
39. K Fall, K Varadhan, “The ns Manual (formerly ns Notes andDocumentation).The VINT Project, A collaboratoin between researchersat UC Berkeley, LBL, USC/ISI, and Xerox PARC.” (2002). September 16
40. K CT Aslan, R Bernardin, Stiefelhagen, Automatic calibration of cameranetworks based on local motion features, (France, 18 Oct, 2008)
41. SN Sinha, M Pollefeys, Camera network calibration and synchronizationfrom silhouettes in archived video. Int. J. Comput. Vis. 87(3), 266–283(2010)
42. Z Zhang, AMicro-Doppler Sonar for Acoustic Surveillance in Sensor Networks.Ph.D. dissertation, (2009). The Johns Hopkins University
doi:10.1186/1687-5281-2014-32Cite this article as: Jabbar et al.: VISTA: achieving cumulative VIsionthrough energy efficient Silhouette recognition of mobile Targetsthrough collAboration of visual sensor nodes. EURASIP Journal on Imageand Video Processing 2014 2014:32.
Submit your manuscript to a journal and benefi t from:
7 Convenient online submission
7 Rigorous peer review
7 Immediate publication on acceptance
7 Open access: articles freely available online
7 High visibility within the fi eld
7 Retaining the copyright to your article
Submit your next manuscript at 7 springeropen.com