research paper how cell wall complexity influences ... · amanda p. de souza1, claire l. alvim...
TRANSCRIPT

Journal of Experimental Botanydoi:10.1093/jxb/erv183This is an Open Access article distributed under the terms of the Creative Commons Attribution License (http://creativecommons.org/licenses/by/3.0/), which permits unrestricted reuse, distribution, and reproduction in any medium, provided the original work is properly cited.
RESEARCH PAPER
How cell wall complexity influences saccharification efficiency in Miscanthus sinensis
Amanda P. De Souza1, Claire L. Alvim Kamei2, Andres F. Torres2, Sivakumar Pattathil3, Michael G. Hahn3, Luisa M. Trindade2 and Marcos S. Buckeridge1,*1 Laboratory of Plant Physiological Ecology (LAFIECO), Department of Botany, Institute of Biosciences, University of São Paulo, Rua do Matão 277, Sao Paulo, SP, Brazil2 Wageningen UR Plant Breeding, Wageningen University and Research Centre, PO Box 386, 6700 AJ, Wageningen, The Netherlands3 BioEnergy Science Center, Complex Carbohydrate Research Center, The University of Georgia, 315 Riverbend Rd., Athens, GA 30602, USA
* To whom correspondence should be addressed. E-mail: [email protected]
Received 1 December 2014; Revised 17 March 2015; Accepted 23 March 2015
Abstract
The production of bioenergy from grasses has been developing quickly during the last decade, with Miscanthus being among the most important choices for production of bioethanol. However, one of the key barriers to producing bioethanol is the lack of information about cell wall structure. Cell walls are thought to display compositional differ-ences that lead to emergence of a very high level of complexity, resulting in great diversity in cell wall architectures. In this work, a set of different techniques was used to access the complexity of cell walls of different genotypes of Miscanthus sinensis in order to understand how they interfere with saccharification efficiency. Three genotypes of M. sinensis displaying different patterns of correlation between lignin content and saccharification efficiency were subjected to cell wall analysis by quantitative/qualitative analytical techniques such as monosaccharide composi-tion, oligosaccharide profiling, and glycome profiling. When saccharification efficiency was correlated negatively with lignin, the structural features of arabinoxylan and xyloglucan were found to contribute positively to hydrolysis. In the absence of such correlation, different types of pectins, and some mannans contributed to saccharification efficiency. Different genotypes of M. sinensis were shown to display distinct interactions among their cell wall components, which seem to influence cell wall hydrolysis.
Key words: Bioenergy, cell wall polysaccharides, lignin, recalcitrance, saccharification.
Introduction
The increase in the world’s population and economic activi-ties has resulted in a rising demand for energy (Krausmann et al., 2013). Currently, most of the energy used in the world is derived from fossil fuel resources, which also rep-resent the main source of CO2 emissions (Charles et al., 2007; Caspeta et al., 2013). In this context, second-genera-tion bioethanol constitutes a promising renewable alterna-tive to replace oil usage and to increase the world supply
of energy (Wyman, 2008; Buckeridge et al., 2010; Magrin et al., 2014).
Second-generation bioethanol production is based on plant biomass, and different species are being considered as promising bioenergy feedstocks (Sims et al., 2007; Buckeridge and Goldman, 2011; van der Weijde et al., 2013; De Souza et al., 2014). Miscanthus is among these species since it has a high potential as bioenergy feedstock, especially in the
© The Author 2015. Published by Oxford University Press on behalf of the Society for Experimental Biology. All rights reserved. For permissions, please email: [email protected]
Journal of Experimental Botany Advance Access published April 23, 2015 at U
niversity of Georgia L
ibraries on July 22, 2015http://jxb.oxfordjournals.org/
Dow
nloaded from

Page 2 of 15 | de Souza et al.
USA, Canada, Europe, and Asia. Important features of Miscanthus include high productivity, cold tolerance, and capacity to grow in saline soils (Lewandowski et al., 2003; Heaton et al., 2008; Smeets et al., 2009). Although the genus Miscanthus comprises ~17 species (Greef and Deuter, 1993), only the sterile triploid hybrid Miscanthus×giganteus is cur-rently commercialized (van der Weijde et al., 2013). Due to its sterility, M.×giganteus lacks genetic variation, which lim-its breeding for tolerance to environmental stresses and for traits related to biomass quality and bioethanol conversion (Zhao et al., 2014). In fact, besides displaying high yield and low-input requirements for water, nutrients, and pesticides, an ideal bioethanol feedstock should guarantee an efficient and cost-effective conversion of biomass into fermentable monosaccharides (De Souza et al., 2014). The fact that two out of the three subgenomes in M.×giganteus originate from M. sinensis, and the existence of large genetic diversity in the latter make M. sinensis an obvious breeding target to produce new varieties with improved biomass quality (Clifton-Brown et al., 2008; van der Weijde et al., 2013).
The major challenge in converting plant biomass into fer-mentable sugars to produce second-generation bioethanol is related to the intrinsic cell wall recalcitrance to hydrolysis (Himmel et al., 2007). This recalcitrance is commonly associ-ated with lignin content (Grabber, 2005; Lygin et al., 2011; Vanholme et al., 2012). Indeed, many authors have demon-strated that a decrease in lignin content and/or changes in lignin composition can improve biomass saccharification efficiency (Chen and Dixon 2007; Simmons et al., 2010; Jung et al., 2012; Acker et al., 2014). However, it has been shown that lignin is not the only cell wall component that influences enzymatic sacchar-ification (Ray et al., 2012; Torres et al., 2013; Costa et al., 2014; Marriot et al., 2014; Penning et al., 2014; Torres et al., 2014). Also, it has been suggested that the composition and arrange-ment of cell wall constituents (Pauly and Keegstra, 2008; Harris et al., 2009; Abramson et al., 2010; Le Ngoc Huyen et al., 2010; De Martini et al., 2014; Torres et al., 2014), as well as the fine structure (i.e. the distribution of sugar and/or non-sugar branching substituents in the main chain) of the polysaccha-rides (Buckeridge and De Souza, 2014), interfere with cell wall hydrolysis and therefore contribute to recalcitrance.
Miscanthus has cell walls typical of grasses (Le Ngoc Huyen et al., 2010; Lygin et al., 2011). Specifically, analysis of a collection of 102 accessions of M. sinensis showed that the cell walls are composed of 30–44% cellulose, 29–42% hemicellulose, and 7–21% lignin (Zhao et al., 2014). The most abundant cell wall monosaccharides in Miscanthus are glu-cose, xylose, and arabinose, the latter two originating primar-ily from arabinoxylan, which is the main hemicellulose of this plant (Le Ngoc Huyen et al., 2010; Lygin et al., 2011; Domon et al., 2013). Another hemicellulosic polysaccharide present in Miscanthus cell walls is the mixed linkage β-glucan that has been reported to account for 1.5% of the wall (Domon et al., 2013).
Xu et al. (2012) demonstrated that hemicelluloses are posi-tively correlated to the hexose yield upon saccharification of Miscanthus after pre-treatment with alkali and acid, whereas cellulose and lignin were negatively correlated. These authors propose the use of genetic engineering to increase hemicellulose
in Miscanthus, but did not examine which hemicellulose would be more beneficial to saccharification of Miscanthus biomass.
Although the composition of Miscanthus cell walls has been previously described and some authors have correlated the amount of hemicelluloses to a higher saccharification efficiency, most reports take into consideration the general classes of polymers in the wall and seldom examine hemicellu-loses or pectin polymers in detail. This could be important to help in explaining saccharification, as proposed by De Souza et al. (2013) for sugarcane walls, which are compositionally close to those of Miscanthus. Furthermore, the analysis of the fine structure of hemicellulosic polymers is also impor-tant due to the fact that these polymers are thought to hold a significant proportion of the complexity present in cell walls, which is partially due to the combination of monosaccha-rides and decorations with methyl, acetyl, and phenylpropa-noids (Buckeridge and De Souza, 2014).
Considering that more in-depth analyses of the complexity in Miscanthus cell walls have not yet been assessed, in the pre-sent work a series of genotypes of M. sinensis were analysed in order to evaluate the importance of the fine structure of the polysaccharides present in their cell walls for recalcitrance/saccharification of biomass. Combining different cell wall analytical techniques, the fine structure of Miscanthus cell wall polysaccharides is first described, and subsequently the role of pectins and hemicelluloses in hydrolysis/recalcitrance is discussed. It was found that when lignin is not correlated with saccharification efficiency, pectin and mannan epitopes detected in the glycome profiles seem to favour hydrolysis, whereas recalcitrance is mostly explained by certain epitopes of xyloglucan and arabinoxylan. However, when lignin is negatively correlated with saccharification efficiency, different epitopes of arabinoxylan, xyloglucan, and pectins contributed to hydrolysis, whereas another type of pectins, probably asso-ciated with lignin, contributed to recalcitrance. This work unravels part of the cell wall complexity involved in hydroly-sis, possibly helping to design future strategies for more effi-cient cell wall disassembly for bioenergy production.
Materials and methods
Plant materialSeven M. sinensis genotypes from the Miscanthus collection at Wageningen University and Research Centre (WUR) were selected based on their contrasting cell wall composition. Stems from five plants were harvested 4 weeks after the onset of heading, to ensure the analysis on full-grown stems. The collected samples were chopped and air-dried at 70 °C for 48 h, and were subsequently ground to a fine powder using a ball mill (Retsch, Haan, Germany). The cell walls of the seven genotypes were analysed for lignin, hemicelluloses, and cellulose contents, as well as for cell wall monosaccharide com-position. Three genotypes with contrasting compositions for cell wall polysaccharides were chosen for more in-depth analyses using cell wall fractionation and glycome profiling techniques.
Composition analyses of classes of polymers: cellulose, hemicellulose, and lignin
Neutral detergent fibre (NDF) and acid detergent fibre (ADF) components were determined as described by Torres et al. (2013). The lignin content was quantified by the acetyl bromide method,
at University of G
eorgia Libraries on July 22, 2015
http://jxb.oxfordjournals.org/D
ownloaded from
Miscanthus cell walls | Page 3 of 15
which uses the cell wall residue obtained from the NDF treat-ment to measure the extractable soluble lignin (AcBrLIG%). The determination of cellulose and hemicelluloses contents was based on the results obtained from the NDF, ADF, and lignin meth-ods. The NDF residue comprises hemicelluloses, cellulose, and lignin, whereas the ADF residue consists of cellulose and lignin. Thus, the content of cellulose was measured by subtracting the AcBrLIG% from the ADF% values, while the content of hemi-celluloses was determined by subtracting the ADF% from the NDF%. Three technical replicates were performed per genotype, and the lignin content was calculated using the formula given below and the extinction coefficient mentioned by Fukushima and Kerley (2011).
X
Y=
−( . ).0 009
23 077
Where, X=lignin concentration (mg/ml); Y=optical density read-ing; 0.009=mean intercept value; and 23.077=mean extinction coef-ficient obtained from Fukushima and Kerley (2011).
Cell wall preparationA 500 mg aliquot of each sample was subjected to six consecutives extractions with 25 ml of 80% (v/v) ethanol at 80 °C for 20 min. Each extraction was followed by centrifugation (10 min at 8500 g) and the supernatant was discarded to remove the soluble sugars. The sam-ples were subjected to an overnight extraction with 20 ml of 90% (v/v) dimethylsulphoxide (DMSO) with continuous stirring followed by centrifugation to remove starch. The remaining material, consist-ing of cell walls, was washed with distilled water and dried at 60 ºC for 24 h.
Cell wall fractionationIn order to solubilize polysaccharides, the cell walls were sub-jected to consecutive extractions with 0.5 M ammonium oxa-late (pH 7.0), sodium chlorite in 0.3% (v/v) acetic acid, and 0.1, 1.0, and 4.0 M NaOH as previously described in De Souza et al. (2013). All solubilized extracts were neutralized, dialysed to remove salts, and freeze-dried. The extract yields were obtained gravimetrically.
Monosaccharide compositionEach cell wall extract and intact cell wall sample was hydrolysed with 2 M trifluoroacetic acid (TFA) for 1 h at 100 °C. The acid was evaporated under vacuum and the monosaccharides were resus-pended in 2 ml of ultra-purified water. Monosaccharide profiles were analysed by high-performance anion exchange chromatog-raphy with pulsed amperometric detection (HPAEC-PAD) on a CarboPac SA10 column (DX-500 system, Dionex®) using a mixture of 99.2% water and 0.8% (v/v) 150 mM NaOH as eluent (1 ml min–1). The monosaccharides were detected with a post-column addition of base with 500 mM NaOH (1 ml min–1).
Oligosaccharide profilingThe oligosaccharide profiles were obtained by incubation of 1% (w/v) of each extract or intact cell wall sample with selected endo-glycanases in 50 mM sodium acetate buffer, pH 5.0 at 30 °C for 24 h. The substrates were incubated with xylanase (Sigma®, cat. X2753), lichenase (Megazyme®, cat. E-LICH), or GH12 xylo-glucan endoglucanase (XEG) according De Souza et al. (2013) in order to access the fine structures of arabinoxylan, β-glucan, and xyloglucan, respectively. The oligosaccharides produced were ana-lysed by HPAEC-PAD on a CarboPac PA-100 (ICS-3000 system,
Dionex®) using 88 mM NaOH and 200 mM sodium acetate as eluent (0.9 ml min–1) for 45 min.
Glycome profilingGlycome profiling analysis of the cell wall extracts was performed using an enzyme-linked immunosorbent assay (ELISA) test (Pattathil et al., 2012) with a comprehensive library of cell wall gly-can-directed monoclonal antibodies (Pattathil et al., 2010).
SaccharificationBiomass samples (50 mg) were thermochemically pre-treated at a 1.7% solids loading in 0.33% (w/v) sulphuric acid for 60 min at 110 °C. Reactions were carried out on a heating block using 15 ml Kimax glass tubes sealed with teflon-lined plastic caps. Following thermochemical treatment, liquors were removed by suction using a mechanical pipette.
Enzymatic saccharification of pre-treated samples was per-formed following a modified version of the Laboratory Analytical Procedure-009 from the National Renewable Energy Laboratory (NREL). Briefly, pre-treated samples were treated with 25 μl of an Accelerase 1500 cellulolytic enzyme cocktail (Genencor BV, Leiden, The Netherlands) in 10 ml of 0.1 M citrate buffer. The enzyme load provided 50 filter paper units (FPU) of cellulase per gram of cel-lulose. Samples were subsequently incubated at 50 °C in an Innova 42 air incubator (New Brunswick Scientific, Enfield, CT, USA) at 200 rpm for 24 h. Enzymatic saccharification liquors were analysed for glucose content using a Boehringer Mannheim d-Glucose kit (Boehringer Mannheim, Indianapolis, IN, USA). The colorimetric assay was adapted to a 96 microtitre plate format, and spectropho-tometric reads were made using a Bio-Rad 550 Micro-plate Reader (Bio-Rad, Richmond, CA, USA). For all samples, glucose content was expressed as both the amount of glucose released from dry bio-mass (Glc-Rel) and the percentage of total cell wall glucose released upon enzymatic saccharification (Glc-Con).
Data analysisDifferences among the genotypes (n=5) were analysed using a General Linear Model (GLM) followed by Tukey test with signifi-cance P<0.05.
In order to evaluate which cell wall components are likely to be more relevant to saccharification and to recalcitrance, a principal component analysis (PCA) was performed. The PCA considered only variables that were statistically different among genotypes, according to the results of the GLM analysis. In order to configure the glycome profiling data into a form that is suitable for PCA, the ELISA signals for antibodies that bound to a given class of poly-saccharide were averaged according to the colour code displayed in Supplementary Table S2 available at JXB online. PCA loadings were used to calculate the percentage contribution of each cell wall variable.
All data analysis was performed using the software Minitab®, ver-sion 14.1.
Results
Cell wall general composition and the choice of genotypes for polysaccharide analyses
The analysis of the general biomass composition of the seven M. sinensis genotypes showed different ranges of lignin, hemicelluloses, and cellulose contents within the group of genotypes analysed (Supplementary Fig. S1 at JXB online). As the goal of the present work was to analyse the possible
at University of G
eorgia Libraries on July 22, 2015
http://jxb.oxfordjournals.org/D
ownloaded from

Page 4 of 15 | de Souza et al.
role of polysaccharides in recalcitrance of M. sinensis cell walls, the three genotypes with the lowest lignin content (H0116, H0120, and H0198) (Supplementary Fig. S1A) were chosen for saccharification and more in-depth analyses of cell wall polysaccharides. Within this group of three genotypes, two different patterns were observed: (i) one genotype (H0198) with lower and two (H0116 and H0120) with higher hemicel-lulose content; and (ii) two genotypes (H0120 and H0198) with lower content and one (H0116) with higher cellulose content (Supplementary Figs. S1B, C). These three genotypes also showed some significant differences in monosaccharide compositions of their cell walls (Supplementary Table S1), which led to differences in their hexose:pentose ratio (H:P) (Supplementary Fig. S2). The H0120 genotype showed a lower H:P, while the H0116 genotype had a higher H:P.
Analyses of cell wall components of three genotypes of Miscanthus sinensis
Genotype H0198 had a lower hemicelluloses content (5.5%) in its cell walls than did the other two genotypes, H0120 and H0116 (Fig. 1A). This same trend was observed in wall frac-tion yields for H0198, where the 0.1 M and 1 M NaOH extracts yielded less material, although the difference between H0198 and H0120 was not significant (Fig. 2). The H0120 genotype had ~2.3% lower cellulose content than H0198 (Fig. 1B). Similarly, the yield of residue from the fractionation proce-dure of this genotype showed a tendency to be lower than H0116 and H0198. The ammonium oxalate extract of H0120 was significantly higher (Fig. 2), suggesting that this genotype is composed of a higher proportion of soluble polysaccha-rides than H0116 and H0198.
The lignin content was 7.5% and 4.4% lower in the H0116 genotype compared with H0198 and H0120, respectively
(Fig. 1C). No significant differences among genotypes were observed in NDF% and ADF% (Fig. 1D, E).
The analysis of monosaccharides by HPAEC/PAD revealed significant differences among the three genotypes associated with proportions of arabinose, galactose, glucose, rhamnose, and xylose in differents fractions. Fucose and mannose did not show any statistical differences among the three genotypes (Table 1).
Compared with H0120 and H0116, H0198 has a lower proportion of arabinose in the ammonium oxalate extract, a lower proportion of galactose in the sodium chlorite and 4 M NaOH extracts, a lower proportion of glucose and a higher proportion of xylose in the 0.1 M NaOH extract (Table 1).H0120 has higher percentages of arabinose and xylose in the ammonium oxalate -solubilized fraction compared with the other two genotypes, which is probably associated with the extraction of a more soluble arabinoxylan-like poly-mer. Concomitantly, H0120 has a much lower proportion of glucose in this same cell wall fraction (~80% lower than that in H0116 and H0198). H0116 has higher percentage of rhamnose in the ammonium oxalate extract and a lower pro-portion of xylose in this same cell wall fraction, suggesting that more pectin is being extracted in this fraction for this genotype (Table 1).
Oligosaccharide profiling
The oligosaccharides profiles obtained after digestion with lichenase showed that the mixed linkage β-glucan was extracted by sodium chlorite and sodium hydroxide (0.1, 1, and 4 M) during the preparation of cell wallextracts of all three genotypes, with the exception of the 4 M NaOH extract from H0120, in which no peaks associated with tri- or tet-rasaccharides were observed (Fig. 3). No evidence for the
Fig. 1. Contents of (A) hemicelluloses, (B) cellulose, (C) lignin, (D) neutral detergent fibre (NDF), and (E) acid detergent fibre (ADF) components of three different genotypes (H0120, H0116, and H0198) of Miscanthus sinensis. Different letters indicate statistically significant differences (n=5). (This figure is available in colour at JXB online.)
at University of G
eorgia Libraries on July 22, 2015
http://jxb.oxfordjournals.org/D
ownloaded from

Miscanthus cell walls | Page 5 of 15
presence of β-glucan in the residue (cellulose) remaining after the last base extraction was found by means of the oligo-saccharide analyses. However, evidence that some β-glucan might be present in the residue was obtained in the glycome profiles (see below).
The H0198 genotype yielded peaks related to tri- and tetrasaccharides, with lower intensity in all analysed frac-tions, suggesting that this genotype contains relatively less β-glucan. This is consistent with the lower content of glucose in the ammonium oxalate and 0.1 M NaOH extracts found in the H0198 genotype (Table 1), but contradictory to what
has been observed in the glycome profiles. On the other hand, both H0120 and H0116 seem to have similar amounts of β-glucan, although the proportions among the extracts are different. H0116 yielded greater peaks in the 0.1 M NaOH, extract whereas the higher peaks in H0120 were observed in the 1 M NaOH -solubilized fraction (Fig. 3), denoting differ-ences in polysaccharide extractability and/or binding to other polymers between these two genotypes.
Cell wall extracts were also treated with endo-β-xylanase, an enzyme that cleaves β-1,4 linkages in the unbranched portions of the arabinoxylan main chain. The oligosaccha-ride profiles showed no significant differences among geno-types, suggesting that arabinoxylan fine structures could be quite similar for the three genotypes (Supplementary Fig. S3 at JXB online). Although in low proportions compared with β-glucan and arabinoxylan, xyloglucan oligosaccha-rides released after digestion with XEG (GH12) showed slight differences among genotypes. Xyloglucan was lower in the sodium chlorite and 4 M NaOH extracts in the H0120 genotype. The H0116 genotype yielded higher peaks related to xyloglucan in the 4 M NaOH extract, with concomitant lower peaks in the 1 M NaOH extract, which suggests the presence of relatively more xyloglucans possibly bound to cellulose in this genotype. Despite those differences, it was not possible to identify the types of oligosaccharides released by XEG (Supplementary Fig. S4).
Glycome profiling
The glycome profiles of cell wall extracts showed signifi-cant differences in the pattern and extractability of diverse glycan epitopes present in these three genotypes (Fig. 4; Supplementary Table S2 at JXB online). Specifically, the
Fig. 2. Cell wall extracts yield (%) of three different genotypes (H0120, H0116, and H0198) of Miscanthus sinensis. Different letters indicate statistically significant differences (n=5). (This figure is available in colour at JXB online.)
Table 1. Monosaccharides (%) from the cell wall extracts of three different genotypes (H0120, H0116, and H0198) of Miscanthus sinensis. Statistically significant differences are shown in bold (n=5).
Cell wall extracts Genotypes Monosaccharides (%)
Arabinose Fucose Galactose Glucose Mannose Rhamnose Xylose
Ammonium oxalate H0120 11.11 ± 0.65 a 0.11 ± 0.02 2.76 ± 1.08 7.31 ± 2.33 a 0.31 ± 0.20 0.02 ± 0.01 a 78.37 ± 4.23 aH0116 9.03 ± 1.34 a,b 0.06 ± 0.01 3.91 ± 1.12 39.57 ± 4.64 b 0.72 ± 0.28 0.26 ± 0.09 b 46.45 ± 4.66 bH0198 6.57 ± 1.31 b 0.11 ± 0.07 2.37 ± 0.44 42.93 ± 11.74 b 0.35 ± 0.05 0.12 ± 0.04 c 56.50 ± 5.16 b
Sodium chorite H0120 12.36 ± 0.21 0.11 ± 0.03 1.84 ± 0.11 a 4.08 ± 0.34 0.16 ± 0.03 0.08 ± 0.02 81.14 ± 0.30H0116 11.82 ± 0.38 0.08 ± 0.02 1.63 ± 0.04 a 8.16 ± 1.57 0.08 ± 0.05 0.06 ± 0.01 78.17 ± 1.35H0198 10.98 ± 0.78 0.07 ± 0.02 1.35 ± 0.10 b 8.55 ± 2.41 0.17 ± 0.01 0.04 ± 0.03 78.84 ± 1.79
0.1 M NaOH H0120 13.01 ± 0.47 0.10 ± 0.03 1.37 ± 0.04 1.06 ± 0.08 a,b 0.04 ± 0.01 0.04 ± 0.02 84.38 ± 0.44 a,bH0116 13.53 ± 0.59 0.13 ± 0.01 1.29 ± 0.08 1.73 ± 0.34 a 0.09 ± 0.03 0.10 ± 0.04 83.13 ± 0.45 bH0198 12.40 ± 0.50 0.13 ± 0.01 1.30 ± 0.03 0.77 ± 0.09 b 0.05 ± 0.01 0.07 ± 0.03 85.30 ± 0.56 a
1 M NaOH H0120 7.41 ± 0.44 0.13 ± 0.03 0.40 ± 0.04 0.96 ± 0.10 0.11 ± 0.05 0.06 ± 0.02 a 90.93 ± 0.37H0116 7.35 ± 0.18 0.11 ± 0.02 0.39 ± 0.02 1.10 ± 0.24 0.02 ± 0.01 0.05 ± 0.00 a 90.99 ± 0.20H0198 7.56 ± 0.29 0.14 ± 0.02 0.33 ± 0.03 0.71 ± 0.09 0.12 ± 0.03 0.11 ± 0.02 b 91.03 ± 0.41
4 M NaOH H0120 6.43 ± 0.22 0.03 ± 0.01 0.89 ± 0.05 a 4.17 ± 0.91 0.25 ± 0.03 0.04 ± 0.01 88.20 ± 0.81H0116 6.62 ± 0.08 0.03 ± 0.01 0.91 ± 0.04 a 4.40 ± 0.75 0.27 ± 0.04 0.02 ± 0.01 87.75 ± 0.75H0198 6.25 ± 0.15 0.03 ± 0.00 0.62 ± 0.03 b 3.76 ± 0.23 0.22 ± 0.02 0.02 ± 0.01 89.10 ± 0.39
Residue H0120 2.69 ± 0.72 0.56 ± 0.18 0.84 ± 0.32 83.12 ± 4.14 0.41 ± 0.13 ND 12.38 ± 3.87H0116 2.79 ± 1.17 0.67 ± 0.12 1.08 ± 0.67 86.21 ± 4.35 0.37 ± 0.02 ND 8.81 ± 2.64H0198 1.49 ± 0.28 0.53 ± 0.15 0.44 ± 0.13 89.81 ± 2.24 0.34 ± 0.11 ND 7.34 ± 1.85
at University of G
eorgia Libraries on July 22, 2015
http://jxb.oxfordjournals.org/D
ownloaded from

Page 6 of 15 | de Souza et al.
overall profiles of H0120 and H0116 are quite similar, and clearly distinct from the overall profile for H0198. For exam-ple, epitopes recognized by the xylan-5 clade of antibodies
are absent in the sodium chlorite extract of the H0120 and H0116 genotypes, but present in H0198 (Fig. 4, yellow boxes). In contrast, the H0120 and H0116 genotypes appear to lack
Fig. 3. Oligosaccharide profiles obtained using lichenase (for detection of β-glucan) of cell wall fractions of stems of three different genotypes (H0120, H0116, and H0198) of Miscanthus sinensis. (a) Trisaccharides, (b) tetrasaccharides, and (c) pentasaccharide. Missing chromatograms from the ammonium oxalate extract of the H0116 and H0198 genotypes are due to the low amount of sample in this extract Data on chromatograms are the average of three biological replicates.
at University of G
eorgia Libraries on July 22, 2015
http://jxb.oxfordjournals.org/D
ownloaded from

Miscanthus cell walls | Page 7 of 15
any mannan or β-glucan epitopes, while both sets of epitopes are clearly abundant in extracts of the H0198 genotype (Fig. 4, white boxes). The H0120 and H0116 genotypes had significantly higher levels of xyloglucan epitopes released in the oxalate extract than did the H0198 genotype (Fig. 4, orange boxes). H0116 appeared to contain higher levels of xyloglucan epitopes overall than did the other two genotypes (Fig. 4, green box). A few arabinogalactan-directed antibod-ies showed higher binding to wall extracts of H0198 [two anti-bodies in the middle of the rhamnogalacturonan I (RG-I)/
arabinogalactan (AG) group and one in the AG-2 group] than were observed in extracts from the other two genotypes (Fig. 4, red boxes).
Saccharification
The saccharification efficiency of stems differed significantly among genotypes (Fig. 5). The H0198 genotype yielded the highest percentage of glucose conversion (22%) from the total available cell wall glucose (Fig. 5A). On the other hand,
Fig. 4. Glycome profiles of each cell wall extract of three different genotypes (H0120, H0116, and H0198) of Miscanthus sinensis. On the right, the groups of antibodies used are shown, identified according to the polysaccharides predominantly recognized by each group. Coloured boxes indicate the main statistically significant differences among genotypes (n=5). See Supplementary Table S2 at JXB online for additional details about the individual antibodies used and statistics.
at University of G
eorgia Libraries on July 22, 2015
http://jxb.oxfordjournals.org/D
ownloaded from

Page 8 of 15 | de Souza et al.
H0120 was the genotype that showed the lowest values of glu-cose conversion (12%). The same pattern of saccharification efficiency was observed when the data were expressed by the amount of glucose released from 1 g of dry biomass (Fig. 5B).
Lignin affected saccharification efficiency of cell walls of the three genotypes differently (Fig. 6). Whereas H0116 and H0120 showed a clear negative correlation between sacchari-fication efficiency and the percentage of lignin, the same was not observed for the H0198 genotype. This raised the ques-tion of whether in certain cases other factors such as poly-saccharide composition might interfere more strongly with saccharification efficiency.
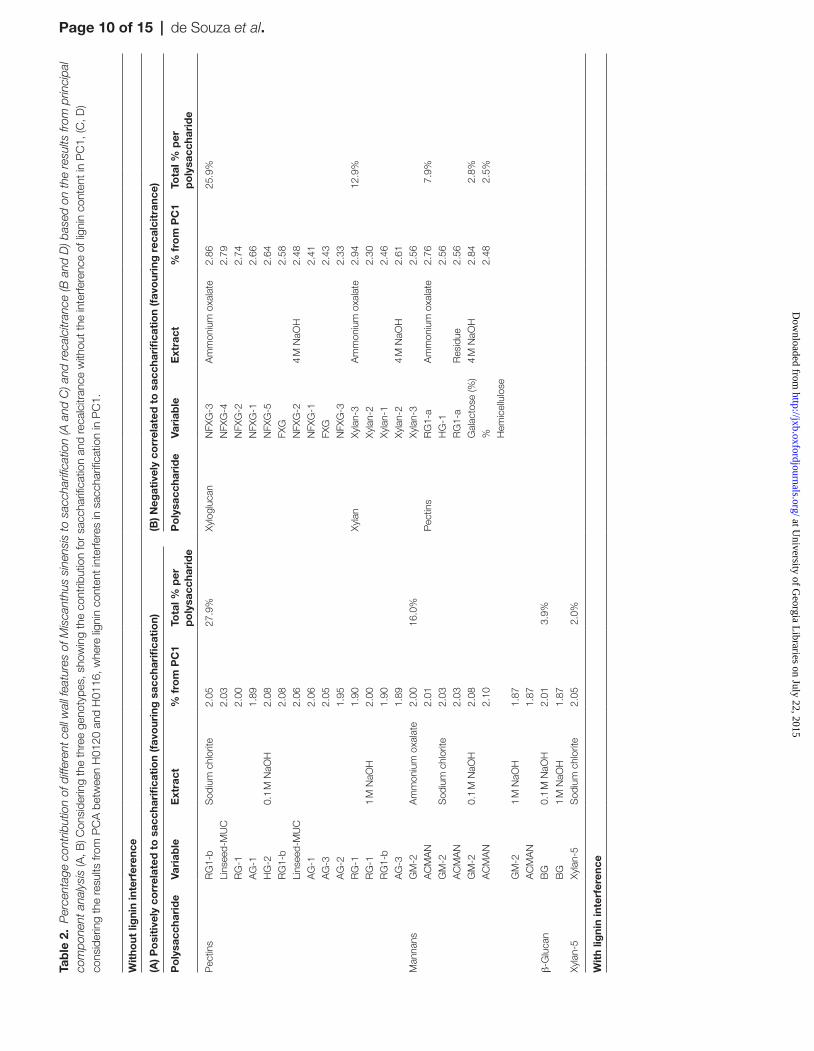
In order to check this hypothesis, a PCA considering all cell wall components found to be statistically significant among genotypes was performed. The PCA revealed clear differ-ences among the three genotypes, with PC1 contributing with 47% of the total variation (Fig. 7A). PC1 distinguished H0198 from the other two genotypes. At the same time, this principal component also displays the highest contribu-tion for saccharification efficiency (Supplementary Table S3 at JXB online). This makes PC1 the most adequate compo-nent to distinguish features of cell wall polysaccharides cor-related to saccharification or recalcitrance. Therefore, the percentages contributions to saccharification or recalcitrance (Table 2) were calculated from PC1 loadings (Supplementary Table S3). The variables chosen as the highest influences on either feature were the ones in the top 50% of the PC1. Among these selected variables, the 25 favouring saccharification efficiency were monoclonal antibodies detecting epitopes in polysaccharides belonging to the classes of pectins (~28%), mannans (16%), β-glucan (~4%), and xylan-5 (2%) (Table 2A). These variables are associated mainly with the 0.1 M NaOH- and sodium chlorite -solubilized cell wall fractions. Twenty variables were shown to be associated with higher recalcitrance, corresponding to different variables and epitopes, including: xyloglucan (~26%), xylans (~13%), pectins (~8%), and galac-tose in the 4 M NaOH extract (2.8%), and the percentage of hemicelluloses (2.5%) (Table 2B). The xylans and xyloglucans related to recalcitrance are associated with the ammonium oxa-late- and 4 M NaOH -solubilized wall fractions. Additionally, some pectins present in the ammonium oxalate extract and the residue seem to be related to recalcitrance. Although xylans and
pectins are also present in the group of variables that favours saccharification efficiency, the cell wall fractions from which these polysaccharides were released were completely differ-ent (e.g. pectins released from sodium chlorite, and 0.1 M and 1 M NaOH cell wall extracts favour saccharification efficiency, while pectins from ammonium oxalate -solubilized and residue wall fractions favour recalcitrance). Moreover, it is possible to observe differences in antibody epitopes related to saccharifica-tion efficiency and recalcitrance.
When the same type of analysis was carried out comparing the genotypes H0120 and H0116 (Fig. 7B; Supplementary Table S4 at JXB online), both displaying the influence of lignin on hydrolysis/recalcitrance (Fig. 6), it was found that different types of xylans, mainly present in the 0.1 M NaOH- and oxalate -solubilized wall fractions, favoured hydrolysis (Table 2C), whereas recalcitrance was favoured by the lignin content, with the main polysaccharide fraction affected displaying epitopes of pectins present in the chlo-rite extract(Table 2D).
Fig. 5. Saccharification of three different genotypes (H0120, H0116, and H0198) of Miscanthus sinensis. (A) Percentage of the total cell wall glucose released after enzymatic hydrolysis (Glc-Con); (B) amount of glucose released based on dry biomass (Glc-Rel). (This figure is available in colour at JXB online.)
Fig. 6. Linear regression between lignin content (%) and saccharification efficiency (%) of three different genotypes (H0120, H0116, and H0198) of Miscanthus sinensis. (This figure is available in colour at JXB online.)
at University of G
eorgia Libraries on July 22, 2015
http://jxb.oxfordjournals.org/D
ownloaded from

Miscanthus cell walls | Page 9 of 15
Discussion
Although there are several publications in which the cell walls of Miscanthus have been analysed for their composition (Hodgson et al., 2010; Le Ngoc Huyen et al., 2010; Allison et al., 2011; Domon et al., 2013; Zhao et al., 2014), the fine structure of its cell wall polymers has not been assessed. It has already been suggested that the fine structure of poly-saccharides could play a role in saccharification efficiency, because it is associated with the motifs that will be available to enzyme action (Buckeridge and De Souza, 2014).
In the present work, the cell wall composition of seven genotypes of M. sinensis was evaluated. The contents of cel-lulose, hemicelluloses, and lignin (Supplementary Fig. S1 at JXB online) were found to correspond to those described in the literature (Zhao et al., 2014). Furthermore, signifi-cant differences were also found in the H:P ratio in cell walls (Supplementary Fig. S2). The three genotypes that have lower contents of lignin (14–15.5%) and contrasting H:P ratios were chosen for a more in-depth evaluation of cell wall components, fine structure of cell wall polysaccharides, and saccharification efficiency. Cell walls were fractionated and the fractions were evaluated by monosaccharide analysis, oligosaccharide profiling, and glycome profiling using mono-clonal antibodies. The different techniques used in this work showed different and complementary features of the cell wall fine structure of M. sinensis that were integrated in order to characterize some aspects of the composition and architec-ture related to saccharification efficiency and to recalcitrance.
Fine structural features of Miscanthus sinensis cell walls
The results showed that the fine structure of arabinoxylan, the main hemicellulose of Miscanthus (Table 1; Le Ngoc Huyen et al., 2010; Lygin et al., 2011), is very similar in the three gen-otypes analysed, with a series of arabinoxylan oligosaccha-rides and a similar proportion of groups of oligosaccharides
containing arabinose side chain decorations (Supplementary Fig. S3 at JXB online). Although there are similarities in ara-binoxylan oligosaccharide profiles among genotypes, a sig-nificant difference in the xylan-5 group of antibodies (Fig. 4) was found in the sodium chlorite extract between H0120/H0116 and H0198. Similarly to sugarcane, which showed no or very low cross-reaction with xylan-5 antibodies in the sodium chlorite extract (De Souza et al., 2013), H0120 and H0116 did not show any binding to this group of antibod-ies. The xylan-5 group of antibodies recognizes a 4-O-methyl GlcA side chain epitope in the context of an otherwise unmodified xylan backbone of at least four xylosyl residues (R. Clay, U. Avci, S. Pattathil. and M.G. Hahn, unpublished results). The presence of acetyl substituents on the xylan backbone blocks binding of this clade of antibodies (U. Avci and M.G. Hahn, unpublished data). Therefore, it is possible that the arabinoxylan residues present in the sodium chlorite extract of H0120 and H0116 are more acetylated than those present in H0198. Alternatively, it might be possible that the positioning of the arabinosyl branching could be different in H0198. These hypotheses will need confirmation with further and more in-depth analyses of polysaccharide fine structure.
According to the wall extract yield and monosaccharide results, arabinoxylan is present mainly in the 4 M NaOH cell wall extracts (Fig. 2; Table 1). However, the endo-β-xylanase used for oligosaccharide profiling and the monoclonal anti-bodies used for glycome profiling were not effective at detect-ing these polymers in these fractions (Fig. 4; Supplementary Fig. S3 at JXB online), suggesting that the arabinoxylans pre-sent in the 4 M NaOH extract probably differ considerably from the arabinoxylans extracted in the more soluble frac-tions. Although not detected by the endo-β-xylanase used, arabinoxylans are also present in the residue (Fig. 4; Table 1), suggesting that some of them may be strongly bound to cel-lulose microfibrils, as already proposed for maize and sugar-cane (Kozlova et al., 2014; Buckeridge et al., 2015).
β-glucan, another major constituent of the cell wall of grasses, is present in several cell wall extracts of the three
Fig. 7. Principal component analysis (PCA) of the cell wall variables that showed statistically significant differences according to GLM results (P<0.05). (A) Data from the three genotypes showing the saccharification vector separating mainly the H0198 genotype from the others at PC1. (B) Data from H0120 and H0116 genotypes (both inversely correlated with lignin content) showing the saccharification vector at PC1. P-values indicate statistically significant differences of PCs. (This figure is available in colour at JXB online.)
at University of G
eorgia Libraries on July 22, 2015
http://jxb.oxfordjournals.org/D
ownloaded from
Page 10 of 15 | de Souza et al.
Tab
le 2
. P
erce
ntag
e co
ntrib
utio
n of
diff
eren
t cel
l wal
l fea
ture
s of
Mis
cant
hus
sine
nsis
to s
acch
arifi
catio
n (A
and
C) a
nd r
ecal
citr
ance
(B a
nd D
) bas
ed o
n th
e re
sults
from
prin
cipa
l co
mpo
nent
ana
lysi
s (A
, B) C
onsi
derin
g th
e th
ree
geno
type
s, s
how
ing
the
cont
ribut
ion
for
sacc
harifi
catio
n an
d re
calc
itran
ce w
ithou
t the
inte
rfere
nce
of li
gnin
con
tent
in P
C1,
(C, D
) co
nsid
erin
g th
e re
sults
from
PC
A b
etw
een
H01
20 a
nd H
0116
, whe
re li
gnin
con
tent
inte
rfere
s in
sac
char
ifica
tion
in P
C1.
Wit
hout
lig
nin
inte
rfer
ence
(A) P
osi
tive
ly c
orr
elat
ed t
o s
acch
arifi
cati
on
(fav
our
ing
sac
char
ifica
tio
n)(B
) Neg
ativ
ely
corr
elat
ed t
o s
acch
arifi
cati
on
(fav
our
ing
rec
alci
tran
ce)
Po
lysa
ccha
rid
eVa
riab
leE
xtra
ct%
fro
m P
C1
Tota
l % p
er
po
lysa
ccha
rid
eP
oly
sacc
hari
de
Vari
able
Ext
ract
% f
rom
PC
1To
tal %
per
p
oly
sacc
hari
de
Pec
tins
RG
1-b
Sod
ium
chl
orite
2.05
27.9
%Xy
logl
ucan
NFX
G-3
Am
mon
ium
oxa
late
2.86
25.9
%Li
nsee
d-M
UC
2.03
NFX
G-4
2.79
RG
-12.
00N
FXG
-22.
74A
G-1
1.89
NFX
G-1
2.66
HG
-20.
1 M
NaO
H2.
08N
FXG
-52.
64R
G1-
b2.
08FX
G2.
58Li
nsee
d-M
UC
2.06
NFX
G-2
4 M
NaO
H2.
48A
G-1
2.06
NFX
G-1
2.41
AG
-32.
05FX
G2.
43A
G-2
1.95
NFX
G-3
2.33
RG
-11.
90Xy
lan
Xyla
n-3
Am
mon
ium
oxa
late
2.94
12.9
%R
G-1
1 M
NaO
H2.
00Xy
lan-
22.
30R
G1-
b1.
90Xy
lan-
12.
46A
G-3
1.89
Xyla
n-2
4 M
NaO
H2.
61M
anna
nsG
M-2
Am
mon
ium
oxa
late
2.00
16.0
%Xy
lan-
32.
56A
CM
AN
2.01
Pec
tins
RG
1-a
Am
mon
ium
oxa
late
2.76
7.9%
GM
-2S
odiu
m c
hlor
ite2.
03H
G-1
2.56
AC
MA
N2.
03R
G1-
aR
esid
ue2.
56G
M-2
0.1
M N
aOH
2.08
Gal
acto
se (%
)4
M N
aOH
2.84
2.8%
AC
MA
N2.
10%
H
emic
ellu
lose
2.48
2.5%
GM
-21
M N
aOH
1.87
AC
MA
N1.
87
β-G
luca
nB
G0.
1 M
NaO
H2.
013.
9%
BG
1 M
NaO
H1.
87Xy
lan-
5Xy
lan-
5S
odiu
m c
hlor
ite2.
052.
0%
Wit
h lig
nin
inte
rfer
ence
at University of G
eorgia Libraries on July 22, 2015
http://jxb.oxfordjournals.org/D
ownloaded from

Miscanthus cell walls | Page 11 of 15
(C) P
osi
tive
ly c
orr
elat
ed t
o s
acch
arifi
cati
on
(fav
our
ing
sac
char
ifica
tio
n)(D
) Neg
ativ
ely
corr
elat
ed t
o s
acch
arifi
cati
on
(fav
our
ing
rec
alci
tran
ce)
Po
lysa
ccha
rid
eVa
riab
leE
xtra
ct%
fro
m P
C1
Tota
l % p
er
po
lysa
ccha
rid
eP
oly
sacc
hari
de
Vari
able
Ext
ract
% f
rom
PC
1To
tal %
per
p
oly
sacc
hari
de
Xyla
nXy
lan-
4A
mm
oniu
m o
xala
te1.
8419
.8%
Pec
tins
AG
-1S
odiu
m c
hlor
ite3.
3128
.2%
Xyla
n-7
1.79
AG
-23.
75Xy
lan-
50.
1 M
NaO
H2.
19A
G-3
3.56
Wit
h lig
nin
inte
rfer
ence
(C) P
osi
tive
ly c
orr
elat
ed t
o s
acch
arifi
cati
on
(fav
our
ing
sac
char
ifica
tio
n)(D
) Neg
ativ
ely
corr
elat
ed t
o s
acch
arifi
cati
on
(fav
our
ing
rec
alci
tran
ce)
Po
lysa
ccha
rid
eVa
riab
leE
xtra
ct%
fro
m P
C1
Tota
l % p
er
po
lysa
ccha
rid
eP
oly
sacc
hari
de
Vari
able
Ext
ract
% f
rom
PC
1To
tal %
per
p
oly
sacc
hari
de
Xyla
n-6
2.16
AG
-43.
87Xy
lan-
71.
91R
G/A
G3.
75Xy
lan-
11
M N
aOH
1.95
Lins
eed-
MU
C3.
45Xy
lan-
42.
16A
G-1
4 M
NaO
H3.
22Xy
lan-
52.
10H
G-2
Res
idue
3.25
Xyla
n-6
2.06
Xyla
nXy
lan-
1A
mm
oniu
m o
xala
te2.
899.
6%Xy
lan-
14
M N
aOH
1.7
Xyla
n-1
Sod
ium
chl
orite
3.05
Xylo
gluc
anFX
GA
mm
oniu
m o
xala
te1.
9416
.9%
Xyla
n-2
4 M
NaO
H2.
89N
FXG
-21.
94β-
Glu
can
BG
1 M
NaO
H3.
396.
7%
FXG
1 M
NaO
H1.
78B
GR
esid
ue3.
33N
FXG
-12.
08Xy
lose
(%)
Am
mon
ium
oxa
late
3.33
3.3%
NFX
G-2
1.83
Lign
in (%
)2.
973.
0%N
FXG
-41.
81N
FXG
-51.
87N
FXG
-61.
95N
FXG
-64
M N
aOH
1.73
Pec
tins
Lins
eed-
MU
C0.
1 M
NaO
H1.
769.
3%R
G1-
b1
M N
aOH
2.06
HG
-11.
94Li
nsee
d-M
UC
1.83
RG
/AG
1.73
Glu
cose
(%)
Am
mon
ium
oxa
late
2.02
2.0%
Tab
le 2
. C
ontin
ued
at University of G
eorgia Libraries on July 22, 2015
http://jxb.oxfordjournals.org/D
ownloaded from

Page 12 of 15 | de Souza et al.
genotypes (Fig. 3), suggesting that this polysaccharide has dif-ferent degrees of solubility in M. sinensis cell walls. Although Kiemle et al. (2014) demonstrated that β-glucan could inter-act directly with cellulose, the low amount of β-glucan in the 4 M NaOH cell wall extracts of M. sinensis indicates that β-glucan is less strongly bound to the cellulose–arabinoxylan complex in this species. This result is similar to what has been observed for sugarcane (De Souza et al., 2013).
It was also observed that β-glucan could not be detected by monoclonal antibodies in the glycome profile in either H0120 or H0116 (Fig. 4), although it could be detected by oligo-saccharide profiling in most cell wall extracts in these two genotypes (Fig. 3). A possible explanation for this difference in detection might be related to the fact that the antibodies bind to epitopes by recognizing relatively larger regions of the main chain in comparison with the lichenase. The molecular weight of β-glucan in H0120 and H0116 could be lower than that in the H0198 genotype, so that the antibody was only able to bind in the β-glucan from the H0198 genotype. It is known that glycans must have a certain size to bind to the ELISA plates, but this hypothesis remains to be investigated.
As expected for the cell wall of grasses, xyloglucan is pre-sent in relatively small proportions in the cell walls of the three genotypes of M. sinensis. The oligosaccharide profiles show a higher amount of xyloglucan released from sodium chlorite and 0.1 M NaOH extracts (Supplementary Fig. S4 at JXB online). This pattern is different from what was found in sugarcane stems, where xyloglucan oligosaccharides were released mainly in the 0.1 M and 4 M NaOH extracts (De Souza et al., 2013). The presence of a higher amount of xylo-glucan in the sodium chlorite extract suggests that at least these three analysed genotypes of M. sinensis have xyloglucan that might be branched with phenylpropanoids and/or lignin. Although the oligosaccharide profile showed the presence of xyloglucan in the sodium chlorite and 0.1 M NaOH extracts, this polysaccharide was not recognized by the monoclonal antibodies (Fig. 4), which could indicate some differences in molecular weights in the same way that was explained above for β-glucans. On the other hand, xyloglucan was detected using the monoclonal antibodies in the oxalate extracts of the genotypes H0120 and H0116 (Fig. 4), but these obser-vations were not confirmed when the oxalate extracts were treated with XEG (Supplementary Fig. S4), suggesting that although the xyloglucan polymer is present in these extracts, it probably displays a fine structure (e.g. branches with phe-nylpropanoids and/or with acetyl esters) that prevents attack of the enzyme on the main chain. Though in lower amount, some of the xyloglucans also seem to be more closely asso-ciated with cellulose as it is only extracted with higher con-centrations of alkali (Fig. 4; Supplementary Fig. S3 at JXB online). This xyloglucan might be, as proposed by Buckeridge et al. (2005), one of the polymers tethering the cellulose microfibrils into cellulose macrofibrils. According to the pre-sent results, the fine structure of xyloglucans in M. sinensis appears to be quite complex, pointing to the possibility that there is some more soluble xyloglucan, along with xyloglu-cans more strongly bound to cellulose and to one another in the walls. Further studies capable of characterizing these
xyloglucan classes structurally, as well as the manner of their interactions with monoclonal antibodies, are needed in order to clarify how xyloglucans participate in the wall assembly in M. sinensis.
Relatively little mannose was detected in the cell wall frac-tions of M. sinensis analysed (Table 1). In fact, mannans are minor components of cell walls of grasses (Vogel, 2008; Schröder et al., 2009), and usually there is no binding with groups of antibodies related to (galacto-)mannans in this type of plant (De Souza et al., 2013; DeMartini et al., 2013). However, epitopes for several monoclonal antibodies specific for the acetylated mannan and in the galactomannan-2 anti-body groups cross-reacted exclusively with polymers present in cell wall extracts of the H0198 genotype (Fig. 4), suggest-ing that these polysaccharides are present in this genotype.
Most of the pectin polymers were released in the ammo-nium oxalate extract (Fig. 4). Considering the ammonium oxalate extract yield (Fig. 2) and also the monosaccharide composition (Table 1), pectin polysaccharides are present in the walls of M. sinensis in rather low proportions. However, the H0120 genotype showed a higher ammonium oxalate extract yield than the other two genotypes (Fig. 2). Similarly to sugarcane (De Souza et al., 2013), homogalacturonan (HG), RG-I, and AGs are the main components found in M. sinensis (Fig. 4). The amount of arabinose detected in the ammonium oxalate extract (Table 1) suggests that some ara-binan chains could be attached to RG-I.
The overall analysis of cell walls of M. sinensis indicates that although the walls of this plant are very similar to those of other grasses in terms of large classes of polymers (cel-lulose, hemicelluloses, pectins, and lignin), the fine structure probed with oligosaccharide and glycome profiles suggests a complexity that differs from that of other grass species. This hypothesis is corroborated by the fact that the comparisons made with sugarcane revealed that the two species seem to show some differences regarding the fine structures of arabi-noxylans, xyloglucans, β-glucans, and pectins. Furthermore, the more in-depth analysis of the fine structure of M. sinensis cell walls demonstrates that subtle changes in epitopes appear to exist among genotypes. Thus, a question that arises from these observations is whether such fine structural differences would be involved on the liability of M. sinensis cell walls to hydrolysis aiming at bioenergy production.
Influence of cell wall polysaccharide fine structure on saccharification efficiency and recalcitrance of Miscanthus sinensis
The comparison among three genotypes (H0120, H0116, and H0198) with different levels of lignin subjected to saccharifica-tion revealed that lignin can influence hydrolysis up to a cer-tain level. For H0120 and H0116, saccharification efficiency was negatively correlated to lignin, whereas for H0198 no such correlation was observed at all (Fig. 6). Thus, the higher sac-charification efficiency of H0198 can be thought of as being cor-related to cell wall polysaccharides, with little or no influence of lignin. Although, the H0198 genotype contains ~3% more cel-lulose than the H0120 genotype (Fig. 1B), this does not explain
at University of G
eorgia Libraries on July 22, 2015
http://jxb.oxfordjournals.org/D
ownloaded from

Miscanthus cell walls | Page 13 of 15
the differences in saccharification efficiency. Indeed, the sac-charification efficiency is 100% higher in H0198 compared with H0120. (Fig. 5A)
This pattern made possible a more in-depth investigation of which polysaccharide features might be associated with higher saccharification efficiency in a biomass where lignin has low or no influence, namely the genotype H0198 in comparison with the other two genotypes. The top 50% variables in PC1 (Table 2A, 2B) showed that pectins are the most important variable, corresponding to 27.9% of all variables that favour saccharification of biomass of the H0198 genotype. These pec-tins are related to RG-I and AG polymers present specifically in the sodium chlorite, 0.1 M NaOH, and 1 M NaOH extracts (Table 2A). In switchgrass, the removal of enzyme-accessible pectins by treatment with endopolygalacturonase (EPG) and pectin-methylesterase (PME) did not influence the saccharifica-tion (De Martini et al., 2013). However, the RG-Is and AGs that are likely to influence saccharification efficiency in M. sinensis in the present study are released in the 0.1 M and 1 M NaOH extracts, suggesting that the major influence of pectins in sac-charification efficiency is related to the pectic polymers more strongly bound to other cell wall components. Even when the influence of lignin content on saccharification efficiency is con-sidered (i.e. analysing the principal components of H0120 and H0116), some epitopes in the polymer RG-I associated with the 1 M NaOH extract seem to favour saccharification (Table 2C). Polymers released by sodium chlorite extraction are probably associated with lignin, since sodium chlorite is the fractionation step that leads to detachment of lignin from polysaccharides by breaking the ester linkages within the wall. Pectins containing AG epitopes in the sodium chlorite extract are the most abun-dant contributors to recalcitrance when lignin is highly corre-lated to saccharification efficiency (Table 2D), suggesting that these polymers might be associated with lignin in the M. sinen-sis cell walls, promoting a barrier to saccharification. Also in the cases where the lignin content has no correlation to sacchari-fication efficiency (Table 2A), AG-1 as well as RG-I epitopes released in the sodium chlorite extract display a contribution to saccharification efficiency.
Although mannans appear to be present in very small propor-tions in the walls of M. sinensis, acetylated mannan and galacto-mannan-2 epitopes present in the ammonium oxalate-, sodium chlorite-, 0.1 M NaOH-, and 1 M NaOH -solubilized cell wall fractions explained 16% of the variation of PC1 that favoured saccharification in H0198. The presence of soluble β-glucans in the 0.1 M and 1 M NaOH extracts when the lignin content did not interfere in saccharification also contributed (~4%) to the saccharification efficiency (Table 2A). On the other hand, in genotypes where lignin influences the saccharification efficiency (e.g. in H0120 and H0116), β-glucans present in the 1 M NaOH extract appear to be a variable that contributed to recalcitrance (Table 2D). Additionally, xylans in the sodium chlorite extract containing the xylan-5 epitope are also positively correlated to saccharification efficiency in H0198 (Table 2A). In cell wall fractions of poplar, De Martini et al. (2013) found that xylan-5 epitopes appear to be associated mostly with lignin and, appar-ently, they did not have any correlation to recalcitrance. In M. sinensis, the occurrence of xylan-5 epitopes in the sodium
chlorite extract in H0198 also did not interfere with recalci-trance, even though this genotype has the highest lignin content among the analysed genotypes. In contrast, xylan-5 epitopes in M. sinensis are positively correlated to saccharification.
Xyloglucans and xylans present in the ammonium oxalate and 4 M NaOH extracts seem to contribute with ~26% and ~13%, respectively, to cell wall recalcitrance when lignin is not correlated to saccharification (Table 2B). These two polymers have been hypothesized as playing a role in tethering cellulose microfibrils in grasses (Carpita and Gibeaut, 1993; De Souza et al., 2013; Kozlova et al., 2014). Also, the presence of these two types of polysaccharides in the 4 M NaOH extract could be related to the assembly of cellulose microfibrils in the form of agglomerates (the macrofibrils) as already proposed for maize and sugarcane by Ding and Himmel (2006) and Buckeridge et al. (2015), respectively. Both can influence the recalcitrance since the polysaccharide interaction could hide the binding sites, displaying a fine structure inaccessible to the enzymes present in the cocktails used for saccharification.
However, when lignin is correlated to saccharification effi-ciency, both xylans and xyloglucans are not correlated to recalcitrance (Table 2C). Indeed, these are the main polysac-charides that favour saccharification efficiency. This result could be related to the fact that when lignin interferes with sac-charification efficiency in M. sinensis, it seems to be due the arrangement of this polymer with pectins as discussed above. It is notable that when lignin is present, many epitopes related to pectins (specially AG epitopes) co-occur among the variables that favour recalcitrance (Table 2D), suggesting that both of these polymers are cross-linked, as already proposed in the lit-erature (Monro et al., 1972; Fry, 1983; De Martini et al., 2014).
Conclusions
Both lignin and polysaccharides can influence hydrolysis and recalcitrance of cell walls of M. sinensis. There seem to exist different patterns of polysaccharide epitopes and distinct oli-gosaccharides among genotypes that favour or do not favour cell wall hydrolysis. In M. sinensis, when lignin does not cor-relate with saccharification, pectins and mannans appear to favour hydrolysis, whereas recalcitrance can be explained by certain xyloglucans and arabinoxylans. When lignin is nega-tively correlated with saccharification, different types of ara-binoxylans, xyloglucans, and pectins contribute to hydrolysis, whereas other types of pectins, probably associated with lignin, contribute to recalcitrance. Thus, the present results suggest that the manner in which lignin is linked to polysac-charides and the polysaccharide–polysaccharide interactions within cell walls can substantially change the way in which cell walls respond to attack by degradative enzyme cocktails.
Supplementary data
Supplementary data are available at JXB online.Figure S1. Percentage of lignin, hemicelluloses, and cellu-
lose of seven genotypes of Miscanthus sinensis.Figure S2. Hexose:pentose ratio from monosaccharide
analysis of different genotypes of Miscanthus sinensis.
at University of G
eorgia Libraries on July 22, 2015
http://jxb.oxfordjournals.org/D
ownloaded from
Page 14 of 15 | de Souza et al.
Figure S3. Oligosaccharide profiles obtained using xyla-nase (for detection of arabinoxylan) of cell wall extracts of stems of three different genotypes of Miscanthus sinensis.
Figure S4. Oligosaccharide profiles obtained using xyloglucan endoglucanase (for detection of xyloglucan) of cell wall extracts of stems of three different genotypes of Miscanthus sinensis.
Table S1. Monosaccharides (%) of cell wall extractions from the AIR (alcohol-insoluble residue) of seven genotypes of Miscanthus sinensis.
Table S2. Listing of plant cell wall monoclonal antibodies used for glycome profiling analyses.
Table S3. (A) Eigenvalues and proportions of each princi-pal component generated by PCA using the cell wall variables from three genotypes. (B) PCA loadings calculated for each cell wall variable.
Table S4. (A) Eigenvalues and proportions of each princi-pal component generated by PCA using the cell wall variables from genotypes H0120 and H0116. (B) PCA loadings calcu-lated for each cell wall variable.
AcknowledgementsThe authors acknowledge Joice dos Santos, Eglee S. Igarashi, Annemarie C. Dechesne, and Heleen Furrer-Verhorst for assistance in conducting the experiments, and Oene Dolstra for his valuable suggestions and guidance. This work was supported financially by and is part of the production of the Instituto Nacional de Ciência e Tecnologia do Bioetanol–INCT do Bioetanol (FAPESP 2008/57908-6 and CNPq 574002/2008-1), the Centro de Processos Biológicos e Industriais para Biocombustíveis–CeProBIO (FAPESP 2009/52840–7 and CNPq 490022/2009-0), and the European Union consortium SUNLIBB (project ID 251132). The glycome profiling analyses were supported by the BioEnergy Science Center (BESC) administered by Oak Ridge National Laboratory and funded by Grant DE-AC05-00OR22725 from the Office of Biological and Environmental Research, Office of Science, United States Department of Energy. The generation of the CCRC series of plant cell wall glycan-directed monoclonal antibodies used in this work was supported by the United States National Science Foundation Plant Genome Program (DBI-0421683 and IOS-0923992).
ReferencesAbramson M, Shoseyov O, Shani Z. 2010. Plant cell wall reconstruction toward improved lignocellulosic production and processability. Plant Science 178, 61–72.
Acker RV, Leplé J-C, Aerts D, et al. 2014. Improved saccharification and ethanol yield froom field-grown transgenic poplar deficient in cinnamoyl-CoA reductase. Proceedings of the National Academy of Sciences, USA 111, 845–850.
Allison GG, Morris C, Clifton-Brown J, Lister SJ, Donnison IS. 2011. Genotypic variation in cell wall composition in a diverse set of 244 accessions of Miscanthus. Biomass and Bioenergy 35, 4740–4747.
Buckeridge MS, De Souza AP. 2014. Breaking the ‘Glycomic Code’ of cell wall polysaccharides may improve second-generation bioenergy production from biomass. Bioenergy Research 7, 1065–1073.
Buckeridge MS, dos Santos WD, De Souza AP. 2010. Routes to cellulosic ethanol in Brazil. In: Cortez LAB, ed. Sugarcane bioethanol: R&D for productivity and sustainability . Sao Paulo: Edgard Blucher, 365–380.
Buckeridge MS, dos Santos WD, Tiné MAS, De Souza AP. 2015. The cell wall architecture of sugarcane and its implication to cell wall recalcitrance. In: Lam E, ed. Compendium of bioenergy crops for science publishers . CRC Press of Taylor and Francis Group (in press).
Buckeridge MS, Goldman GH. 2011. Routes to cellulosic ethanol . New York: Springer.
Carpita NC, Gibeaut DM. 1993. Structural models of primary cell walls in flowering plants: consistency of molecular structure with the physical properties of the cell wall during growth. The Plant Journal 3, 1–30.
Caspeta L, Buijs NAA, Nielsen J. 2013. The role of biofuels in the future energy supply. Energy and Environmental Science 6, 1077–1082.
Charles MB, Ryan R, Ryan, N, Oloruntuba R. 2007. The policy and biofuels: the way forward. Energy Policies 35, 5737–5746.
Chen F, Dixon RA. 2007. Lignin modification improves fermentable sugar yields for biofuel production. Nature Biotechnology 25, 759–761.
Clifton-Brown J, Chiang Y-C, Hodkinson TR. 2008. Miscanthus: genetic resources and breeding potential to enhance bioenergy production. In: Vermis W, ed. Genetic improvement of bioenergy crops . New York: Springer, 273–294.
Costa RMF, Lee SJ, Allison GG, Hazen SP, Winters A, Bosch M. 2014. Genotype, development and tissue-derived variation of cell wall properties in the lignocellulosic energy crop Miscanthus. Annals of Botany 114, 1265–1277.
De Martini JD, Pattathil S, Miller JS, Li H, Hahn MG, Wyman CE. 2014. Investigating plant cell wall components that affect biomass recalcitrance in poplar and switchgrass. Energy and Environmental Science 6, 898–909.
De Souza AP, Grandis A, Leite DCC, Buckeridge MS. 2014. Sugarcane as a bioenergy source: history, performance, and perspectives for second-generation bioethanol. Bioenergy Research 7, 24–35.
De Souza AP, Leite DCC, Pattathil S, Hanh MG, Buckeridge MS. 2013. Composition and structure of sugarcane cell wall polysaccharides: implications for second-generation bioethanol production. Bioenergy Research 6, 564–579.
Ding SY, Himmel ME. 2006. The maize primary cell wall microfibril: a new model derived from direct visualization. Journal of Agriculture and Food Chemistry 54, 597–606.
Domon J-M, Baldwin L, Acket S, et al. 2013. Cell wall compositional modifications of Miscanthus ecotypes in response to cold acclimation. Phytochemistry 85, 51–61.
Fry SC. 1983. Feruloylated pectins from the primary-cell wall: their structure and possible functions. Planta 157, 111–123.
Fukushima RS, Kerley MS. 2011. Use of lignin extracted from different plant sources as standards in the spectrophotometric acetyl bromide lignin method. Journal of Agricultural and Food Chemistry 59, 3505–3509.
Grabber JH. 2005. How do lignin composition, structure, and cross-linking affect degradability? A review of cell wall model studies. Crop Science 45, 820–831.
Greef JM, Deuter M. 1993. Syntaxonomy of Miscanthus×giganteus Greef et Deu. Angewandte Botanik 67, 231–235.
Harris D, Stork J, Debolt S. 2009. Genetic modification in cellulose synthase reduces crystallinity and improves biochemical conversion to fermentable sugar. Global Change Biology Bioenergy 1, 51–61.
Heaton EA, Dohleman FG, Long SP. 2008. Meeting US biofuel goals with less land: the potential of Miscanthus. Global Change Biology 14, 2000–2014.
Himmel ME, Ding SY, Johnson DK, Adney WS, Nimlos MR, Brady JW, Foust TD. 2007. Biomass recalcitrance: engineering plants and enzymes for biofuels production. Science 315, 804–807.
Hodgson EM, Lister SJ, Bridgwater AV, Clifton-Brown J, Donnison IS. 2010. Genotypic and environmentally derived variation in the cell wall composition of Miscanthus in relation to its use as a biomass feedstock. Biomass and Bioenergy 34, 652–660.
Jung JH, Fouad WM, Vermerris W, Gallo M, Altpeter F. 2012. RNAi suppression of lignin biosynthesis in sugarcane reduces recalcitrance for biofuel production from lignocellulose biomass. Plant Biotechnology Journal 10, 1067–1076.
Kiemle SN, Zhang X, Esker AR, Toriz G, Gatenholm P, Cosgove DJ. 2014. Role of (1,3) (1,4)- β-glucan in cell walls: interaction with cellulose. Biomolecules 15, 1727–1736.
Kozlova LV, Ageeva MV, Ibragimova NN, Gorshkova TA. 2014. Arrangement of mixed-linkage glucan and glucuronoarabinoxylan in the cell walls of growing maize roots. Annals of Botany 114, 1135–1145.
Krausmann F, Erb K-H, Gingrich S, Haberl H, Bondeau A, Gaube V, Lauk C, Plutzar C, Searchinger TD. 2013. Global human appropriation of net primary production doubled in the 20th century. Proceedings of the National Academy of Sciences, USA 110, 10324–10329.
Le Ngoc Huyen T, Rémond C, Dheilly RM, Chabbert B. 2010. Effect of harvesting date on the composition and saccharification of Miscanthus×giganteus. Bioresource Technology 101, 8224–8231.
at University of G
eorgia Libraries on July 22, 2015
http://jxb.oxfordjournals.org/D
ownloaded from

Miscanthus cell walls | Page 15 of 15
Lewandowski I, Scurlock JMO, Lindvall E, Christou M. 2003. The development and current status of perennial rhizomatous grasses as energy crops in the US and Europe. Biomass Bioenergy 25, 335–361.
Lygin AV, Upton J, Dohleman FG, Juvik J, Zabotina OA, Widholm JM, Lozovaya VV. 2011. Composition of cell wall phenolics and polysaccharides of the potential bioenergy crop—Miscanthus. Global Change Biology Bioenergy 3, 333–345.
Magrin GO, Marengo JA, Boulanger J-P, Buckeridge MS, Castellanos E, Poveda G, Scarano FR, Vicuña S. 2014. Central and South America. In: Barros VR, Field CB, Dokken DJ, et al., eds. Climate Change 2014: impacts, adaptation, and vulnerability. part B: regional aspects. Contribution of Working Group II to the Fifth Assessment Report of the Intergovernmental Panel on Climate Change . Cambridge: Cambridge University Press, 1499–1566.
Marriot PE, Sibout R, Lapierre C, Fangel JU, Willats WGT, Hofte H, Gómez LD, McQuenn-Mason SJ. 2014. Range of cell-wall alterations enhance saccharification in Brachypodium distachyon mutants. Proceedings of the National Academy of Sciences, USA 40, 14601–14606.
Monro JA, Bailey RW, Penny D. 1972. Polysaccharide composition in relation to extensibility and possible peptide linked arabinogalactan of lupin hypocotyl cell walls. Phytochemistry 11, 1597–1602.
Pattathil S, Avci U, Baldwin D, et al. 2010. A comprehensive toolkit of plant cell wall glycan-directed monoclonal antibodies. Plant Physiology 153, 514–525.
Pattathil S, Avci U, Miller JS, Hahn MG. 2012. Immunological approaches to plant cell wall and biomass characterization: glycome profiling. Methods in Molecular Biology 908, 61–72.
Pauly M, Keegstra K. 2008. Cell-wall carbohydrates and their modification as a resource for biofuels. The Plant Journal 54, 559–568.
Penning BW, Sykes RW, Babcock NC, et al. 2014. Genetic determinats for enzymatic digestion of lignocellulosic biomass are independent of those for lignin abundance in a maize recombinant inbred population. Plant Physiology 165, 1475–1487.
Ray MJ, Brereton NJB, Shield I, Karp A, Murphy RJ. 2012. Variation in cell wall composition and accessibility in relation to biofuel potential of short rotation coppice willow. Bioenergy Research 5, 685–698.
Schröder R, Atkinson RG, Redgwell RJ. 2009. Re-interpreting the role of endo-β-mannanases as mannan endotransglycosylase/hydrolases in the plant cell wall. Annals of Botany 104, 197–204.
Simmons BA, Loque´ D, Ralph J. 2010. Advances in modifying lignin for enhanced biofuel production. Current Opinion in Plant Biology 13, 312.
Sims REH, Schock RN, Adegbululgbe A, et al. 2007. Energy supply. In: Metz B, Davidson OR, Bosch R, Dave R, Meyer, LA, eds. Climate change 2007: mitigation of climate change. Contribution of Working Group III to the Fourth Assessment Report of the Intergovernamental Panel on Climate Change . Cambridge: Cambridge University Press, 251–322.
Smeets EMW, Lewandowskia IM, Faaija APC. 2009. The economical and environmental performance of miscanthus and switchgrass production and supply chains in a European setting. Renewable and Sustainable Energy Reviews 13, 1230–1245.
Torres AF, van der Weijde T, Dolstra O, Visser RGF, Trindade LM. 2013. Effect of maize biomass composition on the optimization of diluted-acid pretreatments and enzymatic saccharification. Bioenergy Research 6, 1038–1051.
Torres AF, Visser RGF, Trindade LM. 2014. Bioethanol from maize cell walls: genes, molecular tools, and breeding prospects. Global Change Biology Bioenergy (in press).
van der Weijde T, Kamei CLA, Torres AF, Vermerris W, Dolstra O, Visser RGF, Trindade LM. 2013. The potential of C4 grasses for cellulosic biofuel production. Frontiers in Plant Science 4, 107.
Vanholme R, Morreel K, Darrah C, Oyarce P, Grabber JH, Ralph J, Boerjan W. 2012. Metabolic engineering of novel lignin in biomass crops. New Phytologist 196, 978–1000.
Vogel J. 2008. Unique aspects of the grass cell wall. Current Opinion on Plant Biology 11, 301–307.
Wyman CE. 2008. Cellulosic ethanol; a unique sustainable liquid transportation fuel. MRS Bulletin 33, 381–383.
Xu N, Zhang W, Ren S, et al. 2012. Hemicelluloses negatively affect lignocellulose crystallinity for high biomass digestibility under NaOH and H2SO4 pretreatments in Miscanthus. Biotechnology for Biofuels 5, 58.
Zhao H, Li Q, He J, Yu J, Yang J, Liu C, Peng J. 2014. Genotypic variation of cell wall composition and its conversion efficiency in Miscanthus sinensis, a potential biomass feedstock crop in China. Global Change Biology Bioenergy 6, 768–776.
at University of G
eorgia Libraries on July 22, 2015
http://jxb.oxfordjournals.org/D
ownloaded from