research paper making sense of the environment ... · will be unable to demonstrate their moral...
TRANSCRIPT

Making Sense of the Environment: Investigating the Locational Patterns of Cultural
Organizations in Southeast Michigan
WORKING PAPER
Alisa Moldavanova1, Assistant Professor, Political Science Department
T. Lyke Thompson2, Professor and Director, Center for Urban Studies3
Lauren Meloche, Research Assistant, Center for Urban Studies
Katelyn Burkart, Research Assistant, Center for Urban Studies
Wayne State University
This project was supported in part or in whole by an award from the Research: Art Works program at the National Endowment for the Arts: Grant # 16-3800-7012.
The opinions expressed in this paper are those of the author(s) and do not represent the view of the Office of Research & Analysis of the National Endowment for the Arts. The NEA does not guarantee the accuracy or completeness of the information included in this paper and is not responsible for any consequence of its use.
1 Corresponding author. Contact: [email protected]. 2 Project data can be requested from the Center for Urban Studies (http://www.cus.wayne.edu/). Contact: [email protected]. 3 The authors would like to thank Courtney Flynn and Carrie Beth Lasley for their research support in the early stages of this project.

INVESTIGATING THE LOCATIONAL PATTERNS OF CULTURAL ORGANIZATIONS 1
Making Sense of the Environment: Investigating the Locational Patterns of Cultural
Organizations in Southeast Michigan
Co-authors: Alisa Moldavanova, T. Lyke Thompson, Lauren Meloche, Katelyn Burkart
Abstract: This article relies on the resource dependency and legitimacy theories as two complementary perspectives that explain the importance of public access and audience diversity for the survival and long-term sustainability of cultural organizations. Relying upon the sample of 335 arts and cultural organizations located in Metropolitan Detroit, we used the GIS-modelling approach to develop an index of public access to the cultural sector and its five sub-fields (visual arts, science, performing arts, historical organizations, and libraries). The U.S. Census Bureau data was further used to analyze how accessible cultural institutions are to the traditionally underserved populations. The analysis revealed that cultural institutions are unevenly distributed in the geographic area, and that certain groups of the population are at a greater disadvantage in terms of their access to particular types of cultural amenities. The article discusses implications of the findings to cultural managers, donors, and policymakers and suggests future research directions.
Keywords: organizational legitimacy, resource dependency, long-term sustainability, public access, audience diversity, arts and culture organizations, GIS-modelling.

INVESTIGATING THE LOCATIONAL PATTERNS OF CULTURAL ORGANIZATIONS 2
Executive Summary
Arts and culture organizations are crucial elements of sustainable local communities; however, the very sustainability of cultural organizations is conditioned upon the type of communities in which such organizations are located. Continuous demographic changes in local communities present a challenging task for public and nonprofit cultural organizations. In post-industrial cities, many of these institutions face severe survival pressures. In response to such pressures, many organizations develop innovative programs and outreach methods to meet the needs of their existing stakeholders while diversifying to include new stakeholders. The ability to achieve greater audience diversity, however, is dependent upon the access structure of individual organizations as well as the sector collectively. If the critical publics upon which those organizations depend cannot readily access them, organizations will lack access to resources and will be unable to demonstrate their moral worth or merit. This sponsored project examines the relative extent and dimensions of access for the cultural sector organizations as an important condition for their survival and long-term sustainability. The main research questions investigated are: What is the capacity of the cultural sector and its sub-sets to ensure inclusive outreach in a given geography? Are there groups of the population whose lack of access to cultural institutions results in their being ‘underserved’?
The study conducted on the sample of 335 public and nonprofit cultural organizations from five creative sub-sectors located in the urbanized counties of Metropolitan Detroit (Wayne, Macomb, Oakland, and Washtenaw). In this number we have sought to capture all public and nonprofit cultural organizations that fit the sampling frame in these four counties. Organizations in the sample comprise five sub-sectors that represent major areas of arts and cultural activity in the region: 28 visual arts organizations; 15 science organizations; 87 music and performing arts organizations; 70 historical organizations, and 135 libraries.
The sample included non-commercial arts and culture organizations that pursue public service missions. These organizations are either incorporated nonprofits or public cultural organizations, such as, for example, public libraries and municipal historical museums. The sample excludes narrowly positioned member-serving organizations (e.g. church choir, ethnic cultural organizations), arts and culture businesses, individual artists, advocacy organizations and professional alliances, fundraising organizations (e.g. friends groups), as well as seasonal events (e.g. festivals, celebrations, temporary exhibitions). Additionally, only organizations that had a clearly identifiable geographical location (address) in the four-county area of Metropolitan Detroit were included in the study. Touring organizations were excluded from the sample, unless they had a permanent location where members of the public could find them.
As the first step of the study, we explored general locational patterns of cultural organizations in Metropolitan Detroit in order to identify areas with high and low concentration of institutions. At this stage we relied on the Kernel Density analysis that uses physical addresses to determine the number of organizations located within a given area. This approach produced raster maps (also called heat maps) for the entire cultural sector as well as for the five sub-sectors.
As the second step of the study, we relied on the GIS-modelling approach to construct an index of public access to the cultural sector and its sub-sectors as an aggregated score that each Census tract in the region of the study obtained based on the following six equally weighted factors:
INVESTIGATING THE LOCATIONAL PATTERNS OF CULTURAL ORGANIZATIONS 3
1. Free vs. paid admission policy. 2. Walking distance. 3. Biking distance. 4. Driving distance. 5. Connection by transit service. 6. Access to private cars.
As a result, we obtained six access maps: one for the entire cultural sector, and five for each of the sub-sectors. The outcome of this approach is 6 access areas (access scores 1, 2, 3, 4, 5, 6) that are collections of Census tracts with similar levels of access. Additionally, we relied on the GIS software Anselin Local Moran’s I to calculate measures for each Census tract, which indicate if the access index scores of the immediately surrounding Census tracts are similar to the index score of the tract being studied. This has produced six additional maps displaying statistically significant clusters of tracts with high access index values (cultural districts) and statistically significant clusters with low access index values (cultural deserts).
As the final step of the study, we investigated the accessibility of the cultural sector and its sub-sectors to different socio-demographic groups in the population by compiling Census data to create socio-demographic profiles of each area. This was done by assigning an access value to each Census tract within the geographic boundaries of Metropolitan Detroit, and accumulating across those Census tracts the socio-demographic characteristics of the areas under the same access index value. For most of the socio-demographic variables, we used the raw data counts for each tract divided by that tract’s total population to calculate summary estimates for the groups of tracts that share the same index score. The exceptions were the population size that was reported as total population in a given geographical area, and the medians of the medians for household income and age. This has allowed constructing six access tables for the entire cultural sector and the five sub-sectors that match the level of access (1 – lowest, 6 - highest) with the aggregated socio-demographic profile of the areas located within the six access zones.
The results of this study show that arts and culture organizations are generally well-positioned to serve substantial proportions of the Metropolitan Detroit population; however, certain groups of the population are at a greater disadvantage in terms of their access to particular types of cultural amenities. In particular, consistent access deficiencies across all sub-fields of arts and culture are observed for the communities in Metropolitan Detroit that have higher percentage of minorities, as well as higher percentage of less educated people. Therefore, improving access for these two groups of population appears to be most critical. Other, less consistent, access deficiencies indicate that populations that have lower socio-economic status and income, as well as lower employment, may, in fact, also be at a greater disadvantage in terms of access to several types of arts and culture organizations. Overall, we found some evidence of an ‘elitist’ access structure that follows higher levels of education and higher social status.
These findings imply that, while moral legitimacy is an important pursuit for cultural organizations that aspire to achieve long-term sustainability, organizations might be underutilizing an important community resource – diverse audiences – that would allow implementing their legitimacy goals in practice. Alongside the issues with the normative dimension of legitimacy, we also find some evidence of more instrumental, elite-type considerations that may be influencing arts and culture sector’s access structure. Therefore, from a normative point of view, it would be important to overcome the existing access barriers in

INVESTIGATING THE LOCATIONAL PATTERNS OF CULTURAL ORGANIZATIONS 4
order to enhance the ability of arts and culture organizations to act as socially responsible and, ultimately, sustainable organizations.
By offering an innovative way of defining and describing the accessibility of culture as a community resource to the public, this study contributes to scholarship in multiple ways. First, the study’s methodology contributes to the literature on community resource accessibility by introducing a comprehensive, multi-component, index of access that could be utilized in future studies of arts and culture accessibility beyond Metropolitan Detroit, as well as studies of accessibility of other types of community resources. Second, by investigating the potential of arts and culture organizations to pursue two critical pillars of organizational legitimacy – public access and audience diversity – the study sheds more light on the application of the legitimacy theory. Access index analysis also indicates that cultural organizations partially follow locational patterns along the lines of population size, wealth concentration, county seat presence, thus supporting basic assumptions of the resource dependency theory about organizations choosing locations with access to greater resources.
The study’s findings imply a window of opportunity for cultural organizations, donors, and policy-makers. Some possible ways of improving public access to cultural organizations in the urbanized counties of Metropolitan Detroit may include such institutional policies as offering free admissions and/or subsidized access, especially for people with lower socio-economic status, as well as increasing public outreach in geographic areas with high concentration of minority populations and populations with lower levels of education. Particularly useful could be the early outreach programs in public schools, in order to provide access and cultivate cultural appreciation skills among young people early on in their lives. Additionally, a possible policy intervention that may help to reduce the existing access barriers would be improving transportation options for low and medium access Census tracts to ease access to cultural institutions, which may include both better public transportation networks as well as donor-supported transportation to assist cultural institutions with their public outreach efforts. Moreover, considering the low number and lower accessibility of science organizations in Metropolitan Detroit, it would be beneficial to support the creation of new science institutions in the area.

INVESTIGATING THE LOCATIONAL PATTERNS OF CULTURAL ORGANIZATIONS 5
INTRODUCTION
The profound connectedness that exists between cultural organizations and their
communities is a blessing in disguise. On one hand, arts and culture organizations are crucial
elements of sustainable local communities (Kim, 2016; LeRoux & Bernadska, 2014;
Moldavanova, 2013, 2016; Nurse, 2006; Rushton & Landesman, 2013; Throsby, 1995; Tubadji,
Osoba, & Nijkamp, 2015). On the other hand, the very sustainability of cultural organizations is
conditioned upon the type of communities in which such organizations are located, and from
which they derive various forms of capital, such as economic, human, and social (Grodach,
Currid-Halkett, Foster, & Murdoch III, 2014; Moldavanova 2016; Moldavanova et al., 2017).
Continuous demographic changes in local communities present a challenging task for
public and nonprofit cultural organizations. Unlike more high revenue, private creative industries
that often have the capacity to choose their location, most public and nonprofit cultural
organizations rely heavily on fixed capital that ties them to their historic locations (Brooks &
Kushner, 2001; Chang & Lee, 2003; Evans & Foord, 2008; Grodach, 2016; Grodach, Currid-
Halkett, Foster, & Murdoch III, 2014; Mommaas, 2004; Redaelli, 2012). The majority of long-
standing cultural organizations were established in certain geographic locations, mostly urban
centers, by elites from former generations at the time of the Industrial Revolution or
during periods of urban prosperity and growth. In post-industrial cities, many of these
institutions face severe survival pressures due to the increased competition for funding,
reduction in the attendance rates, narrowing of the elites on which they used to depend, and
the aging of their core audiences and supporters (Moldavanova, 2016; Moldavanova &
Goerdel, 2018; Mommaas, 2004; Toepler & Wyszomirski, 2012).

INVESTIGATING THE LOCATIONAL PATTERNS OF CULTURAL ORGANIZATIONS 6
These problems threaten the very sustainability of cultural organizations, providing
incentives for them to develop innovative programs and outreach methods to meet the needs of
their existing stakeholders while diversifying to include new stakeholders (Azmat, Fujimoto, &
Rentschler, 2015; Borwick, 2012; Graves, 2005; Johanson, Glow, & Kershaw, 2014; McCarthy
& Jinnett, 2001; Moldavanova, 2016; Moldavanova & Goerdel, 2018). In many cases, the
stakeholder diversification agenda in cultural institutions is promoted by foundations and donors
(Toepler & Wyszomirski, 2012). However, greater focus on the needs of stakeholders by cultural
organizations is also the evidence of their own strategic responses to external and internal
pressures (Bryson, 2004; Koteen, 1997; Kotler, Kotler, & Kotler, 2008; Varbanova, 2013),
which provides access to critical resources needed for organizational survival (Pfeffer &
Salancik, 1978). Moreover, public access and commitment to audience diversity could also be
viewed as two critically important values that convey moral legitimacy on public service
organizations (Dowling & Pfeffer, 1975; Pfeffer & Salancik, 1978; Suchman, 1995).
The ability to achieve greater audience diversity, however, is dependent upon the access
structure of individual organizations as well as the sector collectively. If the critical publics upon
which those organizations depend cannot readily access them, organizations will lack access to
resources and will be unable to demonstrate their moral worth or merit. The goal of this article,
therefore, is to examine the relative extent and dimensions of access for the cultural sector
organizations as an important condition for their survival and long-term sustainability. The main
research questions investigated are: What is the capacity of the cultural sector and its sub-sets to
ensure inclusive outreach in a given geography? Are there groups of the population whose lack
of access to cultural institutions results in their being ‘underserved’?

INVESTIGATING THE LOCATIONAL PATTERNS OF CULTURAL ORGANIZATIONS 7
The article reports the results of the study conducted on the sample of
335 public and nonprofit cultural organizations from five creative sub-sectors located in the
urbanized counties of Metropolitan Detroit. To explore the capacity of the cultural sector to
ensure greater audience diversity and public access, we use a GIS-modelling approach to develop
an index of public access that takes into account institutional admissions policy, the physical
characteristics of a location, and the availability of, and access to, transportation. Our analysis
shows that different types of cultural institutions are unevenly distributed in the geographic area
of interest, and there are clear areas of high and low concentration of organizational types. At the
same time, diverse social and economic groups – potential audiences – populate both cultural
districts and cultural deserts, thus creating uneven patterns of access. When used in combination
with demographic data, the index of access reveals that certain groups of the population are at a
greater disadvantage in terms of their access to cultural sub-sectors. Therefore, cultural
organizations may be underutilizing an important community resource – diverse audiences – that
would allow strengthening their resource base and pursue legitimacy goals in practice.
This article first introduces our theoretical assumptions and provides background
information about cultural organizations and the typical pressures that they face. We then explain
our research framework, including the sampling method and the construction of an index of
public access to cultural organizations. Next, the article reports a) the results of the density
analysis for the entire cultural sector as well as subsets of cultural institutions, as a way to
understand general locational patterns of such organizations, b) the more nuanced findings about
locational patterns obtained by designing and implementing the index of access, and c) the
results of applying the index of access approach to analyzing the public accessibility of cultural
organizations to diverse population groups. We further discuss how organizational locations
INVESTIGATING THE LOCATIONAL PATTERNS OF CULTURAL ORGANIZATIONS 8
influence their capacity to provide access to various forms of art and culture for diverse patrons
and constituencies. The concluding part discusses future research directions and implications of
the study’s findings to policy-makers, donors, and cultural managers.
THEORETICAL FRAMEWORK
Cultural organizations are important parts of the urban social ecology. They participate in
local policymaking, contribute to local economic development and revitalization, engage in
creative place-marketing, encourage innovation and creativity, stimulate cultural diversity, foster
civic engagement and community level social capital, and attract people from other creative
professions (Borwick, 2012; Florida, 2002; Grodach, 2014, 2016; Hesmondhalgh & Pratt, 2005;
LeRoux & Bernadska, 2014; Pratt, 2008; Scott, 2006; Strom, 2003; Wilks-Heeg & North, 2004).
Cultural institutions play these important roles in different types of urban environments, from
flourishing urban centers with high concentrations of creative capital, to revitalizing
communities and struggling post-industrial cities, such as Detroit, Cleveland, and Pittsburgh.
Despite their significance for urban sustainability, cultural institutions themselves face
numerous sustainability pressures, such as declining arts participation, increasing competition
with the entertainment industry, technological changes, economic recessions, and the decline of
both public and private support for the arts (McCarthy, Ondaatje, & Novak, 2007; Moldavanova,
2016; Toepler & Wyszomirski, 2012). The issue of sustainability is particularly salient for
organizations promoting classical forms of art (DiMaggio & Mukhtar, 2004), which are typically
represented by the nonprofit cultural sector (Toepler & Wyszomirski, 2012). Cultural
organizations developed a variety of responses to the above pressures, of which the stakeholder
diversifications strategies are among the most common (Moldavanova & Goerdel, 2018).

INVESTIGATING THE LOCATIONAL PATTERNS OF CULTURAL ORGANIZATIONS 9
Two theoretical lenses are particularly useful in describing organizational behavior under
stress, and how organizations develop coping strategies: 1) the resource dependency perspective
that assumes interdependency between organizations and their wider operational environments,
including the ability of organizations to respond to external pressures in strategic ways by
deriving resources from their environments, and 2) organizational legitimacy perspective that
focuses on normative aspects of organizational behavior by recognizing that organizational
legitimacy in the public and nonprofit sectors, as a necessary condition for organizational
survival, is not necessarily about the economic resources derived by organizations, it is rather
about the congruence between organizational and social norms and values. The resource
dependency and legitimacy perspectives offer complementary views on how public access and
audience diversity contribute to organizational survival and long-term sustainability.
Resource Dependency Perspective
Resource dependency perspective implies that the ability of organizations to effectively
derive various resources from the external environment is of key importance for organizational
survival (Aldrich, 2008; Pfeffer & Salancik, 2003). Since arts and culture organizations the U.S.
receive negligible financial assistance from the government and rely significantly on private
sources of support (Toepler & Wyszomirski, 2012), audience is a key resource for their survival.
Therefore, arts and culture organizations have been in constant search of innovative ways to
expand, diversify, and broaden their audiences (McCarthy & Jinnett, 2001; McCarthy, 2004;
McCarthy, Ondaatje and Novak, 2007). In many cases, the diversity agenda in cultural
institutions is promoted by foundations and donors that strive to encourage more inclusive
outreach by supporting relevant programs (Toepler & Wyszomirski, 2012).

INVESTIGATING THE LOCATIONAL PATTERNS OF CULTURAL ORGANIZATIONS 10
Scholars of nonprofit organizations, particularly the ones working in the strategic
management tradition (Brown, 2010; Bryson, 2004; Varbanova, 2013), have stressed the
importance of identifying and serving the needs of multiple stakeholders as an important factor
of organizational success. This suggests that greater focus on stakeholder diversity is of strategic
importance for the current and future viability of arts and culture organizations. One way of
ensuring greater diversity of organizational stakeholders is to design more inclusive public
outreach (Moldavanova, 2016), and there is a growing body of the literature that discusses
innovative approaches to public outreach developed within the sector (Azmat, Fujimoto, &
Rentschler, 2014; Johanson, Glow, & Kershaw, 2014; Kotler, Kotler, & Kotler, 2008; McCarthy
& Jinnett, 2001; Moldavanova & Goerdel, 2018).
On the other hand, while serving broad and diverse groups of stakeholders is likely to
lead to more diverse organizational support networks in the longer-run, focusing primarily on
resourceful and powerful stakeholders may also lead to greater immediate organizational
benefits. In the case of classical arts and culture organizations, focusing on highly educated and
socially and economically advantaged patrons and donors is part of their historical legacy. In the
long-run, however, such an ‘elitist’ orientation that this sector is credited for (DiMaggio &
Mukhtar, 2004), may cause more harm than benefit thus questioning the sector’s own prospects
for long-term sustainability. Overall, however, the engagement of arts and culture organizations
in audience diversifications strategies could be considered as a pragmatic response to external
pressures that those organizations face, and as a way of diversifying the existing resource base.
Organizational Legitimacy Perspective
The focus on audience development programs as a pragramatic management strategy
would be incomplete without discussing a broader normative imperative of the audience

INVESTIGATING THE LOCATIONAL PATTERNS OF CULTURAL ORGANIZATIONS 11
development initiatives – the question of representation and access, and the importance of this
imperative for the longer-term sustainability of arts and culture organizations. Thus, aside from
praising wider, broader, and more inclusive outreach as a way to achieve strategic advantage,
accessibility of cultural institutions for various groups of population is an important ethical
concern for organizations that aspire to enhance their own legitimacy (Dowling & Pfeffer, 1975;
Suchman, 1995).
Organizational legitimacy is defined, “…[a]s a condition or status which exists when an
entity’s value system is congruent with the value system of the larger social system of which the
entity is a part. When a disparity, actual or potential, exists between the two value systems, there
is a threat to the entity’s legitimacy.” (Dowling & Pfeffer, 1975, p. 122) According to the
legitimacy theory, in response to changes in social perceptions about organizational activities
and images, organizations engage in the management of such perceptions in order to achieve
legitimacy (O'Donovan, 2002), which may include both conforming to and trying to alter social
expectations and values (Dowling & Pfeffer, 1975). In return, organizations with greater
legitimacy enjoy positive social reputation, which may lead to the improved access to resources.
Organizational legitimacy itself, however, is considered a critical resource for
organizational survival (Dowling & Pfeffer, 1975; O'Donovan, 2002), as well as the longer-term
sustainability of organizations (Moldavanova, 2016; Thomas & Lamm, 2012). In the public and
nonprofit sectors, organizational legitimacy is not limited to economic resources that
organizations can obtain from their environment on a competitive basis; rather it is rooted in
congruence between the normative environment of an organization and its behaviors, products,
or image (Suchman, 1995). Subsequently, organizations with greater levels of legitimacy are

INVESTIGATING THE LOCATIONAL PATTERNS OF CULTURAL ORGANIZATIONS 12
capable of gaining both their stakeholder and broader public trust, thus justifying the need for
their very existence (Moore, 2000).
The importance of legitimacy for the survival of organizations has been demonstrated in
many previous studies (Dowling & Pfeffer, 1975; O'Donovan, 2002; Suchman, 1995; Thomas &
Lamm, 2012), and there are also good examples of how legitimacy works as a catalyst for long-
term organizational sustainability. In the urbanized area of Metropolitan Detroit, for example,
several notable long-standing organizations have experienced critical, ‘life-threatening,’ events.
For instance, both Belle Isle Aquarium and the Detroit (now Michigan) Science Center were
temporarily closed due to their financial problems and the inability of their leadership to properly
establish organizational legitimacy. On the other hand, the Detroit Institute of the Arts (DIA),
whose collections were under threat to be sold as a result of the City of Detroit’s bankruptcy, was
able to effectively capitalize on its stakeholder relationships and establish its normative
significance for the city’s current and future generations of residents (Stryker, 2015)1.
One way for organizations to demonstrate their normative legitimacy to their
stakeholders would be by pursuing ethical values in practice. Public access and commitment to
audience diversity are two critically important values that convey moral legitimacy on public
service organizations (Suchman, 1995). Therefore, it would be fair to expect that non-
commercial arts and culture organizations would be motivated to pursue these two values via
deliberately designed organizational practices, thus enhancing their own organizational
legitimacy and improving their chance for survival and long-term sustainability. Moreover,
an audience development agenda could be seen as part of organizations’ ethical commitment
to future generations (Moldavanova 2016).

INVESTIGATING THE LOCATIONAL PATTERNS OF CULTURAL ORGANIZATIONS 13
While the commitment of organizations to public access and audience diversity – for both
resource-related and normative reasons – has the potential to enhance the very prospects for
organizational survival and sustainability, the ability to achieve greater audience diversity and
provide more access is dependent upon the access structure of individual organizations as well as
the cultural sector collectively. If the critical publics upon which those organizations depend
cannot readily access them, organizations will lack access to diverse resources and will be unable
to demonstrate their moral worth.
The successful implementation of the audience diversification strategies is conditioned
upon the features of the urban environment in which cultural organizations exist, and cultural
organizations’ own awareness of their publics, including immediate stakeholders and the
community at large. One obstacle that limits the ability of cultural institutions to achieve
greater audience diversity is the lack of studies that address the question of the geography of
the public outreach, and how a location influences the capacity of the cultural sector to
meet the audience development needs. Therefore, the main research questions investigated in
this article are: What is the capacity of the cultural sector and its sub-sets to ensure
inclusive outreach in a given geography? Are there ‘underserved’ groups of the population
resulting from a lack of access to cultural institutions? To answer these questions, we examine
the relative extent and dimensions of access for the cultural sector overall and for the different
sub-sets of cultural organizations as an indicator of their legitimacy.
RESEARCH METHODOLOGY
Insights from Previous Cultural Mapping Studies
In recent years, there have been several notable studies that engage in cultural mapping
with the purpose of exploring the locational patterns of cultural industries (Chang & Lee, 2003;

INVESTIGATING THE LOCATIONAL PATTERNS OF CULTURAL ORGANIZATIONS 14
Evans & Foord, 2008; Grodach, 2014, 2016; Grodach, Currid-Halkett, Foster, & Murdoch III,
2014). These studies focus on mapping the sector’s location against other community
characteristics, such as the concentration of other industries, population and housing growth,
availability of donors, etc. (Chang & Lee, 2003; Evans & Foord, 2008). The cultural mapping
studies have also been focused on predicting the vitality of the cultural sector depending on the
properties of urban environments (location size, economic and demographic factors) (Grodach,
2016). These studies justify the development of more localized, place-specific, approaches to
cultural policy. What is lacking in the literature on locational patterns of cultural institutions is
the needed attention to the question of audience diversity and how well-positioned cultural
institutions are to serve diverse groups of population.
Additionally, scholars have typically mapped ‘cultural industries’ as a whole, including
both traditional forms of culture and arts and more commercial industries (media firms,
telecommunications, consulting firms). This non-differentiated approach to cultural mapping
does not take into account substantial differences in the challenges of access that older and more
classical nonprofit culture and arts institutions face as compared to their younger and more
dynamic commercial counterparts. Finally, scholars tend to use either physical locations of
individual organizations or a generalized locational quotient for the sector/sub-sector (a measure
that derives from comparing specific locations to national averages) for mapping the arts and
culture institutional locations (Grodach et al., 2014). These approaches are helpful for predicting
the locational patterns of individual cultural organizations and the cultural sector overall;
however, they neglect the presence of other factors that may be equally important for describing
the access structure, such as, for example, the physical infrastructure that supports or obstructs
access.

INVESTIGATING THE LOCATIONAL PATTERNS OF CULTURAL ORGANIZATIONS 15
Access Index as an Alternative Way of Defining and Approximating Access
This article seeks to address the aforementioned gaps in the literature on the geography of
the cultural sector by designing and implementing an index of access that takes into account
admissions policy, the physical characteristics of a location, and the availability of, and access to,
transportation. The purpose of the index is to explore the existing geographical, institutional, and
social barriers limiting access to cultural organizations, analyze the public accessibility of these
institutions, and develop recommendations regarding access to cultural organizations. To achieve
this goal, we consider the social and demographic profile of local communities and explore the
availability of cultural amenities to various segments of the population. Specifically, we focus on
those groups of population that are traditionally underrepresented among cultural organizations’
audiences.
Our approach is based on two assumptions: a) the social and demographic profiles of
local communities undergo dynamic changes, while core audiences of many cultural
organizations often remain stable; b) many long-standing cultural organizations are located in
certain areas because of historic development patterns. These assumptions are consistent with
previous studies that show that certain geographic areas tend to specialize in a particular set of
industries (Brooks & Kushner, 2001; Chang & Lee, 2003; Evans & Foord, 2008; Grodach, 2016;
Grodach, Currid-Halkett, Foster, & Murdoch III, 2014; Mommaas, 2004; Redaelli, 2012), and
that industry location may be dynamic (Grodach, 2016). Indeed, as cities and regions have
expanded, the original location may no longer serve the community and may fail to adequately
reflect current and future needs of local communities. While the actual audiences of cultural
organizations, particularly in slowly transforming urban areas such as Detroit, may differ from

INVESTIGATING THE LOCATIONAL PATTERNS OF CULTURAL ORGANIZATIONS 16
the social and demographic profile of the organization’s communities, engaging with the diverse
audiences should, nevertheless, be an important part of cultural organizations’ long-term legacy.
This article explores the accessibility of culture as a community resource, and we use the
terms “cultural districts” and “cultural deserts” to describe geographic areas with different
concentration of cultural organizations. Conventionally, cultural districts are defined as areas in
which arts and culture facilities serve as the primary attraction (Brooks & Kushner, 2001). We
use term “cultural districts” in a slightly different way, to describe areas of high concentration of
the cultural sector organizations. We also use the term “cultural desert” to denote areas with low
presence of cultural institutions. This terminology is borrowed from previous studies that
mapped arts industries (Grodach, 2016), and from the literature on sustainable food and health
practices (Adams, Ulrich, & Coleman, 2010; Bertrand, Thérien, & Cloutier, 2008; Cummins,
Findlay, Petticrew, & Sparks, 2005; Pearce, Witten, & Bartie, 2006).
Sampling and Data Sources
There are different approaches to conceptualizing creative industries and defining the
cultural sector (Moldavanova et al., 2017). For example, Richard Florida uses the term ‘creative
class’ to characterize creative human capital, including people in various creative professions not
limited to arts and culture (Florida, 2002). Such a broad approach recognizes the
interdependence of different forms of creative activity (artistic, scientific, or economic). Another
common approach is to focus on creative industries, including both classical nonprofit arts (e.g.,
opera, symphony, art museums), and creative businesses such as media arts promotion agencies,
private galleries, and experimental arts (Brooks & Kushner, 2001; Currid, 2009; Grodach,
Currid-Halkett, Foster, & Murdoch III, 2014; Mommaas, 2004). This latter strategy considers
the overall presence and concentration of cultural industries in given locations characterized as

INVESTIGATING THE LOCATIONAL PATTERNS OF CULTURAL ORGANIZATIONS 17
‘innovation districts’ (Grodach, Currid-Halkett, Foster, & Murdoch III, 2014). Scholars
employing the innovation district concept tend to focus on ‘cultural clusters’ and generally
explore the relationship that exists between such clusters and a variety of community
characteristics (Grodach, 2016; Grodach, Currid-Halkett, Foster, & Murdoch III, 2014;
Mommaas, 2004).
In this article, we have adopted a mixed approach by focusing on formal organizations
that include both classic forms of art and other cultural institutions beyond the arts. We choose to
focus on classic forms of culture because these types of organizations are in the greatest need for
diversifying their audiences, and are most affected by the historical patterns (DiMaggio &
Mukhtar, 2004), as compared to more dynamic cultural industries (media firms,
telecommunications, law and other consulting firms). Our sample of organizations includes 335
cultural organizations located in the urbanized counties (Wayne, Macomb, Oakland, and
Washtenaw) of Metropolitan Detroit. In this number we have sought to capture all public and
nonprofit cultural organizations that fit the sampling frame in these four counties. Organizations
in the sample comprise five sub-sectors that represent major areas of arts and cultural activity in
the region: 28 visual arts organizations; 15 science organizations; 87 music and performing arts
organizations; 70 historical organizations, and 135 libraries.
The sample included non-commercial arts and culture organizations that pursue public
service missions, which makes public access and audience diversity important normative
imperatives for such organizations. These organizations are either incorporated nonprofits or
public cultural organizations, such as, for example, public libraries and municipal historical
museums. In order to avoid sample bias, we reviewed organizational missions to make sure that
all organizations in the sample aspire to serve public at large. This allowed excluding narrowly

INVESTIGATING THE LOCATIONAL PATTERNS OF CULTURAL ORGANIZATIONS 18
positioned member-serving organizations (e.g. church choir, ethnic cultural organizations), since
wider public access does not appear to be an imperative for such organizations. The study also
excluded arts and culture businesses whose activities are driven primarily by profit making rather
than public serving motives, as well as individual artists, advocacy organizations and
professional alliances, fundraising organizations (e.g. friends groups), and seasonal events (e.g.
festivals, celebrations, temporary exhibitions). Additionally, only organizations that had a clearly
identifiable geographical location (address) in the four-county area of Metropolitan Detroit were
included in the study. This included both organizations that have their own premises, and those
that perform or exhibit in a clearly identifiable location that belongs to another organization (e.g.
church, community center). Touring organizations were excluded from the sample, unless they
had a permanent location where members of the public could find them.
The sample of organizations that meet the above criteria was derived from multiple data
sources, including the following: 1) membership database of CultureSource – and arts advocacy
organization operating in Southeast Michigan, comprised of 120 organizational members; 2)
SustainArts Database, comprised of 572 arts, culture, and humanities nonprofits and
support organizations in the Detroit Metropolitan Area; 3) Guidestar database of nonprofit
organizations in the State of Michigan comprised of 1266 organizations. In addition to the
above sources, we conducted several web searches using open source material, such as
municipal government web sites, visitdetroit.com, the University of Michigan web site, the
Wayne State University’s College of Creative Studies’ website, and guide2detroit.com. Open
search terms used included: "Metro-Detroit Arts," "Metro-Detroit Theaters,” “Metro-Detroit
Museums," “Metro-Detroit Libraries,” “Metro Detroit History,” “Metro Detroit Science.”
Our intent was to collect the universe of organizations that fit the sampling frame. While the
search process may have missed

INVESTIGATING THE LOCATIONAL PATTERNS OF CULTURAL ORGANIZATIONS 19
some, our sample is close to the population of public and nonprofit cultural organizations
actively operating in the urbanized counties of Metropolitan Detroit and located within the five
sub-fields of arts and culture (visual arts, science, performing arts, historical organizations, and
libraries).
Data Analysis
The findings reported in this article are based on a two stage analysis that, first, explored
general locational patterns of cultural institutions in Metropolitan Detroit, to identify areas with
high and low accessibility of institutions. At this stage of the analysis, we used two approaches to
mapping the access: traditional density analysis that uses physical addresses to determine the
number of organizations located within a given area, and the index of access approach that
incorporates several accessibility factors, including institutional admission policy and the
presence of transportation infrastructure.
Second, the study examined access of diverse socio-demographic groups to cultural
amenities in their immediate geographic area. In particular, we were interested in groups of
population that are traditionally considered underrepresented among arts’ audiences, such as
racial minorities, populations with low socio-economic status and income, and low
education. Additionally, we explore access to multigenerational audiences that are
linked to arts’ organizations survival and longer-term sustainability - older populations as
potential donors, and young people as future publics and supporters.
Traditional Approach: Density Analysis. In the first part of the study, density analysis
was performed in ArcGIS with the goal of determining saturation levels for all cultural
organizations and the five sub-sectors, as a proxy for access. Physical addresses for each of the
335 public and nonprofit cultural organizations verified via Google maps were used as location-

INVESTIGATING THE LOCATIONAL PATTERNS OF CULTURAL ORGANIZATIONS 20
identifiers, as opposed to using organizational legal addresses, which may be different from
actual physical locations. We identified individual organizational locations instead of mapping
the sub-sectors as a whole, as was done in some previous studies of arts and culture locational
patterns (Grodach, Currid-Halkett, Foster, & Murdoch, 2014). Organizational addresses were
geocoded into a geographic information system, where each organization was identified by its
sub-group (visual arts, science, performing arts, historical organizations, and libraries). We then
performed spatial interpolation to determine relative density of organizations from the sector and
by sub-sectors, which allowed determining the locations of cultural deserts and cultural districts.
To study the density of organizational locations in a given area, a Kernel Density
approach is traditionally used to produce a raster map (also called a heat map), in which each cell
of the map is symbolized based on the number of features that are within a fixed search radius
from the center of that cell. One limitation of Kernel Density calculations is that the search area
can only be circular. However, a straight-line Euclidean distance is often not an accurate
representation of how people travel between locations. Taking this shortcoming into
consideration, this study used a modified density analysis approach that incorporated the existing
street network (Adams et al., 2010; Sparks et al., 2011; Witten et al., 2003).
In our approach, the selected search distance was used to create a ‘service area’ for each
organization’s location based on the street network. Overlapping service areas were then
symbolized to illustrate the number of organizations within the specified travel distance for each
area of the map. The resulting maps show areas with different densities of organizations (see
Appendix 1). The search distance of 1.92 miles was selected based on the default bandwidth
algorithm used in Kernel Density calculations, which measures the median and standard distance
from each of the features to the mean center, to calculate density bands. Density analysis allows

INVESTIGATING THE LOCATIONAL PATTERNS OF CULTURAL ORGANIZATIONS 21
identifying areas of organizational clustering and accessibility to high numbers of cultural
institutions using a true driving distance rather than geodesic distance (the shortest path between
two vertices). Locations with a heavy density of facilities - districts - are color-coded in red, and
locations with a low density of facilities – deserts - have no color. The maps also show
transitional areas, with the medium levels of organizational concentrations.
Revised Approach: Access Index. The access index presented in this article employs a
community resource accessibility model that builds upon previous studies of access in a variety
of community settings, such as education, health, and food (Adams et al., 2010; Bertrand et al.,
2008; Cummins et al., 2005; Pearce et al., 2006). Common approaches of measuring access to
community resources and amenities include: 1) counting the number of facilities within a given
distance from an area of interest (typically, within 500-1500 meters or a 5-10 minute walk); 2)
approximating the presence of at least one facility of a given type within a specified distance
from an area of interest; 3) measuring distance to the nearest facility of a given type; and 4)
calculating percentage of population with access to a community resource in an area of interest
(Adams et al., 2010; Bertrand et al., 2008; Pearce et al., 2006; Sparks, Bania, & Leete, 2011;
Witten, Exeter, & Field, 2003; Yoon & Srinivasan, 2015).
Building on these previous studies, the index of access advanced in this article is based
on the presence (or absence) of at least one facility of a given type (i.e. arts and culture sub-field)
within a specified distance from an area of interest. While such an approach is not without
limitations, our assumption was that as long as population of a given Census tract has access to at
least one type of cultural organization from a given sub-field within the specified access
parameters, that sub-field of culture would be considered accessible to the Census tract. In this

INVESTIGATING THE LOCATIONAL PATTERNS OF CULTURAL ORGANIZATIONS 22
approach, we did not account for the quality of cultural institutions or the specifics of their
admissions price structure.
Previous studies constructed the distance to a community resource by either using the
street network approach that factors in physical access barriers (Adams et al., 2010; Sparks et al.,
2011; Witten et al., 2003), or the Euclidean distance (as the crow flies) approach (Bertrand et al.,
2008; Sparks et al., 2011). Similar to the density analysis described above, for the access index
mapping we chose to rely on the street network approach to measuring distance, since such an
approach accounts for various physical barriers, including man-made and natural obstacles to
access (e.g. highways, bridges, rivers, lakes, etc.). Moreover, the street network approach relies
on actual street maps that members of the public are likely to use as navigation tools for reaching
cultural organizations within a given distance from their Census tract.
Additionally, previous studies of access to community resources relied on different
methods of aggregating data, including by zip code, tract, block, and even neighborhood (Sparks
et al., 2011). However, the lower the level of analysis is, the less secondary data is available for
further analyses. Therefore, we chose to focus on the Census tract as the unit of analysis, since
our ultimate goal was to examine accessibility of cultural resources to various socio-
demographic groups of population, and we could use the Census data for analyzing access at the
tract level. We used population-weighted Census tract centroids, rather than geography-based
centroids, to measure access.
Scholars of community resource accessibility have used various components for
designing their access indexes, such as travel time, distance, availability (or unavailability) of a
given resource, and an index was typically obtained as either a sum or a weighted sum of its
components (Bertrand et al., 2008; Pearce et al., 2006; Sparks et al., 2011; Witten et al., 2003).

INVESTIGATING THE LOCATIONAL PATTERNS OF CULTURAL ORGANIZATIONS 23
Previous studies have also relied on various means of transportation for approximating public
access to a community resource, such as walking, driving, and/or reliance on public
transportation (Adams et al., 2010; Bertrand et al., 2008; Pearce et al., 2006; Sparks et al., 2011;
Witten et al., 2003; Yoon & Srinivasan, 2015).
Building on the previous literature, the index of access presented in this article is an
aggregated score that each Census tract obtains based on the following six equally weighted
factors:
Free vs. paid admission policy (at least one institution of a kind within 0.5
miles of walking distance; coded as 1 for free admission and 0 if there are no
institutions with free admission).
Walking distance (at least one institution of a kind within 0.5 miles from the
population weighted center of a tract).
Biking distance (at least one institution of a kind within 5 miles from the
population weighted center of a tract).
Driving distance (at least one institution of a kind within 30 miles from the
population weighted center of a tract).
Connected by transit service (a bus route runs within 0.5 miles of walking
distance from the population weighted center of a tract).
At least 90 percent of residents have access to a car.
We constructed an index of access for the entire cultural sector and the five sub-fields
(visual arts, performing arts, science institutions, historical organizations, and libraries). No
weight was applied to any of the six factors, and a Census tract received a point for meeting each
of the above criteria. For example, if there was at least one institution of a given type with free

INVESTIGATING THE LOCATIONAL PATTERNS OF CULTURAL ORGANIZATIONS 24
admission located within 0.5 miles of the walking distance from the population weighted center
of a Census tract, that tract would receive 1 point for the first component of access. Half a mile
was chosen as a walking distance based on the previous studies that determined that this is the
outer limit that people will walk to use public transportation (Boarnet et al., 2013).
Access index values range from 0 to 6, with 0 being least accessible area and 6 being
most accessible area; however, in our study, no tract scored as 0. The outcome of this approach is
6 access areas (access scores 1, 2, 3, 4, 5, 6) that are collections of Census tracts with similar
levels of access. In substantive terms, people living in areas with high access scores have the
most access to cultural institutions, and people living in areas with low access scores have low
access to such institutions.
The novelty of this approach is that it considers the accessibility of cars and transit
service, as well as institutional admissions policy, which the traditional density analysis approach
did not include. For example, the access is now explained not only by the distance of a Census
tract from a cultural organization’s location, but rather by the availability of the transportation
infrastructure. That is to say, cultural organizations located further from Census tracts could still
be accessible to the population if transportation infrastructure were to become available.
While traditional density analysis reflects the cultural institutions’ geographic proximity
to each other, the access index scores consider factors beyond the density of institutions to
provide a more comprehensive view of each individual tracts’ level of accessibility. To further
advance this assessment of accessibility, we performed a cluster and outlier analysis to identify
cultural districts and cultural deserts that take into account the six accessibility factors
contributing to the index score. This analysis goes beyond identifying hot spots where cultural

INVESTIGATING THE LOCATIONAL PATTERNS OF CULTURAL ORGANIZATIONS 25
institutions cluster, and instead determines where people with high access to those institutions
are clustered.
Using GIS software Anselin Local Moran’s I (Zhang, Luo, Xu, & Ledwith, 2008),
measures were calculated for each census tract, which indicate if the access index scores of the
immediately surrounding census tracts are similar to the index score of the tract being studied. Z-
scores and p-values were then calculated to determine if the tract’s Anselin Local Moran’s I
similarity measure is statistically significant at a 95 percent confidence level. As shown in
Appendix 3, statistically significant clusters of tracts with high access index values (cultural
districts) are shown in red, while statistically significant clusters with low access index values
(cultural deserts) are shown in blue. Also depicted are outliers – tracts with a high access index
value that are surrounded by tracts with low values (High-Low Outlier), and conversely, low-
access tracts surrounded by tracts with low access index scores (Low-High Outlier).
Accessibility Analysis: Socio-Demographic Factors. In the second part of the study, we
explored the accessibility of cultural resources to different socio-demographic groups in the
population. Because previous analysis was conducted on Census tracts, we were able to compile
data to create socio-demographic profiles of each area and discuss how these areas are different
from one another. This was done by assigning an access value to each Census tract within the
geographic boundaries of Metropolitan Detroit, and accumulating across those Census tracts the
socio-demographic characteristics of the areas under the same access index value.
The socio-demographic characteristics of local communities were derived from the most
current Census data (2015), within the following categories: 1) socio-economic status and
income (median household income, percent in poverty, percent with Social Security, percent
with Food Stamps, percent with disability); 2) employment status (percent of unemployed,

INVESTIGATING THE LOCATIONAL PATTERNS OF CULTURAL ORGANIZATIONS 26
percent in labor force); 3) ethnicity/minority status (percent minority - all Non-Whites; percent
Hispanics); 3) age (under 18 years old; 65 years and over); 4) education (percent with less than
Bachelor degree); 5) population size. For most of these variables, we used the raw data counts
for each tract divided by that tract’s total population to calculate summary estimates for the
groups of tracts that share the same index score. The exceptions were the population size that
was reported as total population in a given geographical area, and the medians of the medians for
household income and age. Using medians as opposed to means allowed correcting for the
uneven distribution of data and the effect of outliers.
FINDINGS
The first goal of this study was to get a sense of the locational patterns of different groups
of cultural institutions in the urbanized counties of Metropolitan Detroit (Wayne, Oakland,
Macomb, and Washtenaw counties). To accomplish this goal, we used two approaches to
mapping access: a traditional density analysis that uses physical addresses of organizations as
access points, and the index of access approach that considers several accessibility factors. The
second goal was to examine access to institutional locations by various socio-demographic
groups of population. In particular, we sought to examine access for groups of population that
are traditionally considered underrepresented among arts’ audience, such as racial minorities,
people with low income, or low education. We also examined access for groups linked to
arts’ organizations survival and longer-term sustainability (older populations as potential
donors, and young people as future publics and supporters).
Findings from the Density Analysis
Based on the analysis of maps produced via traditional density analysis for the entire
cultural sector (map 1 in Appendix 1), cultural resources in the urbanized counties of

INVESTIGATING THE LOCATIONAL PATTERNS OF CULTURAL ORGANIZATIONS 27
Metropolitan Detroit are distributed unevenly, with some counties (Wayne, Oakland and
Washtenaw) having greater concentration of organizations as compared to other counties
(Macomb). There are two notable cultural districts – Woodward Corridor that includes the parts
of the City of Detroit and nearby suburbs, and the City of Ann Arbor (location of the University
of Michigan). A less notable cultural district is located in Royal Oak/Bloomfield Hills area
(modern-day centers of wealth in Metropolitan Detroit). However, there are also areas within
each county that have low concentration of cultural institutions (e.g. parts of the Washtenaw and
Macomb Counties).
Overall, the cultural sector in Metropolitan Detroit seems to follow three main
locational patterns: 1) historical path (areas with high concentration of organizations tend to be
located in the areas of initial population settlement); 2) population size and the presence of
governing bodies (areas with high concentrations of organizations tend to be located in the
areas of county seat locations), and 3) centers of community wealth. Newer facilities, in
particular, appeared to select locations with access to potential donors (where donors had
relocated as the city expanded), creating mini-districts in recent suburbs such as Bloomfield
Hills (established 1932), Rochester Hills (established 1984) and Northville (established 1955).
Our observations about the importance of historical legacy as well as dependency of
organizational locations upon the availability of resources are consistent with previous literature
on the location of cultural districts (Brooks & Kushner, 2001; Chang & Lee, 2003; Evans &
Foord, 2008; Grodach, 2016; Grodach, Currid-Halkett, Foster, & Murdoch III, 2014; Mommaas,
2004; Redaelli, 2012). Therefore, in line with the resource dependency theory (Pfeffer &
Salancik, 1978), there is an indication that organizations may be choosing certain locations due
to greater availability of resources in such locations.
INVESTIGATING THE LOCATIONAL PATTERNS OF CULTURAL ORGANIZATIONS 28
Another factor that appears to be important in describing the locational patterns of the
cultural sector, although not completely independent from the historical, population, and wealth
concentration factors, is the presence of educational infrastructure. In particular, cultural
organizations tend to be clustered in the areas of location of major public universities (University
of Michigan, Wayne State University, and Oakland University). Our observation about higher
density of cultural organizations in areas with the presence of universities is consistent with
findings by Florida (2002) regarding the important role of higher educational institutions for
creative vitality, and it also supports the resource dependency argument, as higher presence of
educational institutions is associated with more educated and, therefore, more resourceful
populations.
When comparing density maps for the sub-fields of arts and culture (maps 2-6 in
Appendix 1), it becomes clear that visual and performing arts organizations follow locational
patterns that are similar to the cultural sector overall, with cultural districts observed in areas of
historical settlement, modern day population centers, and areas with high concentration of
population wealth. Performing arts organizations are more widely distributed in Metropolitan
Detroit as compared to visual arts, and, in addition to the three noted above districts, they have a
clearly identifiable cultural district in Plymouth/Northville. Locations of visual arts organizations
are sparser, and most of the metropolitan area, with the exception of the three cultural districts,
could be considered as an area of low concentration of the visual arts.
Libraries and historical organizations are less concentrated; they are widely distributed in
the area and are covering both urban and rural locations. Less numerous - historical
organizations - have three clearly identifiable cultural districts – Detroit, Royal Oak, and West
Bloomfield. The largest deserts for this type are located in Macomb and the peripheral areas of

INVESTIGATING THE LOCATIONAL PATTERNS OF CULTURAL ORGANIZATIONS 29
Washtenaw counties. More numerous – libraries – are evenly distributed throughout the
Metropolitan Area, with lesser concentration of organizations in the rural Washtenaw County.
Among all types of organizations, libraries have the largest number of districts. There is a very
clear library district in Detroit and also notable districts in Ferndale, Livonia, and Trenton. There
is also concentration of libraries in Bloomfield Hills and Ann Arbor.
Science organizations are the least numerous and least concentrated in the area. The
largest science district is located in Ann Arbor, and the second largest is in Detroit. Both of these
districts are characterized by the presence of large research universities – University of Michigan
in Ann Arbor and Wayne State University in Detroit, which, perhaps, signifies strong
interconnectedness that exists between educational infrastructure and interest in and support for
science. There is at least some presence of science organizations in each of the four counties, but
there are also substantial areas of Metropolitan Detroit with no science institutions in close
proximity, thus indicating that access to science may be most problematic.
Overall, based on the density analysis, most accessible institutions are those greatest in
number (performing arts, libraries, historical organizations), and least accessible organizations
are those smallest in number (science centers). All non-arts organizations (history, science, and
libraries), which include significant number of younger organizations, seem to have followed
population and demand locational pattern rather than historical path. This observation is
consistent with Grodarch’s study (2016) that discovered the relative mobility of cultural clusters.
Density analysis also shows that, comparatively speaking, residents of Macomb County have the
least access to the cultural sector. However, there are variations in access depending on the sub-
field of culture.
Findings from the Access Index Analysis

INVESTIGATING THE LOCATIONAL PATTERNS OF CULTURAL ORGANIZATIONS 30
Locational maps for the entire cultural sector and the five sub-sectors that utilize the
index of access (Appendix 2) reveal a more nuanced picture of the cultural resources
accessibility in the urbanized counties of Metropolitan Detroit, as compared to the traditional
density analysis. Overall, access is more broadly distributed, which could be attributed to the
influence of particular access index components (such as access to, and availability of,
transportation), as well as the influence of libraries and historical organizations as the most
accessible institutions. Similarly to the density maps, some cultural districts in access maps are
located in the areas of wealth concentration; however, there are also high access areas that are
not linked to wealth concentration (darker areas on the maps in Appendix 2). High access zones
only partially follow locational patterns along the lines of population size, wealth concentration,
and the presence of county seats that were identified via the density analysis.
The access map for all cultural institutions (map 1 in Appendix 2) reveals that substantial
portions of the Metropolitan Detroit territory have average access to cultural amenities (indexes
3 and 4), and there are also more Census tracts that have high access (indexes 5 and 6) as
compared to low access (indexes 1 and 2). Therefore, majority of population in this area has
average or high access to cultural amenities. Additionally, access is widely distributed in the
four-county area, and there is no county in a particularly disadvantaged position. However, while
most cultural districts remain the same as in the density analysis, the City of Detroit itself and
parts of the Woodward corridor within the city appear to be in the average access zone (index 3),
and could no longer be considered as a cultural district2. The application of the multi-component
access index approach, therefore, provides a more nuanced picture of access as compared to the
density analysis.

INVESTIGATING THE LOCATIONAL PATTERNS OF CULTURAL ORGANIZATIONS 31
Furthermore, based on the cluster and outlier analysis (Appendix 3), we find that the
distribution of access index scores across metropolitan Detroit is not random, and that there are
areas with significantly higher access to cultural institutions and areas with significantly lower
access. Overall, cultural districts are located along the Woodward corridor - from the downtown
riverfront through the North End neighborhood of Detroit, and in the municipalities along the
corridor north of Detroit through Bloomfield - as well as in Hamtramck, the Grosse Pointe
communities, St. Clair Shores, Dearborn, Wyandotte, and Ann Arbor. The Oakland County
municipalities just north of Detroit also emerge as hotspots for each of the five cultural
subsectors individually. Likewise, the Grosse Pointe communities are hotspots for each
subsector, with the exception of science institutions. The Downriver communities south of
Detroit are home to districts for visual arts, historical organizations, and performing arts
institutions. Cultural deserts are generally located in the municipalities along the outer
boundaries of our four-county area.
While the overall access to the cultural sector appears to be widely distributed, when
comparing access maps for the sub-fields of arts and culture (maps 2-6 in Appendix 2), there are
notable differences in the access depending on the sub-field. For instance, visual arts and science
organizations appear to be the least accessible, as evidenced by more than half of the
Metropolitan Detroit territory covered with low access zones (indexes 1 and 2) for these sub-
fields. Moreover, science institutions do not have areas with the highest access (index 6). On the
other hand, access to the performing arts is more widely distributed. However, there are also no
areas where the access index reaches its highest score, which could be explained by the fact that
no performing arts institutions in the sample offer free admission (admission prices typically

INVESTIGATING THE LOCATIONAL PATTERNS OF CULTURAL ORGANIZATIONS 32
range from $3 to $250). Unsurprisingly, cultural districts for the performing arts are
geographically aligned with the centers of population wealth.
Access to libraries is particularly well-established, and there are only three zones with
access index of 1 (Appendix 2). Being the largest cultural sub-sector, locations of libraries shape
the overall access map, which also means that libraries play critical roles in ensuring wider
population access to culture. Therefore, our results confirm the historically important role of
libraries as long-standing public cultural institutions that are well-positioned to perform
important cultural and educational functions. Historical organizations are second best in terms of
their accessibility to the Metropolitan Detroit population; however, sizable portions of the area
are located in the medium access zones (index 3 and 4). It is also notable that cultural districts
for historical organizations, similarly to the performing arts, are located in the centers of
population wealth.
When reflecting on the access structure (i.e. the six components of the access index), it
appears that there are three factors that matter the most in describing the differences among the
sub-fields of arts and culture: a sub-sector’s size, institutional admissions policy, and availability
of, and access to, transportation. Understandably so, sub-sectors with greater number of
organizations offer better public access to the residents of Metropolitan Detroit, and
organizations offering free admissions are more accessible as well. On the other hand, the
fragmented access to public transportation that exists in the urbanized counties of Metropolitan
Detroit and uneven access to cars reduce the overall accessibility of cultural institutions.
Therefore, there are both factors that enable and limit access to cultural resources for the
population of Metropolitan Detroit.
Accessibility Analysis: The Role of Socio-Demographic Factors

INVESTIGATING THE LOCATIONAL PATTERNS OF CULTURAL ORGANIZATIONS 33
In the final part of the study, we explored the accessibility of cultural resources to
different socio-demographic groups by assigning an access score to each Census tract within the
geographic boundaries of Metropolitan Detroit, and accumulating across those Census tracts the
socio-demographic characteristics of the areas under the same access index value (Appendix 4).
The accessibility analysis has resulted in six access zones for all cultural sub-fields, except for
the performing arts and science organizations that only had five access zones and no zone with
the highest access. On the other end of the access continuum are the libraries that have all six
access zones but only three Census tracts with access of one. There are no Census tracts with
access of zero in any of the sub-fields of arts and culture organizations.
In order to analyze the accessibility of cultural resources to diverse population groups, we
focused on six socio-demographic factors: 1) socio-economic status and income (measured as
median household income, percent of population in poverty, percent with Social Security
income, percent with Food Stamps, and percent with disability), 2) employment status (measured
as percent of unemployed and percent in labor force), 3) ethnicity/minority status (measured as
percent minority – all Non-Whites and percent Hispanics), 4) education (measured as percent
with less than Bachelor degree), 5) age (measured as percent under 18 years old and percent 65
years and over), and 6) population size.
Our assumption was that the first four socio-demographic variables describe what could
be considered as traditionally underserved groups among cultural organizations’ audiences.
While this may not be true for all arts and culture organizations, classical forms of arts and
culture, especially the ones represented by the nonprofit sector (e.g. music and performing arts,
visual arts), are frequently considered to be ‘elitist’ (DiMaggio & Mukhtar, 2004). These
organizations have in some sense been built by the elites and are still largely sustained by them.

INVESTIGATING THE LOCATIONAL PATTERNS OF CULTURAL ORGANIZATIONS 34
So, the democratic—broad scale—legitimacy is lacking in such organizations. Therefore,
providing wider public access and diversifying their audiences by including members of the
underrepresented groups is of particular importance for the normative legitimacy of the classical
arts and culture organizations. Likewise, age (category 5), as a proxy for serving
multigenerational audiences, is an important variable when it comes to ensuring accessibility.
The ability of cultural organizations to serve young generations of future supporters and older
generations of current donors is important for both their immediate survival and intergenerational
sustainability (Moldavanova, 2016). The population size variable (category 6) could be viewed
as an overall indicator of the cultural sector’s accessibility, since the more population is located
in higher access zones, the more accessible the sector would be to the population of Metropolitan
Detroit.
Based on the analysis of the aggregated access table for the entire cultural sector (Table 1
in Appendix 4), the variable ‘population’ is approximately normally distributed, and the majority
of Metropolitan Detroit population has a reasonably good access (zones 3 and 4) to cultural
amenities. Moreover, there are only two Census tracts in the lowest access zone3. Therefore, it
appears that arts and culture organizations are generally well-positioned to serve substantial
proportions of the Metropolitan Detroit population, which, at least in theory, would mean the
enhanced prospects for the sector’s legitimacy and long-term sustainability. However, despite the
reasonably good access to cultural organizations per capita, there is also some evidence of an
‘elite’ access structure. In particular, the highest access zone (index 6) has fewer ethnic
minorities, fewer people with less than Bachelor degree, and higher household income, as
compared to other access zones. Concerns about access become clear when looked upon
separately for the different arts and cultural sub-fields.

INVESTIGATING THE LOCATIONAL PATTERNS OF CULTURAL ORGANIZATIONS 35
Consistent access deficiencies across all sub-fields of arts and culture are observed for the
communities in Metropolitan Detroit that have higher percentage of minority populations, as
well as higher percentage of less educated people (more people with less than Bachelor degrees).
Therefore, improving access for these two groups of population appears to be most critical.
Other, less consistent access deficiencies for various sub-fields of arts and culture include: areas
with higher proportion of low income population (in history, science, and performing arts), lower
proportion in labor force and higher unemployment (in history and performing arts), higher
percent receiving food stamps and in poverty (in history), higher percent receiving Social
Security (in libraries, history, performing arts, science), higher proportion of people with
disabilities (in history and science).4 Therefore, the results of our descriptive analysis indicate
that minority populations and those that have lower socio-economic and employment statuses
may, in fact, be at a greater disadvantage in terms of access to several sub-fields of arts and
culture organizations5. Subsequently, the existing access barriers would limit the ability of such
sub-fields to ensure comprehensive public access and effectively serve the diverse populations,
thus constraining their ability to gain access to diverse resources and achieve greater moral
legitimacy.
Among other, performing arts and historical organizations appear to have the type of
access structure that could be described as ‘elitist’, where access decreases for traditionally
underserved populations and increases for the more advantaged ones across multiple socio-
demographic measures. There is also evidence of an ‘elitist’ access structure in the other cultural
sub-fields. For example, highest access (index 6) to libraries is observed in areas with the highest
income and lowest percent of ethnic minorities. At the same time, highest access to visual arts is
observed for tracts with the highest income and socio-economic status (lowest unemployment,

INVESTIGATING THE LOCATIONAL PATTERNS OF CULTURAL ORGANIZATIONS 36
percent in poverty and receiving food stamps), lowest percent minority, lowest percent with less
education, lowest with percent with disability, and highest median age. Once again, these
observations point out possible presence of a certain ‘elitist’ access structure that follows
education and higher social status. Education, in particular, appears to be a consistent factor for
both reducing and enhancing access to most types of cultural amenities, with the exception of
libraries, where levels of education are similar across all access zones, and that seem to follow
more egalitarian locational patterns as compared to other cultural sub-fields. While our
descriptive analysis does not test for causality, it is possible that education may, in fact, be a
powerful predictor of the arts and culture organizations’ locational patterns6.
Our observation regarding the consistent role of education, as well as less consistent but
powerful roles of socio-economic status and proportion of minority, is not unproblematic for
organizational legitimacy. It implies that stakeholders with less education and lower social
mobility, who could have benefitted from improved access to cultural amenities more so than
more educated stakeholders with higher social mobility, are actually at a greater disadvantage in
terms of their access to cultural resources. This paints more of an instrumental rather than
normative view of organizational legitimacy, with clear access barriers that need to be overcome.
Therefore, while for resource-based considerations it may be economically more beneficial for
arts and culture institutions to focus on areas with higher levels of education and socio-economic
status, it is also morally imperative that such organizations work on ensuring better access for
less educated and less socially and economically advantaged populations.
DISCUSSION AND CONCLUSIONS
This article investigated public access and commitment to audience diversity as two
critically important values for public service organizations. Using the sample of

INVESTIGATING THE LOCATIONAL PATTERNS OF CULTURAL ORGANIZATIONS 37
335 public and nonprofit cultural organizations located in Metropolitan Detroit, we applied the
GIS-modelling approach to develop an index of public access to cultural institutions. While
previous approaches to mapping cultural institutions focused on physical locations of individual
organizations or whole sectors, our approach introduced an innovative way of defining and
analyzing access that takes into account institutional admissions policy, the physical
characteristics of a location, and the availability of, and access to, transportation.
We find that while the overall access to the cultural sector appears to be widely
distributed, there are substantial differences in the access depending on the sub-field of arts and
culture. Use of an index of access clearly identifies particularly problematic access areas. When
reflecting on the access structure, it appears that there are three factors that matter the most in
describing the differences among the sub-fields of arts and culture: a sub-sector’s size,
institutional admissions policy, and access to transportation. Understandably so, sub-sectors with
greater number of organizations offer better public access to the residents of Metropolitan
Detroit, and organizations offering free admissions are more accessible as well. On the other
hand, the fragmented public transportation infrastructure and limited access to cars that exists in
the urbanized counties of Metropolitan Detroit reduce the accessibility of cultural institutions.
We further used the U.S. Census Bureau data to analyze how accessible cultural
institutions are to the traditionally underserved populations. Our analysis revealed that arts and
culture organizations are generally well-positioned to serve substantial proportions of the
Metropolitan Detroit population; however, certain groups of the population are at a greater
disadvantage in terms of their access to particular types of cultural amenities. In particular,
consistent access deficiencies across all sub-fields of arts and culture are observed for the
communities in Metropolitan Detroit that have higher percentage of minorities, as well as higher

INVESTIGATING THE LOCATIONAL PATTERNS OF CULTURAL ORGANIZATIONS 38
percentage of less educated people. Therefore, improving access for these two groups of
population appears to be most critical. Other, less consistent, access deficiencies indicate that
populations that have lower socio-economic status and income, as well as lower employment,
may, in fact, also be at a greater disadvantage in terms of access to several types of arts and
culture organizations. Overall, we find some evidence of an ‘elitist’ access structure that follows
higher levels of education and higher social status.
These findings imply that, while moral legitimacy is an important pursuit for cultural
organizations that aspire to achieve long-term sustainability, organizations might be
underutilizing an important community resource – diverse audiences – that would allow
implementing their legitimacy goals in practice. Alongside the issues with the normative
dimension of legitimacy, we also find some evidence of more instrumental, elite-type
considerations that may be influencing arts and culture sector’s access structure. Therefore, from
a normative point of view, it would be important to overcome the existing access barriers in
order to enhance the ability of arts and culture organizations to act as socially responsible and,
ultimately, sustainable organizations.
These findings imply a window of opportunity for cultural organizations, donors, and
policy-makers. Some possible ways of improving public access to cultural organizations in the
urbanized counties of Metropolitan Detroit may include such institutional policies as offering
free admissions and/or subsidized access, especially for people with lower socio-economic
status, as well as increasing public outreach in geographic areas with high concentration of
minority populations and populations with lower levels of education. Particularly useful could be
the early outreach programs in public schools, in order to provide access and cultivate cultural
appreciation skills among young people early on in their lives.

INVESTIGATING THE LOCATIONAL PATTERNS OF CULTURAL ORGANIZATIONS 39
Additionally, a possible policy intervention that will help to reduce the existing access
barriers would be improving transportation options for low and medium access Census tracts to
ease access to cultural institutions, which may include both better public transportation networks
as well as donor-supported transportation to assist cultural institutions with their public outreach
efforts. Additionally, considering the low number and lower accessibility of science
organizations in Metropolitan Detroit, it would be beneficial to support the creation of new
science institutions in the area.
By offering an innovative way of defining and describing the accessibility of culture as a
community resource to the public, this article contributes to the previous scholarship in multiple
ways. First, the methodology introduced in this article contributes to the literature on community
resource accessibility by introducing a comprehensive, multi-component, index of access that
could be utilized in future studies of arts and culture accessibility beyond Metropolitan Detroit,
as well as studies of accessibility of other types of community resources7. Second, by
investigating the potential of arts and culture organizations to pursue two critical pillars of
organizational legitimacy – public access and audience diversity – this article sheds more light
on the application of the legitimacy theory. Access index analysis also indicates that cultural
organizations partially follow locational patterns along the lines of population size, wealth
concentration, county seat presence, thus supporting basic assumptions of the resource
dependency theory about organizations choosing locations with access to greater resources.
While offering these important methodological and theoretical contributions, the study is
not without limitations, some of which could offer potent directions for future research. First, our
study did not include commercial arts and culture organizations; however, there is often a
symbiotic connection that exists between arts businesses and nonprofits (Toepler &
INVESTIGATING THE LOCATIONAL PATTERNS OF CULTURAL ORGANIZATIONS 40
Wyszomirski, 2012), particularly the ones located within the same geographical boundaries.
Therefore, future studies would benefit from exploring access structure that considers both
commercial and noncommercial cultural organizations. Second, our comprehensive index of
access includes six components that are relevant for the context of our study; however, there may
be some variables currently not included in the study, such as, for example, economic factors
(admission price structure, behavioral incentives, quality of cultural supply and demand, etc.),
that may be important for understanding public access to cultural organizations. Additionally,
this study does not account for alternative programming, such as online and mobile exhibitions
and performances, which may improve access to cultural amenities. Future studies should
attempt to explore the role of such variables and, possibly, include those as part of the access
index.
Third, the analysis presented in this article is descriptive in nature, and it suggests rather
than tests the role of factors that either enhance or depress access to the cultural sector. Future
studies would benefit from predictive analyses that explore the relative weight and possible
causes of access barriers, as well relationships that may exist between socio-demographic
variables (as independent variables) and the access index (as the dependent variable). Fourth,
there is some indication that certain institutions provide less access, which may be because of
their attachment to elites via resource dependency that frees them from the necessity to reach
underserved populations. Therefore, it would be beneficial to explore possible resource
dependency patterns by assessing the extent of their revenue that comes from elite sources.
Additionally, our analysis is based on the specific context of urbanized counties in Metropolitan
Detroit; therefore, our observations may have limited potential for a wider generalizability.

INVESTIGATING THE LOCATIONAL PATTERNS OF CULTURAL ORGANIZATIONS 41
Future studies should include wider geographical contexts, in order to identify which access
barriers are sector-specific and which ones are geographically-determined.
Finally, future studies would benefit from researching the effectiveness of
various methods used by organizations for reaching out to underserved populations, as
well as the structure of individual preferences for particular genres and types of cultural
expression, which may help to identify access barriers that uniquely affect such
populations. Gaining such knowledge may allow cultural organizations to tailor their
programming to the specific needs of underserved populations, thus improving prospects for
their own organizational sustainability.
Endnotes 1. Foundations, in particular, served as critical stakeholders that were able to raise fundsnecessary for safeguarding the DIA’s collections. However, during the Great Recession,DIA’s operations were also supported by the tax mileage levied in a tri-county area(Wayne, Macomb, Oakland), which was passed via popular vote by the majorityresidents in these counties. Such multilayered support shows that the DIA has gainedlegitimacy among both elite and non-elite stakeholders.
2. At the root of this observation is the fact that the car ownership rate (one of our accessindex components) within the boundaries of the City of Detroit is relatively low.
3. Socio-demographic profile for zone 1 in the access table for the entire cultural sectorshould be interpreted with caution. Zone 1 contains only two Census tracts, and one ofthose tracts is the federal corrections facility that houses higher proportion ofdisadvantaged population.
4. Libraries, however, are a special case, as one of the three Census tracts with the lowestaccess level (index 1) is the federal corrections facility that houses higher proportion ofminority population and people with disabilities.
5. It should be noted that access zone 5 is an outlier. The access structure in zone 5, in fact,resembles that of zone 1, where access deficiencies are observed for the traditionallyunderserved populations. This ‘outlying’ position of zone 5 is explained by the fact that itcaptures significant proportion of Census tracts located within the City of Detroit, all ofwhich have a relatively high number of cultural institutions in close proximity, but alsopopulations with low access to cars. One exception from this pattern is music andperforming arts organizations, where zone 5 follows access patterns similar to those ofzone 6. The latter is a result of the paid admission that influences access index values forthe performing arts.
6. It is possible that arts and culture organizations would be more likely to choose moreeducated communities as their locations due to the higher levels of arts and culture

INVESTIGATING THE LOCATIONAL PATTERNS OF CULTURAL ORGANIZATIONS 42
appreciation observed, and higher levels of support available, in such communities. However, considering the positive relationship that exists between human capital (expressed via levels of education) and other forms of capital (economic, social, etc.) (Bourdieu, 1986); it is also possible that more educated people would have more resources to enable their own higher access to cultural amenities.
7. While several previous studies have explored the accessibility of various community resources to different socio-demographic groups of population (Adams et al., 2010; Sparks et al., 2011), including the accessibility of cultural resources (Redaelli, 2012), none of those studies employed such a comprehensive approach to defining access as the multi-component index that we used in this article.
References
Adams, A. T., Ulrich, M. J., & Coleman, A. (2010). Food Deserts. Journal of Applied Social Science, 4(2), 58-62.
Azmat, F., Fujimoto, Y., & Rentschler, R. (2015). Exploring cultural inclusion: Perspectives from a community arts organisation. Australian Journal of Management, 40(2), 375-396.
Belfiore, E. (2002). Art as a means of alleviating social exclusion: does it really work? A critique of instrumental cultural policies and social impact studies in the UK. International Journal o f Cultural Policy, 8(1), 91-106.
Bertrand, L., Thérien, F., & Cloutier, M.-S. (2008). Measuring and mapping disparities in access to fresh fruits and vegetables in Montreal. Canadian Journal of Public Health, 99(1), 6-11.
Bourdieu, P. (1986). The forms of Capital. In J. G. Richardson (Ed.), Handbook of Theory and Research for the Sociology and Education (pp. 241-258). New York: Greenwood.
Boarnet, M. G., Hong, A., Lee, J., Wang, X., Wang, W., Houston, D., & Spears, S. (2013). The Exposition Light Rail Line Study: A Before-and-After Study of the Impact of New Light Rail Transit Service. Research monograph at available https://trid. trb. org/view. aspx.
Borwick, D. (2012). Building Communities, Not Audiences: The Future of the Arts in the United States. Winston-Salem: ArtsEngaged.
Brooks, A. C., & Kushner, R. J. (2001). Cultural districts and urban development. International Journal of Arts Management, 3(2), 4-15.
Bryson, J. M. (2004). Strategic Planning for Public and Nonprofit Organizations: A Guide to Strengthening and Sustaining Organizational Achievement. San Francisco: Wiley.
Chang, T. C., & Lee, W. K. (2003). Renaissance city Singapore: A study of arts spaces. Area, 35(2), 128-141.
Cummins, S., Findlay, A., Petticrew, M., & Sparks, L. (2005). Healthy cities: The impact of food retail-led regeneration on food access, choice and retail structure. Built Environment, 31(4), 288-301.
Currid, E. (2009). Bohemia as subculture;“bohemia” as industry: Art, culture, and economic development. Journal of Planning Literature, 23(4), 368-382.
DiMaggio, P., & Mukhtar, T. (2004). Arts participation as cultural capital in the United States, 1982–2002: Signs of decline? Poetics, 32(2), 169-194.
Dowling, J., & Pfeffer, J. (1975). Organizational legitimacy: Social values and organizational behavior. Pacific Sociological Review, 18(1), 122-136.
Evans, G., & Foord, J. (2008). Cultural mapping and sustainable communities: Planning for the arts revisited. Cultural Trends, 17(2), 65-96.

INVESTIGATING THE LOCATIONAL PATTERNS OF CULTURAL ORGANIZATIONS 43
Florida, R. (2002). The Rise of the Creative Class and How It’s Transforming Work, Life, Community and Everyday Life: New York: Basic Books.
Graves, J. B. (2005). Cultural Democracy: The Arts, Community, and the Public Purpose. Chicago: University of Illinois Press.
Grodach, C. (2016). Mapping the arts: Industry concentrations, distribution, and change in the US, 1980–2010. International Journal of Cultural Policy, 22(3), 353-375.
Grodach, C., Currid-Halkett, E., Foster, N., & Murdoch III, J. (2014). The location patterns of artistic clusters: A metro-and neighborhood-level analysis. Urban Studies, 51(13), 2822-2843.
Hager, M. A., & Winkler, M. K. (2012). Motivational and demographic factors for performing arts attendance across place and form. Nonprofit and Voluntary Sector Quarterly, 41(3), 474-496.
Hesmondhalgh, D., & Pratt, A. C. (2005). Cultural industries and cultural policy. International Journal of Cultural Policy, 11(1), 1-13.
Johanson, K., Glow, H., & Kershaw, A. (2014). New modes of arts participation and the limits of cultural indicators for local government. Poetics, 43(1), 43-59.
Kevin F McCarthy, & Jinnett, K. J. (2001). A New Framework for Building Participation in the Arts. Santa Monica: Rand Corporation.
Kim, M. (2016). Characteristics of civically engaged nonprofit arts organizations: The results of a national survey. Nonprofit and Voluntary Sector Quarterly, 0899764016646473.
Koteen, J. (1997). Strategic Management in Public and Nonprofit Organizations: Managing Public Concerns in an Era of Limits. Westport, CT: Praeger.
Kotler, N. G., Kotler, P., & Kotler, W. I. (2008). Museum Marketing and Strategy: Designing Missions, Building Audiences, Generating Revenue and Resources. San Francisco: John Wiley & Sons.
LeRoux, K., & Bernadska, A. (2014). Impact of the arts on individual contributions to US civil society. Journal of Civil Society, 10(2), 144-164.
Markusen, A. (2014). Creative Cities: a 10-Year Research Agenda. Journal of Urban Affairs, 36(s2), 567-589.
McCarthy, K. F., Ondaatje, E. H., & Novak, J. L. (2007). Arts and Culture in the Metropolis: Strategies for Sustainability. Santa Monica: Rand Corporation.
Moldavanova, A. (2013). Sustainability, ethics, and aesthetics. The International Journal of Sustainability Policy and Practice, 8(1), 109-120.
Moldavanova, A. (2016). Two narratives of intergenerational sustainability: A framework for sustainable thinking. The American Review of Public Administration, 46(5), 526-545.
Moldavanova, A., & Goerdel, H. T. (2018). Understanding the puzzle of organizational sustainability: Toward a conceptual framework of organizational social connectedness and sustainability. Public Management Review, 20(1), 55-81.
Moldavanova, A. V., Pierce, J. C., & Lovrich, N. P. (2017). Sociopolitical sources of creative cultural capital in US counties. Journal of Urban Affairs, 1-25. doi:10.1080/07352166.2017.136073
Mommaas, H. (2004). Cultural clusters and the post-industrial city: Towards the remapping of urban cultural policy. Urban Studies, 41(3), 507-532.
Moore, M. H. (2000). Managing for value: Organizational strategy in for-profit, nonprofit, and governmental organizations. Nonprofit and Voluntary Sector Quarterly, 29(1), 183-208.

INVESTIGATING THE LOCATIONAL PATTERNS OF CULTURAL ORGANIZATIONS 44
Nurse, K. (2006). Culture as the fourth pillar of sustainable development. Small States: Economic Review and Basic Statistics(11), 28-40.
O'Donovan, G. (2002). Environmental disclosures in the annual report: Extending the applicability and predictive power of legitimacy theory. Accounting, Auditing & Accountability Journal, 15(3), 344-371.
Pearce, J., Witten, K., & Bartie, P. (2006). Neighbourhoods and health:A GIS approach to measuring community resource accessibility. Journal of Epidemiology and Community Health, 60(5), 389-395.
Pfeffer, J., & Salancik, G. R. (1978). The External Control of Organizations: A Resource Dependence Perspective. New York: Harper and Row.
Pratt, A. C. (2008). Creative cities: The cultural industries and the creative class. Geografiska Annaler: Series B, Human Geography, 90(2), 107-117.
Redaelli, E. (2012). Cultural planning in the United States: Toward authentic participation using GIS. Urban Affairs Review, 48(5), 642-669.
Rushton, M., & Landesman, R. (2013). Creative Communities: Art Works in Economic Development. Washington DC: Brookings Institution Press.
Scott, A. (2006). Creative cities: Conceptual issues and policy questions. Journal of Urban Affairs, 28(1), 1-17.
Sparks, A. L., Bania, N., & Leete, L. (2011). Comparative approaches to measuring food access in urban areas the case of Portland, Oregon. Urban Studies, 48(8), 1715-1737.
Strom, E. (2003). Cultural policy as development policy: Evidence from the United States. International Journal of Cultural Policy, 9(3), 247-263.
Stryker, M. (2015). DIA Hits Its Grand Bargain Goal. Detroit Free Press. Retrieved from http://www.freep.com/story/entertainment/arts/2015/01/05/dia-grand-bargain-payments/21306891/.
Suchman, M. C. (1995). Managing legitimacy: Strategic and institutional approaches. Academy of Management Review, 20(3), 571-610.
Thomas, T. E., & Lamm, E. (2012). Legitimacy and organizational sustainability. Journal of Business Ethics, 110(2), 191-203.
Throsby, D. (1995). Culture, economics and sustainability. Journal of Cultural Economics, 19(3), 199-206.
Toepler, S., & Wyszomirski, M. J. (2012). Arts and Culture. In L. M. Salamon (Ed.), The state of nonprofit America (pp. 229-266). Washington DC: Brookings Institution Press.
Tubadji, A., Osoba, B. J., & Nijkamp, P. (2015). Culture-based development in the USA: Culture as a factor for economic welfare and social well-being at a county level. Journal of Cultural Economics, 39(3), 277-303.
Varbanova, L. (2013). Strategic Management in the Arts. New York: Routledge. Wilks-Heeg, S., & North, P. (2004). Cultural policy and urban regeneration: A special edition of
local economy. Local Economy, 19(4), 305-311. Witten, K., Exeter, D., & Field, A. (2003). The quality of urban environments: mapping variation
in access to community resources. Urban Studies, 40(1), 161-177. Yoon, H., & Srinivasan, S. (2015). Are they well situated? Spatial analysis of privately owned
public space, Manhattan, New York City. Urban Affairs Review, 51(3), 358-380. Zhang, C., Luo, L., Xu, W., & Ledwith, V. (2008). Use of local Moran's I and GIS to identify
pollution hotspots of Pb in urban soils of Galway, Ireland. Science of The Total Environment, 398(1), 212-221.

INVESTIGATING THE LOCATIONAL PATTERNS OF CULTURAL ORGANIZATIONS 45
Appendix 1. Metropolitan Detroit Density Maps for All Cultural Organizations and the Five Sub-Sectors
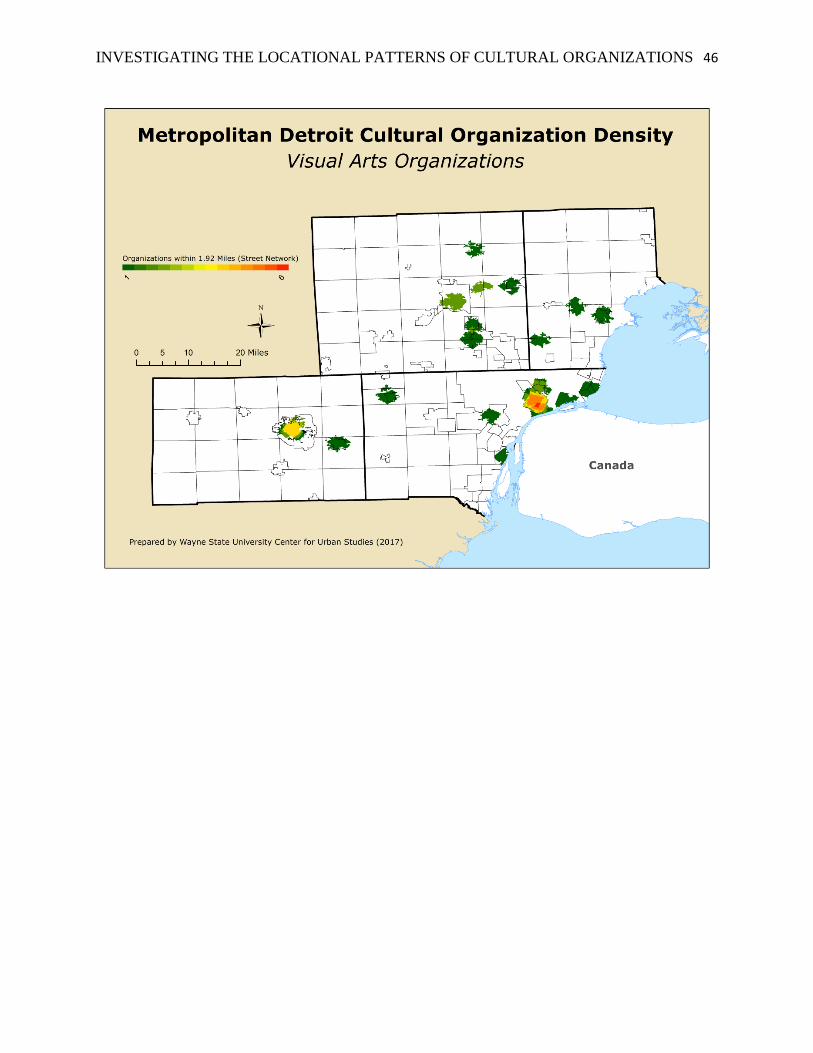
INVESTIGATING THE LOCATIONAL PATTERNS OF CULTURAL ORGANIZATIONS 46

INVESTIGATING THE LOCATIONAL PATTERNS OF CULTURAL ORGANIZATIONS 47

INVESTIGATING THE LOCATIONAL PATTERNS OF CULTURAL ORGANIZATIONS 48

INVESTIGATING THE LOCATIONAL PATTERNS OF CULTURAL ORGANIZATIONS 49

INVESTIGATING THE LOCATIONAL PATTERNS OF CULTURAL ORGANIZATIONS 50

INVESTIGATING THE LOCATIONAL PATTERNS OF CULTURAL ORGANIZATIONS 51
Appendix 2. Metropolitan Detroit Access Index Maps for All Cultural Organizations and the Five Sub-Sectors

INVESTIGATING THE LOCATIONAL PATTERNS OF CULTURAL ORGANIZATIONS 52

INVESTIGATING THE LOCATIONAL PATTERNS OF CULTURAL ORGANIZATIONS 53

INVESTIGATING THE LOCATIONAL PATTERNS OF CULTURAL ORGANIZATIONS 54

INVESTIGATING THE LOCATIONAL PATTERNS OF CULTURAL ORGANIZATIONS 55

INVESTIGATING THE LOCATIONAL PATTERNS OF CULTURAL ORGANIZATIONS 56

INVESTIGATING THE LOCATIONAL PATTERNS OF CULTURAL ORGANIZATIONS 57
Appendix 3. Maps of Cultural Clusters and Outliers Based on Anselin Local Moran’s I Measures (All Cultural Organizations and the Five Sub-Sectors).

INVESTIGATING THE LOCATIONAL PATTERNS OF CULTURAL ORGANIZATIONS 58

INVESTIGATING THE LOCATIONAL PATTERNS OF CULTURAL ORGANIZATIONS 59

INVESTIGATING THE LOCATIONAL PATTERNS OF CULTURAL ORGANIZATIONS 60

INVESTIGATING THE LOCATIONAL PATTERNS OF CULTURAL ORGANIZATIONS 61

INVESTIGATING THE LOCATIONAL PATTERNS OF CULTURAL ORGANIZATIONS 62

INVESTIGATING THE LOCATIONAL PATTERNS OF CULTURAL ORGANIZATIONS 63
Appendix 4. Tables with Access Index and Socio-Demographic Variables (All Cultural Organizations and the Five Sub-Sectors) Access Index Score - All Cultural Organizations Total
Variable 1 2 3 4 5 6 (Four
Counties) Number of tracts 2 87 785 279 85 20 1,258 Population 4,896 333,163 2,662,403 897,616 256,491 62,684 4,217,253 % in Labor Forcea 36.0% 61.7% 62.5% 64.7% 57.4% 62.4% 62.6% Unemployment Ratea 6.8% 10.5% 11.0% 9.2% 13.4% 9.5% 10.7% Employment/Population Ratioa 33.6% 55.2% 55.6% 58.7% 49.7% 56.5% 55.9% % in Poverty 19.7% 15.3% 17.4% 14.3% 31.2% 15.0% 17.3% Mean Household Income 40,504 70,843 74,193 74,538 57,461 81,067 73,045 Median of Median Household Income 14,739 49,063 48,438 53,894 27,349 49,152 49,201 % of Households with SNAP/Food Stamps 27.5% 16.6% 18.0% 14.3% 25.5% 13.2% 17.5% % of Households with Social Security 44.9% 33.8% 31.5% 30.5% 27.9% 31.8% 31.3% Median of Median Age 50 42 40 40 37 42 40 % under 18 4.4% 23.0% 23.3% 22.3% 21.5% 23.5% 23.0% % 65 and over 24.1% 15.0% 14.0% 14.3% 11.4% 14.2% 14.0% % Minority 82.2% 28.4% 36.9% 30.6% 43.1% 23.7% 35.1% % Hispanic 5.5% 3.8% 4.0% 3.7% 9.8% 2.6% 4.3% % Less than Bachelor’s Degreeb 73.4% 75.0% 71.1% 68.8% 75.2% 69.4% 71.2% % With Disability 37.1% 15.1% 13.5% 13.3% 14.4% 13.6% 13.6%
Note.a Persons 16 years or older; b Persons 18 years or older Source: U.S. Census Bureau, 2011-2015 American Community Survey Prepared by Wayne State University Center for Urban Studies (2017)

INVESTIGATING THE LOCATIONAL PATTERNS OF CULTURAL ORGANIZATIONS 64
Access Index Score - Historical Organizations Total
Variable 1 2 3 4 5 6 (Four
Counties) Number of tracts 34 289 711 202 20 2 1,258 Population 90,767 992,149 2,397,449 657,215 73,630 6,043 4,217,253 % in Labor Forcea 54.2% 61.4% 62.8% 65.0% 60.0% 74.9% 62.6% Unemployment Ratea 18.2% 12.3% 10.3% 8.7% 10.2% 3.6% 10.7% Employment/Population Ratioa 44.4% 53.8% 56.2% 59.3% 53.8% 72.0% 55.9% % in Poverty 27.5% 18.2% 17.1% 14.4% 28.9% 2.8% 17.3% Mean Household Income 47,018 65,223 75,724 79,267 64,982 89,756 73,045 Median of Median Household Income 31,953 $45,729 50,063 56,217 31,250 76,053 49,201 % of Households with SNAP/Food Stamps 31.1% 20.0% 17.0% 13.3% 21.7% 4.4% 17.5% % of Households with Social Security 37.5% 33.3% 30.9% 29.2% 26.5% 26.9% 31.3% Median of Median Age 36 40 40 40 36 42 40 % under 18 23.1% 23.1% 23.1% 22.3% 24.3% 21.4% 23.0% % 65 and over 15.5% 14.4% 13.9% 13.6% 11.5% 12.3% 14.0% % Minority 64.4% 37.0% 35.1% 28.7% 30.8% 5.2% 35.1% % Hispanic 2.1% 3.1% 4.5% 4.2% 16.0% 2.4% 4.3% % Less than Bachelor’s Degreeb 85.9% 77.8% 69.7% 64.5% 71.9% 58.4% 71.2% % With Disability 19.2% 15.4% 13.1% 12.5% 13.0% 10.9% 13.6%
Note.a Persons 16 years or older; b Persons 18 years or older Source: U.S. Census Bureau, 2011-2015 American Community Survey Prepared by Wayne State University Center for Urban Studies (2017)

INVESTIGATING THE LOCATIONAL PATTERNS OF CULTURAL ORGANIZATIONS 65
Access Index Score - Libraries Total
Variable 1 2 3 4 5 6 (Four
Counties) Number of tracts 3 108 807 273 49 18 1,258 Population 8,195 419,131 2,723,566 873,094 134,243 59,024 4,217,253 % in Labor Forcea 44.9% 62.5% 62.3% 64.9% 55.3% 62.7% 62.6% Unemployment Ratea 6.0% 9.6% 11.1% 9.0% 17.5% 9.4% 10.7% Employment/Population Ratioa 42.2% 56.5% 55.3% 59.0% 45.6% 56.7% 55.9% % in Poverty 13.0% 13.3% 18.3% 13.8% 34.1% 15.1% 17.3% Mean Household Income 65,098 78,519 72,352 76,250 46,415 80,218 73,045 Median of Median Household Income 29,478 53,682 47,372 54,348 25,938 49,152 49,201 % of Households with SNAP/Food Stamps 18.6% 14.5% 18.5% 13.6% 33.4% 13.6% 17.5% % of Households with Social Security 41.0% 33.3% 31.2% 30.3% 31.5% 31.8% 31.3% Median of Median Age 45 42 40 40 36 42 40 % under 18 10.5% 23.1% 23.1% 22.3% 24.0% 24.3% 23.0% % 65 and over 22.3% 15.0% 13.8% 14.2% 12.5% 14.5% 14.0% % Minority 57.6% 25.8% 37.3% 29.6% 57.9% 23.7% 35.1% % Hispanic 5.1% 3.7% 4.1% 3.7% 13.7% 2.6% 4.3% % Less than Bachelor’s Degreeb 66.8% 70.8% 71.7% 68.2% 81.0% 69.2% 71.2% % With Disability 25.1% 13.9% 13.6% 13.2% 17.1% 13.9% 13.6%
Note.a Persons 16 years or older; b Persons 18 years or older Source: U.S. Census Bureau, 2011-2015 American Community Survey Prepared by Wayne State University Center for Urban Studies (2017)

INVESTIGATING THE LOCATIONAL PATTERNS OF CULTURAL ORGANIZATIONS 66
Access Index Score - Performing Arts and Music Organizations Total
Variable 1 2 3 4 5 6 (Four
Counties) Number of tracts 27 287 701 232 11 0 1,258 Population 93,656 1,106,543 2,250,285 736,786 29,983 - 4,217,253 % in Labor Forcea 62.5% 64.9% 61.0% 63.7% 72.7% - 62.6% Unemployment Ratea 11.0% 8.9% 12.1% 9.3% 5.9% - 10.7% Employment/Population Ratioa 55.6% 59.1% 53.6% 57.7% 68.4% - 55.9% % in Poverty 19.7% 12.3% 20.4% 15.5% 7.0% - 17.3% Mean Household Income 56,384 79,006 69,048 77,817 92,762 - 73,045 Median of Median Household Income 37,379 61,033 42,719 52,969 66,050 - 49,201 % of Households with SNAP/Food Stamps 21.1% 13.6% 20.4% 14.1% 7.1% - 17.5% % of Households with Social Security 32.3% 30.5% 32.1% 30.0% 25.1% - 31.3% Median of Median Age 38 40 40 40 44 - 40 % under 18 21.3% 23.7% 22.9% 22.4% 17.0% - 23.0% % 65 and over 14.6% 13.3% 14.3% 14.0% 12.5% - 14.0% % Minority 41.0% 24.4% 41.5% 31.5% 17.2% - 35.1% % Hispanic 4.5% 3.4% 4.6% 4.6% 2.7% - 4.3% % Less than Bachelor’s Degreeb 76.9% 71.9% 72.5% 66.3% 52.5% - 71.2% % With Disability 16.9% 12.5% 14.4% 12.8% 11.7% - 13.6%
Note.a Persons 16 years or older; b Persons 18 years or older Source: U.S. Census Bureau, 2011-2015 American Community Survey Prepared by Wayne State University Center for Urban Studies (2017)

INVESTIGATING THE LOCATIONAL PATTERNS OF CULTURAL ORGANIZATIONS 67
Access Index Score - Science Organizations Total
Variable 1 2 3 4 5 6 (Four
Counties) Number of tracts 170 708 306 64 10 0 1,258 Population 523,841 2,549,816 897,123 213,414 33,059 - 4,217,253 % in Labor Forcea 58.6% 64.0% 60.4% 67.6% 47.8% - 62.6% Unemployment Ratea 17.3% 9.2% 12.2% 7.0% 10.7% - 10.7% Employment/Population Ratioa 48.4% 58.0% 53.0% 62.8% 42.6% - 55.9% % in Poverty 27.9% 13.2% 23.2% 14.2% 39.8% - 17.3% Mean Household Income 48,863 78,844 65,592 97,061 74,342 - 73,045 Median of Median Household Income 31,010 57,211 40,375 67,551 24,003 - 49,201 % of Households with SNAP/Food Stamps 29.8% 13.9% 21.7% 10.3% 16.3% - 17.5% % of Households with Social Security 34.2% 31.5% 30.5% 25.9% 21.3% - 31.3% Median of Median Age 37 41 39 37 26 - 40 % under 18 23.2% 23.1% 23.0% 22.8% 9.0% - 23.0% % 65 and over 13.9% 14.2% 13.7% 13.1% 8.7% - 14.0% % Minority 59.4% 27.7% 44.3% 24.2% 39.8% - 35.1% % Hispanic 5.1% 3.3% 6.6% 4.5% 3.3% - 4.3% % Less than Bachelor’s Degreeb 83.5% 70.5% 71.5% 48.2% 67.5% - 71.2% % With Disability 18.6% 12.6% 14.7% 10.3% 7.8% - 13.6%
Note.a Persons 16 years or older; b Persons 18 years or older Source: U.S. Census Bureau, 2011-2015 American Community Survey Prepared by Wayne State University Center for Urban Studies (2017)

INVESTIGATING THE LOCATIONAL PATTERNS OF CULTURAL ORGANIZATIONS 68
Access Index Score - Visual Arts Organizations Total
Variable 1 2 3 4 5 6 (Four
Counties) Number of tracts 81 503 534 116 20 4 1,258 Population 254,843 1,847,112 1,657,532 391,756 55,788 10,222 4,217,253 % in Labor Forcea 58.5% 64.2% 61.2% 64.9% 52.1% 62.5% 62.6% Unemployment Ratea 14.5% 9.4% 12.2% 8.2% 13.6% 7.8% 10.7% Employment/Population Ratioa 50.0% 58.2% 53.7% 59.6% 44.9% 57.6% 55.9% % in Poverty 24.1% 12.9% 21.7% 13.8% 37.7% 7.1% 17.3% Mean Household Income 53,226 79,188 67,001 85,062 57,644 114,180 73,045 Median of Median Household Income 34,409 60,250 41,056 57,813 22,375 64,207 49,201 % of Households with SNAP/Food Stamps 26.3% 13.9% 21.1% 12.1% 23.3% 5.0% 17.5% % of Households with Social Security 35.2% 31.2% 31.4% 29.4% 22.9% 30.8% 31.3% Median of Median Age 39 40 39 40 33 43 40 % under 18 22.2% 23.2% 23.1% 23.3% 14.5% 20.5% 23.0% % 65 and over 15.8% 13.9% 14.0% 13.8% 9.6% 13.8% 14.0% % Minority 55.0% 29.0% 41.2% 24.6% 42.2% 15.4% 35.1% % Hispanic 2.1% 3.0% 5.9% 4.9% 3.6% 4.3% 4.3% % Less than Bachelor’s Degreeb 79.3% 70.0% 73.2% 62.7% 73.7% 59.9% 71.2% % With Disability 18.8% 12.7% 14.4% 11.9% 12.1% 10.4% 13.6%
Note.a Persons 16 years or older; b Persons 18 years or older Source: U.S. Census Bureau, 2011-2015 American Community Survey Prepared by Wayne State University Center for Urban Studies (2017)