research paper series no. 2002-09 - philippine ... allow for a 10 percent yearly increase in rent...
TRANSCRIPT

Benefits (and Losses) from Rent Control
in the Philippines:
An Empirical Study of Metro Manila
Marife M. Ballesteros
PHILIPPINE INSTITUTE FOR DEVELOPMENT STUDIES Surian sa mga Pag-aaral Pangkaunlaran ng Pilipinas
RESEARCH PAPER
SERIES No. 2002-09

The author, Marife M. Ballesteros, is a Senior Research Fellowat the Philippine Institute for Development Studies (PIDS). She holdsa Ph.D. in Social Sciences from the University of Nijmegen, TheNetherlands. Her fields of specialization are economic anthropology,and housing and urban development.
Marife M. Ballesteros
RESEARCH PAPER SERIES NO. 2002-09
PHILIPPINE INSTITUTE FOR DEVELOPMENT STUDIESSurian sa mga Pag-aaral Pangkaunlaran ng Pilipinas
Benefits (and Losses) from Rent Controlin the Philippines:
An Empirical Study of Metro Manila

Copyright 2003Philippine Institute for Development Studies
Printed in the Philippines. All rights reserved.
The views expressed in this paper are those of the author and do notnecessarily reflect the views of any individual or organization. Please donot quote without permission from the author nor PIDS.
Please address all inquiries to
Philippine Institute for Development StudiesNEDA sa Makati Building, 106 Amorsolo StreetLegaspi Village, 1229 Makati City, PhilippinesTel: (63-2) 893-5705 / 892-4059Fax: (63-2) 893-9589 / 816-1091E-mail: [email protected]: http://www.pids.gov.ph
ISBN 971-564-027-3RP 03-03-500
Table of Contents
Abstract . . . . . . . . . . . . . . . . . . . . . . . . . . . . . . . . . . . . . . . . . . . . . . . . v
I. Introduction . . . . . . . . . . . . . . . . . . . . . . . . . . . . . . . . . . . . . . . . . 1
II. The Institution of Rent Control in the Philippines . . . . . . . . . 5
III. Methodology . . . . . . . . . . . . . . . . . . . . . . . . . . . . . . . . . . . . . . . . 11
IV. Features of the Rental Sector in Metro Manila . . . . . . . . . . . . 15
V. Net Benefits and Distributional Effects of Rent Control . . . . 19
VI. Conclusions and Policy Recommendations . . . . . . . . . . . . . . 25
References . . . . . . . . . . . . . . . . . . . . . . . . . . . . . . . . . . . . . . . . . . . . . . 29
Appendices . . . . . . . . . . . . . . . . . . . . . . . . . . . . . . . . . . . . . . . . . . . . . 31
iii
List of Tables and Appendices
Table1 Schedule of Rent Ceiling and Maximum
Rental Increases . . . . . . . . . . . . . . . . . . . . . . . . . . . . . . . . . . . 62 Index of the Degree of Rent Control in the Philippines . . 83 Distribution of Countries by Extent of Rent Control . . . . 94 Characteristics of Households in Controlled
and Uncontrolled Sectors . . . . . . . . . . . . . . . . . . . . . . . . . . . 155 Characteristics of Dwellings in Controlled
and Uncontrolled Sectors . . . . . . . . . . . . . . . . . . . . . . . . . . . 176 Distribution of Renter-Household by Income Decile
and Rent . . . . . . . . . . . . . . . . . . . . . . . . . . . . . . . . . . . . . . . . . 187 Benefit Summary Statistics . . . . . . . . . . . . . . . . . . . . . . . . . . 208 Benefit Targeting . . . . . . . . . . . . . . . . . . . . . . . . . . . . . . . . . . 219 Benefit by Income Deciles . . . . . . . . . . . . . . . . . . . . . . . . . . 2110 Cumulative Frequency Distribution, Households
in Rent-Controlled Sector . . . . . . . . . . . . . . . . . . . . . . . . . . . 2211 Cumulative Frequency Distribution, All Renters
and Owners . . . . . . . . . . . . . . . . . . . . . . . . . . . . . . . . . . . . . . 23
Appendices1 Second Generation Rent Policy in Various Countries . . . 312 Rent Control Legislation in the Philippines, 1970-2001 . . 363 Proportion of Households in Controlled/Uncontrolled
Sector . . . . . . . . . . . . . . . . . . . . . . . . . . . . . . . . . . . . . . . . . . . . 394 Results of Predicted Housing Demand . . . . . . . . . . . . . . . 405 Results of Hedonic Regression . . . . . . . . . . . . . . . . . . . . . . 40
iv

Abstract
This study examines benefits (and losses) from the rent controllaw in Metro Manila. The results show that net benefits from rentcontrol are positive and targets mainly the poor families. However,benefits have negligible effects on income. They also tend to beeroded by the regressive effects of rent control on supply of rentalhousing, in particular, the strict eviction provisions of the law. Stiffcompetition for low-priced rental housing, low quality of housingfor the poor, higher rents for the uncontrolled sector, andmisallocation of resources are the possible effects of rent control onhousing. It is recommended that government find other alternativeschemes to the rent control law. Possible schemes include theprovision of rental allowances to the poor; provision of low-costfinancing to landlords, including those who are into self-helphousing; and rent of government land on leasehold basis todevelopers interested to go into rental housing.
v

I
��
Introduction
Whenever the rent control law comes up for evaluation andpossible modification, public debates on the subject arise. Similarissues have also been raised in other parts of the globe: What benefitscan be derived from rent control? Who gains or loses from rentcontrol? Does rent control causes homelessness?
In 2001, the implementation of the 1985 Rent Control Act wasfurther extended amid uncertainties on the benefits of the law. Theextension expanded coverage of the law to residential units withmonthly rents of P7,500 in highly urbanized cities and P4,000 inother areas. It also included boarding houses, dormitories, room,and bedspaces.1 On the other hand, the maximum allowable annualincrease in rent was reduced from the previous 20 and 15 percent toonly 10 percent.
About 60 countries, including the Philippines, have a rentcontrol law. Studies, both theoretical and empirical, on rent controlnoted that the desirability of rent controls cannot be decided on ana priori basis but should be evaluated based on empirical evidenceand on a case-by-case basis. This assertion has been raised,particularly on recent forms of rent control, or “second generation”controls, which provide “soft” but complex provisions on rental priceincreases, maintenance, and tenant eviction.
Historically, rent control was imposed during World Wars Iand II as well as during the interwar years to provide relief from theeconomic or political shocks that followed those periods. Theappropriateness of imposing controls in wartime seems to beundisputed. The belief is that the return of soldiers would cause arapid and disruptive rise in rents since there is little private-initiated
1
____________1Republic Act 9161 of July 2001 took effect on January 7, 2002. The Act provided amendmentsto the Rent Control Act of 1985.

Rent Control in the Philippines
housing construction in those years (Lett 1976). The imposition ofrent control thus would entail little efficiency loss.
Many governments have restated rent control in recent years.2
Although often advocated as a means of price control, rent controlhas become a mechanism to ensure housing affordability. It isimposed to keep local rents from rising to prohibitive levels. In manydeveloping countries, for instance, the combination of increaseddemand from rapid urbanization along with falling real incomesand general inelasticity of housing supply have been the rationalefor creating rent controls (Malpezzi and Ball 1991).
Oppositions to rent control, especially among economists, havebeen many (Alston, Kearl and Vaughan 1992). The contention isthat rent controls discourage new construction, cause abandonment,retard maintenance, and reduce mobility, among others. Theseoppositions, however, have been mainly based on the earlier formsof rent control, or “first generation” controls, where rents are frozenat nominal levels or are subjected to intermittent adjustments at rateslower than inflation. The “second generation” controls, which cameabout in the 1970s, involve not only allowable rent increases indexedto inflation or construction costs but also cost pass-throughprovisions, which permit landlords to apply for rent increases abovethe regulated rent increase if justified by cost increases, hardshipprovisions, and rate-of-return provisions. Rent adjustment may alsobe done by arbitration between concerned parties. Moreover, suchcontrols permit vacancy decontrol, whereby the unit becomescompletely decontrolled when it is vacated (full decontrol) or placeno restrictions on intertenancy rent increases (see Appendix 1 forthe rent control schemes employed in different countries).
The second-generation rent control schemes are very differentfrom a rent freeze. The analysis of these controls goes beyond thesimple tariff assumption that “a ceiling on rents reduces the quantityand quality of housing available.” It is thus difficult to generalizedue to the variety of schemes available and recent perspectivesshowing revisionism in rent control. The usual arguments against
2
____________2Most jurisdictions in the United States and Canada removed controls in the postwar yearsbut reintroduced controls around the 1970s. On the other hand, Europe and its coloniesadopted a postwar goal of guaranteeing housing to all individuals, thus maintained controlseven after the postwar years.

rent controls are being qualified and there is a growing acceptabilitythat a well-designed rent control program can be beneficial (Arnott1995).
This paper aims to assess the adoption of rent control law inthe Philippines. In particular, it provides some measures on theextent of rent control and the magnitude and distribution of benefits(or losses) that can be derived from the rent control law. The analysisof benefits (or losses) focuses on Metro Manila for tractability ofdata and applicability of model.
The discussion proceeds with a description of the rent controllegislation in the Philippines, the design of the controls incomparison with other countries and the extent to which rent controlhas been enforced in the country. The third section discusses themethodology of measuring the benefits (losses) of rent control. Themethodology is largely based on Olsen (1972) and Gyourko andLinneman (1989). The fourth section describes the controlled anduncontrolled rental sectors in Metro Manila based on survey data.The fifth section presents the results on net benefits and thedistribution of benefits among renter households. The last sectionpresents the conclusions and policy implications of the study.
3
Introduction

II
��
The Institution of Rent Controlin the Philippines
The Philippines, which was under the American colonialinfluence between 1901 and 1946, followed the path taken by theUnited States in the legislation of rent control. Rent control wasimposed during the rehabilitation period following World War IIand later removed during the postwar years. Rent control was againimplemented in the 1970s, but unlike other developed countries,which moved into “soft” rent controls, the Philippines maintaineda freeze on nominal housing rents. (A summary of rent control lawsis provided in Appendix 2.) No increase on monthly rental wasimposed on residential housing units or on land with a monthlyrental of P300 and below (Republic Act 6126). This rent control wasinitially implemented for two years but later extended to 1979(Presidential Decree No. 20). Towards mid-1979, PD 20 was amendedto allow for a 10 percent yearly increase in rent (Batas Pambansa 25).
The reimposition of rent control in 1970s coincided with theera of land reform. Then President Marcos imposed martial law topave the way for the implementation of his administration’s “NewSociety” program. Among the package of policy reforms undertakenwas a land reform program on both agriculture and urban lands.The Urban Land Reform Act (PD 1517 of 1978) froze not onlyrents but also land prices in identified urban land reform sites. Theprovision of an urban land reform was based on the premise thatland and profits from land resources should be distributed to agreater segment of the population. However, the freeze on landprices was not tenable, resulting in its discontinuance in the early1980s. Likewise, a freeze on rents was found to discourage investorsin lower-cost rental housing (NEDA 1984). Thus the adoption of“second-generation” rents in the 1980s provided relaxation of rentcontrols and also accomplished some political objectives.
5

Rent Control in the Philippines
The “second generation” rent controls (i.e., similar to those putforward in developed countries) were adopted in the country in1985. The “New” Rent Control Act (Batas Pambansa 877) initiallytook effect for a period of three years and was extended through aseries of legal amendments to the present. This Act provided foryearly rent adjustment that approximated the average inflation inthe country. The rental cap differs every year based on allowableincreases, which effectively expanded the yearly coverage of thelaw. (The corresponding schedule of rent ceilings and maximumincreases are provided in Table 1.)
From an initial rent of P480 per month in 1985, the coverage ofrent control has expanded to include rental units priced at P8,232 in2001. The rental increases have practically covered middle-income
Table 1. Schedule of rent ceiling and maximum rental increases
Legislation Year Rent ceiling (P) Maximum increase%
BP 877 Beginning Rent 480 10July-Dec. 1985 528 20
1986 634 201987 761
RA 6643 (Extends BP 877 1988 912 20up to 31 Dec. 1989) 1989 1,095 20
RA 6828 (Extends RA 6643 1990 1,314 20up to 31 December 1992) 1991 1,533 20
1992 1,752 20
RA 7644 (Extends RA 6878 1993 2,270 20up to 31 December 1997) 1994 2,724 20
1995 3,269 201996 3,923 201997 4,707 20
RA 8437 (Extends RA 7644 1998 5,431 15to December 31, 2001) 1999 6,225 15
2000 7,158 152001 8,232 15
RA 9161 (An Act Establishing 2002a 7,500 10Reforms of Rental of Certain 2003 8,250 10Residential Units) 2004 9,075 10
aMaximum rent covered for highly urbanized cities (e.g., Metro Manila); other areas P4,000.
6

rental housing. While the 2002 extension of the rent control lawreduced the coverage to rental units priced at P7,500 per month,this amount is still much higher than that of rental units being leasedby poor households.
Aside from the allowable increases in rent, the “new” rentcontrol law provides no restrictions on intertenancy rentadjustments. Landlords can freely choose a nominal rent whentaking on a new tenant. Payment of advance rents is limited to one-month deposit with no advance on rent. However, under the recentlyapproved law, landlords can ask for a one-month advance and atwo-month deposit. The law is silent on maintenance costs butprovides control for eviction of sitting tenants.
How does the Philippines fare with other countries? Givenvarious second-generation rent control arrangements worldwide,the degree of controls is expected to vary from one nation to another.Malpezzi and Ball (1991) constructed an index to measure the extentof rent controls across countries. This index is based on 10 elementsof control, of which nine are qualitative measures while the finalelement is a measure of average inflation rate. Each qualitativeelement has a scale of 0 to 2, with a higher scale implying strictcontrols. The total index has values that range from 0 to 21. Countrieswith no controls receive a rating of 0. Average index value of 0 to 5is classified as “weak controls”; index of 5 to 13 as “moderatecontrols”; and index greater than 13 as “strict control”. We appliedthe above methodology to the Philippines.
The Philippine index of rent control shows moderate controls(Table 2). In terms of enforcement, Philippine rent control is weakbecause monitoring is poor. There is no regulatory agency for rentcontrol and complaints are coursed through the regular courts.However, the strict control over judicial ejectment and the highproportion of rental housing under rent control (i.e., controls alsoinclude newly constructed units) increase the degree of control. Priorto the passage of the rent control law, expiration of lease agreementswithout conditions was allowed (Civil Code Art. 1673). This groundfor ejectment applied to both written and verbal leases. However,with the enactment of the rent control act, this provision of the CivilCode was suspended for rental units covered by BP 877. Expirationof lease contract independent of the other provisions of BP 877 was
Institution of Rent Control
7

Rent Control in the Philippines
8
Table 2. Index of the degree of rent control in the Philippines
Elements of rent Scale/Standards Philippine scorecontrol Enforcement 0 = controls not or rarely enforced 0; controls are mainly enforced 1 = selective or partial enforcement through judicial proceedings; 2 = strict enforcement monitoring is poor
Coveragea 0 = restricted to a very small part 2; the rent control sector coversof the market about 90 percent of rental housing1 = covers a significant part (incl. informal dwellings) (APIS 98)of the market2 = more than half of the market
Setting of fair rents 0 = do not set fair rents 0; initial rent not covered by(Initial rent) 1 = some units covered or no info controls
2 = stringent rent setting
Indexation 0 = rents indexed and closely tied 0; index closely tied to inflationto inflation
1 = partially indexed or no info 2 = rents frozen or rarely revalued
Cost pass-through 0 = if upgrading, maintenance and tax 1; maintenance is mainly lessorincreases are often pass thru tenants responsibility (CC 1654); upgrading1 = some items pass through or no info (cost pass thru new rentals); tax
2 = if no or little pass thru increases (no info)
Treatment of new 0 = newly constructed units exempted 2; under RA 9161 temporaryconstruction 1 = newly constructed units have a exemption of new construction has
temporary exemption or some other been suspendeddifferential treatment or no info
not a valid ground for judicial ejectment. This move had essentiallylimited private contracting.
Malpezzi and Ball measured the index for 51 countries of which14 countries have an index 0 to 5; 27 countries have ratings of“moderate controls” (5 to 13); and 10 countries have ratings of“strict controls” (greater than 13). The degree of control has weakcorrelation with per capita GNP, inflation rate, and the proportionof urban renters. However, countries in the lowest per capita incomebracket (GNP per capita of about $370) tend to have stricter controls.

9
Institution of Rent Control
Table 2 (continued)
Elements of rent Scale/Standards Philippine scorecontrol
2 = new construction are controlled
Rents reset on new 0 = rents reset to market on new 0; no restrictions is placed ontenancy tenancy intertenancy rent increases, (i.e.,
1 = revalued but below market or when the place is vacated theno information landlord may provide a new rate
2 = if no change on a new tenant)
Tenure security 0 = tenure security more or less 2; tenure security not covered bycovered b private agreement (leases) private agreements; grounds forand normal grounds for eviction ejectment are strict
1 = more stringent security of tenureor no information
2 = strict security of tenure
Inflation index Average annual inflation index 1(1985-2001). 1= ave. inflation of 10;if 15 = 1.5
Total index 8 (moderate control)
*Index for the Philippines based on author’s judgment.**A limitation of the index is that it does not cover all potential elements of control (e.g., key money). Neither doesit account for possible alleviating effects of other schemes (e.g., rent to own) on the degree of controls. Nevertheless,the index suggests some interesting hypothesis.aThe World Bank and UNCHS Housing Indicators Study measured the extent of rent control in the Philippinesusing coverage as indicator. The study estimated that 69 percent of rental housing units are covered by rentcontrol. This measure counted both formal and informal rental housing (in 1990 rent ceiling was pegged at P1,314).
Source: Stephen Malpezzi and Gwendolyn Ball. 1991. Rent Control in Developing Countries. World BankDiscussion Paper No. 129.
Table 3: Distribution of countries by extent of rent control
AverageIndex value Number Percentage GNP per Inflation % Urban
of countries distribution* capita ($) renters
> 13 (strict control) 10 20 370 10.2 32
5 to 13 (moderate control) 27 52 4,860 8.3 40
0 to 5 (weak/no control) 14 28 1,530 13.4 37
*Based on 51 countries.
Source: Malpezzi 1991, p. 26.
III
��
Methodology
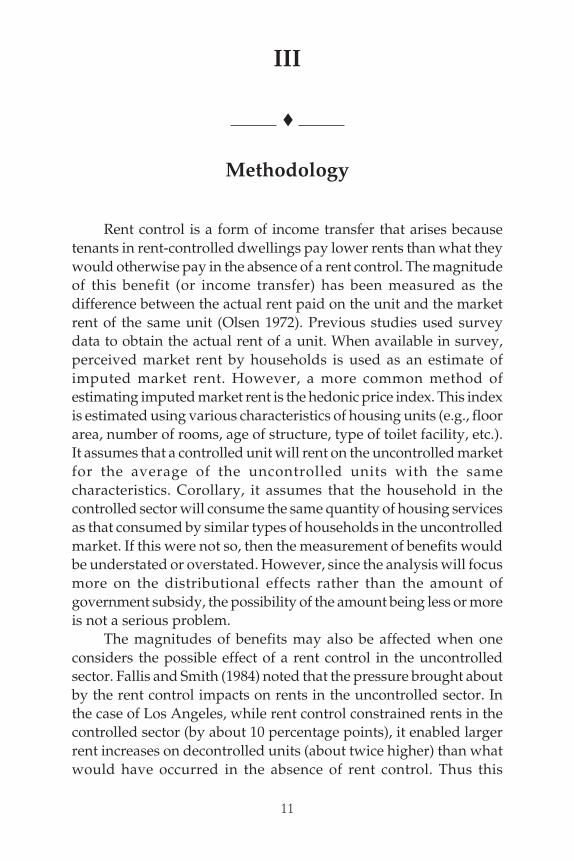
Rent control is a form of income transfer that arises becausetenants in rent-controlled dwellings pay lower rents than what theywould otherwise pay in the absence of a rent control. The magnitudeof this benefit (or income transfer) has been measured as thedifference between the actual rent paid on the unit and the marketrent of the same unit (Olsen 1972). Previous studies used surveydata to obtain the actual rent of a unit. When available in survey,perceived market rent by households is used as an estimate ofimputed market rent. However, a more common method ofestimating imputed market rent is the hedonic price index. This indexis estimated using various characteristics of housing units (e.g., floorarea, number of rooms, age of structure, type of toilet facility, etc.).It assumes that a controlled unit will rent on the uncontrolled marketfor the average of the uncontrolled units with the samecharacteristics. Corollary, it assumes that the household in thecontrolled sector will consume the same quantity of housing servicesas that consumed by similar types of households in the uncontrolledmarket. If this were not so, then the measurement of benefits wouldbe understated or overstated. However, since the analysis will focusmore on the distributional effects rather than the amount ofgovernment subsidy, the possibility of the amount being less or moreis not a serious problem.
The magnitudes of benefits may also be affected when oneconsiders the possible effect of a rent control in the uncontrolledsector. Fallis and Smith (1984) noted that the pressure brought aboutby the rent control impacts on rents in the uncontrolled sector. Inthe case of Los Angeles, while rent control constrained rents in thecontrolled sector (by about 10 percentage points), it enabled largerrent increases on decontrolled units (about twice higher) than whatwould have occurred in the absence of rent control. Thus this
11
!!!!nt Co~l in the Philippines
methodology may not accurately measure the amount of benefitsbut simply identifies differential benefits across families obtainingcontrolled units compared to those residing in the uncontrolled units.
The set of housing characteristics used for hedonic estimationvaries from one study to another usually depending on theavailability of data. Olsen (1972), for instance, used number ofbedrooms, condition of the building, location, and presence ofelevator as variables for his analysil:; of rent control in New York.Struyk's (1988) study of rent control in Jordan employed the type ofwall material, year of construction, number of floors, persons perroom, and location as dwelling variables.
In this study, we focused on three major dwelling charac-teristics, namely, floor area, location and type of water connections/facilities given limited data and limited sample size. We computedthe renter's annual benefit from rent controls as follows:
wherePm = price per unit of housing services for uncontrolled
unitsQm = quantity of services consumed by HH in an
uncontrolled unitPm Qm = market rent for the unit selected without rent controlPc = price per unit of housing services for controlled unitsQ = quantity of services consumed by HH in a controlled
unitP Q = rent for the unit selected with rent control
c cIn = natural logarithmP mQm -P cQc = benefit accruing from to the tenant as a result
of living in the rent-controlled unitPm Qm (lnP m Q -lnP m Qm) = change in housing consumption
resulting from living in the controlled unit valuedat market prices. This term may increase or decreasetenant benefits, depending on whether Qc > Qm orQc < Qm' If the lessor cuts back on maintenance andother services, Q < Q and the benefit to tenant isc mdecreased.
12

The benefit calculation is derived using renter householdsdrawn from the 1998 Annual Poverty Incidence Survey (APIS), afamily and income expenditure survey of 40,000 households for theentire Philippines.3 We focused the analysis only on the NationalCapital Region (NCR) for model tractability. Since rent controlmainly targets housing units under normal lease arrangements, weexcluded from the sample households under other rentalarrangements (i.e., rent lots only, rent-free with consent or withoutconsent of owners). The sample thus consists of owner-occupiers oramortizing owners and renters of housing. The renter householdsare those occupying single houses, duplex, apartments, accessoria(row houses), condominiums, and townhouses.
It should be noted that the APIS renter data do not distinguishbetween renters in the formal and informal sectors. It is thus possiblethat the renter household surveyed is occupying a rental unit in aninformal housing settlement. Moreover, it is difficult to distinguishformal from informal rental housing, since most landlords in thecountry, specifically those covered by rent control, do not registerrental business.
From 3,947 households surveyed in NCR, 3,033 (76.8 percent)were classified either as renters or owner-occupiers. About 32.6percent of the 3,033 households surveyed were renters. These renter-households were further categorized into rent-controlled anduncontrolled sector based on the actual rent paid for the housingunit. The rent control law defines rent-controlled units as havingmonthly rents of less than, or equal to, a maximum ceiling that variesper year. In 1998, this ceiling was pegged at about P5,400. However,since rental contracts do not necessarily start at the beginning of theyear, we used the 1997 ceiling of P4,700 as the cut-off rental pricefor those in the controlled sector.4 Based on the above groupings,the NCR data contain 963 usable observations for renters in the
Methodology
13
____________3The APIS covers the same scope and sampling frame as the Family Income and ExpenditureSurvey (FIES). It started in 1998 and since then has been conducted in those years when noFIES was carried out. The APIS has been chosen over the FIES, since the former containssome relevant housing characteristics not found in the latter.4Even at a ceiling of P5,400, results will not differ, since rental prices in the uncontrolledsector range from P6,000 to P50,000.
controlled sector, 27 usable observations for renters in theuncontrolled sector, and 2,043 usable observations for owner-occupants.
14
Rent Control in the Philippines

IV
��
Features of the Rental Sectorin Metro Manila
Table 4 provides an overview of the characteristics ofhouseholds in the controlled sector vis-à-vis the uncontrolled sectorand the owner-occupiers. On the average, the actual monthly rentsin the controlled sector are way below those of the uncontrolledsector (P1,022 vs. P13,538) while imputed rents by owner-occupiedhouseholds are closer to those of the controlled sector. A widesocioeconomic gap is apparent between households in the controlledsector and those occupying rental units in the uncontrolled sector.Households occupying the uncontrolled sector are mainly high-income families with an average annual income of P1.17 million.Comparatively, households in the controlled units and owner-occupiers have an average annual income of P185,614 and P 274,364,respectively.
Table 4. Characteristics of households in controlled and uncontrolled sectors
All Controlled Uncontrolled Owner-observations occupiers
Number of observations 3,033 963 27 2,043Average monthly rent (1998) 1,833.66 1,022.80 13,538.19 2,054.05Average yearly income (1998) 254,779.94 185,614.27 1,177,965.93 274,363.94Total expenditure (1998) 101,541.14 76,372.63 373,524.48 109,563.99Average age of household head 45.79 39.75 47.83 48.6Average family household size 5.04 4.73 3.79 5.2Marital status % married 93.67 89.20 92.59 95.79 % single 6.33 10.80 7.41 4.21Sex of household head % female 22.63 19.83 22.22 23.95 % male 77.37 80.17 77.78 76.05
Source: Annual Poverty Incidence Survey (APIS) 1998
15

Rent Control in the Philippines
16
In terms of dwelling conditions, households in the uncontrolledsector have better housing facilities than the controlled sector (Table5). These households occupy larger spaces, with 85 percent of theunits of size greater than 50 square meters. Housing units are alsowith individual water connection. In contrast, most (80 percent)housing units in the controlled sector have floor areas of less than50 square meters. Moreover, water facilities are mainly shared orsourced from wells or peddlers. The owner-occupiers have onlyslightly better housing conditions than the households occupyingcontrolled rental units. Except for a comparatively larger floor areafor owner-occupiers, the other conditions of housing are similar.The type of building occupied by renters in the controlled market iseither single-detached or apartment-type, row houses orcondominiums. On the other hand, most households (67.7 percent)in the uncontrolled sector occupy single-detached houses. Thelocation of the housing units also reflects the rental prices. Most (89percent) of the housing units in the uncontrolled sector are locatedat the inner core of NCR (Manila, Makati, Quezon City, Pasig, etc.).On the other hand, about 53 percent of housing units in the controlledsector and owner-occupiers are located at the outer core of NCR(Muntinlupa, Marikina, Valenzuela, Taguig/Pateros, Navotas,Malabon).
Households in the rent-controlled sector are distributed acrossall income deciles with actual rents directly proportional to income(Table 6). About 44 percent of households in this sector are frompoor families (first to fourth deciles). On the other hand, 67 percentof households in the uncontrolled sector belong to the tenth decile.
It is evident that a large gap exists between housing availablefor the poor and low-income households and rental housingoccupied by the high-income group. Distinct differences in demandand investment conditions are apparent between the two rentalmarkets.
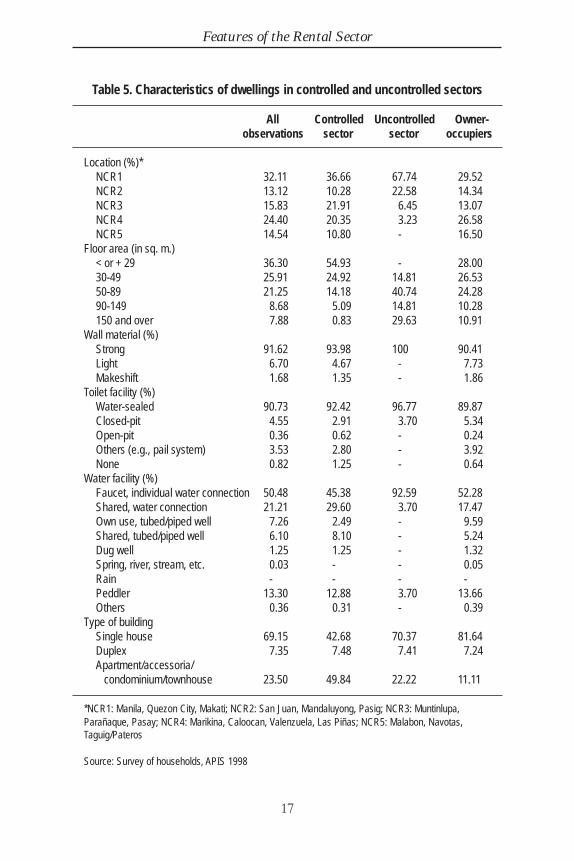
Table 5. Characteristics of dwellings in controlled and uncontrolled sectors
All Controlled Uncontrolled Owner-observations sector sector occupiers
Location (%)*
NCR1 32.11 36.66 67.74 29.52NCR2 13.12 10.28 22.58 14.34NCR3 15.83 21.91 6.45 13.07NCR4 24.40 20.35 3.23 26.58NCR5 14.54 10.80 - 16.50
Floor area (in sq. m.) < or + 29 36.30 54.93 - 28.0030-49 25.91 24.92 14.81 26.5350-89 21.25 14.18 40.74 24.2890-149 8.68 5.09 14.81 10.28150 and over 7.88 0.83 29.63 10.91
Wall material (%) Strong 91.62 93.98 100 90.41Light 6.70 4.67 - 7.73Makeshift 1.68 1.35 - 1.86
Toilet facility (%) Water-sealed 90.73 92.42 96.77 89.87Closed-pit 4.55 2.91 3.70 5.34Open-pit 0.36 0.62 - 0.24Others (e.g., pail system) 3.53 2.80 - 3.92None 0.82 1.25 - 0.64
Water facility (%) Faucet, individual water connection 50.48 45.38 92.59 52.28Shared, water connection 21.21 29.60 3.70 17.47Own use, tubed/piped well 7.26 2.49 - 9.59Shared, tubed/piped well 6.10 8.10 - 5.24Dug well 1.25 1.25 - 1.32Spring, river, stream, etc. 0.03 - - 0.05Rain - - - -Peddler 13.30 12.88 3.70 13.66Others 0.36 0.31 - 0.39
Type of building Single house 69.15 42.68 70.37 81.64Duplex 7.35 7.48 7.41 7.24Apartment/accessoria/ condominium/townhouse 23.50 49.84 22.22 11.11
*NCR1: Manila, Quezon City, Makati; NCR2: San Juan, Mandaluyong, Pasig; NCR3: Muntinlupa,Parañaque, Pasay; NCR4: Marikina, Caloocan, Valenzuela, Las Piñas; NCR5: Malabon, Navotas,Taguig/Pateros
Source: Survey of households, APIS 1998
Features of the Rental Sector
17

18
Table 6. Distribution of renter-household by income decile and rent
Controlled UncontrolledIncome decile Average actual % of renter- Average actual % of renter-
monthly rent households monthly rent households
First decile 454.39 10.5 - -Second decile 540.29 12.8 - -Third decile 734.21 11.7 - -Fourth decile 846.35 9.2 - -Fifth decile 1,000.65 10.9 7,500.00 1.3Sixth decile 1,185.06 10.2 - -Seventh decile 1,208.85 10.2 5,409.89 5.1Eighth decile 1,547.97 9.3 5,596.04 16.7Ninth decile 1,856.33 9.6 6,160.85 9.6Tenth decile 2,316.49 5.5 15,664.37 67.3
Rent Control in the Philippines

19
V
��
Net Benefits and Distributional Effectsof Rent Control
In measuring the net benefits, we provided an adjustment factorfor the structural difference between those in the controlled and theuncontrolled sectors by including a dummy variable in theestimation of market price. The dummies were found significant(Appendix 2), satisfying the hypothesis that ru – rc > 0, where ru isthe rent for the uncontrolled unit and rc is the rent for the controlledunit. Effectively, this resulted in two sets of predicted market pricefor the controlled sector.
Market price was computed for two data sets: one, renters dataonly and two, renters and owner-occupiers data.5 Between these twodata sets, the latter provides a closer estimate, as it approximatesthe characteristics of households in the controlled sector. Anunderlying assumption of the model is that the housing consumptionpatterns of those in the controlled and uncontrolled sectors aresimilar.
The estimates show that on the average tenants occupying rent-controlled units obtain positive net benefits (Table 7). Using differentpredicted values of market price, annual net benefits range fromP249 to P5,300 per unit. In proportion to household income, tenantbenefits represent less than 1 percent of household income. Theincrease in household income due to rent control is from 0.33 percentto 0.70 percent.
To obtain further insights into the distribution of benefitsamong families, we regressed net benefit on a vector of personalcharacteristics of the tenants in the rent-controlled sector. Benefits
____________5The assumption in the former is that owners are also considered as “renters” in theuncontrolled sector. The rent is based on “imputed rents,” as indicated by owner-occupiers inthe survey.

Rent Control in the Philippines
Table 7. Benefit summary statistics
Renters Renters + OwnersDummy = Dummy = Dummy = Dummy =
uncontrolled controlled uncontrolled controlled
Mean benefit 5,300.02 249.03 739.70 343.15Standard deviation 1,042.42 734.93 895.06 809.27Standard error 33.66 23.73 28.90 26.13Mean benefit share in family income (%) 4.14 0.33 0.70 0.38
are strongly correlated with household income. The negativerelationship between household income and benefits shows that thebenefits from rent control decreases with income (Income1) at anincreasing rate (Income2) (Table 8). This suggests that poorer familiesreceive larger benefits than richer families. The rent control law isapparently targeting the poor.
The other socioeconomic variables show that larger householdsreceive greater benefits than smaller families. In terms of age, benefitsincrease as the household head grows older but reaches a thresholdpoint whereby benefits decline with age. The results from thesevariables are, however, insignificant, indicating that the effects arerandom.
Benefit targeting is further shown in the distribution of benefitsby income deciles (Table 9). Net benefits to tenants in the controlledsector increases up to the fourth deciles. About 45 percent of tenantsin the rent-controlled sector belong to these deciles. From the fourthdeciles, net benefits decline at an increasing rate and households inthe ninth and ten deciles experience losses. This suggests that thosehouseholds in the ninth and tenth deciles are subsidizing the lower-income deciles. Thus, while rent control may have provided lowerrental prices to the low-income households, it is possible that it hasalso resulted in higher prices for middle- and high- income rentalhousing than what would have occurred in the absence of rentcontrol.6
____________6The pressure brought about by rent control can impact on the uncontrolled sector throughhigher prices (Fallis and Smith 1985).
20

Tabl
e 8.
Ben
efit
targ
etin
g
Inde
pend
ent
Rent
er +
Ow
ner
Rent
er +
Ow
ner
varia
bles
(Dum
my
varia
ble
= 0)
(Dum
my
varia
ble
= 0)
B =
+(Y,
Y2)
t-sta
tB
= +(
all v
aria
bles
)t-s
tat
B =
+(Y,
Y2)
t-sta
tB
= +(
all v
aria
bles
)t-s
tat
Inte
rcep
t10
72.6
031
28.4
116
1056
.439
4 4
.630
071
8.78
7036
.662
269
5.48
68
3.13
77In
com
e 1
-
0.00
15 -7
.909
6
-0.
0016
-7.7
172
-0
.002
0 0
.000
2
-0.0
020
-10.
0248
Inco
me
2
-6.
38E-
10 -7
.705
5
-6.
29E-
10-7
.477
9
-2.0
1E-1
0 8
.05E
-11
-1
.92E
-10
-2.
3468
HH
Size
1
-43.
0709
-1.1
910
-39.
5949
-1.
1271
HH
Size
2
4.
6872
1.5
985
4
.420
2
1.55
18Ag
e1
10.
3499
0.9
279
9
.034
7
0.83
38Ag
e2
-0.
1451
-1.1
845
-0
.133
4 -
1.12
07M
stat
us
-72.
5812
-0.9
313
-39.
1106
-0.
5166
R2
0.43
8
0.
4580
0
.352
Tabl
e 9.
Ben
efit
by in
com
e de
cile
s
Dum
my=
0 (U
ncon
trolle
d)Du
mm
y=1
(Con
trolle
d)%
of r
ente
rIn
com
e de
cile
Mea
n be
nefit
Mea
n be
nefit
sha
reM
ean
bene
fitM
ean
bene
fit s
hare
huse
hold
s in
in fa
mily
inco
me
(%)
in fa
mily
inco
me
(%)
cont
rolle
d se
ctor
Firs
t dec
ile77
6.92
1.5
4
85.1
9 0
.9 1
1.1
Seco
nd d
ecile
900.
89 1
.2
558
.59
0.7
13.
2Th
ird d
ecile
877.
10 0
.9
504
.81
0.5
11.
6Fo
urth
dec
ile90
8.12
0.8
5
04.4
5 0
.4
9.7
Fifth
dec
ile87
5.63
0.6
4
44.3
6 0
.3 1
1.7
Sixt
h de
cile
858.
07 0
.5
407
.42
0.2
10.
2Se
vent
h de
cile
934.
43 0
.4
462
.44
0.2
10.
2Ei
ght d
ecile
739.
72 0
.3
245
.86
0.1
8
.9N
inth
dec
ile46
2.87
0.1
(
36.3
3)(0
.0)
8
.8Te
nth
deci
le
(8
98.3
0)(0
.0)
(1,0
84.6
4)(0
.1)
4
.7Av
erag
e73
9.70
0.7
3
43.1
5 0
.410
0
21
We further examined the distributional effects of rent controlon income by comparing frequency distribution of actual familyincome of residents in Metro Manila and benefit-adjusted familyincome.7 The adjustment is such that it has the same mean as thedistribution of actual family income. The assumption here is that
____________7This is computed as family income plus the difference between the individual rent controlbenefit (or loss) and the sample mean rent control benefit. Since this analysis deals with asingle period in time, the net present values of the implicit subsidy are not computed.
Net Benefits and Distributional Effects

Rent Control in the Philippines
rent control provides an income transfer to some families and “loss”to others, thus affecting income distribution among residents inMetro Manila. If the net benefits of rent control are significant, animprovement in the distribution of income is expected. Table 10shows no significant improvement in the distribution of incomes,specifically among the lowest-income groups. For example, thecumulative distribution of incomes for households with annualincomes less than P40, 000 rarely differed under the benefit-adjustedincome. Beyond that income level, we find that the cumulativedistribution of incomes has improved although the difference rarelydiffered by 1 percentage point and thus has only a minor impact onequalizing income distribution.
Benefit (or loss)-adjusted incomes have also been provided forall renters and owners, the results of which show insignificantimprovements on income (Table 11). If we assume that landlordsare, on the average, in relatively higher-income brackets than thebenefit recipients and that all landlords are city residents (i.e., onlyintracity transfers occur), then tenant gains equal landlord losses.The results, however, show that even among higher-incomehouseholds there is no significant change in income. This indicatesthat there are no major transfers of income from landlords to tenants.It is difficult to accurately account for the loss side of rent control,
Table 10. Cumulative frequency distribution, households in rent-controlled sector
Income category Actual family Benefit-adjusted Benefit-adjustedincome (%) family income (%) family income (%)
(dummy=uncontrolled) (dummy=controlled)
Under 10,000 0.00 0.00 0.0010,000-19,999 0.10 0.10 0.1020,000-29,999 0.81 0.83 0.8330,000-39,999 1.52 1.56 1.5640,000-49,999 3.24 3.44 3.3450,000-59,999 6.37 6.57 6.4660,000-79,999 18.59 19.29 19.2980,000-99,999 30.41 31.49 31.49100,000-149,999 53.44 55.57 55.27150,000-249,999 78.79 80.81 80.81250,000-499,999 95.05 96.35 96.35500,000 and over 100.00 100.00 100.00
22

Net Benefits and Distributional Effects
23
particularly among landlords for lack of relevant data. However,empirical studies on rent control in different countries found verysmall transfers in aggregate from landlords to tenants, the majortransfers being from tenants who move frequently to tenants whoseldom move (Olsen 1990).
Table 11. Cumulative frequency distribution, all renters and owners*
Income category Actual family Benefit-adjusted Benefit-adjustedincome (%) family income (%) family income (%)
(dummy=uncontrolled) (dummy=controlled)
Under 10,000 0.00 0.00 0.0010,000-19,999 0.16 0.23 0.2320,000-29,999 0.72 0.82 0.8930,000-39,999 1.75 1.75 1.8540,000-49,999 3.07 3.03 3.3050,000-59,999 5.44 5.67 6.2060,000-79,999 13.95 13.95 14.9480,000-99,999 23.77 23.47 24.33100,000-149,999 44.48 44.44 45.04150,000-249,999 71.25 71.15 71.51250,000-499,999 91.86 91.89 91.89500,000 and over 100.00 100.00 100.00
*Based on renters and owners dataset.
VI
��
Conclusions and Policy Recommendations
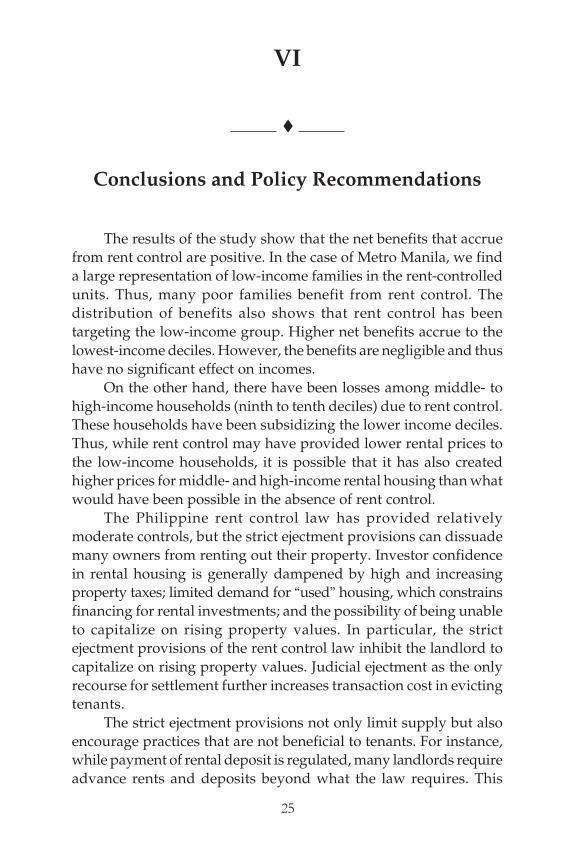
The results of the study show that the net benefits that accruefrom rent control are positive. In the case of Metro Manila, we finda large representation of low-income families in the rent-controlledunits. Thus, many poor families benefit from rent control. Thedistribution of benefits also shows that rent control has beentargeting the low-income group. Higher net benefits accrue to thelowest-income deciles. However, the benefits are negligible and thushave no significant effect on incomes.
On the other hand, there have been losses among middle- tohigh-income households (ninth to tenth deciles) due to rent control.These households have been subsidizing the lower income deciles.Thus, while rent control may have provided lower rental prices tothe low-income households, it is possible that it has also createdhigher prices for middle- and high-income rental housing than whatwould have been possible in the absence of rent control.
The Philippine rent control law has provided relativelymoderate controls, but the strict ejectment provisions can dissuademany owners from renting out their property. Investor confidencein rental housing is generally dampened by high and increasingproperty taxes; limited demand for “used” housing, which constrainsfinancing for rental investments; and the possibility of being unableto capitalize on rising property values. In particular, the strictejectment provisions of the rent control law inhibit the landlord tocapitalize on rising property values. Judicial ejectment as the onlyrecourse for settlement further increases transaction cost in evictingtenants.
The strict ejectment provisions not only limit supply but alsoencourage practices that are not beneficial to tenants. For instance,while payment of rental deposit is regulated, many landlords requireadvance rents and deposits beyond what the law requires. This
25

Rent Control in the Philippines
practice provides the landlord a means to distinguish the “bad”from the “good” tenants and being able to do so, lowers histransaction costs. However, this practice can screen out the poorand low-income families, who are unable to make the requiredadvance payments.
Similarly, the eviction provision that requires the sitting tenantto have first preference to lease the same premises also has regressiveeffects. In particular, it discourages maintenance. Maintenance islargely the responsibility of the landlord. While the allowable rentincreases may provide for minor repairs, there is no incentive forthe landlord to provide improvements for the unit. The PhilippineCivil Code permits the landlord to share cost of improvements withtenants or adjust rents based on costs of repairs. Yet it is not clearhow such changes can be made—whether they require clearancefrom local authorities or have to be done through judicialproceedings.8 In more developed countries, a rent control board hasbeen set up to resolve complaints or grievances between lessor andlessee. Such organization is lacking in the country. Monitoring ispoor and this can work to the disadvantage of both landlords andtenants. Given the different dimensions of “second-generation” rent,an efficient and effective monitoring system is necessary.
The potential regressive impact of rent control on rentalinvestments erodes the benefits obtained by the poor. Competitionfor low-priced rental housing has become stiff. The limited supplyof low-income rental housing excludes a significant number of low-income families from housing. In the absence of other low-costhousing alternatives, these families tend to obtain housing throughunconventional arrangements (e.g., squatting). The expandingcoverage of the law suggests that such problems are also evident inmiddle-income rental housing. The increase in the number ofmiddle-income families in informal housing settlements may be dueto the absence of reasonably priced rental housing in the market.Moreover, the disincentives provided by rent control on investmentsin low-cost rental housing imply that investors will findopportunities in high-income rental housing, where demand is
26
____________8Major repairs require a certification from authorities, who issue such a document only if thebuilding is in dire need of repair (i.e., building is considered condemned).

largely dependent on the international market. Rent control thusalso leads to misallocation of resources, because resources are pouredinto investments with high risk.
The disincentives on supply could also result in a decliningquality of housing for the poor. We have, for instance, observed alarge gap between dwellings in the rent-controlled and uncontrolledunits. The quality of housing in the rent-controlled sector issignificantly inferior to those in the uncontrolled sector. Likewise,there is a growing gap between housing available for the poor andlow-income sector and housing for those who can rent apartmentsand houses.
Although rent control does lower rents, it restricts the supplyof rental housing and erodes whatever benefits can be obtained fromthe law. Other forms of assistance to rental housing with lessregressive effects should be considered. In particular, governmentshould pursue a rental housing program. One scheme found effectivein other countries is the provision of rental allowances for the poor(Malpezzi and Ball 1991). Government should have a balanced viewof ownership and rental tenure. Rental supplements thus can beprovided for the poor households, who rent rather than own.
Another scheme is to offer financial incentives to rentalinvestors through low-cost development financing. An importantquestion to ask is, Who invests in low-cost rental housing? Althoughwe do not have an accurate data for the country, the pattern foundin many Third World countries could be the same one obtained inthe Philippines. Most landlords operate small while the relativelyfew large-scale landlords target the middle- and high-income sectors.Small-scale landlords are interested in generating income but feware profit maximizers (UNCHS 1993). They do not keep books inwhich to record their outgoings nor calculate the return on theirinvestments. If this pattern is true, then rental housing supply canbe stimulated by providing low-cost financing for small landownerswho may not have sufficient capital to develop rental housing.
Where government owns the land, a possible incentive fordevelopment of rental housing is to sell or rent the land on aleasehold basis to the builders/developers who are interested to gointo rental housing development.
27
Conclusions and Policy Recommendations

Rent Control in the Philippines
The study has not been able to directly measure the “losses”perceived to accrue to landlords due to data limitation. Moresystematic data collection on the rental housing market isrecommended to help in the monitoring and analysis of the sector.
28

References
Alston, R., J. Kearl and M. Vaughan. 1992. Is there a consensus amongeconomists in the 1990s? American Economic Review 82(May):203-209.
Anas, A. 1988. A dynamic, policy-oriented model of the regulated housingmarket: the Swedish prototype. Regional Science and Urban Economics18(2):201-231.
Arnott, R. 1995. Time for revisionism on rent control? Journal of EconomicPerspectives 9(1):99-120.
Ballesteros, M. 2001. The dynamics of housing demand in the Philippines:income and lifecycle effects. PIDS Discussion Paper Series No. 2001-15.Makati City: Philippine Institute for Development Studies.
Basu, K. and P. Emerson. 1998. The economics and law of rent control.World Bank Research Working Paper No. 1968. Washington, D.C.: TheWorld Bank.
Borsch-Supan, A. 1986. On the West German tenants’ protection legislation.Journal of Institutional and Theoretical Economics 142(June):380-404.
Buckers, L. and M. Severijn. 1990. Rent policy in ECE countries. A synthesisreport on a seminar held on 27-31 October 1986 in Amsterdam,Netherlands. New York: United Nations.
Fallis, G. and L. Smith. 1984. Uncontrolled prices in a controlled market:the case of rent controls. American Economic Review 74 (1):193-200.
———. 1985. Price effects of rent control on controlled and uncontrolledrental housing in Toronto: a hedonic index approach. Canadian Journalof Economics 18(3):652-659.
Frankena, M. 1975. Alternative models for rent control. Urban Studies12(October):303-308.
Gilbert, A. and A. Varley. Landlord and tenant: housing the poor in urban Mexico.New York: Routledge, Inc.
Glaeser, E. and E. Luttmer. 1997. The misallocation of housing under rentcontrol. NBER Working Paper Series No. 6220. Cambridge: NationalBureau of Economic Research.
Gyourko, J. and P. Linneman. 1998. Equity and efficiency aspects of rentcontrol: an empirical study of New York City. Journal of Urban Economics26:54-74.
Hubert, F. 1995. Contracting with costly tenants. Regional Science and UrbanEconomics 25:631-654.
Lett, M. 1976. Rent control: concepts, realities and mechanisms. New Brunswick:Center for Urban Policy Research.
Malpezzi, S. and G. Ball. 1991. Rent control in developing countries. WorldBank Discussion Paper No. 129. Washington, D.C.: The World Bank.
29
Rent Control in the Philippines
National Economic and Development Authority (NEDA). 1984. Commentson rent control law. Essay submitted to Congress 26 February 1997.
Olsen, E. 1972. An econometric analysis of rent control. Journal of PoliticalEconomy 80(November/December):1081-1110.
———. 1998. What do economists know about the effect of rent control onhousing maintenance? Journal of Real Estate and Finance and Economics1(November):295-307.
———. 1990. What is known about the effects of rent controls? ConsultingReport. US Department of Housing and Urban Development,Washington, D.C.
Peña, D. and J. Castillo. 1984. Distributional aspects of public rental housingand rent control policies in Spain. Journal of Urban Economics15(March):350-370.
Smith, L., K. Rosen and G. Fallis. 1988. Recent developments in economicmodels of housing market. Journal of Economic Literature 26(March):29-64.
Struyk, R. 1988. The distribution of tenant benefits from rent control in urbanJordan. Land Economics 64(2):125-134.
Sweeney, J. 1974. A commodity hierarchy model of the rental housingmarket. Journal of Urban Economics 1(July):288-323.
United Nations Centre for Human Settlements (UNCHS). 1993. Supportmeasures to promote rental housing for low income groups. Nairobi: UNCHS.
30
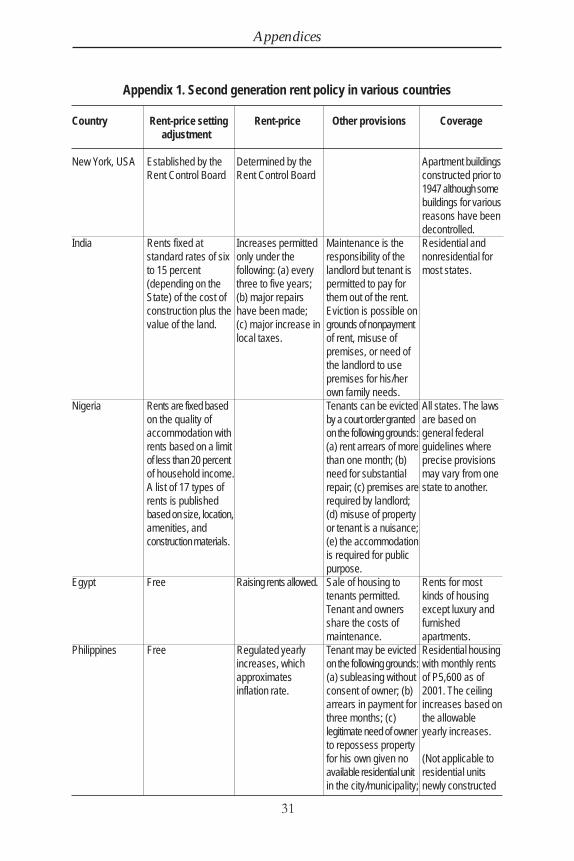
Appendix 1. Second generation rent policy in various countries
Country Rent-price setting Rent-price Other provisions Coverageadjustment
New York, USA Established by the Determined by the Apartment buildingsRent Control Board Rent Control Board constructed prior to
1947 although somebuildings for variousreasons have beendecontrolled.
India Rents fixed at Increases permitted Maintenance is the Residential andstandard rates of six only under the responsibility of the nonresidential forto 15 percent following: (a) every landlord but tenant is most states.(depending on the three to five years; permitted to pay forState) of the cost of (b) major repairs them out of the rent.construction plus the have been made; Eviction is possible onvalue of the land. (c) major increase in grounds of nonpayment
local taxes. of rent, misuse ofpremises, or need ofthe landlord to usepremises for his/herown family needs.
Nigeria Rents are fixed based Tenants can be evicted All states. The lawson the quality of by a court order granted are based onaccommodation with on the following grounds: general federalrents based on a limit (a) rent arrears of more guidelines whereof less than 20 percent than one month; (b) precise provisionsof household income. need for substantial may vary from oneA list of 17 types of repair; (c) premises are state to another.rents is published required by landlord;based on size, location, (d) misuse of propertyamenities, and or tenant is a nuisance;construction materials. (e) the accommodation
is required for publicpurpose.
Egypt Free Raising rents allowed. Sale of housing to Rents for mosttenants permitted. kinds of housingTenant and owners except luxury andshare the costs of furnishedmaintenance. apartments.
Philippines Free Regulated yearly Tenant may be evicted Residential housingincreases, which on the following grounds: with monthly rentsapproximates (a) subleasing without of P5,600 as ofinflation rate. consent of owner; (b) 2001. The ceiling
arrears in payment for increases based onthree months; (c) the allowablelegitimate need of owner yearly increases.to repossess propertyfor his own given no (Not applicable toavailable residential unit residential unitsin the city/municipality; newly constructed
31
Appendices

Rent Control in the Philippines
Country Rent-price setting Rent-price Other provisions Coverageadjustment
(d) expiration of lease or newly offered forcontract; (e) need of the rent during thelessor to make effectivity of the Act.)necessary repairs. Silent (Section 7)on cost sharingarrangement for (Not applicable tomaintenance. Require dormitories,one month advance bedspacers, roompayment and one for rents.)month deposit.
Toronto, Canada Determined by the One-rent increase in All private rentalResidential Tenancy any 12-month period units first rentedCommission. based on predeter- prior to January
mined percentage 1976 with rents <increase by statute. $750 a month.Increases beyondwhat is required bythe law is possible onthe following grounds:(a) cost increaseshigher than allowedrental increase, (b)financial low associatedwith property, (c)capital expenditureswarrant larger increase.The ResidentialTenancy Commissiondecides on the issue.
Belgium Maintenance: lessors All residential units.Profit rental Free negotiations but Free negotiations are responsible for majorsector within maximum level repairs, tenants for
of rent set by small/minor repairs, butgovernment. may arrange on division
of tasks.Nonprofit rental Rent price is Rent price changes Termination: leasesector percentage of updated with cost price or contract for an indefinite
cost price x income income. period possible tocoefficient. cancel unilaterally
(grounds for terminationnot specified); forcontract with definiteperiod, termination ison expiry of contract,but contract can beautomatically prolongedor be appealed forextension (dependingon contract period).
32

Country Rent-price setting Rent-price Other provisions Coverageadjustment
Denmark Maintenance: mostly All residential units.Profit sector Cost-price rent or Based on change of under lessor’s
cost price rent + 8 overall costs. responsibility, tenant topercent equip the unit (but may
Nonprofit Cost price minus Based on change of arrange on division ofrent subsidies. overall costs. duties). Termination:
expiration of contract,if owner needs tooccupy the dwelling,demolition, nonpaymentof rent, misconduct,neglect of the dwellingby tenant.
France Maintenance: tenant is All residential andProfit and non- Free negotiations Rent-increase based responsible for daily commercial unitsprofit sector on rent-price upkeep and main-
agreements tenance, other repairsare at the expense ofthe lessor. Termination:upon expiry, contract isusually renewed for atleast another threeyears (corporate lessorsmust offer at least asix-year lease contract,three to six years forprivate lessors); reasonsfor nonrenewal are:selling of the unit bythe lessor, lessor’s needof dwelling for personaluse, nonfulfillment ofobligations by thetenant (e.g., rentpayment arrears,neglect of the dwelling).
Germany, Tenancy may be verbal All residential units.Federal Republic or written; tenantProfit sector Free negotiations Maximum increase is required to pay a
30 percent over three guarantee sum not toyears; adjustment exceed three months’may be made based rent, which may beon local comparisons. paid in three install-
Nonprofit sector Cost price minus Based on changes in ments, with the accruingsubsidies costs or subsidies. interest refunded to
tenant upon departure.Maintenance: tenantdoes simple work(painting, papering) and
33
Appendices

Rent Control in the Philippines
Country Rent-price setting Rent-price Other provisions Coverageadjustment
can demand a decreasein rent price if lessordoes not carry over hismaintenanceresponsibilities; in caseof improvements/renovations, rent-priceadjustments are allowedat 11 percent of thecost or rent price maybe raised to the levelof similar dwellings inthe vicinity (“comparativerent system”).Termination (grounds):expiration of the contract,serious breach ofcontract by the tenant(repeated arrears, houserules disobedience),dwelling needed forlessor’s personal/familyuse, if continuation ofthe contract constitutesa heavy financialburden for the lessor.
Spain Contracts before 1964: Lease contracts are for All residential units.Profit sector Free negotiations rent frozen; after 1964: an indefinite period.
free negotiations + Maintenance: lessormaximum set by the assumes all necessarygovernment. maintenance work; 12
Nonprofit sector Subsidized: Free Contracts before 1964: percent (maximum ofnegotiations + rent frozen; after 1964: 50 percent of the rentmaximum 3 percent free negotiations + price) is charged to theof construction costs. maximum set by the tenant to cover costs.
government. Termination: (grounds)lessor’s need of thedwelling for personal/family use, demolitionto make way for a newbuilding; dwellingremains unoccupiedfor more than half ofthe year; tenant hasdwelling(s) in the sameneighborhood, dwellinghas become a slum.
Sweden Collective negotiations, Local administration; Key money is illegal. All residential units.between tenants’ and collective negotiations Maintenance: tenants
34

Country Rent-price setting Rent-price Other provisions Coverageadjustment
lessors organization may carry out minordepending on use maintenance work evenvalue. without seeking the
lessor’s approval.Termination: forcedtermination in case ofarrears in rent paymentor misconduct, or otherreasons considered bythe Rent Tribunal asvalid; if evacuation isneeded for renovationsor for lessor’s personaluse, tenant must beprovided withcomparable substitutehousing.
United Kingdom Termination: eviction All residential unitsProfit sector Free negotiations + New fair rent upon order by the court.
maximum of fair rents determined by the Grounds: nonpayment“rent officer,” no direct of rent or nonfulfillmentrelation to cost. of the lease; nuisance
Nonprofit sector Municipal When municipal to neighbors or use ofadministrations budget changes, no dwelling for illegal
direct relation to cost. purposes; damage tothe dwelling andfurnishings; fraudulentdeclarations in the leaseagreement; (if decentsubstitute housing isavailable) dwelling isovercrowded; demolition;lessor (if institution)needs the dwelling forhis/her use, dwelling islarge for the tenant’shousehold; if dwellinghas been previously letfor temporary or short;hold tenancy (e.g.,holiday/studentresidence); sublettingor transferring by tenantwithout lessor’s consent;dwelling needed forpersonal/family/employee use.
Sources of data: Malpezzi and Ball, 1991; UNCHS, 1993; UNCHS Economic Commission for Europe, 1990;Republic of the Philippines, Batas Pambansa Blg. 877: An Act Providing for the Stabilization and Regulation ofrentals of Certain Residential Units and for Other Purposes.
Appendices

Rent Control in the Philippines
Appendix 2. Rent control legislation in the Philippines, 1970-2001
Law Title Coverage Period Main provisionsof effectivity
Republic Act An Act to regulate Residential units One year from - No increase in the monthly(RA) No. 6126 rentals of dwelling with monthly March 31, 1970. rental agreed upon by the
units or of land on rental below P300. lessor/owner and lessee priorwhich another’s to the approval of the act.dwelling is located - Lessor cannot demand afor one year and deposit of any amount inpenalizing excess of two months’ rentalviolations thereof. in advance.
RA 6359 An Act to regulate Residential units Two years from - No increase in monthly rentalrentals, for two with monthly July 14, 1971. on the first year, then anyears, of dwelling rental below P300. increase of not more than 10units or of land on percent on the second year.which another’s - Lessor cannot demand adwelling is located deposit in excess of twoand penalizing months’ rental in advance.violations thereof,and for otherpurposes.
Presidential Amending certain Residential units Starting October - No increase in the monthlyDecree No. 20 provisions of RA covered by RA 1972-1979. rental as of the effectivity of
6359. 6359. RA 6359.- Lessor cannot demand a deposit in excess of two months’ rental in advance.
Batas Pambansa Amending certain Residential units - 10 percent yearly increase in(BP) Blg. 25 provisions of PD covered by PD 20 rent.
20. starting April 1979(5 years).
BP Blg. 877 An Act providing Residential units July 1, 1985 to Increase in rentalsfor the stabilization with total monthly December 31, - Maximum of 10 percent onand regulation of rental below P480 1987. first period (July 1, 1985-Dec.rentals of certain (not applicable to 31, 1985) and 20 percentresidential units residential units yearly (1986 and 1987).and for other newly constructed - Cumulative and compounded.purposes. or newly offered
for rent during the Ejectment (grounds)effectivity of the - Subleasing without writtenAct). consent of owner/lessor.
- Arrears in payment for three months.- Legitimate need of owner or immediate family to repossess the property for own use given no other residential unit available.- Absolute ownership by the
36

lessee of another dwelling unit in the same city/ municipality which he may use as residence.- Need of the lessor to make necessary repairs of the dwelling unit pursuant to an existing order of condemna- tion by appropriate authorities.- Expiration of the lease contract.- Sale or mortgage of the dwelling unit (registered or not) does not entitle the lessor or his successor in interest to eject the lessee.- In case of a legitimate ejectment, owner should give lessee formal notice three months in advance.
Subleasing- Allowed, provided a written consent from the lessor.- Rentals should not be higher than what is charged by the lessor.
Payment- Rentals shall be paid in advance within the first five days of every current month or the beginning of the lease agreement unless the lease contract calls for a later date.- Lessor may demand a deposit equal to a month’s rental.
RA 6643 An Act extending Residential units January 1, 1988 Increase in rentalsthe effectivity of covered by to December 31, - Maximum of 20 percentBP Blg. 877 BP 877 1989 allowed each year, for the 2-
year period.- Cumulative and compounded.
RA 6828 An Act extending Residential units January 1, 1990 Increase in rentalsthe effectivity of covered by BP 877 to December 31, - Maximum of 20 percentBP Blg. 877 for 1992 allowed each year, for the 3-another three year period.years, amending - Basis for increase: actual
37
Appendices
Law Title Coverage Period Main provisionsof effectivity

Rent Control in the Philippines
Law Title Coverage Period Main provisionsof effectivity
thereby Section 1 monthly rental as of Decemberof RA 6643 31, 1989.
- Cumulative and compounded.RA 7644 An Act further Residential units January 1, 1993 Increase in rentals
extending the rent covered by BP to December 31, - Maximum of 20 percentcontrol period for 877 1997 allowed each year, for the 5-certain residential year period.units, amending - Basis for increase: actualthereby, BP Blg. monthly rental as of December877 31, 1992.
- Cumulative and compounded.RA 8437 An Act further Residential units January 1, 1998 Increase in rentals
extending the rent covered by BP to December 31, - Maximum of 15 percentcontrol period for 877 2001 allowed each year, for the 4-certain residential year period.units, amending - Basis for increase: actualthereby BP Blg. monthly rental as of December877 31, 1997.
- Cumulative and compounded.RA 9161 An Act Establishing Residential units January 1, 2001 Increase in rentals
Reforms in the covered by BP to December - Maximum of 10 percentRegulation of 877 plus boarding 2004 yearly rental and deposit.Rentals of Certain houses, - One month advance and twoResidential Units dormitories, months deposit.
rooms, and bed Rent-to-own schemespaces - Lessor may engage in rent-
to-own agreements.Judicial ejectment- Same as BP 877.
38
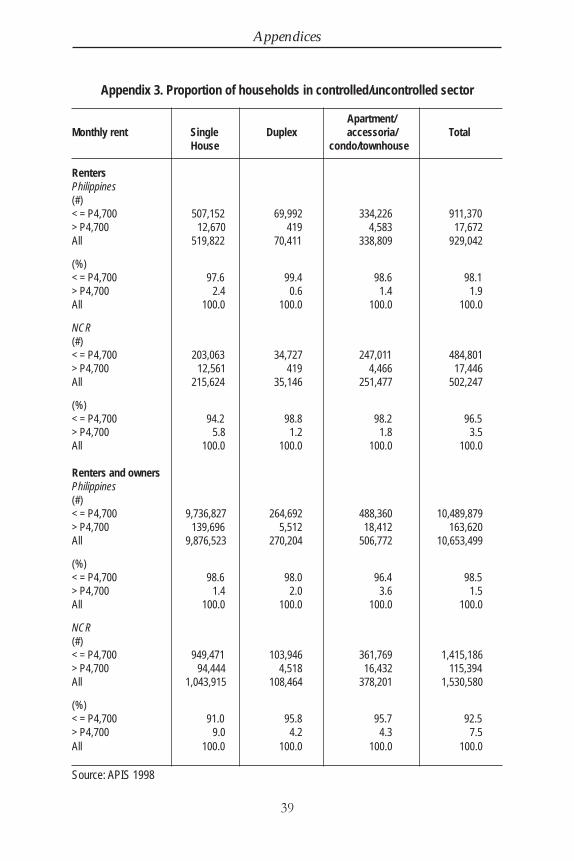
Appendix 3. Proportion of households in controlled/uncontrolled sector
Apartment/ Monthly rent Single Duplex accessoria/ Total
House condo/townhouse Renters Philippines (#) < = P4,700 507,152 69,992 334,226 911,370> P4,700 12,670 419 4,583 17,672All 519,822 70,411 338,809 929,042
(%) < = P4,700 97.6 99.4 98.6 98.1> P4,700 2.4 0.6 1.4 1.9All 100.0 100.0 100.0 100.0
NCR (#) < = P4,700 203,063 34,727 247,011 484,801> P4,700 12,561 419 4,466 17,446All 215,624 35,146 251,477 502,247
(%) < = P4,700 94.2 98.8 98.2 96.5> P4,700 5.8 1.2 1.8 3.5All 100.0 100.0 100.0 100.0 Renters and owners Philippines (#) < = P4,700 9,736,827 264,692 488,360 10,489,879> P4,700 139,696 5,512 18,412 163,620All 9,876,523 270,204 506,772 10,653,499
(%) < = P4,700 98.6 98.0 96.4 98.5> P4,700 1.4 2.0 3.6 1.5All 100.0 100.0 100.0 100.0
NCR (#) < = P4,700 949,471 103,946 361,769 1,415,186> P4,700 94,444 4,518 16,432 115,394All 1,043,915 108,464 378,201 1,530,580
(%) < = P4,700 91.0 95.8 95.7 92.5> P4,700 9.0 4.2 4.3 7.5All 100.0 100.0 100.0 100.0
Source: APIS 1998
Appendices
39

Rent Control in the Philippines
Appendix 5. Results of Hedonic Regression
All Renters Renters + OwnersCoefficient t-stat Probability Coefficient t-stat Probability
Intercept 9.091 45.344 0.0001 7.739 124.582 0.0001Flr50 -0.990 -4.936 0.0001 -1.477 -30.645 0.0001Flr90 -0.556 -2.735 0.0063 -1.035 -20.125 0.0001Flr150 -0.092 -0.427 0.6694 -0.715 -11.638 0.0001NCR1 0.336 5.879 0.0001 0.351 7.487 0.0001NCR2 0.183 1.943 0.0523 0.317 5.555 0.0001NCR3 0.133 1.775 0.0761 0.288 5.197 0.0001NCR4 0.148 3.048 0.0023OWNFAUC 0.574 21.095 0.0001Dummy variable -1.744 -12.973 0.0001 -0.242 -8.295 0.0001R2 0.353 0.455 0.455Adjusted R2 0.348 0.454 0.454 Mean Predicted Rent P1 (uncontrolled) 8,877.24 2,298.74 P2 (controlled) 1,553.71 1,805.19
Appendix 4. Results of predicted housing demand
All Renters Renters + OwnersCoefficient t-stat Probability Coefficient t-stat Probability
Intercept 0.248 0.596 0.5512 -2.849 -15.560 0.0001Income 0.672 21.710 0.0001 0.863 56.161 0.0001Household size -0.120 -2.873 0.0042 -0.328 -13.848 0.0001Dummy variable -1.418 -11.290 0.0001 -0.290 -11.634 0.0001R2 0.481 0.542 Adjusted R2 0.480 0.541 Mean Predicted Housing Demand P1 (uncontrolled) 3,439.30 1,201.96 (1,892.67)* (934.35) P2 (controlled) 832.99 899.38 (458.40) (699.14) *Figures in parenthesis are standard deviation
40
