research paper series - wufoo/credit...research paper series ... yet, empirical evidence on the role...
TRANSCRIPT
research paper series
China and the World Economy
Research Paper 2011/21
Credit Constraints and FDI Spillovers in China
by
Natasha Agarwal, Chris Milner and Alejandro Riaño
The Centre acknowledges financial support from The Leverhulme Trust under Programme Grant F/00 114/AM
The Authors
Natasha Agarwal is a PhD Student at School of Economics and GEP, University of
Nottingham.
Chris Milner is Professor of International Economics in the School of Economics and a
Research Fellow of GEP, University of Nottingham.
Alejandro Riaño is a Lecturer in the School of Economics at the University of Nottingham, a
Research Fellow of GEP and CFCM and a Research Affiliate of CESifo.
Acknowledgements
We would like to thank Professor Sanjay Banerji, Chair in Finance at Nottingham University
Business School for his useful comments.
Credit Constraints and FDI Spillovers in China
by
Natasha Agarwal, Chris Milner and Alejandro Riaño
Abstract
This paper provides firm-level evidence on the way in which credit constraints affect FDI
spillovers. Using a panel of approximately 20,000 Chinese manufacturing firms over the period
2001-2005, we show that credit constrained domestic firms have lower (even negative) FDI
spillovers, with their reduction in the spillover effect being systematically greater in sectors
with higher levels of external financial dependence. Moreover, non-state domestic firms in
financially dependent sectors have lower from FDI spillovers when compared to the state-
owned domestic firms. We also show that domestic firms in sectors that are capital-intensive,
highly tangible, and that manufacture durable and highly tradable goods benefit from larger FDI
spillovers compared to firms in labour-intensive sectors. Our findings highlight the importance
of credit constraints, host country financial institutions in determining the extent of FDI
spillovers.
JEL classification: F23, O1, O33, G31
Keywords: FDI spillovers, credit constraints, China.
Outline
1. Introduction
2. Framework
3. Data and Methodology
4. Results
5. Conclusions
Non-Technical Summary
The People’s Republic of China has consistently and continuously designed policies such as lowering
income taxes, income tax holidays, import duty exemptions, etc, to attract more FDI. The rationale for this
often stems from the belief that the activities of foreign enterprises produce spillovers that in turn generate
technology transfer and productivity gains. However, domestic conditions, particularly local financial
markets, can limit domestic firms’ ability to internalise the potential external benefits from FDI. In fact, in
an investment climate survey conducted by the World Bank, it was found that Chinese firms, both large
and small, face credit constraints completely unrelated to their expected probability of success. Moreover,
state-owned Chinese firms enjoy substantial financial backing in terms of access to loans, grants, etc from
the state-owned Chinese banks. This leaves us to question whether the capital market in China fully
allows firms to benefit from FDI.
In this study, we investigate the role that financial frictions play in influencing productivity spillovers from
foreign to domestic firms. One might argue that even though some of Chinese firms may be able to
finance their new requirements through internally generated funds, the greater the technological gap
between their current practices and new technologies, the greater the likely investment need and
associated need for external finance. Moreover, limited financial resources can restrict these firms from
investing in either imitating and/or adopting foreign technologies, in strengthening their competitive
position, employing high skilled labour, starting their own venture or by general expansion in other
domestic or export markets. However, Chinese firms may also find ways of coping with credit constraints
by becoming more efficient, cost effective, and efficient working capital management, finding alternative
financing resources that include trade credit or informal loans from friends and family; or by forming
industrial clusters. In which case they may still continue to benefit from FDI spillovers.
To investigate this issue, we estimate a production function for approximately 20,000 manufacturing
Chinese domestic firms over the period 2001-2005. In addition to the standard capital and labour inputs,
we also include the amount of FDI in the same sector and province as an additional input to production to
see if the output of firms is higher or lower than it would be if there were no FDI “inputs”.
Our analysis yields some distinct conclusions. Credit constrained domestic firms do receive lower (even
negative) FDI spillovers, and the reduction in spillovers is systematically greater in sectors at higher levels
of dependence on external finance. Moreover, we find that non-state domestic firms in sectors with higher
level levels of external financial dependence receive lower spillovers than state-owned domestic firms.
This result suggests that pervasive managerial and asset allocation inefficiencies are detrimental for the
successful realisation of FDI spillovers. It also indicates a channel through which credit constraints can

influence FDI spillovers. In addition, we find that domestic firms in sectors that are capital-intensive, highly
tangible, and that manufacture durable and highly tradable goods enjoy larger spillovers from FDI than
those in sectors that are labour-intensive, less tangible, and that manufacture non-durable and less
tradable goods.
1 INTRODUCTION
By almost all accounts, foreign direct investment (FDI) in China has been one of the major success stories of the past3 decades. Between 1984 and 2004, the total stock of FDI in China amounted to US$ 562.1 billion, with annual FDIinflow increasing from US$2.7 billion to US$60.6 billion over the same period (UNCTAD, 2005). From 1999 to 1994,the share of FDI in the country’s gross fixed capital formation increased from 3.9 to more than 17 percent1, and itsshare in GDP grew from 1.5 to 6.7 percent (UNCTAD, 2005).
The rationale for increased efforts to attract more FDI (foreign firms) often stems from the belief that, in addition todirect capital inflows and employment which accompany foreign investment, FDI generates positive externalities in theform of productivity gains, technology transfers, the introduction of new processes, managerial skills, and know-howin the domestic market, employee training international production networks, and access to markets2. These spilloversare not automatic and it may place through imitation, skills acquisition, competition, exports, and vertical linkages.
Yet, empirical evidence on the role of foreign investment in generating technology transfer to domestic firms, both atthe micro and macro level remains ambiguous (see Gorg and Greenaway (2004) for a survey). For example, Aitken andHarrison (1999) at the micro level, and Borensztein et al. (1998) and Carkovic and Levine (2003) at the macro level,find little or no support on the positive externalities associated with FDI - thus seriously putting in doubt the ‘spillover’theory.
Although it may seem natural to argue that the ambiguity relating to the existence of FDI spillovers could be becauseof the limited knowledge we have on the determining factors of FDI spillovers, it is also possible that differentcircumstances and policies of countries, industries and firms may also be the reason for this ambiguity. Therefore,our research takes its cue from the recent emphasis on the role of financial institutions in determining potential FDIspillovers and argues that increasing capital market imperfections in China can limit and/or prevent Chinese firms’ability to internalize the advantages associated with incoming FDI. Although evidence suggests that the presence offoreign firms has alleviated credit constraints faced by Chinese domestic firms through several direct and indirectchannels like direct capital financing (Greenaway et al. 2010) or trade credit (Poncet et al. 2010), the question whethersuch credit constraints restricts domestic firms from internalizing the benefits associated with FDI in the first place, hasnot yet been answered. This chapter, therefore, seeks to fill this void by providing an integrated analysis of the role thatfinancial frictions play in influencing the nature and extent of FDI spillovers in China.
We postulate ambiguity with regards to the relationship between FDI spillovers and financial frictions. This is because,to take advantage of the new knowledge, credit constraint Chinese firms might find it difficult to alter their everydayactivities like reorganize their organizational structure, buy new machines, hire new managers and skilled labour. Eventhough some of them may be able to finance new requirements through internally generated funds, the greater thetechnological gap between their current practices and new technologies, the greater the need for external finance.Moreover, Chinese firms faced with credit constraints might not be able to fully internalize the benefits from FDI aslimited financial resources can either restrict and/or hinder them from (1) investing in either imitating and/or adoptingforeign technologies; (2) in strengthening their competitive position (Povel and Rathi, 2004; Opler and Titman,
1Although FDI does not transmit one-to-one into fixed capital formation (as in some cases only the ownership of assets istransferred), the indicator gives an impression of the importance of FDI relative to overall investment (UNCTAD, 2005).
2See Caves (1996) for a comprehensive empirical and theoretical literature review on MNE and MNE-related activities.

1994; Chevalier, 1995; Phillips, 1995; and Khanna and Tice, 2000); (3) employing high skilled labour (Garmise andAnderson, 2007; Batra, 2004); (4) starting up their own venture (Alfaro et al. 2004; Evans and Jovanovic, 1989); (5)general expansion in other markets like other product markets or export markets (Manova et al., 2009; Manova, 2010;Egger and Kesina, 2010). However, it should not be forgotten that Chinese firms may still continue to benefit fromFDI spillovers if they find alternative ways of coping with credit constraints like (1) becoming more efficient (Banerjeeand Duflo, 2004; Chow and Fung, 2000); (2) more cost effective (Hale and Long, 2010; Chow and Fung, 2000; Dinget al., 2010); (3) finding alternative financing resources that include trade credit (Poncet et al., 2010) or informal loansfrom friends and family (Chow and Fung, 2000); (4) forming industrial clusters (Ruan and Zhang, 2008); (5) throughefficient management of working capital (Hale and Long, 2010; Ding et al., 2010).
China becomes an interesting case study to test the role of capital market imperfections in determining FDI spilloversbecause in an investment climate survey conducted by the World Bank in 2003, it was found that Chinese firms havemuch less access to formal finance than do firms in any other Asian country surveyed thus far (Dollar et al. 2003). Forexample, large Chinese firms3 obtain around 29 percent of their working capital from bank loans, less than in Indonesia,Malaysia, the Philippines, Thailand or Korea. The situation even becomes worse for small and medium firms4 as theyobtain, on an average, only 12 percent of their working capital from bank loans, less than in Malaysia (21 percent),Indonesia (24 percent), Philippines (28 percent), Korea and Thailand (26 percent)5. This suggests that Chinese firms,both large and small, face credit constraints completely unrelated to their expected probability of success, which inturn means that that they might find it difficult to partly or fully internalize the benefits associated with FDI.
Using data on approximately 20,000 Chinese manufacturing firms over the period 2001-2005, we show that domesticfirms faced with credit constraints benefit less or even negatively from foreign presence in the same sector and province.Therefore, domestic firms in sectors which are more credit binding such as non-electric and wood products - that financeapproximately 30 percent of their investment with external funds - benefit disproportionately less or negatively fromthe presence of foreign firms in the same industry and region as compared to their counterparts in less dependent onessuch as wearing apparel and iron- that finance investment almost entirely with internally generated funds.
We also document systematic differences between domestic state-owned firms and non-state Chinese firms. Domesticnon-state firms in sectors that are more credit binding benefit less or even negatively from FDI in the same sectorand province. On the contrary, even though state-owned enterprises enjoy preferential treatment and substantiallyeasier access to financing from Chinese state-owned banks, we find that pervasive managerial and asset allocationinefficiencies are more severe and detrimental for the successful realization of FDI spillovers towards them. Thissuggests an additional indirect channel through which credit constraints could influence FDI spillovers, i.e. bydisproportionately improving the prospects of non-state Chinese firms.
Indirectly, our analysis also provides evidence on the extent of FDI spillovers conditioned on other industrialcharacteristics. Domestic firms’ in sectors that are capital-intensive, highly tangible, and that manufacture durableand highly tradable goods enjoy greater/positive FDI spillover benefits as compared to their counterparts in sectorsthat are labour-intensive, less tangible, and that manufacture non-durable and less tradable goods. This exercise
3Where a large firm is defined as a firm with more than 100 employees.4Where a small firm is defined as a firm with less than 100 employees.5Although it is not a surprise that smaller firms in China would obtain less finance from formal sources (Smaller firms tend to
be younger and have a more uncertain future. Therefore formal financiers are more hesitant to lend to them because loans not onlyincorporate risk premium but they are also costlier for smaller firms.), it is a surprise that even for larger firms the share of capitalfinanced through formal loans is lower in China than in other Asian countries.

provides evidence of additional mechanisms that affect FDI spillovers (look at Rajan and Zingales and see if thiscan be improved).
We contribute to the existing growing literature on the determinants of FDI spillovers in China in the following ways.This literature has established theoretically and empirically that the level of development of financial markets is crucialfor the positive effects of FDI to be realised (Alfaro et al., 2004; Hermes and Lensink, 2003; Sanchez, 2009). Althoughscant, there has also been some micro-level evidence that has shed light on the mechanisms through which creditmarket imperfections affect FDI spillovers. For example, using cash flow in order to capture liquidity constraints,Javorcik and Spatareanu (2008) document that less credit-constrained Czech firms self-select into becoming arms-length suppliers for MNEs rather than the benefits derived from supplying relationship suggesting that well-developedfinancial markets may be needed in order to take full advantage of FDI spillovers. Du and Girma (2007), Girma et al.(2008) proxy firm’s liquidity needs with balance sheet variables, and report that FDI spillovers is positively associatedwith domestic innovative and export activity only if firms have good access to finance. A challenge for such studieshas been establishing a causal effect of credit constraints on FDI spillovers since the measures of financial constraintsthey use are endogenous to firms’ activities. Instead, we exploit the systematic variation in FDI spillovers at differentlevels of external financial dependence of an industry, an index developed by Rajan and Zingales (1998), to moreconvincingly establish a causal effect of credit constraints on FDI spillovers. Moreover, we are able to identify otheradditional mechanisms that affect FDI spillovers. For example, domestic firms in highly tangible industries enjoygreater/positive FDI spillovers as they are able to pledge their hard assets as collateral to raise the required finance tointernalize the benefits of FDI spillovers - when compared to their counterparts in less tangible industries.
Our work is most closely related to a few recent papers that link financial frictions and FDI spillovers. These papersspecifically emphasize that the link between FDI and growth is causal, where FDI promotes growth through financialmarkets. For example, Alfaro et al. (2004), Hermes and Lensink (2010), use a cross country data to show that well-developed financial markets gain significantly from FDI. Similarly, Sanchez (2009) use data on Mexican manufacturingfirms in 1999, 1998 and 2000 to show that domestic firms only enjoy productivity increases from FDI if they arerelatively large and located in financially developed regions. As a matter of fact, domestic firms located in regionswhere access to credit is more problematic experience negative spillover effects from FDI.
Our results are consistent with the implications of these papers that credit constraint domestic firms disproportionatelybenefit less or even negatively from FDI spillovers. Our contribution is thus in providing direct evidence on the extent towhich financial frictions affect FDI spillovers and the variation of these results across firms of different organizationalstructures.
The paper also complements the results in Du and Girma (2008) and Girma et al. (2008) who, on a slight differentnote, also show that FDI spillovers is positively associated with domestic innovative and export activity only if firmshave access to credit. This paper also adds to a growing literature on the role of FDI in alleviating/worsening creditconstraints in the host economy (Poncet et al., 2010; Harrison et al., 2004; Harrison and McMillan, 2001). In anindirect way, the paper also contributes to a growing literature on the industrial determinants of FDI spillovers (Lutz etal., 2003; Buckley et al., 2006; Kohpaiboon, 2006).
Finally, our results add to a large literature on the role of credit constraints and host-country financial institutions inexplaining the sectoral and spatial composition of MNE activity (Manova, 2010; Manova, 2009; Antras et al., 2009)

The remainder of the chapter is organized as follows. The next section provides theoretical framework. Section 2describes the data and the empirical methodology, while Section 4 presents the results. The last section concludes.
2 FRAMEWORK
The importance of accessibility to finance as a precondition for determining the nature and extent of productivityspillovers from foreign firms can be illustrated by a simple model which takes the form of a Cobb-Douglas productionfunction where output Y for a domestic firm i at time t is given by:
Yit = Ait ·Lαit ·K1−α
it (1)
where 0 < α < 1, L and K are the conventional labour and capital inputs, and A is the index of knowledge (or the levelof technology) available to the domestic firm.
The above model assumes that productivity spillovers from foreign firms (or FDI) influence the output of domesticfirms through A, the level of technology. Hence the expression of Ait is given by:
Ait = T FPit = G(FDI,FDI ∗FC) (2)
The underlying idea is that foreign firms not only utilize advanced technological process but also a more efficientorganizational structure which in turn increases the efficiency of their production process. However, such knowledgeabout productivity improvements, even though kept secret, gradually leaks out and eventually becomes a commonknowledge in the market in which both domestic and foreign firms operate. Hence, the spillover assumption isreasonable as knowledge regarding the productivity improvements are not only limited to the receiving affiliate ofthe foreign firms, but are also likely to spill over to the domestic firms that come in contact with the affiliates ofthe foreign firms. However, these spillovers are not automatic and it may take place through (1) imitation and/ordemonstration-domestic firms imitate new technologies of foreign firms (Das, 1987; Wang and Blomstrom, 1992); (2)competition-entrance of foreign firms leads to pressure on domestic firms to adjust their activities and to introduce newtechnologies (Wang and Blomstrom, 1992); (3) vertical linkages-spillovers through transactions between foreign anddomestic firms (Smarzynska, 2002); (4) movement of labour-domestic labour trained at foreign firms can either movefrom foreign firms to an existing domestic firm or start new firms (Fosfuri et al. 2001); and/or (5) exports-domesticfirms might learn how to penetrate the exports market either through collaboration or more likely through imitation(Aitken et al. 1997).
Nevertheless, the existence, sign and magnitude of productivity spillovers from foreign firms depends on the creditconstraints faced by domestic firms. However, the fashion in which such credit constraints might influence FDIspillovers remains ambiguous. The rationale for this hypothesis stems from the belief that if knowledge abouttechnological improvements from FDI is not restricted to only costless improvements in a business organization, thendomestic firms might need financial resources to reorganize their structure, hire and fire managers and skilled labour,buy new machines, etc. In this case, one would expect that domestic firms faced with credit constraints might not beable to fully internalize the benefits from FDI as limited financial resources can either restrict and/or hinder them from(1) investing in either imitating and/or adopting foreign technologies; (2) in strengthening their competitive position;(3) employing high skilled labour; (4) starting up their own venture; (5) general expansion in domestic and export

markets. Contrary to the traditional expectations, it is also possible that domestic firms may find alternative ways ofcoping with their credit constraints like (1) becoming more efficient; (2) more cost effective; (3) finding alternativefinancing resources that include trade credit or informal loans from friends and family; (4) forming industrial clusters;(5) through more efficient management of inventory levels and accounts receivable, and continue to benefit fromproductivity spillovers from FDI.
The model assumes that productivity spillovers from foreign firms are more pronounced within provincial industrialclusters in China, as show, for example, in Hseih (2006) and Girma and Gong (2008). Moreover, it assumes thedistinguishing spillovers from foreign firms that originate from HMT and other countries (non-HMT), as shown, forexample, in Girma and Gong (2008), Wei and Liu (2006), Huang (2004) and Hu and Jefferson (2002).
Thus, in conclusion, FDI and credit constraints faced by domestic firms are complementary with respect to promotingthe process of technological diffusion from foreign to domestic firms, thereby raising the productivity of domesticfirms. This hypothesis can be tested empirically, which will be the focus of the next section.
3 Data and Methodology
The dataset employed in this paper is drawn from the annual accounting reports taken from the Oriana databasecompiled by Bureau Van Dijk. It covers over 20,000 manufacturing firms for the period 2001 to 2005. These firmsconsist of few small firms, where the annual revenue from sales is over Yuan 1 million, and many large firms, wherethe annual revenue from sales is over Yuan 5 million. In terms of value added, these manufacturing firms represent,on an average, approximately 35 percent of the total manufacturing output in China. In terms of employment, theyrepresent approximately 18 percent of the total manufacturing employment in China.
The dataset contains information on value added, employment, input costs, foreign ownership, geographic location,establishment year, total tangible fixed assets, sectoral affiliation and exporting sales. Interestingly, the firms ownershipvariable provides information on the extent of foreign capital participation (distinguished between foreign investorsfrom Hong Kong, Macao and Taiwan, and other non-HMT countries). Using this information on ownership, a firmis identified to be foreign owned if the foreign participation is at least 25 percent6. Since observations refer to firm-years, firms are allowed to switch across ownership categories each year. Accordingly, 37-40 percent of firm-yearobservations are classified as foreign firms while the remaining is classified as domestic firms. Foreign firms are, on anaverage, larger in size in terms of value added and more productive in terms of value added per worker when comparedto their domestic counterparts7.
It is extremely difficult to identify the credit constrained agents (see, for instance, Fazzari, Hubbard and Peterson, 1988;
6Apart from the co-operative joint venture where the proportion of capital to be contributed by each of the parties to the ventureis stipulated in the contract and the wholly-foreign owned enterprises where the entire capital is invested by foreign investor(s),the National Bureau of Statistics of China recognizes a lower threshold of 25 percent of the company’s registered capital in caseof limited liability corporations with foreign funds and, at least 25 percent of the registered capital of a joint venture in case of aChinese-foreign equity joint venture, all of them are recognized as foreign-funded enterprises. Several authors in the literature suchas Wei and Liu (2006), Blake et al. (2009), also use 25 percent of equity capital invested by foreigners as the threshold to distinguishbetween foreign and domestic firms.
7Contact author for further information.
and Kaplan and Zingales, 1997). Therefore, we use an industry’s dependence on external financing, first proposed andused by Rajan and Zingales (1998), as a proxy to identify/measure the extent of credit constraints faced by domesticfirms. The index is constructed as the share of capital expenditures not financed with cash flows from operation for thepublicly listed US median firm in each industry over the 1980s8.
This approach is motivated for a number of reasons. Firstly, it eases some of the empirical difficulties with measuringcredit constraints at the firm level, in particular the use of firm size or the sensitivity of firm investment to cash flow(Braun and Larrain, 2004). This is because the indicator is based on the assumption that there is a technological reasonwhy some industries depend more on external finance than others, and this technologically determined characteristicsof each sector remains exogenous from the perspective of individual firms. It is indeed plausible because even if firmsin all industries may face credit constraints, there still exist systematic differences across industries in relation to theextent that the initial project scale, the gestation period, the cash harvest period, and the requirement for continuinginvestment. For example, industries that operate with large gestation periods, high R&D, or high working capitalneeds (to keep inventories for example) or in large scales tend to be highly dependent on external finance (Braunand Larrain, 2004). Moreover, Rajan and Zingales (1998) argue that the measure they construct captures a largetechnological component that is innate to a sector and is therefore an attractive index to use as a proxy for rankingindustries in all countries. Since these technological differences persist across countries, one can use the externaldependence of industries in the United States to rank industries in every country along this dimension. Identificationdoes not require that industries have exactly the same external capital dependence levels in every country, just that theirranking remains relatively stable across countries (Manova, 2010). Rajan and Zingales (1998) point that the measurethey construct varies substantially more across sectors than among companies within an industry. To support theirassumption, RZ show that their results are robust to using data from the 1970s and from Canadian industries9. Welater relax this assumption by allowing an industry’s dependence on external capital to vary across countries and overtime. Consistent with this argument, the index used in this study which is available for 28 sectors in the ISIC 3-digitclassification presented in table A-1 shows that an industry’s external dependence is very stable over time (the rawcorrelation between an industry’s demand for external financing in the 1980’s and its demand in the 1970’s is 0.63),and across countries (based on the limited data, the raw correlation between dependence measured in the United Statesand dependence measured in Canada is 0.77. Moreover it is seen that industries with low levels of external capitaldependence include tobacco, footwear and clothing in general while industries with high levels of external capitaldependence include plastic products, machinery and professional equipment.
Secondly, using the indicator based on the publicly listed firms in the United States brings in an added advantage asusing U.S. as the reference country eliminates the potential for the measure of sectors’ dependence on external financeto endogenously respond to countries’ level of financial development (Manova, 2010). Moreover, United States hasone of the most advanced and sophisticated financial systems which makes it reasonable that the behavior of U.Scompanies reflects firms’ optimal asset structure, demand for and use of external capital. Besides, there does not exista comprehensive dataset for most other countries, including China.
The methodology for the empirical analysis in this chapter closely follows the FDI spillover and the finance-growthliterature. In particular, assuming the above model (1) to be linear in logs after substituting for Ait from equation (2),
8The sector measure comes from Braun (2003).9Canada is the only other country for which there is detailed data on flow of funds in Compustat.
the regression analysis for the unbalanced panel of domestic firm i at time t is specified as follows:
log(Yit) = αlog(Lit)+ γlog(Kit)+βlog(FDI jpt)+D j +Dp +Dt + fi + eit (3)
where real value added, number of employees and the real value of tangible fixed assets are used to measure log outputYit , log labour Lit , and log capital Kit . The parameters α, γ on Lit and Kit measure the output elasticities of labourand capital respectively. To take into account the fact that productivity spillovers from FDI are more pronouncedwithin geographical industrial clusters, the analysis focuses on FDI in the same sector and province (Industry-Province-FDI). Industry-Province-FDI (FDI jpt ) is defined as the amount of value added accounted for by foreign firms in anindustry in a province10. To the extent that the productivity advantages of foreign firms spills over to domestic firms,the parameter β (which also measures the output elasticity of FDI) on FDI jpt should be positive. To separate theproductivity spillover affects based on the ownership of FDI, FDI jpt is further divided into FDI HMTjpt (amountof value added accounted for by foreign firms that originate from Hong, Kong, Macau and Taiwan) and FDI OC jpt
(amount of value added accounted for by foreign firms that originate from other countries, i.e. non-HMT). In addition,sectoral dummies D j and provincial dummies Dp are included to control for time-invariant productivity differencesacross the ten manufacturing sectors (Aitken and Harrison, 1999) and 29 provinces, municipalities and autonomousregions of China11. Time dummies Dt are included to control for possible business cyclical effect. Firm dummies fi
are also included to control for unobserved time-invariant firm specific effect. Lastly, eit denotes an idiosyncratic errorterm with iid (independently and identically distributed) properties.
To test whether credit constraints faced by domestic firms systematically influence the existence, sign and magnitudeof FDI spillovers, we introduce an interaction term of FDI jpt and the industry’s dependence on external finance EFD j
in specification (3). Thus, we estimate the following regression:
log(Yit) = αlog(Lit)+ γlog(Kit)+βlog(FDI jpt)+δlog(FDI jpt ∗EFD j)
+D j +Dp +Dt + fi + eit (4)
Where EFD j measures sector j’s dependence on external finance12. The main coefficient of interest in (4) is the oneon the interaction term, i.e. δ. The framework discussed in the above section implies that δ > 0 or δ < 0. This isbecause if credit constraints indeed limit/restricts domestic firms’ capability to internalize externalities associated withFDI, we anticipate lower productivity spillovers from FDI in sectors that are more financially dependent on externalfinance. In this case, we expect δ < 0. However, if the distortionary effect of financial frictions is mitigated by theChinese domestic firms (as they are able to find alternative ways of coping with their credit constraints) then we expectδ > 0.
We believe that specification (3) & (4) is less likely to suffer from reverse causality for two reasons. First, the focusof the study is to determine the nature and extent of productivity spillovers from foreign to domestic firms in the samesector and province. For this purpose, the sample is limited to domestic firms only. Therefore, our analysis might beless subject to the reverse causality problem that occurs when comparing foreign and domestic firms where foreignfirms may choose to invest in those sectors and/or provinces where domestic firms already perform better (Hale andLong, 2006). Second, Poncet et al. (2010) argues that when the dependent firm-specific variable (Yit in our case) isregressed on variables defined at the aggregate level (FDI jpt in our case), then reverse causality is not likely as it is
10For this chapter, we re-define FDI from the 2-digit ISIC classification to the 3-digit ISIC classification11Tibet is excluded from the analysis due to lack of information.12The main effect of EFD j is absorbed by the fixed effects.

unlikely that a firm shock translates into a change in the aggregate level variables.
4 Empirical Results
Baseline Specification
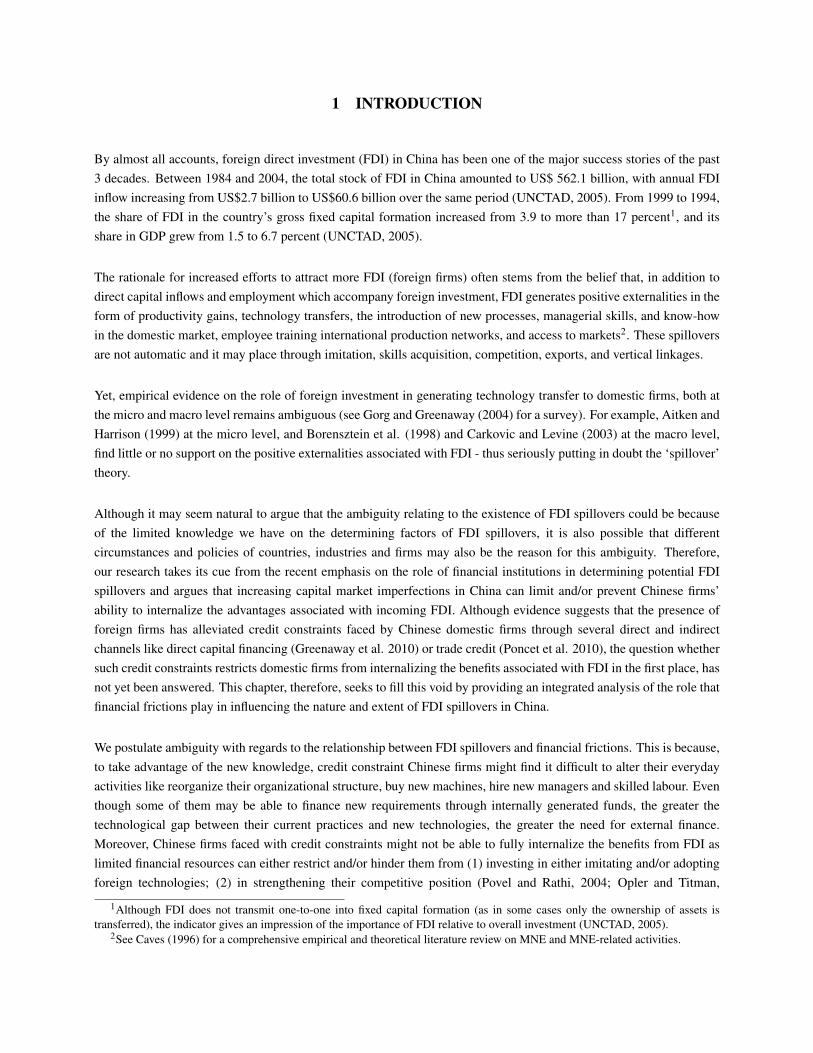
The analysis starts by estimating the base equation, that is, the conditioning influence of credit constraints faced bydomestic firms on the productivity spillovers from foreign firms are not yet taken into consideration in the regressionmodels. The results of these estimations are presented in table 1 below.
It is seen from table 1 below that the estimated coefficients on capital and labour are positive and statistically significantsuggesting that there are large productivity gains associated with the amount of capital and labour employed.
Moreover, the point estimate for the FDI variable reported in column 1 is also positive and significant, althoughsmaller in magnitude implying that an increase of 10% in foreign investment in the same sector and province, increasesdomestic firms’ productivity by 0.02%. These results are consistent with the results reported by Hseih (2006) who,while estimating a Cobb-Douglas production function on all state and non-state Chinese manufacturing plants for theperiod 1998 to 2004, also finds little evidence that an increase in the share of foreign investment in the same sectorand province, from 0 to 10 percent leads to an increase in the domestic productivity between 0.31 to 0.34 percentagepoints.
But when foreign firms are separated based on their ownership, it is seen that the coefficient estimates for FDI HMTin column 3 are statistically insignificant suggesting that there are no domestic productivity gain associated with thepresence of FDI coming from HMT. This result is fairly intuitive given that majority of FDI coming from HMT issubject to the round-tripping problem (Wei and Balasubramanyam, 2004). Moreover, previous econometric studiessuch as Girma and Gong (2008) also provide support to the fact that foreign investment coming from HMT do notbenefit domestic firms in the same sector and region. When the estimated coefficients on FDI OC in column 2 is takeninto consideration, it is seen that the estimates are positive and statistically significant implying that productivity ofdomestic firms increases by 0.02% when foreign presence in a sector and province increases by 10 percent.
A Wald test of equality on the coefficient estimates of FDI OC and FDI HMT reported at the bottom of the tableindicates there is no significant difference in the magnitude of the coefficient for FDI HMT and FDI OC. Theseresults are consistent with the results obtained by Wei and Liu (2006) who also finds that region-specific intra-industryspillovers from FDI OC and FDI HMT do not differ significantly from each other in China.
The remaining empirical analysis in this chapter will ignore FDI from HMT13 (as the outcome in table 1 shows thatdomestic firms do not benefit from the presence of FDI from HMT) and focus on FDI that originates from othercountries (non-HMT)14.
13Contact author to receive estimates for the remaining of the analysis where FDI from HMT is taken into account.14Results reported in column 2 of table 1 are fairly robust to the inclusion of additional time-varying firm characteristics (reported
in table A.3 in the appendix); and direct TFP methodology, where TFP is calculated using the Levinsohn and Petrin (2003) approach.
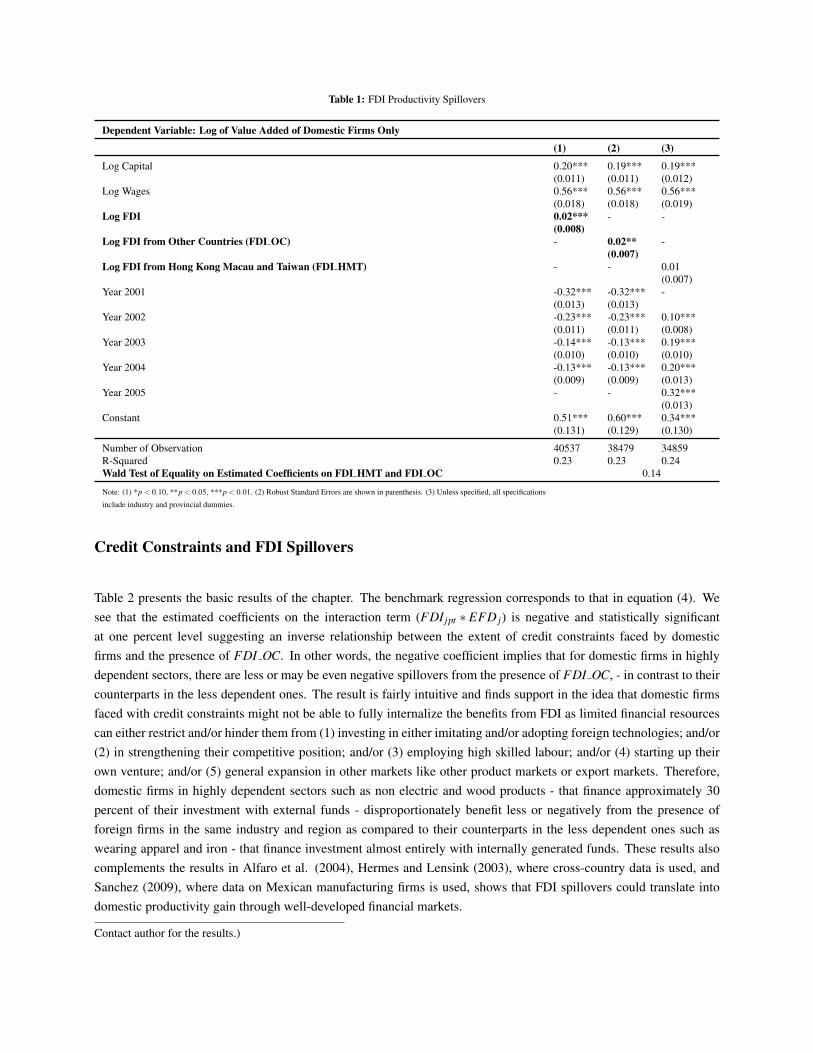
Table 1: FDI Productivity Spillovers
Dependent Variable: Log of Value Added of Domestic Firms Only
(1) (2) (3)
Log Capital 0.20*** 0.19*** 0.19***(0.011) (0.011) (0.012)
Log Wages 0.56*** 0.56*** 0.56***(0.018) (0.018) (0.019)
Log FDI 0.02*** - -(0.008)
Log FDI from Other Countries (FDI OC) - 0.02** -(0.007)
Log FDI from Hong Kong Macau and Taiwan (FDI HMT) - - 0.01(0.007)
Year 2001 -0.32*** -0.32*** -(0.013) (0.013)
Year 2002 -0.23*** -0.23*** 0.10***(0.011) (0.011) (0.008)
Year 2003 -0.14*** -0.13*** 0.19***(0.010) (0.010) (0.010)
Year 2004 -0.13*** -0.13*** 0.20***(0.009) (0.009) (0.013)
Year 2005 - - 0.32***(0.013)
Constant 0.51*** 0.60*** 0.34***(0.131) (0.129) (0.130)
Number of Observation 40537 38479 34859R-Squared 0.23 0.23 0.24Wald Test of Equality on Estimated Coefficients on FDI HMT and FDI OC 0.14
Note: (1) *p < 0.10, **p < 0.05, ***p < 0.01. (2) Robust Standard Errors are shown in parenthesis. (3) Unless specified, all specifications
include industry and provincial dummies.
Credit Constraints and FDI Spillovers
Table 2 presents the basic results of the chapter. The benchmark regression corresponds to that in equation (4). Wesee that the estimated coefficients on the interaction term (FDI jpt ∗ EFD j) is negative and statistically significantat one percent level suggesting an inverse relationship between the extent of credit constraints faced by domesticfirms and the presence of FDI OC. In other words, the negative coefficient implies that for domestic firms in highlydependent sectors, there are less or may be even negative spillovers from the presence of FDI OC, - in contrast to theircounterparts in the less dependent ones. The result is fairly intuitive and finds support in the idea that domestic firmsfaced with credit constraints might not be able to fully internalize the benefits from FDI as limited financial resourcescan either restrict and/or hinder them from (1) investing in either imitating and/or adopting foreign technologies; and/or(2) in strengthening their competitive position; and/or (3) employing high skilled labour; and/or (4) starting up theirown venture; and/or (5) general expansion in other markets like other product markets or export markets. Therefore,domestic firms in highly dependent sectors such as non electric and wood products - that finance approximately 30percent of their investment with external funds - disproportionately benefit less or negatively from the presence offoreign firms in the same industry and region as compared to their counterparts in the less dependent ones such aswearing apparel and iron - that finance investment almost entirely with internally generated funds. These results alsocomplements the results in Alfaro et al. (2004), Hermes and Lensink (2003), where cross-country data is used, andSanchez (2009), where data on Mexican manufacturing firms is used, shows that FDI spillovers could translate intodomestic productivity gain through well-developed financial markets.
Contact author for the results.)
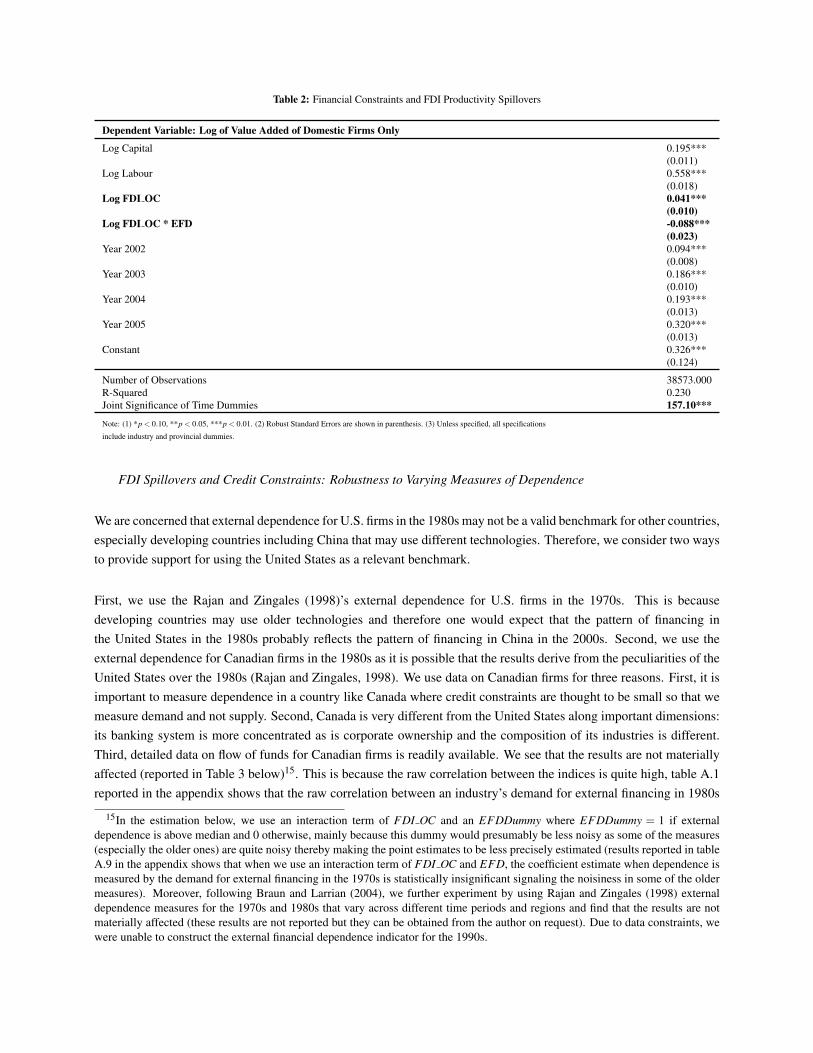
Table 2: Financial Constraints and FDI Productivity Spillovers
Dependent Variable: Log of Value Added of Domestic Firms Only
Log Capital 0.195***(0.011)
Log Labour 0.558***(0.018)
Log FDI OC 0.041***(0.010)
Log FDI OC * EFD -0.088***(0.023)
Year 2002 0.094***(0.008)
Year 2003 0.186***(0.010)
Year 2004 0.193***(0.013)
Year 2005 0.320***(0.013)
Constant 0.326***(0.124)
Number of Observations 38573.000R-Squared 0.230Joint Significance of Time Dummies 157.10***
Note: (1) *p < 0.10, **p < 0.05, ***p < 0.01. (2) Robust Standard Errors are shown in parenthesis. (3) Unless specified, all specifications
include industry and provincial dummies.
FDI Spillovers and Credit Constraints: Robustness to Varying Measures of Dependence
We are concerned that external dependence for U.S. firms in the 1980s may not be a valid benchmark for other countries,especially developing countries including China that may use different technologies. Therefore, we consider two waysto provide support for using the United States as a relevant benchmark.
First, we use the Rajan and Zingales (1998)’s external dependence for U.S. firms in the 1970s. This is becausedeveloping countries may use older technologies and therefore one would expect that the pattern of financing inthe United States in the 1980s probably reflects the pattern of financing in China in the 2000s. Second, we use theexternal dependence for Canadian firms in the 1980s as it is possible that the results derive from the peculiarities of theUnited States over the 1980s (Rajan and Zingales, 1998). We use data on Canadian firms for three reasons. First, it isimportant to measure dependence in a country like Canada where credit constraints are thought to be small so that wemeasure demand and not supply. Second, Canada is very different from the United States along important dimensions:its banking system is more concentrated as is corporate ownership and the composition of its industries is different.Third, detailed data on flow of funds for Canadian firms is readily available. We see that the results are not materiallyaffected (reported in Table 3 below)15. This is because the raw correlation between the indices is quite high, table A.1reported in the appendix shows that the raw correlation between an industry’s demand for external financing in 1980s
15In the estimation below, we use an interaction term of FDI OC and an EFDDummy where EFDDummy = 1 if externaldependence is above median and 0 otherwise, mainly because this dummy would presumably be less noisy as some of the measures(especially the older ones) are quite noisy thereby making the point estimates to be less precisely estimated (results reported in tableA.9 in the appendix shows that when we use an interaction term of FDI OC and EFD, the coefficient estimate when dependence ismeasured by the demand for external financing in the 1970s is statistically insignificant signaling the noisiness in some of the oldermeasures). Moreover, following Braun and Larrian (2004), we further experiment by using Rajan and Zingales (1998) externaldependence measures for the 1970s and 1980s that vary across different time periods and regions and find that the results are notmaterially affected (these results are not reported but they can be obtained from the author on request). Due to data constraints, wewere unable to construct the external financial dependence indicator for the 1990s.

and its demand in the 1970s is 0.63, and the raw correlation between dependence measured in the United States anddependence measured in Canada is 0.77. Moreover, the rank is not significantly altered (Braun and Larrian, 2004).Domestic firms in highly dependent sectors still benefit less or negative from the presence of foreign firms in the sameindustry and region as compared to the less dependent ones.
Table 3: FDI Spillovers and Financial Constraints: Robustness to Varying Measures of External Dependence
Dependent Variable: Log of Value Added of Domestic Firms Only
Firms in the 1980s Firms in the 1970s Canadian Firms
(1) (2) (3)
Log Capital 0.195*** 0.194*** 0.195***(0.011) (0.011) (0.012)
Log Wages 0.558*** 0.558*** 0.565***(0.018) (0.018) (0.020)
Log FDI OC 0.037*** 0.031*** 0.047***(0.010) (0.011) (0.009)
Log FDI OC*EFD Dummy -0.045*** -0.025* -0.079***(0.014) (0.014) (0.015)
Year 2002 0.095*** 0.096*** 0.098***(0.008) (0.008) (0.009)
Year 2003 0.187*** 0.187*** 0.192***(0.010) (0.010) (0.011)
Year 2004 0.195*** 0.194*** 0.209***(0.013) (0.013) (0.013)
Year 2005 0.323*** 0.322*** 0.332***(0.013) (0.013) (0.014)
Constant 0.337*** 0.305** 0.338**(0.125) (0.126) (0.137)
Number of Observations 38573 38056 34131R-Squared 0.230 0.230 0.228Joint Significance of Time Dummies 157.92*** 157.21*** 144.17***
Note: (1) *p < 0.10, **p < 0.05, ***p < 0.01. (2) Robust Standard Errors are shown in parenthesis. (3) Unless specified, all specifications
include industry and provincial dummies.
FDI Spillovers and Credit Constrains: The Role of Ownership
The ownership structure of a firm can importantly influence its financing decision and access to external capital.This particularly holds true in the Chinese context given its heterogeneous ownership structure and the ease of creditconstraints attached to it. In fact, several authors such as Chow and Fung (1998), Hale and Long (2010) to name a few,have repeatedly shown how external financing in China is mostly limited to state-owned firms and is hard to obtain fornon-state firms. Therefore, we classify domestic firms into two groups: (1) state-owned enterprises (SOEs), and (2)non-state enterprises which includes collective-owned enterprises (COEs) and private-owned enterprises (POEs)16, andaim to identify whether the ease of credit constraints attached to the ownership structure of a firm influences the extentof FDI spillovers. In particular, since state companies enjoy easier access to external capital or lower interest rates on
16Majority of the authors in the literature classify firms according to their largest ownership type in a given year (Cull et al., 2007;Hale and Long, 2010). This means that if the state holds 20% of a domestic firm’s capital share, while the non-state enterpriseshold the remaining 80% in a given year, the firm is classified as a non-state sector for that year. However, according to Sun etal. (2002), the Chinese government adopts the ’state ownership scheme’, a term used in China for privatization which implicitlyassumes capitalistic private ownership, where if the assets of a SOEs do not fall into the hands of private investors completely, theSOE is still not privatized and hence still conforms with communism’s public ownership principles. In fact, they note that there isnot even a single SOE which has been completely privatized so far. Therefore, in the Chinese context, even if the state holds only20% while the non-state holds 80%, the domestic firm will be identified as a SOE or partially privatized SOE, and still conform tocommunism’s public ownership principles. Hence, to take this gradual and lengthy privatization phenomenon into consideration, weidentify a domestic firm to be state-owned if the paid-in-capital contributed by the state is greater than zero (Dollar and Wei, 2007).The remaining firms are classified as non-state enterprises. Since each firm-year observation is taken into account, we invariablyallow the domestic firms to switch ownership categories across years.

bank loans, we would expect that they have a comparative advantage and enjoy greater FDI spillovers than domesticnon-state firms in sectors where credit constraints are more binding. This expectation, however, depends on the crucialassumption that firms of different ownership types are governed equally skillfully and use financial resources equallyefficiently (Manova, 2009). Nevertheless, anecdotal evidence indicates that domestic state firms are poorly managedand allocate capital inefficiently (Manova, 2009). Infact, Manova (2009) argues that if this holds in all sectors regardlessof their level of dependence, it would introduce noise in the estimation and explain why there is no systematic differencein the FDI spillovers enjoyed by state firms and non-state firms. Moreover, generating a comparative disadvantagefor SOEs in highly dependent sectors requires that managerial and asset allocation iefficiencies be more severe andmore detrimental to internalizing FDI spillovers in sectors with bigger liquidity needs. In addition, since the Chinesegovernment exerts considerable control over the activities of state firms, it is likely that they influence the sectors inwhich they produce and, therefore, relaxing credit constraints where they are most restrictive is probably not one of thedeterminants for successful realization of FDI spillovers.
We see that the coefficient estimate on the interaction term reported in column 3 of table 4 is negative and statisticallysignificant suggesting that domestic non-state firms in highly dependent industries find it difficult to internalize thebenefits from FDI in the same sector and region, - in contrast to their counterparts in less dependent ones. Inparticular, domestic non-state firms in highly dependent sectors such as non electric and wood products - that financeapproximately 30 percent of their investment with external funds - disproportionately benefit less or negatively fromthe presence of foreign firms in the same industry and region as compared to their counterparts in the less dependentones such as wearing apparel and iron - that finance investment almost entirely with internally generated funds. On thecontrary, an insignificant coefficient estimate on the interaction term for domestic state-owned enterprises reported incolumn 2 of table 4 suggests that even though state-owned enterprises are given preferential treatment from local state-owned banks, there exist pervasive managerial and asset allocation inefficiencies that prevents successful realization ofFDI spillovers for them.
FDI Spillovers and Credit Constrains: Is the interaction a proxy for other industrial characteristics?
The analysis so far has exploited the link between external dependence and FDI spillovers by considering a variety offirm characteristics that may be related to the ease of obtaining credit. However, we are concerned that the demandfor external finance requirement for an industry may partly or fully be capturing other industrial characteristics. Thisis because industries that tend to be highly dependent on external finance also tend to operate in large scales, withlong gestation periods, high R&D, or high working capital needs (to keep inventories for example) (Braun and Larrian,2004). This proposition becomes even more relevant if we can think of those industrial characteristics that could becorrelated with external dependence (as there are a variety of industrial characteristics that may be related to the easeof obtaining finance) and, at the same time, could also possibly be an important industry characteristic that affects theextent of FDI spillovers. If these channels exist, we can argue that the impact of FDI spillovers for different degrees ofexternal dependence might be upward biased.
Therefore, we next investigate the link between external dependence and FDI spillovers by considering a variety ofindustry characteristics that may be related to the ease of obtaining external finance, and at the same time, possiblyaffect the extent of FDI spillovers. We do so by introducing an interaction between FDI OC and the industry’s

Table 4: FDI Spillovers and Financial Constraints: The Role of Ownership
Dependen Variable: Log of Value Added of Domestic Firms Only
Preliminay Results State-Owned Enterprises Non-State Owned Enterprises
(1) (2) (3)Log Capital 0.195*** 0.272*** 0.191***
(0.011) (0.037) (0.012)Log Labour 0.558*** 0.529*** 0.556***
(0.018) (0.062) (0.019)Log FDI OC 0.041*** 0.034 0.043***
(0.010) (0.022) (0.012)Log FDI OC*EFD -0.088*** -0.066 -0.097***
(0.023) (0.060) (0.025)Year 2001 - - -0.340***
(0.016)Year 2002 0.094*** 0.070*** -0.239***
(0.008) (0.016) (0.013)Year 2003 0.186*** 0.155*** -0.142***
(0.010) (0.021) (0.011)Year 2004 0.193*** 0.131*** -0.124***
(0.013) (0.028) (0.010)Year 2005 0.320*** 0.259*** -
(0.013) (0.031)Constant 0.326*** -0.033 0.723***
(0.124) (0.423) (0.141)
Number of Observation 38573 8354 30219R Squared 0.230 0.148 0.256Joint Signifcance of Time Dummies 157.10*** 22.45*** 119.58***Wald Test on the Interaction Term Across the TwoGroups
0.39
Note: (1) *p < 0.10, **p < 0.05, ***p < 0.01. (2) Robust Standard Errors are shown in parenthesis. (3) Unless specified, all specifications
include industry and provincial dummies.
characteristics in equation (4) one at a time. Thus, we estimate the following regression:
log(Yit) = αlog(Lit)+ γlog(Kit)+βlog(FDI jpt)+δlog(FDI jpt ∗EFD j)+µlog(FDI jpt ∗ IC j)
+D j +Dp +Dt + fi + eit (5)
where IC j measures sector j’s other characteristics like its asset tangibility, the durability, etc. The main coefficient ofinterest in (5) is the one on the two interaction terms, i.e. δ and µ. While µ > 0 or µ < 0 depending on the industrialcharacteristics in discussion, we expect δ < 0 if µ is not partly or fully capturing the external dependence of an industry.
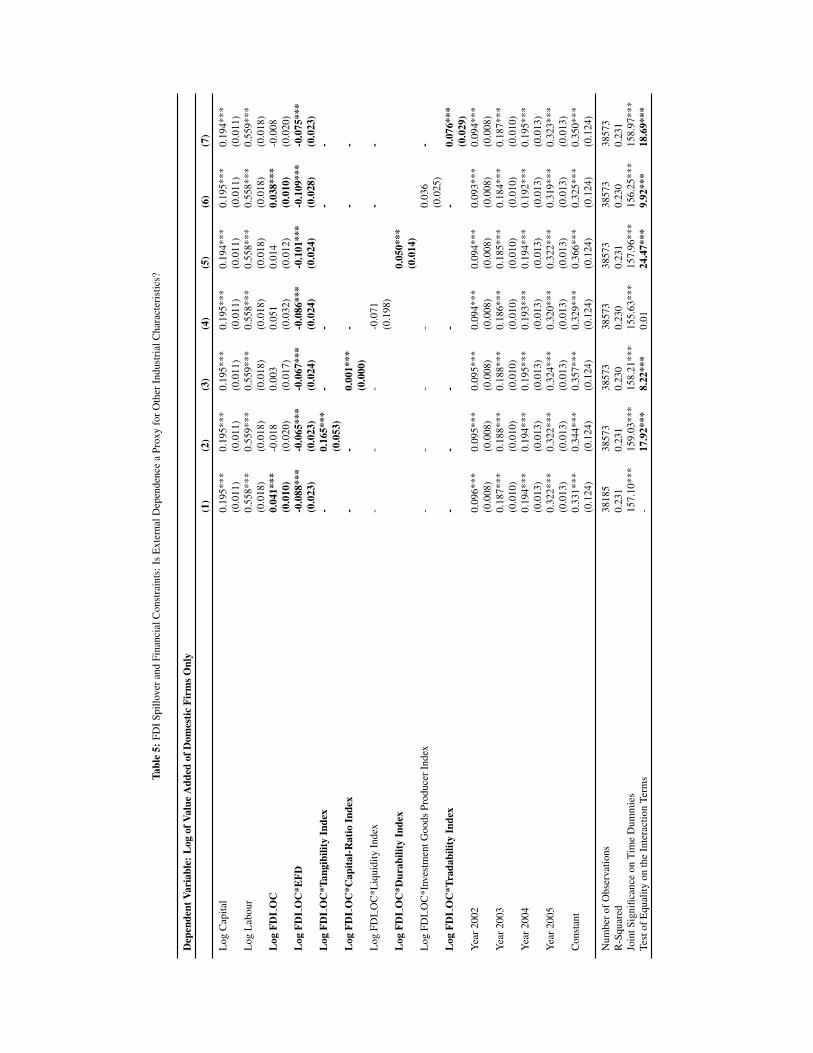
Results corresponding to that in equation (5) are reported in table 6 below. We consider a variety of industrialcharacteristics. We start by looking at the tangibility of an industry. It is fairly intuitive that an industry’s tangibilitymay affect the ease of obtaining external finance17(Braun, 2004; Kroszner et al., 2006; Manova, 2010 corroborate thesame in different context). This is because there may be less uncertainty for outsiders in measuring the value of tangibleassets and such assets may more easily be used as collateral in obtaining finance relative to intangibles (Kroszner etal., 2006). Therefore, we would expect that domestic firms in highly tangible industries disproportionately enjoygreater FDI spillovers as they will be able to raise the required external finance by pledging their harder assets ascollateral - when compared to their counterparts in less tangible ones. To investigate this link, we include µ whichrepresents an interaction of FDI OC and TangibilityIndex which is an indicator calculated as the median tangibilityof all active U.S.-based companies in the industry, as contained in Compustat’s annual industrial files for the period
17External dependence and tangibility of an industry are virtually orthogonal. Their correlation is very low, 0.092 and insignificantin statistical terms (Braun and Larrian, 2004)

1986-1995. Tangibility is measured as net property and equipment over total book value of assets (Braun, 2003)). Theindex is calculated and reported by Braun (2003). The coefficient estimate on µ reported in column (2) is positive andstatistically significant18. The result is fairly intuitive. Domestic firms in highly tangible industries such as petroleumrefineries, paper and products, iron and steel, and industrial chemicals where the share of tangible in total book assetsis around 50%, disporportionately enjoy greater/benefit positively from FDI spillovers as they are able to pledge theirhard assets as collateral to raise the required credit - when compared to their counterparts in the less tangible ones suchas leather products, pottery, china, earthenware, where the share of tangible to total books assets is just one third. Inaddition, the coefficient estimate on δ remains virtually unchanged across specification suggesting that δ is not pickingup variation in the tangibility of an industry. The coefficient estimate on µ and δ are also statistically different fromeach other at conventional levels. This implies that there exist two independent channels that affect the extent of FDIspillovers. In particular, domestic firms in sectors with a greater need for outside finance and sectors with few tangibleassets benefit disproportionately less or even negatively from the presence of foreign firms in the same sector andregion - as compared to their counterparts in less dependent and highly tangible sectors.
Second, we look at the capital-intensity of an industry. Kunt and Maksimovic (1998) argue that capital-intensiveindustries tend to generate sufficient cash flow to finance investment internally, and, hence, their reliance on externalfinance is relatively less19. This prediction, however, depends crucially on the assumption that capital-intensiveindustries are characterized by sufficient market power or faces high demand. Nevertheless, we would expect thatdomestic firms in more capital-intensive industries disproportionately enjoy greater FDI spillovers as they rely lesson external finance is - when compared to their counterparts in less capital-intensive or labour-intensive ones. Toinvestigate this link, we include µ which represents an interaction of FDI OC and CapitalIntensityIndex which is anindicator defined as the median level of the ratio of fixed assets over number of employees of U.S. firms in Compustatfor the period 1980-99. The indicator is calculated and reported by Kroszner et al. (2006). The coefficient estimate on µreported in column (3) is positive and statistically significant, although small in magnitude. The result is fairly intuitive.Domestic firms in capital-intensive industries such as petroleum refineries, iron and steel, and industrial chemicalswhere capital-labour ratio ranges between 60.62 to 244.65, disproportionately enjoy greater/benefit positively from FDIspillovers as they finance investment almost entirely with internally generated funds (around, only, 6% of investmentis financed with external funds) - when compared to their counterparts in less capital-intensive industries such astransport equipment, and wood products where the capital labour ratio ranges between 19.63 and 0.32, and they financearound 30% of investment is financed with external funds20. In fact, Buckley et al. (2005) in their study on Chinesefirms for 2001 also find that domestic firms in capital-intensive industries enjoy positive spillovers from non-HMTFDI21. A more recent study by Zhao and Zhang (2010) on Chinese firms over the period 2001-2006 also find thatcapital-intensive industries gain more from FDI spillovers. In addition, the coefficient estimate on δ remains virtuallyunchanged across specification suggesting that δ is not picking up variation in the capital intensity of an industry. Thecoefficient estimate on µ and δ are also statistically different from each other at conventional levels. This suggests thatthere exist two independent channels that affect the extent of FDI spillovers. In particular, domestic firms in sectors
18The results are robust to alternative definitions of an industry’s tangibility calculated by Braun (2003): (1) market tangibilitywhere market value of assets (computed as book value of assets minus book value of equity plus market value of equity) is used;and (2) sales tangibility where sales value of assets is used. The coefficient estimates on δ and µ remain unchanged (results are notreported but can be obtained from the author on request.)
19The raw correlation between an industry’s external dependence and its capital intensity is -0.0920There are some exceptions like the leather, footwear, and pottery sector where firms generate the most excess cash flow and
have negative external funding needs, and their capital-labour ratio is also not very high, it ranges between 8.16 to 13.21.21They divide the full sample into two sub-samples of equal size to the level of capital-labour ratio. Consequently, the low capital-
labour ratio group is defined as ‘labour intensive industries’ and the high capital-labour group as ‘capital intensive industries’ or‘technology-intensive industries’
with a greater need for outside finance and sectors which are less capital intensive disproportionately benefit less oreven negatively from the presence of foreign firms in the same sector and region - as compared to their counterparts inless dependent and capital-intensive sectors.
Next, we look at the liquidity need of an industry. Braun and Larrian (2004) argue that industries that exhibit a highworking capital need or are highly liquid (to keep inventories and meet demand for example) tend to be more dependenton external finance 22. Therefore, we would expect that domestic firms in less liquid industries disproportionatelyenjoy greater FDI spillovers as they rely less on external finance - when compared to their counterparts in highlyliquid sectors. To investigate this link, in column (5), we include µ which represents an interaction of FDI OCand LiquidityIndex which is an indicator calculated as the median level of liquidity needs for all active U.S.-basedcompanies in the industry, as contained in Compustat’s annual industrial files for the period 1980-1999. Liquidityneeds is measured as the ratio of inventories to sales (Kroszner et al., 2006). The index is calculated and reported byKroszner et al. (2006). The coefficient estimate on µ reported in column (5) is positive but statistically insignificant.However, the coefficient estimate on δ remains virtually unchanged across specification suggesting that δ is not pickingup variation in the tangibility of an industry.
Another industrial characteristics we look at is the durability of an industry. Kroszner et al. (2006) argue that industriesthat manufacture durable goods are likely to be more dependent on external finance23, and therefore δ could be pickingup variation in the durability of goods produced by an industry rather than its dependence on external finance. Tocheck for this we include µ which now represents an interaction of FDI OC and DurabilityIndex which is an indicatorof whether the industry manufactures predominantly durable goods, using the classification of U.S. industries by theU.S. Bureau of Economic Analysis. The indicator is reported by Braun and Larrian (2004). The coefficient estimateon µ reported in column (3) is positive and statistically significant24. The result is fairly intuitive. Domestic firms indurable industries such as wood products, furniture, pottery, glass products, etc, disproportionately enjoy greater/benefitpositively from FDI spillovers - when compared to their counterparts in the non-durable ones such as food products,tobacco, etc. In fact, Lutz et al. (2003) in their study on Ukrainian firms over the period 1996-2000 also find thatcompared to non-durable goods, durable goods makers are to a higher extent affected by industry-wide FDI spillovers.This is because production of a durable good is likely to require a large number of backward and forward linkageswithin both the same industry and region25. In addition, the coefficient estimate on δ remains virtually unchangedacross specification suggesting that δ is not picking up variation in the durability of goods produced by an industry.The coefficient estimate on µ and δ are also statistically different from each other at conventional levels. This suggeststhat there exist two independent channels that affect the extent of FDI spillovers. In particular, domestic firms in sectors
22The raw correlation between an industry’s dependence on external finance and its liquidity needs is 0.0723It has to be noted that the relationship between an industry’s dependence on external finance and its durability is not very
clear. This means that industries which manufacture durable goods could be more or less dependent on external finance. The rawcorrelation between an industry’s external dependence and its durability is 0.457
24The results are robust to alternative definition of an industry’s durability reported by Braun and Larrian (2004) where durablegoods are assigned a one, non-durable goods a zero and semi durable goods a 0.5. They use the classification of durable andnon-durable goods presented in BEA’s Industry Accounts in the section of Gross Domestic Product by Industry. The industriesdescribed there are almost the same as the 28 industries used in this chapter. Since there is a disagreement about the durability ofsome products, they create a semi-durable category which corresponds basically to clothing, footwear and printing. For supportingevidence regarding the durability of these last items see table 2 in Bils and Klenow (”Using Consumer Theory to Test CompetingBusiness Cycle Models, Journal of Political Economy 106, no. 2, 1998). The coefficient estimates on δ and µ remain unchanged(results are not reported but can be obtained on request from the author)
25Their classification between durable and non-durable goods makers is based on the dichotomy proposed by Sharpe (1994)where firms with an average correlation between sales and nominal GNP higher than 60th percentile are considered as durablegoods makers, while the remaining 40th percentile are considered as non-durable goods makers.

with a greater need for outside finance and sectors that manufacture non-durable disproportionately benefit less or evennegatively from the presence of foreign firms in the same sector and region - as compared to their counterparts in lessdependent and durable ones.
Lastly, we look whether an industry produces goods that targets different final users (i.e. investment versusconsumption goods), and whether an industry is producing highly tradable goods. Braun and Larrian (2004) argue thatindustries which produce goods that target different final users, or produce goods with different degrees of internationaltradability, might be more or less dependent on external finance26, and therefore δ could be picking up variation in thesecharacteristics of the industry rather than its dependence on external finance. To check for this, we include µ which nowrepresents an interaction between FDI OC and InvestmentGoodsProducerIndex and FDI OC and TradabilityIndexrespectively. Both the indicators come from Braun and Larrian (2004). The coefficient estimate on µ reported incolumn 8 is positive but statistically insignificant, while the coefficient estimate on µ reported in column 9 is positiveand statistically significant. The result is fairly intuitive. Domestic firms in industries such as non-ferrous metals,fabricated metal products, that produce highly tradable goods, disproportionately enjoy greater/benefit positively fromFDI spillovers - when compared to their counterparts in industries such as beverages, food products that produce lesstradable goods. In fact, Schoors and van der Tol (2002) divide their sample on Hungarian firms, into three groups:“closed” sectors (exporting less than one third of their production), “open” sectors (exporting between one- and two-thirds of their production), and “very open” sectors (exporting more than two-thirds of their production), and find thatpositive intra-sectoral FDI spillovers only occur in the more open sectors. Barrios and Strobl (2002) and Schoors andvan der Tol (2002) argue that this is possible as domestic firms already exposed to foreign competition will probablyhave a greater capacity not only to absorb foreign technology but also to counter the competition provided by MNEsin the local market, thereby precluding a negative impact through competition channel. In addition, the coefficientestimate on δ remains virtually unchanged across specification suggesting that δ is not picking up variation in thesecharacteristics of an industry. The coefficient estimate on µ and δ are also statistically different from each other atconventional levels. This suggests that there exist three independent channels that affect the extent of FDI spillovers.In particular, domestic firms in sectors with a greater need for outside finance and sectors that produce consumptionand less tradable goods disproportionately benefit less or even negatively from the presence of foreign firms in thesame sector and region - as compared to their counterparts in less dependent and sectors that produce more investmentand highly tradable goods.
What is especially interesting in this table is that the economic magnitude of the interaction effect, i.e. δ, acrossspecifications is generally similar despite the inclusion of other industrial characteristics. This suggests that thebenchmark results in this chapter do not hinge on the inclusion or exclusion of µ27.
26It has to be noted that the relationship between an industry’s dependence on external finance and investment-consumption goodsor tradable goods it produces is not very clear. This means that industries that manufacture investment goods or highly tradable couldbe more or less dependent on external finance. The raw correlation between an industry’s external dependence and its tradabilityand investment or consumption goods production is 0.0898 and 0.5049.
27Moreover, we see from table 6 that when we introduce the interaction of FDI OC with the tangibility index and tradability index,the coefficient estimates on FDI OC turns negative, although insignificant. Even though we are aware that we cannot interpret thecoefficient estimate on FDI OC all by itself (because of the presence of the interaction term which includes FDI OC as well), wefurther investigate if the negative estimate on FDI OC is a source of worry. To do so, we re-estimate equation (5) without the δ
this time. The results are reported in table A.13 in the appendix. We then take the partial derivate of each estimated specificationreported in column 2 and 3 of table A.13 in the appendix, and find that domestic firms in those industries that have a tangibilitywhich is greater than or equal to approximately 0.19, and tradability which is greater than or equal to approximately 0.31, enjoypositive FDI spillovers. These thresholds indicate that the total effect is positive for about 3⁄4 of sectors and negative for 1⁄4 of sectorswhich constitutes the lowest end of the distribution for each indicator. It is possible that industries that manufacture durable goods,investment goods and highly tradable goods are able to generate internal cash flow due to large turnovers and hence rely less on
5 CONCLUSION
Despite the current global crisis, China is still ranked as the second most popular destination for FDI (WIR, 2010). Infact, China is ranked as the top host economy for FDI in 2010-2012 (WIR, 2010)28. This piece of evidence suggeststhat China has been and will continue to be one of the favourite destinations for MNEs’ FDI plans. However, domesticstructural rigidity still continues to be the biggest challenge in the successful realization of the benefits associated withFDI. Nevertheless, due to the ‘growth-development’ benefits FDI seems to convey, the Chinese government continuesto provide special incentives to foreign enterprises - including lower incomes taxes or income tax holidays, import dutyexemptions, and subsidies for infrastructure- as well as implement policies that seek to improve the local regulatoryenvironment and the cost of doing business.
Even though such policies may prove effective in attracting large amounts of FDI, domestic conditions, particularlylocal financial markets, can limit the potential externalities from FDI. This is even highlighted in the 12th Five Year Planof China where a greater need of financial system reform is also recognized. Therefore, this chapter provides micro-level evidence on the important consequences of financial market imperfections for firms’ ability to take advantageof potential FDI spillovers. We show that credit constraints affects Chinese companies’ overall productivity gain bylimiting and/or restricting them from internalizing FDI spillovers. In particular, we show that domestic firms in sectorsthat are more credit binding such as non - electric and wood products- that finance approximately 30 percent of theirinvestment with external funds - disproportionately benefit less or even negative from foreign firms in the same industryand region, when compared to their counterparts in less dependent ones such as wearing apparel and iron - that financeinvestment almost entirely with internally generated funds.
We also demonstrate that, despite the preferential treatment by domestic state-owned banks and facilitated access toexternal financing, Chinese state-owned enterprises are unable to successfully internalize FDI spillovers. In fact, weshow that this phenomenon not only stands true for the SOEs, but also for the mature Chinese firms. Our findingsthus highlight: (1) managerial competency and asset allocation may be less efficient and poorer in SOEs and matureChinese firms; and (2) there exist an additional indirect channel through which credit constraints could influence FDIspillovers, i.e. by disproportionately improving the prospects of non-state owned firms and young Chinese firms. Haleand Long (2010) in their study on the Chinese manufacturing firms for 2000-2006 also conclude that financial marketreforms, by allowing further growth of the private sector through more credit availability, may well be the next engineof sustained growth in China.
Moreover, we are also able to show that there could be additional mechanisms that might affect FDI spillovers. Forexample, we are able to demonstrate that domestic firms in sectors that are less tangible - disproportionately benefit lessor even negative from FDI spillovers - when compared to their counterparts in highly tangible ones. This is because, inthe presence of capital market imperfections, domestic firms in highly tangible industries are able to pledge their hardassets as collateral and raise the required credit to take advantage of FDI spillovers.
One broad implication of our results is that Chinese policy makers could weigh the cost of policies aimed at attracting
external finance.For indicators where the figures for industrial chemicals industry (ISIC 351) is not reported, we construct it as the average of the
two sub-sectors, i.e. synthetic resins (3513) and basic industrial chemicals excluding fertilizers (3511), reported in their papers. Theresults are robust to the exclusion of industrial chemicals. The same methodology was also adopted by Braun (2003)
28These rankings are based on the magnitude of 2009 FDI inflows.
FDI versus those that seek to improve local conditions. This is because better local conditions not only attract foreigncompanies but also allow host economies to maximize the benefits of FDI, even though these two policies need not becompatible. Moreover, it could improve the prospects of financial accessibility for both non-state Chinese enterprisesso as to fully benefit from incoming FDI. Lastly, recognition of other mechanisms could also help the recognition ofsectors where FDI could be encouraged which indirectly could also accelerate technological diffusion from the same.Given that, from 1978 to 2004, China’s external trade volume increased 56-fold, with exports and imports increasingfrom US$ 9.8 and US$ 10.9 billion to US$ 593.4 and US$ 561.4 billion respectively (UNCTAD, 2005), it will be veryinteresting to study whether financial frictions limit and/or restrict export spillovers from FDI, if at all export spilloversfrom FDI exist in the first place.
Tabl
e5:
FDIS
pillo
vera
ndFi
nanc
ialC
onst
rain
ts:I
sE
xter
nalD
epen
denc
ea
Prox
yfo
rOth
erIn
dust
rial
Cha
ract
eris
tics?
Dep
ende
ntVa
riab
le:L
ogof
Valu
eA
dded
ofD
omes
ticFi
rmsO
nly
(1)
(2)
(3)
(4)
(5)
(6)
(7)
Log
Cap
ital
0.19
5***
0.19
5***
0.19
5***
0.19
5***
0.19
4***
0.19
5***
0.19
4***
(0.0
11)
(0.0
11)
(0.0
11)
(0.0
11)
(0.0
11)
(0.0
11)
(0.0
11)
Log
Lab
our
0.55
8***
0.55
9***
0.55
9***
0.55
8***
0.55
8***
0.55
8***
0.55
9***
(0.0
18)
(0.0
18)
(0.0
18)
(0.0
18)
(0.0
18)
(0.0
18)
(0.0
18)
Log
FDI
OC
0.04
1***
-0.0
180.
003
0.05
10.
014
0.03
8***
-0.0
08(0
.010
)(0
.020
)(0
.017
)(0
.032
)(0
.012
)(0
.010
)(0
.020
)L
ogFD
IO
C*E
FD-0
.088
***
-0.0
65**
*-0
.067
***
-0.0
86**
*-0
.101
***
-0.1
09**
*-0
.075
***
(0.0
23)
(0.0
23)
(0.0
24)
(0.0
24)
(0.0
24)
(0.0
28)
(0.0
23)
Log
FDI
OC
*Tan
gibi
lity
Inde
x-
0.16
5***
--
--
(0.0
53)
Log
FDI
OC
*Cap
ital-R
atio
Inde
x-
-0.
001*
**-
--
(0.0
00)
Log
FDI
OC
*Liq
uidi
tyIn
dex
--
--0
.071
--
(0.1
98)
Log
FDI
OC
*Dur
abili
tyIn
dex
0.05
0***
(0.0
14)
Log
FDI
OC
*Inv
estm
entG
oods
Prod
ucer
Inde
x-
--
-0.
036
-(0
.025
)L
ogFD
IO
C*T
rada
bilit
yIn
dex
--
--
-0.
076*
**(0
.029
)Y
ear2
002
0.09
6***
0.09
5***
0.09
5***
0.09
4***
0.09
4***
0.09
3***
0.09
4***
(0.0
08)
(0.0
08)
(0.0
08)
(0.0
08)
(0.0
08)
(0.0
08)
(0.0
08)
Yea
r200
30.
187*
**0.
188*
**0.
188*
**0.
186*
**0.
185*
**0.
184*
**0.
187*
**(0
.010
)(0
.010
)(0
.010
)(0
.010
)(0
.010
)(0
.010
)(0
.010
)Y
ear2
004
0.19
4***
0.19
4***
0.19
5***
0.19
3***
0.19
4***
0.19
2***
0.19
5***
(0.0
13)
(0.0
13)
(0.0
13)
(0.0
13)
(0.0
13)
(0.0
13)
(0.0
13)
Yea
r200
50.
322*
**0.
322*
**0.
324*
**0.
320*
**0.
322*
**0.
319*
**0.
323*
**(0
.013
)(0
.013
)(0
.013
)(0
.013
)(0
.013
)(0
.013
)(0
.013
)C
onst
ant
0.33
1***
0.34
4***
0.35
7***
0.32
9***
0.36
6***
0.32
5***
0.35
0***
(0.1
24)
(0.1
24)
(0.1
24)
(0.1
24)
(0.1
24)
(0.1
24)
(0.1
24)
Num
bero
fObs
erva
tions
3818
538
573
3857
338
573
3857
338
573
3857
3R
-Squ
ared
0.23
10.
231
0.23
00.
230
0.23
10.
230
0.23
1Jo
intS
igni
fican
ceon
Tim
eD
umm
ies
157.
10**
*15
9.03
***
158.
21**
*15
5.63
***
157.
96**
*15
6.25
***
158.
97**
*Te
stof
Equ
ality
onth
eIn
tera
ctio
nTe
rms
-17
.92*
**8.
22**
*0.
0124
.47*
**9.
92**
*18
.69*
**

REFERENCES Aitken, B; Hanson, G. H; Harrison, A. E. 1997. "Spillovers, foreign investment, and export behaviour." Journal of International Economics, 43:1-2, pp. 103-32. Aitken, B. J; Harrison, A. E. 1999. "Do Domestic Firms Benefit from Direct Foreign Investment? Evidence from Venezuela." The American Economic Review, 89:3, pp. 605-18. Alfaro, L; Chanda, A; Sebnem, K-O; Selin, S. 2004. "FDI and economic growth: the role of local financial markets?" Journal of International Economics, 64:1, pp. 89-112. Antras, P; Desai, M; Foley, F. 2008. "Multinational firms, FDI flows and imperfect capital markets." Quarterly Journal of Economics, 124:3, pp. 1171-219. Banerjee, A. V; Duflo, E. 2004. "Do firms want to borrow more? Testing credit constraints using a direct lending program." manuscript. MIT. Barrios, S; Strobl, E. 2002. "Foreign direct investment and productivity spillovers: evidence from the Spanish experience." Weltwirtschaftliches Archiv, 138:3, pp. 459-81. Batra, G; Stone, A. H. W. 2004. "Investment climate, capabilities, and firm performance: evidence from the world business environment survey." Investment Climate Department, the World Bank Group. Bi, J; Dullien, S; Flassbeck, H; Geiger, M; Li, Y; Song, H; Sun, Y; Weiss, J; Yu, C. 2005. "China in a Globalizing World." United Nations Conference on Trade and Development. Borensztein, E; De Gregorio, J; Lee, J-W. 1998. "How Does Foreign Direct Investment Affect Economic Growth." Journal of International Economics, 45, pp. 115-35. Braun, M. 2003. "Financial Contractibility and asset hardness." manuscript. Department of Economics, Harvard University. Braun, M; Larrian, B. 2004. "Finance and the Business Cycle: International, Inter-industry Evidence." manuscript. UCLA Anderson School of Management Buckley, P; Wang, C; Clegg, J. 2007. "The impact of foreign ownership, local ownership and industry characteristics on spillover benefits from foreign direct investment in China." International Business Review, 16, pp. 142-58. Carkovic, M; Levine, R. 2003. "Does Foreign Direct Investment Accelerate Economic Growth?" Working Paper. University of Minnesota. Chevalier, J. A. 1995. "Capital structure and product-market competition: empirical evidence from the super-market industry." The American Economic Review, 85, pp. 415-35. Chirinko, R; Schaller, H. 1995. "Why does liquidity matter in investment equations?" Journal of Money, Credit Bank, 27:2, pp. 527-48. Chow, C. K-W; Fung, M. K. Y. 2000. "Small businesses and liquidity constraints in financing business investment: evidence from Shanghai's manufacturing sector." Journal of Business Venturing, 15, pp.

363-83. Chow, C. K. W; Fung, M. K. Y. 1998. "Ownership structure, lending bias, and liquidity constraints: evidence from Shanghai's manufacturing sector." Journal of Comparative Statistics, 26, pp. 301-16. Crespo, N; Fontoura, M. 2007. "Determinant Factors of FDI Spillovers - What Do We Really Know?" World Development, 35:3, pp. 410-25. Das, S. 1987. "Externalities and technology transfer through multinational corporations - a theoretical analysis." Journal of International Economics, 22, pp. 171-82. Devereux, M; Schiantarelli, F. 1990. "Investment, financial factors and cash flow: evidence from U.K. panel data," in Information, capital markets and investment. G Hubbard ed: University of Chicago Press, pp. 279-306. Ding, S; Guariglia, A; Knight, J. 2010. "Negative investment in China: financing constraints and restructing versus growth." Department of Economics Discussion Paper Series. University of Oxford. Dollar, D; Driemeier, M. H; Shi, A; Wallsten, S; Wang, S; Xu, L. C. 2003. "Improving the investment climate in China." Investment Climate Assessment. World Bank and IFC. Du, J; Girma, S. 2007. "Finance and firm export in China." KYKLOS, 60:1, pp. 37-54. Egger, P; Kesina, M. 2010. "Financial constraints and exports: evidence from Chinese firms." manuscript: ETH Zurich. Evans, D.S; Jovanovic, B. 1989. "An estimated model of entrepreneurial choice under liquidity constraints." Journal of Political Economy, 97:4, pp. 808-27. Fazzari, S; Hubbard, G; Peterson, B. 1988. "Financing constraints and corporate investment." Brookings Papers on Economic Activity, pp. 141-95. Fosfuri, A; Motta, M; Ronde, T. 2001. "Foreign direct investment and spillovers through workers' mobility." Journal of International Economics, 53:1, pp. 205-22. Garmaise, M. J; Anderson, U. 2008. "Production in entrepreneurial firms: the effect of financial constraints on labor and capital." The Review of Financial Studies, 21:2, pp. 543-77. Girma, S; Gong, Y. 2008. "FDI, linkages and the efficiency of State-Owned Enterprises in China." Journal of Development Studies, 44:5, pp. 728-49. Girma, S; Gong, Y; Gorg, H. 2008. "Foreign direct investment, and innovation activity in Chinese enterprises." Kiel Working Paper No. 1400. Kiel Institute for the World Economy: Kiel. Gorg, H; Greenaway, D. 2004. "Much Ado About Nothing? Do Domestic Firms Really Benefit from Foreign Direct Investment?" Discussion Paper Series IZA DP No. 944. Greenaway, D; Guariglia, A; Yu, Z. 2009. "The More the Better? Foreign Ownership and Corporate Performance in China." GEP Research Paper Series 2009/05. University of Nottingham. Hale, G; Long, C. 2006. "What determines technological spillovers of foreign direct investmnt: evidence
from China." Economic Growth Centre Discussion Paper No. 934. Yale University. Hale, G; Long, C. 2010. "If you try, you'll get by: Chinese private firms' efficiency gains from overcoming financial constraints " Federal Reserve Bank of San Francisco Working Paper Series 2010-21. Harrison, A. E; Love, I; McMillan, M. S. 2004. "Global capital flows and financing constraints." Journal of Development Economics, 75, pp. 269-301. Harrison, A. E; MacMillan, M. S. 2001. "Does direct foreign investment affect domestic firms' credit constraints?" NBER Working Paper 8438. National Bureau of Economics Research. Hermes, N; Lensink, R. 2003. "Foreign direct investment, financial development and economc growth." Journal of Development Studies, 40:1, pp. 142-63. Hseih, C. 2006. "Do domestic Chinese firms benefit from foreign direct investment? ." University of California working paper series Vol. 2006-30. University of California. Hu, A; Jefferson, G. 2002. "FDI impact and spillover: evidence from China's electronic and textile industries." The World Economy, 25:8, pp. 1063-76. Javorcik, B. S; Spatareanu, M. 2008. "Liquidity constraints and linkages with multinationals." LICOS Discussion Paper Series 225/2008. LICOS Centre for Institutions and Economic Performance: Belgium. Kaplan, S; Zinglaes, L. 1997. "Do investment-cash flow sensitivities provide useful measure of financing constraints?" Quarterly Journal of Economics, 112, pp. 169-215. Khanna, N; Tice, S. 2000. "Strategic responses of incumbents to new entry: the effect of ownership structure, capital structure, and focus." Review of Financial Studies 13, pp. 749-79. Kohpaiboon, A. 2006. "Foreign direct investment and technology spillover: a cross-industry analysis of Thai manufacturing " World Development, 34:3, pp. 541-56. Kroszner, R. S; Laeven, L; Klingebiel. 2006. "Banking Crisis, Financial Dependence, and Growth." manuscript: University of Chicago, CEPR and World Bank. Kunt, A. D; Maksimovic, V. 1998. "Law, finance and firm growth." manuscript: World Bank and University of Maryland. Lipsey, R. 2002. "Home and host country effects of FDI." NBER working paper 9293. National Bureau of Economic Research: Cambridge, MA. Lutz, S; Talavera, O; Park, S-M. 2003. "The effects of regional and industry-wide FDI spillovers on export of Ukrainian firms." ZEW Discussion Paper No. 03-54. Centre for European Economic Research. Manova, K. 2010. "Credit constraints, heterogeneous firms and international trade." NBER working paper 14531. NBER. Manova, K; Wei, S. J; Zhang, Z. 2009. "Firm exports and multinational activity under credit constraints." NBER working paper 16905. NBER.
Oliner, S; Rudebusch, G. 1992. "Sources of the financing hierachy for business investment." Review of Economics and Statistics, 74, pp. 643-54. Opler, T. C; Titman, S. 1994. "Financial distress and corporate performance." The Journal of Finance, XLIX:3, pp. 1015-40. Poncet, S; Steingress, W; Vandenbussche, H. 2010. "Financial Constraints in China: Firm-level evidence." China Economic Review, 21, pp. 411-22. Povel, P; Raith, M. 2004. "Financial constraints and product market competition: ex ante vs. ex post incentives." International Journal of Industrial Organization, 22, pp. 917-49. Rajan, R. G; Zingales, L. 1998. "Financial Dependence and growth." The American Economic Review, 88:3, pp. 559-96. Ruan, J; Zhang, X. 2008. "Credit constraints, organizational choice, and returns to capital: evidence from a rural industrial cluster in China." IFPRI Discussion Paper 00830. Development Strategy and Governance Division, International Food Policy Research Institute. Sanchez, C. V. 2009. "FDI spillovers and the role of local financial markets: evidence from Mexico." manuscript: University of Houston. Schoors, K; Van der Tol, B. 2002. "Foreign direct investment spillovers within and between sectors: evidence from Hungarian data." Working paper 2002/157. University of Gent. Smarzynska, B. K. 2002. "Does foreign direct investment increase the productivity of domestic firms? In search of spillovers through backward linkages " World Bank Policy Research Working Paper 2923. UNCTAD. 2010. "World Investment Report 2010: Investing in a low-carbon economy." Wang, J; Blomstrom, M. 1992. "Foreign direct investment and technology transfer: A simple model." European Economic Review 36, pp. 137-55. Wei, Y; Balasubramanyam, VN. 2004. Foreign direct investment: Six country case studies: Edward Elgar, Cheltenham. Wei, Y; Liu, X. 2006. "Productivity spillovers from R&D, exports, and FDI in China's manufacturing sector." Journal of International Business Studies, 37, pp. 544-57. Yang, Q. G; Temple, P. "The Hazard of Chinese Enterprises under Restructuring." manuscript, University of Surrey. Yueh, L. 2008. "China's productivity challenge." Business Strategy Review, Spring 2009. Zhao, Z; Zhang, K. H. 2010. "FDI and industrial productivity in China: evidence from panel data in 2001-06." Review of Development Economics 14:3, pp. 656-65.
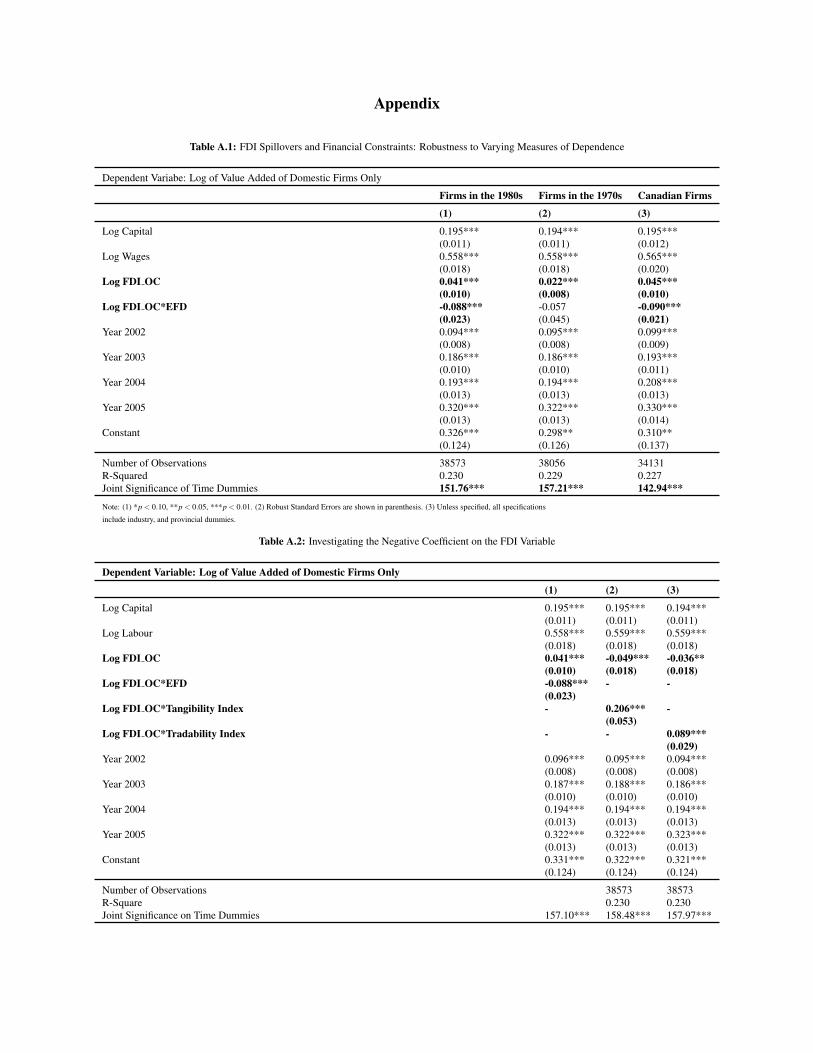
Appendix
Table A.1: FDI Spillovers and Financial Constraints: Robustness to Varying Measures of Dependence
Dependent Variabe: Log of Value Added of Domestic Firms Only
Firms in the 1980s Firms in the 1970s Canadian Firms
(1) (2) (3)
Log Capital 0.195*** 0.194*** 0.195***(0.011) (0.011) (0.012)
Log Wages 0.558*** 0.558*** 0.565***(0.018) (0.018) (0.020)
Log FDI OC 0.041*** 0.022*** 0.045***(0.010) (0.008) (0.010)
Log FDI OC*EFD -0.088*** -0.057 -0.090***(0.023) (0.045) (0.021)
Year 2002 0.094*** 0.095*** 0.099***(0.008) (0.008) (0.009)
Year 2003 0.186*** 0.186*** 0.193***(0.010) (0.010) (0.011)
Year 2004 0.193*** 0.194*** 0.208***(0.013) (0.013) (0.013)
Year 2005 0.320*** 0.322*** 0.330***(0.013) (0.013) (0.014)
Constant 0.326*** 0.298** 0.310**(0.124) (0.126) (0.137)
Number of Observations 38573 38056 34131R-Squared 0.230 0.229 0.227Joint Significance of Time Dummies 151.76*** 157.21*** 142.94***
Note: (1) *p < 0.10, **p < 0.05, ***p < 0.01. (2) Robust Standard Errors are shown in parenthesis. (3) Unless specified, all specifications
include industry, and provincial dummies.
Table A.2: Investigating the Negative Coefficient on the FDI Variable
Dependent Variable: Log of Value Added of Domestic Firms Only
(1) (2) (3)
Log Capital 0.195*** 0.195*** 0.194***(0.011) (0.011) (0.011)
Log Labour 0.558*** 0.559*** 0.559***(0.018) (0.018) (0.018)
Log FDI OC 0.041*** -0.049*** -0.036**(0.010) (0.018) (0.018)
Log FDI OC*EFD -0.088*** - -(0.023)
Log FDI OC*Tangibility Index - 0.206*** -(0.053)
Log FDI OC*Tradability Index - - 0.089***(0.029)
Year 2002 0.096*** 0.095*** 0.094***(0.008) (0.008) (0.008)
Year 2003 0.187*** 0.188*** 0.186***(0.010) (0.010) (0.010)
Year 2004 0.194*** 0.194*** 0.194***(0.013) (0.013) (0.013)
Year 2005 0.322*** 0.322*** 0.323***(0.013) (0.013) (0.013)
Constant 0.331*** 0.322*** 0.321***(0.124) (0.124) (0.124)
Number of Observations 38573 38573R-Square 0.230 0.230Joint Significance on Time Dummies 157.10*** 158.48*** 157.97***
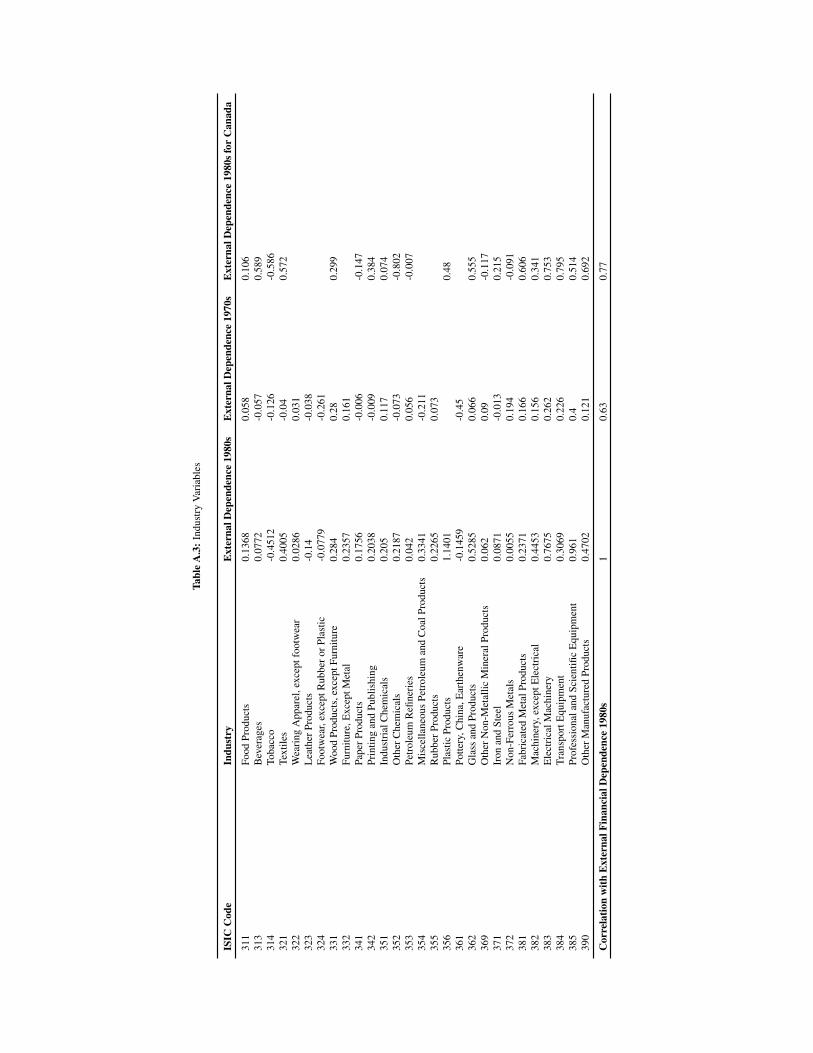
Tabl
eA
.3:I
ndus
try
Var
iabl
es
ISIC
Cod
eIn
dust
ryE
xter
nalD
epen
denc
e19
80s
Ext
erna
lDep
ende
nce
1970
sE
xter
nalD
epen
denc
e19
80sf
orC
anad
a
311
Food
Prod
ucts
0.13
680.
058
0.10
631
3B
ever
ages
0.07
72-0
.057
0.58
931
4To
bacc
o-0
.451
2-0
.126
-0.5
8632
1Te
xtile
s0.
4005
-0.0
40.
572
322
Wea
ring
App
arel
,exc
eptf
ootw
ear
0.02
860.
031
323
Lea
ther
Prod
ucts
-0.1
4-0
.038
324
Foot
wea
r,ex
cept
Rub
bero
rPla
stic
-0.0
779
-0.2
6133
1W
ood
Prod
ucts
,exc
eptF
urni
ture
0.28
40.
280.
299
332
Furn
iture
,Exc
eptM
etal
0.23
570.
161
341
Pape
rPro
duct
s0.
1756
-0.0
06-0
.147
342
Prin
ting
and
Publ
ishi
ng0.
2038
-0.0
090.
384
351
Indu
stri
alC
hem
ical
s0.
205
0.11
70.
074
352
Oth
erC
hem
ical
s0.
2187
-0.0
73-0
.802
353
Petr
oleu
mR
efine
ries
0.04
20.
056
-0.0
0735
4M
isce
llane
ous
Petr
oleu
man
dC
oalP
rodu
cts
0.33
41-0
.211
355
Rub
berP
rodu
cts
0.22
650.
073
356
Plas
ticPr
oduc
ts1.
1401
0.48
361
Potte
ry,C
hina
,Ear
then
war
e-0
.145
9-0
.45
362
Gla
ssan
dPr
oduc
ts0.
5285
0.06
60.
555
369
Oth
erN
on-M
etal
licM
iner
alPr
oduc
ts0.
062
0.09
-0.1
1737
1Ir
onan
dSt
eel
0.08
71-0
.013
0.21
537
2N
on-F
erro
usM
etal
s0.
0055
0.19
4-0
.091
381
Fabr
icat
edM
etal
Prod
ucts
0.23
710.
166
0.60
638
2M
achi
nery
,exc
eptE
lect
rica
l0.
4453
0.15
60.
341
383
Ele
ctri
calM
achi
nery
0.76
750.
262
0.75
338
4Tr
ansp
ortE
quip
men
t0.
3069
0.22
60.
795
385
Prof
essi
onal
and
Scie
ntifi
cE
quip
men
t0.
961
0.4
0.51
439
0O
ther
Man
ufac
ture
dPr
oduc
ts0.
4702
0.12
10.
692
Cor
rela
tion
with
Ext
erna
lFin
anci
alD
epen
denc
e19
80s
10.
630.
77

A.1
1:In
dust
ryV
aria
bles
ISIC
Cod
eIn
dust
ryA
sset
Tang
ibili
tyL
iqui
dity
Nee
dsD
urab
leG
oods
Cap
ital-t
oL
abou
rTr
adab
ility
Inve
stm
entG
oods
Prod
ucer
311
Food
Prod
ucts
0.37
770.
10
25.1
70.
158
031
3B
ever
ages
0.27
940.
10
53.1
70.
158
031
4To
bacc
o0.
2208
0.28
026
.13
0.15
70
321
Text
iles
0.37
30.
170
13.2
80.
444
0.09
532
2W
eari
ngA
ppar
el,e
xcep
tfoo
twea
r0.
1317
0.21
07.
120.
405
032
3L
eath
erPr
oduc
ts0.
0906
0.23
08.
160.
495
032
4Fo
otw
ear,
exce
ptR
ubbe
rorP
last
ic0.
1167
0.22
08.
240.
495
033
1W
ood
Prod
ucts
,exc
eptF
urni
ture
0.37
960.
111
18.0
50.
560.
751
332
Furn
iture
,Exc
eptM
etal
0.26
30.
151
12.6
70.
223
0.46
534
1Pa
perP
rodu
cts
0.55
790.
130
37.3
20.
570
342
Prin
ting
and
Publ
ishi
ng0.
3007
0.07
018
.20.
107
035
1In
dust
rial
Che
mic
als
0.41
160.
135
060
.56
0.88
10.
062
352
Oth
erC
hem
ical
s0.
1973
0.15
031
.08
0.88
10.
062
353
Petr
oleu
mR
efine
ries
0.67
080.
070
244.
650.
234
035
4M
isce
llane
ous
Petr
oleu
man
dC
oalP
rodu
cts
0.30
380.
120
71.8
50.
234
035
5R
ubbe
rPro
duct
s0.
379
0.15
022
.46
0.56
20.
016
356
Plas
ticPr
oduc
ts0.
3448
0.13
041
.09
0.78
10.
008
361
Potte
ry,C
hina
,Ear
then
war
e0.
0745
0.17
113
.21
0.70
60
362
Gla
ssan
dPr
oduc
ts0.
3313
0.15
129
.96
0.68
60
369
Oth
erN
on-M
etal
licM
iner
alPr
oduc
ts0.
420.
151
43.2
0.70
60
371
Iron
and
Stee
l0.
4581
0.17
160
.62
0.91
90.
069
372
Non
-Fer
rous
Met
als
0.38
320.
161
39.3
50.
958
0.30
538
1Fa
bric
ated
Met
alPr
oduc
ts0.
2812
0.17
120
.39
0.62
10.
474
382
Mac
hine
ry,e
xcep
tEle
ctri
cal
0.18
250.
21
21.7
80.
485
0.90
838
3E
lect
rica
lMac
hine
ry0.
2133
0.18
119
.53
0.56
80.
473
384
Tran
spor
tEqu
ipm
ent
0.25
480.
181
19.6
30.
456
0.53
538
5Pr
ofes
sion
alan
dSc
ient
ific
Equ
ipm
ent
0.15
110.
211
18.3
40.
401
0.62
939
0O
ther
Man
ufac
ture
dPr
oduc
ts0.
1882
0.2
114
.54
0.39
70.
137
Cor
rela
tion
with
Ext
erna
lFin
anci
alD
epen
denc
e19
80s
0.00
960.
0750
0.45
70-0
.284
30.
0898
0.50
49