research papers iucrj serial crystallography...
TRANSCRIPT

research papers
IUCrJ (2014). 1, 87–94 doi:10.1107/S2052252513033939 87
IUCrJISSN 2052-2525
BIOLOGYjMEDICINE
Received 7 November 2013
Accepted 16 December 2013
Edited by J. L. Smith, University of Michigan,
USA
‡ These authors contributed equally to this
study.
Keywords: protein microcrystallography; serial
crystallography; in vivo grown microcrystals
PDB reference: cathepsin B, 4n4z
Supporting information: this article has
supporting information at www.iucrj.org
Serial crystallography on in vivo grownmicrocrystals using synchrotron radiation
Cornelius Gati,a‡ Gleb Bourenkov,b‡ Marco Klinge,c Dirk Rehders,c Francesco
Stellato,a Dominik Oberthur,a,d Oleksandr Yefanov,a Benjamin P. Sommer,d,e
Stefan Mogk,e Michael Duszenko,e Christian Betzel,d Thomas R. Schneider,b*
Henry N. Chapmana,f* and Lars Redeckec*
aCenter for Free-Electron Laser Science (CFEL), Deutsches Elektronensynchrotron (DESY), Notkestrasse 85,
22607 Hamburg, Germany, bEuropean Molecular Biology Laboratory (EMBL), Hamburg Outstation, Notkestrasse 85,
22607 Hamburg, Germany, cJoint Laboratory for Structural Biology of Infection and Inflammation, Institute of
Biochemistry and Molecular Biology, University of Hamburg, and Institute of Biochemistry, University of Lubeck,
Notkestrasse 85, 22607 Hamburg, Germany, dInstitute of Biochemistry and Molecular Biology, University of Hamburg,
Notkestrasse 85, 22607 Hamburg, Germany, eInterfaculty Institute of Biochemistry, University of Tubingen,
Hoppe-Seyler-Strasse 4, 72076 Tubingen, Germany, and fInstitute of Experimental Physics, University of Hamburg,
Luruper Chaussee 149, 22761 Hamburg, Germany. *Correspondence e-mail: [email protected],
[email protected], [email protected]
Crystal structure determinations of biological macromolecules are limited by
the availability of sufficiently sized crystals and by the fact that crystal quality
deteriorates during data collection owing to radiation damage. Exploiting a
micrometre-sized X-ray beam, high-precision diffractometry and shutterless
data acquisition with a pixel-array detector, a strategy for collecting data from
many micrometre-sized crystals presented to an X-ray beam in a vitrified
suspension is demonstrated. By combining diffraction data from 80 Trypano-
soma brucei procathepsin B crystals with an average volume of 9 mm3, a
complete data set to 3.0 A resolution has been assembled. The data allowed the
refinement of a structural model that is consistent with that previously obtained
using free-electron laser radiation, providing mutual validation. Further
improvements of the serial synchrotron crystallography technique and its
combination with serial femtosecond crystallography are discussed that may
allow the determination of high-resolution structures of micrometre-sized
crystals.
1. Introduction
Macromolecular crystallography (MX) is a powerful method
for obtaining structural information about biological macro-
molecules and their assemblies. Since the 1990s, advanced
third-generation synchrotrons have been used to produce
micrometre-sized high-flux X-ray beams whose focus size
matches the size of small crystals (Cusack et al., 1998; Riekel et
al., 2005; Evans et al., 2011; Smith et al., 2012). X-ray beams
with dimensions of less than 10 mm are now in routine use at
many synchrotron-radiation facilities (Evans et al., 2011) and
enable the determination of crystal structures from crystals
with volumes of less than 1000 mm3 (Cusack et al., 1998). Using
these microbeams, the structures of the cypovirus polyhedra
protein (Coulibaly et al., 2007), amyloid-like fibres (Nelson et
al., 2005) and a number of complexes addressing the structure
and function of G-protein-coupled receptors (GPCRs;
Cherezov et al., 2007; Rasmussen et al., 2007, 2011) have been
determined from micrometre-sized crystals.

Inelastic and absorption events deposit energy in the
crystal, triggering a variety of chemical reactions that lead to
a repositioning of atoms (during the experiment), ultimately
reducing the crystalline order and corresponding to increasing
levels of ‘radiation damage’. As a consequence, even under
cryogenic conditions, the quality of the diffraction data, in
particular those at high resolution, quickly deteriorates as a
function of the X-ray dose applied to the crystal. Since the
earliest days of macromolecular crystallography, this problem
has been addressed by combining partial data sets collected
from multiple crystals into a full data set to high resolution.
In the 1990s cryogenic cooling became routine in macro-
molecular crystallography (Henderson, 1990; Garman &
Schneider, 1997), extending the lifetime of individual crystals,
but with the implementation of undulator beamlines on third-
generation synchrotrons the tolerable X-ray dose could be
deposited in a short time even for cryocooled crystals (Ravelli
& Garman, 2006). Data-collection schemes employing
multiple positions on a single crystal (Riekel et al., 2005), to
distribute the delivered dose over the entire crystal, or partial
data sets from multiple crystals (Brodersen et al., 2003) were
developed. The main complication with multicrystal methods
is that systematic differences between data measured on
different crystals, or at different positions on a single crystal,
can prevent the derivation of a consistent assembled data set.
Nevertheless, Hendrickson and coworkers (Liu et al., 2012)
have recently shown that by removing sources of experimental
error and by carefully selecting consistent partial data sets for
merging, data sets of sufficient accuracy for phasing using the
anomalous signal from S atoms in native proteins can in fact
be assembled. Systematic errors in data collections from
multiple positions in the same crystal can, amongst other
techniques, be reduced by ‘helical scan’ procedures (Flot et al.,
2010), in which a single crystal, usually needle-shaped, is
continuously moved during data collection to expose fresh
parts of the same crystal.
When working with small crystals, it is often not possible to
locate the crystals accurately using optical microscopy owing
to their small size, optical distortions caused by materials
surrounding the crystal, or the crystal being embedded in an
opaque matrix. All of these problems are present during the
data collection of GPCR crystals grown from lipidic cubic
phase (LCP). Cherezov et al. (2009) described a method in
which the mounted LCP containing crystals is first system-
atically rastered using a small beam to test each position for
diffraction. Data are then collected in a second step using the
rotation method (Arndt & Wonacott, 1977) from positions
where diffraction was actually detected. The application of
this method has been crucial in the structure determination of
GPCRs, where the crystals are small (of the order of 25 � 6 �
4 mm3) and invisible to optical light because the lipidic
mesophase in which the crystals grow turns opaque upon
cryogenic cooling. Recently, an alternative procedure was
proposed in which radiographs are taken of the entire sample
mount to localize crystals (Warren et al., 2013).
Extremely short pulses of X-rays, each of tens of femto-
seconds duration or even shorter, generated by a free-electron
laser (FEL), have recently been shown to overcome the dose
limitations mentioned above. Referred to as ‘diffraction
before destruction’, the inertia of the atoms prevents signifi-
cant atomic displacement during the short exposing pulse
(Neutze et al., 2000; Boutet et al., 2012; Barty et al., 2012), even
though the initial photoabsorption eventually leads to plasma
formation and the complete vaporization of the sample. A
typical serial femtosecond crystallography (SFX) experiment
collects tens or hundreds of thousands of single-crystal X-ray
diffraction ‘snapshots’ from a liquid suspension of protein
microcrystals that flows across the focused X-ray beam at
room temperature (Chapman et al., 2011). Since each FEL
pulse destroys the sample, only one diffraction pattern can
be collected per crystal. New data-processing tools, such as
Cheetah, CrystFEL (White et al., 2012, 2013; Kirian et al., 2011)
and cctbx.xfel (Kern et al., 2013), have been developed to
process these large data volumes and have been successfully
applied to several examples (Chapman et al., 2011; Boutet et
al., 2012; Redecke et al., 2013; Kern et al., 2013).
The crystal structure of Trypanosoma brucei procathepsin
B (TbCatB) in complex with its native propeptide represents
the first novel bioinformation obtained by applying the SFX
approach at a free-electron laser (Redecke et al., 2013). This
enzyme is of scientific and medical interest, since the knockout
of its encoding gene has been shown to be lethal to the
parasite that causes sleeping sickness in Africa (Abdullah
et al., 2008; Bryant et al., 2009), which turns TbCatB into an
urgently required potential new drug target (Fairlamb, 2003).
TbCatB crystals grew spontaneously within living baculovirus-
infected insect cells during protein overexpression to a size of
10–15 mm in the longest dimension (Koopmann et al., 2012). In
a recent experiment (Redecke et al., 2013), these crystals were
used to obtain 178 875 single-crystal diffraction patterns by
SFX at LCLS, which enabled structure determination of the
enzyme to 2.1 A resolution.
Inspired by the SFX methodology and the new capabilities
to process large data sets, as well as the successful structure
determination of TbCatB in the pro-form using the SFX
approach, we embarked on an experiment to determine the
crystal structure of T. brucei procathepsin B using a suspen-
sion of in vivo grown microcrystals mounted in a standard
nylon loop for crystallographic data collection on a microfocus
synchrotron beamline. Owing to the presence of cell remnants
in the in vivo crystal suspension, individual TbCatB crystals
are difficult to detect in the cryocooled sample. Our procedure
combined elements from SFX with a helical line-scan
approach used in microcrystallography. As with the SFX
approach, an initially unknown subset of the recorded
detector frames contain diffraction signals, which are selected
for further processing into a crystallographic data set. Unlike
the snapshots recorded at an FEL, the sample is rotated
during exposure and multiple exposures from the same crystal
can be obtained and subsequently processed in a consistent
manner. In the following, we describe the diffraction experi-
ment, data processing and structure determination. The
independent determination of the crystal structure of pro-
cathepsin B from T. brucei via two different methods using
research papers
88 Cornelius Gati et al. � Serial crystallography on in vivo grown microcrystals IUCrJ (2014). 1, 87–94
synchrotron and FEL radiation sources provided a unique
opportunity to validate the results obtained against each
other, and we present a comparison of the crystallographic
models.
2. Results
2.1. Sample preparation and data collection
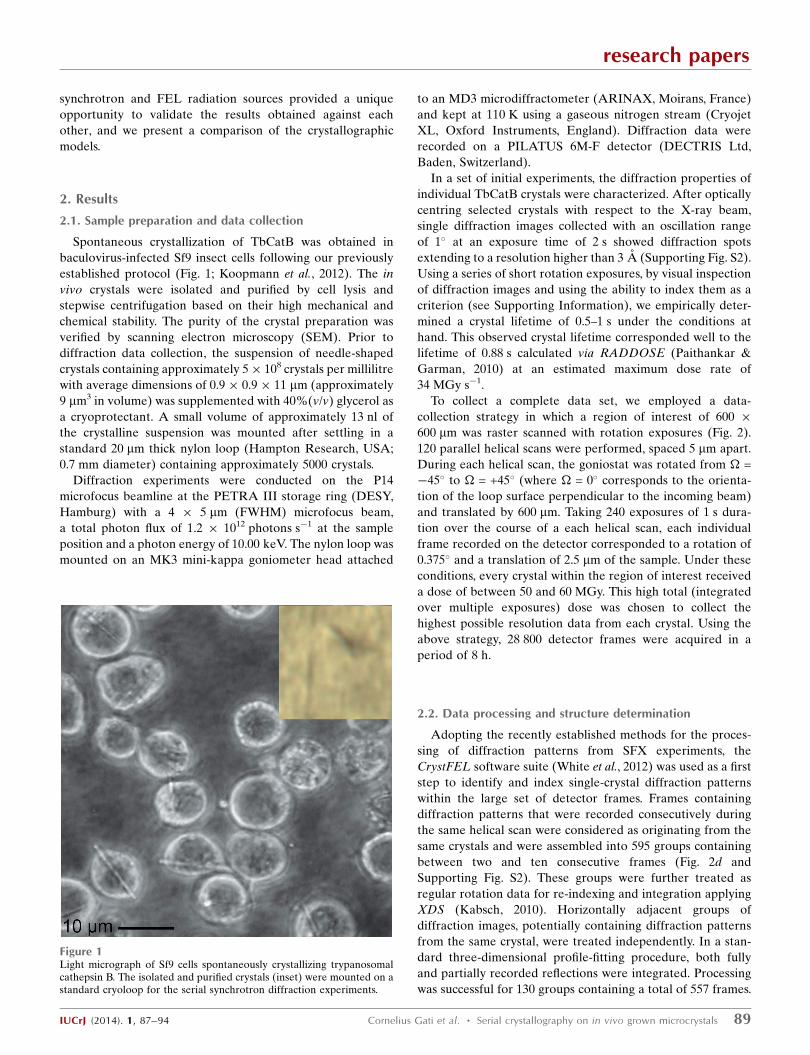
Spontaneous crystallization of TbCatB was obtained in
baculovirus-infected Sf9 insect cells following our previously
established protocol (Fig. 1; Koopmann et al., 2012). The in
vivo crystals were isolated and purified by cell lysis and
stepwise centrifugation based on their high mechanical and
chemical stability. The purity of the crystal preparation was
verified by scanning electron microscopy (SEM). Prior to
diffraction data collection, the suspension of needle-shaped
crystals containing approximately 5� 108 crystals per millilitre
with average dimensions of 0.9 � 0.9 � 11 mm (approximately
9 mm3 in volume) was supplemented with 40%(v/v) glycerol as
a cryoprotectant. A small volume of approximately 13 nl of
the crystalline suspension was mounted after settling in a
standard 20 mm thick nylon loop (Hampton Research, USA;
0.7 mm diameter) containing approximately 5000 crystals.
Diffraction experiments were conducted on the P14
microfocus beamline at the PETRA III storage ring (DESY,
Hamburg) with a 4 � 5 mm (FWHM) microfocus beam,
a total photon flux of 1.2 � 1012 photons s�1 at the sample
position and a photon energy of 10.00 keV. The nylon loop was
mounted on an MK3 mini-kappa goniometer head attached
to an MD3 microdiffractometer (ARINAX, Moirans, France)
and kept at 110 K using a gaseous nitrogen stream (Cryojet
XL, Oxford Instruments, England). Diffraction data were
recorded on a PILATUS 6M-F detector (DECTRIS Ltd,
Baden, Switzerland).
In a set of initial experiments, the diffraction properties of
individual TbCatB crystals were characterized. After optically
centring selected crystals with respect to the X-ray beam,
single diffraction images collected with an oscillation range
of 1� at an exposure time of 2 s showed diffraction spots
extending to a resolution higher than 3 A (Supporting Fig. S2).
Using a series of short rotation exposures, by visual inspection
of diffraction images and using the ability to index them as a
criterion (see Supporting Information), we empirically deter-
mined a crystal lifetime of 0.5–1 s under the conditions at
hand. This observed crystal lifetime corresponded well to the
lifetime of 0.88 s calculated via RADDOSE (Paithankar &
Garman, 2010) at an estimated maximum dose rate of
34 MGy s�1.
To collect a complete data set, we employed a data-
collection strategy in which a region of interest of 600 �
600 mm was raster scanned with rotation exposures (Fig. 2).
120 parallel helical scans were performed, spaced 5 mm apart.
During each helical scan, the goniostat was rotated from � =
�45� to � = +45� (where � = 0� corresponds to the orienta-
tion of the loop surface perpendicular to the incoming beam)
and translated by 600 mm. Taking 240 exposures of 1 s dura-
tion over the course of a each helical scan, each individual
frame recorded on the detector corresponded to a rotation of
0.375� and a translation of 2.5 mm of the sample. Under these
conditions, every crystal within the region of interest received
a dose of between 50 and 60 MGy. This high total (integrated
over multiple exposures) dose was chosen to collect the
highest possible resolution data from each crystal. Using the
above strategy, 28 800 detector frames were acquired in a
period of 8 h.
2.2. Data processing and structure determination
Adopting the recently established methods for the proces-
sing of diffraction patterns from SFX experiments, the
CrystFEL software suite (White et al., 2012) was used as a first
step to identify and index single-crystal diffraction patterns
within the large set of detector frames. Frames containing
diffraction patterns that were recorded consecutively during
the same helical scan were considered as originating from the
same crystals and were assembled into 595 groups containing
between two and ten consecutive frames (Fig. 2d and
Supporting Fig. S2). These groups were further treated as
regular rotation data for re-indexing and integration applying
XDS (Kabsch, 2010). Horizontally adjacent groups of
diffraction images, potentially containing diffraction patterns
from the same crystal, were treated independently. In a stan-
dard three-dimensional profile-fitting procedure, both fully
and partially recorded reflections were integrated. Processing
was successful for 130 groups containing a total of 557 frames.
research papers
IUCrJ (2014). 1, 87–94 Cornelius Gati et al. � Serial crystallography on in vivo grown microcrystals 89
Figure 1Light micrograph of Sf9 cells spontaneously crystallizing trypanosomalcathepsin B. The isolated and purified crystals (inset) were mounted on astandard cryoloop for the serial synchrotron diffraction experiments.

After iterative merging and scaling, 109 661 reflection
intensities in the resolution range from 88 to 3.0 A were
merged into a final data set consisting of 8881 merged
reflection intensities with an overall completeness of 99.8%.
This final set of reflection intensities included data from
426 diffraction patterns collected from 80 individual TbCatB
research papers
90 Cornelius Gati et al. � Serial crystallography on in vivo grown microcrystals IUCrJ (2014). 1, 87–94
Figure 2Experimental setup of the serial synchrotron crystallography experiment. (a) Schematic macroscopic illustration of the serial helical line-scan approachusing a standard cryogenic loop, imaged with the inline microscope. (b) SEM image of isolated in vivo grown cathepsin B microcrystals on a siliconsupport. Red arrows illustrate the serial helical line scan. The incident beam is represented by the red ‘flare’. The colour density in the flare isproportional to a calculated two-dimensional Gaussian function with FWHM 4 � 5 mm, with relative size to the 10 mm scale bar, showing a significantfraction of photon flux away from the centre of the beam. Red dots illustrate the positions of collected frames during the line scan with an oscillationwidth of 0.5� each. The graph (lower part) visualizes the delivered dose per area against arbitrary coordinates, indicating a total dose per area fluctuatingbetween 50 and 60% owing to the ratio of FWHM of the beam and the gap between each line-scan position. (c) After the serial helical line scan, thephotoinduced ionization at the exposed part of the sample is macroscopically visible. (d) Heatmap of diffraction images in the crystal loop after pre-selection using CrystFEL. The colour bar codes the average intensity of Bragg peaks in each diffraction pattern as an indication of the diffractionstrength in each pattern.
crystals in 120 groups. The distribution of the size of the
groups (Supporting Fig. S2) apparently reflects the variation
in the crystal size in TbCatB preparations (see Fig. S1 of
Redecke et al., 2013). Most of the data were derived from
groups of three to five consecutive frames corresponding to a
total rotation range of 1.125–1.875� of one crystal. A small
research papers
IUCrJ (2014). 1, 87–94 Cornelius Gati et al. � Serial crystallography on in vivo grown microcrystals 91
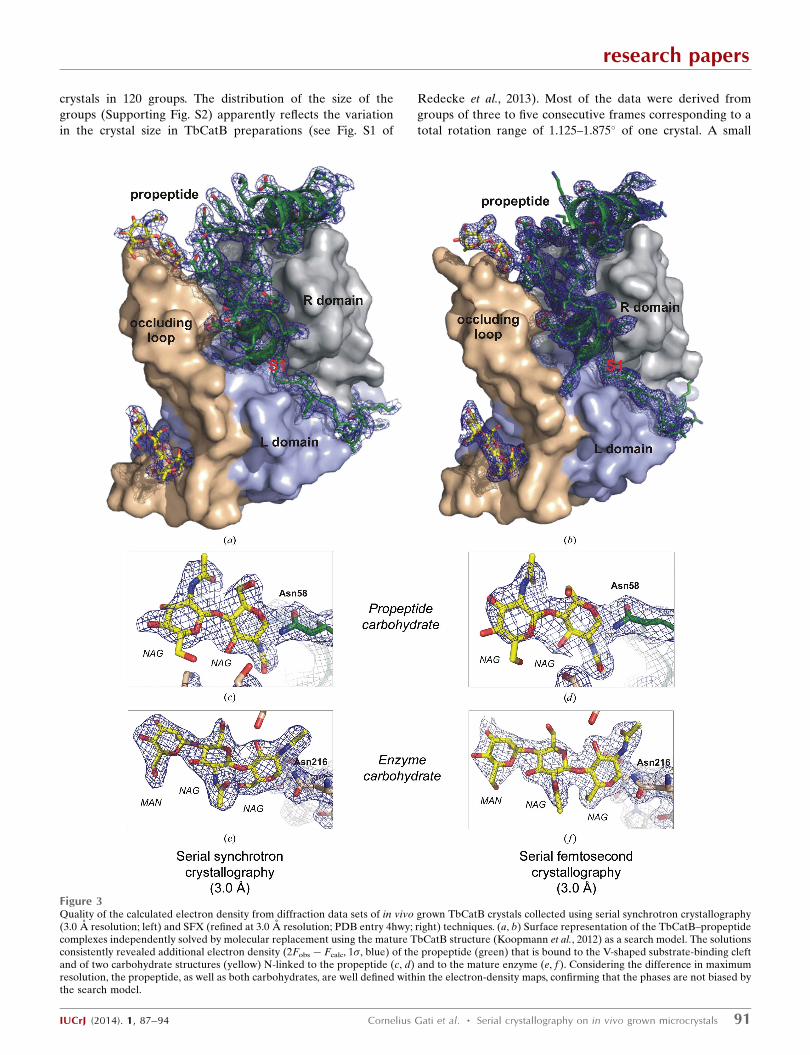
Figure 3Quality of the calculated electron density from diffraction data sets of in vivo grown TbCatB crystals collected using serial synchrotron crystallography(3.0 A resolution; left) and SFX (refined at 3.0 A resolution; PDB entry 4hwy; right) techniques. (a, b) Surface representation of the TbCatB–propeptidecomplexes independently solved by molecular replacement using the mature TbCatB structure (Koopmann et al., 2012) as a search model. The solutionsconsistently revealed additional electron density (2Fobs � Fcalc, 1�, blue) of the propeptide (green) that is bound to the V-shaped substrate-binding cleftand of two carbohydrate structures (yellow) N-linked to the propeptide (c, d) and to the mature enzyme (e, f ). Considering the difference in maximumresolution, the propeptide, as well as both carbohydrates, are well defined within the electron-density maps, confirming that the phases are not biased bythe search model.

fraction of data originated from groups containing eight to ten
frames, while the majority of groups contained three to five
consecutive frames.
The quality and internal consistency of the data were judged
on the basis of standard hI/�(I)i statistics and on the basis
of the CC* criteria recently advocated as a single statistically
valid guide for deciding the resolution cutoff of the obtained
data (McCoy et al., 2007; Karplus & Diederichs, 2012; Evans,
2012). The CC* calculated in resolution shells for the TbCatB
data set (Supporting Fig. S1) indicated the presence of
statistically significant data to a resolution of 3.0 A and below.
Following the same strategy as for the previous determi-
nation of the T. brucei pro-cathespsin B crystal structure via
SFX (Redecke et al., 2013), initial phases were obtained by
molecular replacement with Phaser (McCoy et al., 2007) using
the structure of the nonglycosylated and in vitro crystallized
TbCatB (PDB entry 3mor; Koopmann et al., 2012) that lacks
the propeptide and the carbohydrate chains as a search model.
During stepwise model building and refinement, 62 propep-
tide residues and five carbohydrate residues were manually
placed in difference electron-density maps.
The refined TbCatB structure (R factor = 22.3%, Rfree =
26.4%) shares the papain-like fold which is characteristic of
cathepsin B enzymes, including the propeptide residues 27–72
and 79–85 without defined electron density in between, as well
as a carbohydrate chain consisting of two N-acetylglucosamine
(NAG) monomers N-linked to Asn58 (in the propeptide) and
another carbohydrate chain consisting of two NAG monomers
and one �-mannose (BMA) molecule N-linked to Asn216 of
the enzyme domain. Overall, the 3.0 A resolution electron-
density map is well defined by the TbCatB model. No electron
density is observed for nine flexible amino-acid side chains
mainly located within a loop region spanning residues His195–
Asn209 or for ten atoms of the carbohydrate structures.
In particular, as for the SFX structure determination, the
expected features of the electron-density map that were not
part of the search model are well defined by the propeptide
and two carbohydrate chains after manual model building and
refinement (Fig. 3).
2.3. Comparison of the structural TbCatB models
For detailed comparison of the T. brucei procathepsin B
structure solved in this study at 110 K using synchrotron
radiation with that previously obtained at room temperature
using the FEL-based SFX technique (PDB entry 4hwy;
Redecke et al., 2013), electron-density maps were generated
using the SFX data truncated at 3.0 A resolution. Applying
an identical refinement protocol that omits solvent atoms
resulted in an R factor of 17.0% (Rfree = 19.6%). A slight
shrinking of the unit-cell parameters of the TbCatB in vivo
crystals observed for the synchrotron data set (Table 1) can
be attributed to the cryogenic data-collection conditions. At
room temperature, unit-cell parameters of a = b = 125.5,
c = 54.6 A were previously obtained by SFX. The super-
position of the peptide backbone atoms of both structures
revealed a high degree of consistency, resulting in an average
r.m.s.d. value of 0.35 � 0.19 A, which is comparable to the
overall coordinate error of 0.32 A estimated based on
maximum likelihood by REFMAC5.5 (Murshudov et al.,
2011). No significant structural differences are present,
including no major features related to radiation damage
(Supporting Fig. S3). Main-chain deviations of more than
0.8 A are limited to nine residues located at the N-terminus
and C-terminus, in flexible loop regions and at positions
flanking the disordered part of the propeptide region that
results from an increased flexibility of the residues after
proteolytic cleavage between Ser78 and Ile79 (Redecke et al.,
2013). Even the two carbohydrate chains are clearly defined
and largely superimposable between the two models (Figs. 3c–
3f). Slight differences were only observed for the second
N-acetylglucosamine residue of the propeptide carbohydrate,
which represents the most flexible carbohydrate within the
model. This is further reflected by the almost identical number
of amino-acid side chains/carbohydrate atoms not defined by
electron density in both TbCatB structures (nine side chains
and ten carbohydrate atoms in this structure versus 11 side
chains and eight carbohydrate atoms in the SFX structure).
Despite the overall similarity in atomic coordinates,
systematic differences were observed in the relative heights of
the electron-density peaks at the 12 Cys SG atoms involved in
disulfide bridges. Considering refined Debye–Waller factors as
an (anticorrelated) measure of the height of electron-density
maxima, we note that in the synchrotron structure the average
research papers
92 Cornelius Gati et al. � Serial crystallography on in vivo grown microcrystals IUCrJ (2014). 1, 87–94
Table 1X-ray data-collection and refinement statistics for in vivo crystallizedTbCatB analyzed at the P14 beamline of the PETRA III synchrotronsource (DESY, Hamburg, Germany).
Values in parentheses are for the highest resolution shell.
Data collectionLight source, beamline PETRA III, P14Maximum dose (MGy) 50–60Space group P42212Unit-cell parameters (A) a = b = 123.5, c = 54.3VM (A3 Da�1) 2.99Solvent content (%) 58.6Resolution range (A) 88.1–3.0 (3.16–3.00)No. of unique reflections 8881Completeness (%) 99.8 (99.9)Rmerge 0.71 (2.69)hI/�(I)i 3.7 (1.0)CC* 0.97 (0.79)Multiplicity 12.3 (12.6)
RefinementResolution range (A) 88.1–3.0No. of reflections used in refinement 8482No. of reflections used for Rfree 399Rwork/Rfree 0.223/0.264No. of atoms
Protein 2392Carbohydrate 67
B factors (A2)Protein (main chain/side chain) 38/43Carbohydrate 54
R.m.s. deviationsBond lengths (A) 0.01Bond angles (�) 1.32
Average r.m.s. B factor (main/side chain) 1.6/1.8Ramachandran plot (%)
Most favoured 91.2Allowed 8.2Disallowed 0.66
Debye–Waller factor (hBSGi = 57 A2) is higher than that
averaged over all atoms (hBAlli = 41 A2). In the SFX TbCatB
structure refined using an identical protocol at 3.0 A resolu-
tion, hBSGi (38 A2) is lower than hBAlli (45 A2). This obser-
vation is consistent with a significant diffraction contribution
from reduced disulfide bonds in the synchrotron data but not
in the SFX data.
3. Discussions and conclusions
Particularly for crystals with dimensions in the low micometre
range, the determination of macromolecular crystal structures
is inherently limited by radiation damage. In most cases, when
an X-ray flux sufficient to measure Bragg reflections to the
highest resolution as defined by the degree of crystalline order
in a given crystal is used, the crystal will be severely damaged
before complete diffraction data can be collected. As a
consequence, in practice a compromise is sought balancing the
resolution and the completeness of the data to be measured on
a single crystal. In recent years, combining data from multiple
crystals has enabled the determination of a number of
important structures (Rasmussen et al., 2011; Siu et al., 2013; Li
et al., 2013), despite the difficulties arising from systematic
errors when data from multiple crystals are merged. The
recent introduction of SFX exploiting X-rays from an FEL to
collect single diffraction images to the maximum resolution
from large numbers of crystals in the ‘diffraction-before-
destruction’ regime has realised an extreme approach to
overcoming the radiation-damage problem.
Here, we have demonstrated a strategy for the collection of
complete diffraction data close to the diffraction limit from
micrometre-sized crystals using synchrotron radiation. This
method is based on the serial illumination of subvolumes of
a sample consisting of a cryogenically vitrified suspension of
microcrystals mounted in a standard nylon loop. During
exposure, the sample is rotated, resulting in ‘classical’ rotation
frames (Arndt & Wonacott, 1977) for subvolumes presenting
crystalline material to the X-ray beam. The X-ray dose
received by an exposed subvolume is chosen to fully exploit
the crystal lifetime during the exposure time used, a require-
ment to achieve maximum resolution under these conditions.
The combination of microcrystals assuming quasi-random
orientations in the suspension and continuous rotation of the
loop during each helical scan will present a variety of different
crystal orientations to the beam, effectively covering the
rotation space and thus providing complete diffraction data in
the end.
The crystals used in this study are smaller in volume (�107
unit cells in a crystal of volume 9 mm3) than those of cypovirus
polyhedra (CPV) studied by Metcalf and coworkers (Couli-
baly et al., 2007; �108 unit cells in 125 mm3). In addition, the
TbCatB crystals are embedded in a matrix giving rise to a high
scattering background, similar to the situation of GPCR
crystals mounted in LCP, where the crystals are commonly
of larger volume (�109 unit cells in 600 mm3; Cherezov et al.,
2007). While systematic strategies collecting diffraction data
on individually pre-centred crystals were employed for both
the CPV and GPCR cases, the serial strategy suggested here
has delivered data of comparable quality in terms of signal to
noise of the measured diffraction intensities without the need
to identify and centre micrometre-sized crystals before data
collection (see Supporting Information).
The serial synchrotron-radiation diffraction data allowed
us to phase and refine the TbCatB structure using standard
technologies. With respect to the data set collected from
TbCatB using FEL radiation, the data collected at the
synchrotron extend to lower resolution, reflecting the differ-
ence between measuring radiation-damage-free ‘infinitesi-
mally still’ data with femtosecond laser pulses and a
macroscopic rotation of the crystal over 0.375�, with a similar
dose in both cases. Additionally, different levels of back-
ground influence the data quality. While a liquid jet of
approximately 4 mm diameter delivered the sample for SFX, a
20 mm nylon loop suspending a film of 20 mm thickness was
used to mount the crystals in this study. The structural model
built against the synchrotron data is consistent with the model
obtained with FEL radiation, providing mutual validation.
The present implementation of the serial synchrotron
strategy can be improved in many ways. The embedding of the
TbCatB crystals with a maximum dimension of approximately
10 mm in a vitrified matrix of approximately 20 mm thickness
consisting of buffer and cell debris causes significant back-
ground scatter that could be minimized by employing different
mounting technologies, such as adaptations of cryo-EM
techniques (Nederlof et al., 2013) or graphene supports
(Wierman et al., 2013). Reducing the beam size to 1 � 1 mm
will reduce the background scattering 20-fold. Increasing the
flux density of the X-ray beam will reduce the data-collection
time, which is currently several hours for a single loop-
mounted drop of crystalline suspension. This can be accom-
plished using improved X-ray optics and the implementation
of wide-bandpass monochromators. Merging data collected on
multiple loops would increase the signal-to-noise ratio, while
decreasing the rotation increment per X-ray dose unit could
increase the resolution to which diffraction data can be
recorded closer to the limit posed by the degree of order in the
crystal.
The method presented here is conceptually simple and
could be implemented at many microfocus synchrotron-
radiation beamlines employing existing helical scan schemes.
It lends itself to data collection on small crystals in suspension,
such as those obtained from in vivo preparations, as it avoids
the centring of hardly visible (or invisible) crystals. Parameters
can be tuned to maximize accuracy (e.g. applying a larger
rotation range per exposed subvolume may allow more
accurate integration and scaling) or to maximize resolution
(by using a smaller rotation range during the application of the
tolerable X-ray dose).
In addition to the promising application as a standalone
approach, the combination of serial synchrotron and SFX data
collected for a given crystallized protein further offers a new
strategy for scaling and phasing of SFX data. In comparison to
SFX data collection, serial synchrotron crystallography allows
the extraction of accurate diffraction data, albeit to lower
resolution owing to the finite rotation range and the onset of
research papers
IUCrJ (2014). 1, 87–94 Cornelius Gati et al. � Serial crystallography on in vivo grown microcrystals 93
radiation damage during the exposure, from a small number of
microcrystals by the systematic acquisition of structure-factor
amplitudes followed by the application of well defined scaling
models modelling a finely controlled experimental process.
In contrast, at present, a three orders of magnitude larger
number of microcrystals is required for the convergence of
Monte Carlo intensity integration when arithmetic means of
partially recorded intensities are used without scaling (Kirian
et al., 2011). The use of complete and accurate low-resolution
data sets obtained using synchrotron radiation for boot-
strapping scaling procedures for SFX data could improve the
convergence behaviour of these procedures. If diffraction data
can be collected on the same system using X-rays from both
synchrotron and free-electron laser sources, the combined use
of these data therefore has the potential to provide more
accurate crystallographic data than those originating from
only one of the two methods, ultimately resulting in higher
quality macromolecular structures from micrometre-sized
crystals.
Acknowledgements
The X-ray diffraction experiments were carried out at beam-
line P14 of the PETRA III synchrotron source operated by
the European Molecular Biology Laboratory (EMBL) at
the German Electron Synchrotron (DESY) in Hamburg,
Germany in May and June 2013. We gratefully acknowledge
discussions with Ilme Schlichting, and we thank Thomas White
for help with using CrystFEL. CG acknowledges support from
the PIER Graduate School, Helmholtz Association Scholar-
ship. LR, MK, DR and CB thank the German Federal
Ministry for Education and Research (BMBF) for funding
(grants 01KX0806 and 01KX0807). BPS, DO, LR, MD, CB and
HNC acknowledge support from the BMBF in the context of
the Rontgen-Angstrom-Cluster (grant 05K12GU3). Support
from the Hamburg Ministry of Science and Research and
Joachim Herz Stiftung as part of the Hamburg Initiative for
Excellence in Research (LEXI) and the Hamburg School for
Structure and Dynamics (SDI) as well as the DFG Cluster of
Excellence ‘Inflammation at Interfaces’ (EXC 306) is grate-
fully acknowledged.
References
Abdullah, M. H., O’Brien, T., Mackey, Z. B., Sajid, M., Grab, D. J. &McKerrow, J. H. (2008). PLoS Negl. Trop. Dis. 2, 298–304.
Arndt, U. M. & Wonacott, A. J. (1977). The Rotation Method inCrystallography. Amsterdam: North Holland.
Barty, A. et al. (2012). Nature Photonics, 6, 35–40.Boutet, S. et al. (2012). Science, 20, 362–364.Brodersen, D. E., Clemons, W. M., Carter, A. P., Wimberly, B. T. &
Ramakrishnan, V. (2003). Acta Cryst. D59, 2044–2050.Bryant, C., Kerr, I. D., Debnath, M., Ang, K. K. H., Ratnam, J.,
Ferreira, R. S., Jaishankar, P., Zhao, D., Arkin, M. R., McKerrow,J. H., Brinen, L. S. & Renslo, A. R. (2009). Bioorg. Med. Chem.Lett. 19, 6218–6221.
Chapman, H. N. et al. (2011). Nature (London), 470, 73–77.Cherezov, V., Hanson, M. A., Griffith, M. T., Hilgart, M. C., Sanishvili,
R., Nagarajan, V., Stepanov, S., Fischetti, R. F., Kuhn, P. & Stevens,R. C. (2009). J. R. Soc. Interface, 6, S587–S597.
Cherezov, V., Rosenbaum, D. M., Hanson, M. A., Rasmussen, S. G. F.,Thian, F. S., Kobilka, T. S., Choi, H.-J., Kuhn, P., Weis, W. I.,Kobilka, B. K. & Stevens, R. C. (2007). Science, 318, 1258–1265.
Coulibaly, F., Chiu, E., Ikeda, K., Gutmann, S., Haebel, P. W., Schulze-Briese, C., Mori, H. & Metcalf, P. (2007). Nature (London), 446,97–101.
Cusack, S., Belrhali, H., Bram, A., Burghammer, M., Perrakis, A. &Riekel, C. (1998). Nature Struct. Biol. 5, 634–637.
Evans, G., Axford, D., Waterman, D. & Owen, R. L. (2011).Crystallogr. Rev. 17, 105–142.
Evans, P. (2012). Science, 336, 986–987.Fairlamb, A. H. (2003). Trends Parasitol. 19, 488–494.Flot, D., Mairs, T., Giraud, T., Guijarro, M., Lesourd, M., Rey, V., van
Brussel, D., Morawe, C., Borel, C., Hignette, O., Chavanne, J.,Nurizzo, D., McSweeney, S. & Mitchell, E. (2010). J. SynchrotronRad. 17, 107–118.
Garman, E. F. & Schneider, T. R. (1997). J. Appl. Cryst. 30, 211–237.
Henderson, R. (1990). Proc. R. Soc. London Ser. B, 241, 6–8.Kabsch, W. (2010). Acta Cryst. D66, 125–132.Karplus, P. A. & Diederichs, K. (2012). Science, 25, 1030–1033.Kern, J. et al. (2013). Science, 26, 491–495.Kirian, R. A., White, T. A., Holton, J. M., Chapman, H. N., Fromme,
P., Barty, A., Lomb, L., Aquila, A., Maia, F. R. N. C., Martin, A. V.,Fromme, R., Wang, X., Hunter, M. S., Schmidt, K. E. & Spence,J. C. H. (2011). Acta Cryst. A67, 131–140.
Koopmann, R. et al. (2012). Nature Methods, 9, 259–262.Li, D., Lyons, J. A., Pye, V. E., Vogeley, L., Aragao, D., Kenyon, C. P.,
Shah, S. T., Doherty, C., Aherne, M. & Caffrey, M. (2013). Nature(London), 497, 521–524.
Liu, Q., Dahmane, T., Zhang, Z., Assur, Z., Brasch, J., Shapiro, L.,Mancia, F. & Hendrickson, W. A. (2012). Science, 336, 1033–1037.
McCoy, A. J., Grosse-Kunstleve, R. W., Adams, P. D., Winn, M. D.,Storoni, L. C. & Read, R. J. (2007). J. Appl. Cryst. 40, 658–674.
Murshudov, G. N., Skubak, P., Lebedev, A. A., Pannu, N. S., Steiner,R. A., Nicholls, R. A., Winn, M. D., Long, F. & Vagin, A. A. (2011).Acta Cryst. D67, 355–367.
Nederlof, I., Li, Y. W., van Heel, M. & Abrahams, J. P. (2013). ActaCryst. D69, 852–859.
Nelson, R., Sawaya, M. R., Balbirnie, M., Madsen, A. Ø., Riekel, C.,Grothe, R. & Eisenberg, D. (2005). Nature (London), 435, 773–778.
Neutze, R., Wouts, R., van der Spoel, D., Weckert, E. & Hajdu, J.(2000). Nature (London), 406, 752–757.
Paithankar, K. S. & Garman, E. F. (2010). Acta Cryst. D66, 381–388.Rasmussen, S. G. F., Choi, H.-J., Rosenbaum, D. M., Kobilka, T. S.,
Thian, F. S., Edwards, P. C., Burghammer, M., Ratnala, V. R.,Sanishvili, R., Fischetti, R. F., Schertler, G. F., Weis, W. I. & Kobilka,B. K. (2007). Nature (London), 450, 383–387.
Rasmussen, S. G. F. et al. (2011). Nature (London), 477, 549–555.Ravelli, R. B. G. & Garman, E. F. (2006). Curr. Opin. Struct. Biol. 16,
624–629.Redecke, L. et al. (2013). Science, 339, 227–230.Riekel, C., Burghammer, M. & Schertler, G. (2005). Curr. Opin.
Struct. Biol. 15, 556–562.Siu, F. Y. et al. (2013). Nature (London), 499, 444–449.Smith, J. L., Fischetti, R. F. & Yamamoto, M. (2012). Curr. Opin.
Struct. Biol. 22, 602–612.Warren, A. J., Armour, W., Axford, D., Basham, M., Connolley, T.,
Hall, D. R., Horrell, S., McAuley, K. E., Mykhaylyk, V., Wagner, A.& Evans, G. (2013). Acta Cryst. D69, 1252–1259.
White, T. A., Barty, A., Stellato, F., Holton, J. M., Kirian, R. A.,Zatsepin, N. A. & Chapman, H. N. (2013). Acta Cryst. D69, 1231–1240.
White, T. A., Kirian, R. A., Martin, A. V., Aquila, A., Nass, K., Barty,A. & Chapman, H. N. (2012). J. Appl. Cryst. 45, 335–341.
Wierman, J. L., Alden, J. S., Kim, C. U., McEuen, P. L. & Gruner, S. M.(2013). J. Appl. Cryst. 46, 1501–1507.
research papers
94 Cornelius Gati et al. � Serial crystallography on in vivo grown microcrystals IUCrJ (2014). 1, 87–94