research papers the cmcc global ocean physical rp0211
TRANSCRIPT
Research PapersIssue RP0211December 2013
Divisione ApplicazioniNumeriche e Scenari
The research leading tothese results has
received funding from theItalian Ministry of
Education, University andResearch and the ItalianMinistry of Environment,Land and Sea under the
GEMINA project andfrom the European
Commission Copernicusprogramme, previously
known as GMESprogramme, under the
MyOcean andMyOcean2 projects.
The CMCC Global Ocean PhysicalReanalysis System (C-GLORS)version 3.1: Configuration and basicvalidation
By Andrea StortoJunior Scientist
and Simona MasinaHead of ANS Division
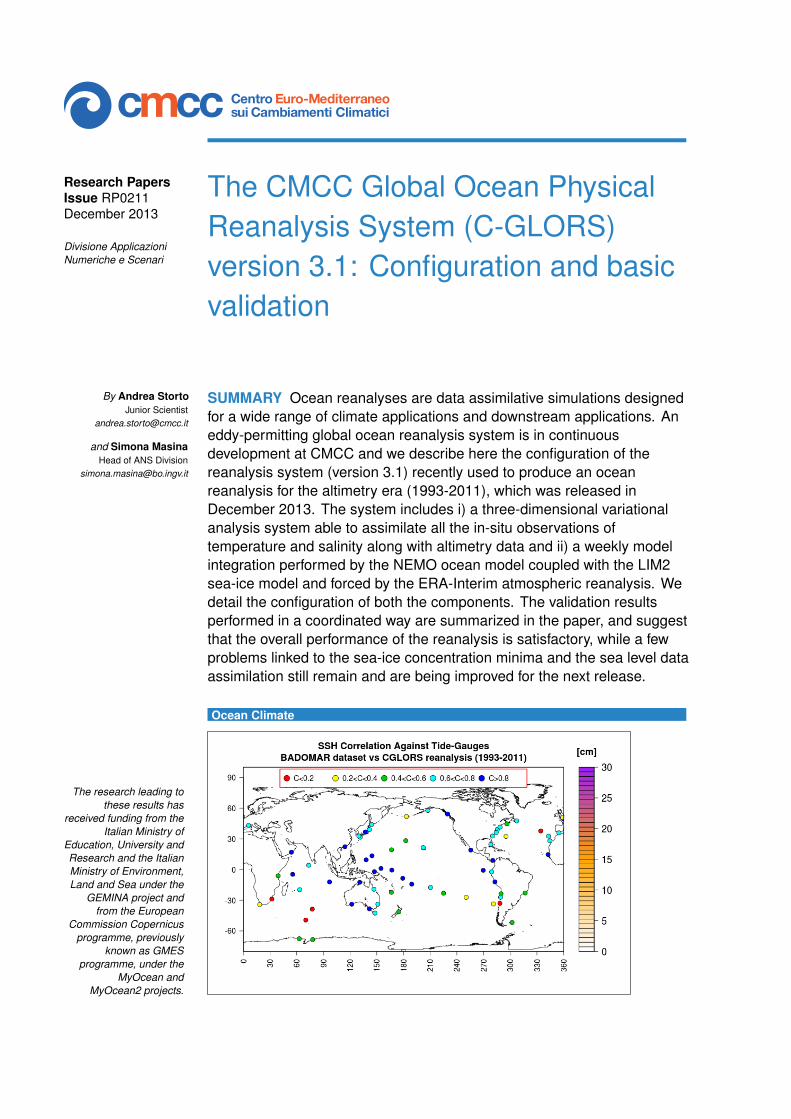
SUMMARY Ocean reanalyses are data assimilative simulations designedfor a wide range of climate applications and downstream applications. Aneddy-permitting global ocean reanalysis system is in continuousdevelopment at CMCC and we describe here the configuration of thereanalysis system (version 3.1) recently used to produce an oceanreanalysis for the altimetry era (1993-2011), which was released inDecember 2013. The system includes i) a three-dimensional variationalanalysis system able to assimilate all the in-situ observations oftemperature and salinity along with altimetry data and ii) a weekly modelintegration performed by the NEMO ocean model coupled with the LIM2sea-ice model and forced by the ERA-Interim atmospheric reanalysis. Wedetail the configuration of both the components. The validation resultsperformed in a coordinated way are summarized in the paper, and suggestthat the overall performance of the reanalysis is satisfactory, while a fewproblems linked to the sea-ice concentration minima and the sea level dataassimilation still remain and are being improved for the next release.
Ocean Climate
02
Cen
tro
Eur
o-M
edite
rran
eosu
iCam
biam
enti
Clim
atic
i
CMCC Research Papers
THE ASSESSMENT OF THE STATE OFTHE OCEAN for the past decades is re-ferred to as ocean reanalysis (or ocean synthe-sis) when observational measurements are op-timally combined with an Ocean General Circu-lation Model (OGCM). Reanalyses have the pri-mary target of evaluating and monitor the oceanvariability, along with several downstream ap-plications (e.g. initial conditions for coupledlong-range predictions, offline bio-geochemicalmodels, assessment of the value of the observ-ing network, etc.). CMCC has devoted manyefforts in the past years to build a state-of-the-art reanalysis system able to run at differentresolutions and to assimilate several observingnetworks. In this paper we review the reanal-ysis system used at eddy-permitting resolutionfor producing ocean reanalyses for the altime-try era. Hereafter we refer to the CMCC globalocean reanalysis system as C-GLORS. [8] ex-tensively reports the validation of C-GLORSv3.1 and the reader is referred to that docu-ment for more details.
CONFIGURATION
C-GLORS consists of a weekly three-dimensional variational analysis (3DVAR), fol-lowed by a 1-week Ocean General CirculationModel (OGCM) integration, which brings theanalysis forward to the next assimilation step.The three-dimensional variational data assimi-lation system is a global implementation [20] ofOceanVar [6]. The OGCM is NEMO [15] in itsORCA025 configuration, coupled with the (Lou-vain La Neuve) sea-ice model [9]. Details of thetwo steps are given below.
THE 3DVAR/FGAT SCHEME
The data assimilation step is used to correctthree-dimensional fields of temperature andsalinity. The analysis is performed every 7
days. Within the 3DVAR scheme, we mini-mize a cost function given by the sum of thedistance between the analysis state, unknown,and a prior knowledge of the state of the ocean(the background) and the distance between theanalysis state and the observations, in observa-tion space, scaled by the background- and ob-servational error covariance matrices, respec-tively. Since the observations are compared tothe background field closer in time to the obser-vations within 2-hourly time slots of the weeklyassimilation time-window, this scheme is usu-ally referred to as 3DVAR/FGAT (First Guessat Appropriate Time). The analysis time iscentered with respect to the assimilation time-window.
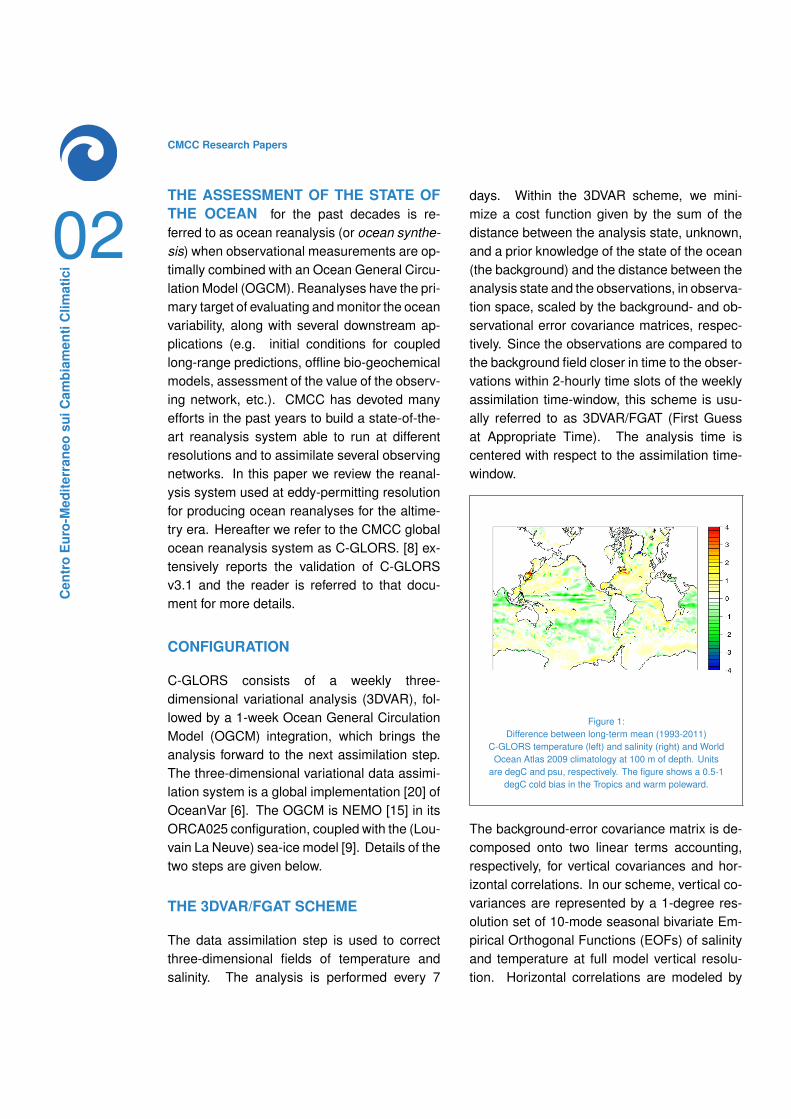
Figure 1:Difference between long-term mean (1993-2011)
C-GLORS temperature (left) and salinity (right) and WorldOcean Atlas 2009 climatology at 100 m of depth. Units
are degC and psu, respectively. The figure shows a 0.5-1degC cold bias in the Tropics and warm poleward.
The background-error covariance matrix is de-composed onto two linear terms accounting,respectively, for vertical covariances and hor-izontal correlations. In our scheme, vertical co-variances are represented by a 1-degree res-olution set of 10-mode seasonal bivariate Em-pirical Orthogonal Functions (EOFs) of salinityand temperature at full model vertical resolu-tion. Horizontal correlations are modeled by
C-GLORS Global Ocean Physical Reanalysis
03
Cen
tro
Eur
o-M
edite
rran
eosu
iCam
biam
enti
Clim
atic
i
means of a four-iteration first-order recursivefilter, with three-dimensional, parameter- anddirection- dependent correlation length-scales.Thus, the problem of defining the background-error covariance matrix simplifies to the three-dimensional definition of the horizontal correla-tion length-scales and a coarse-resolution com-putation of vertical bivariate EOFs. Both thevertical EOFS and the correlation length-scaleswere calculated from the monthly anomalies(with respect to the climatology) of a non-assimilative OGCM run for the reanalysis pe-riod.
In order to impose cyclic condition on the west-ern and eastern boundaries, the global do-main is replaced by an extended domain, withsymmetric extension zones westward of thewestern boundary and eastward of the easternboundary. Within these extension zones, ob-servations are duplicated in order to have veryclose analysis increments at the two bound-aries.
USE OF OBSERVATIONS. The variationaldata assimilation system of C-GLORS as-similates in-situ observations of temperatureand salinity and satellite sea level anoma-lies (SLAs). All the in-situ observations frommoorings, ARGO floats, Expandable Bathy Ter-mographs (XBTs), Conductivity-Temperature-Depth (CTDs) and sea mammals are extractedfrom the CORA 3.4 dataset [3]. These dataare collected, quality-checked and distributedby CORIOLIS. More information on the in-situdata processing is available in [3].
The dataset of sea level anomalies is the AVISOalong-track delayed mode dataset that includesobservations from ERS-1 and -2, Envisat, GFO,Jason-1 and -2 and Topex/Poseidon. Obser-vations are subjected to the usual geophysicalcorrections and multi-satellite cross-calibration[13]. Sea level corrections are covariatedwith vertical profiles of temperature and salin-
ity by means of the dynamic height formula-tion and according to the bivariate definition ofthe background-error vertical covariances. TheMean Dynamic Topography (MDT) used in thissimulation follows an optimization process thataccounts for all altimetry observations misfitsas in [20] over the period 1993-2001.
Observations pre-processing includes i) abackground quality-check – which rejects ob-servations for which the ratio between thesquared departure from the background andthe sum of the observational and backgrounderror variances exceeds an observation type-dependent threshold; ii) an horizontal data thin-ning in order to reject altimetry observations tooclose in space, provided that observations areassumed to be spatially (and temporally) un-correlated and iii) a vertical data thinning forin-situ observations only, to avoid that severalassimilated observations from a same platformlie within the same vertical model layer. Fur-thermore, observations close to the sea-ice arerejected in order to avoid analysis incrementsinconsistent with the sea-ice model.
The observational errors for in-situ observa-tions were initially set equal to those found by[11] and subsequently tuned via the Desroziersmethod [5]. The latter iteratively adjusts theobservational error standard deviations by us-ing assimilation output statistics. Maxima ofthe observational errors are located approxi-mately in correspondence of the mixing layerdepth and at the surface for temperature andsalinity, respectively. For SLA observations, theerror variance is calculated a sum of observa-tional (satellite-dependent), MDT, representa-tiveness and inverse barometer correction errorvariances [20].
THE OGCM CONFIGURATION
The C-GLORS forecast model step is per-formed by the NEMO ocean model in config-
04
Cen
tro
Eur
o-M
edite
rran
eosu
iCam
biam
enti
Clim
atic
i
CMCC Research Papers
uration ORCA025. The version of the model isthe release 3.2.1. The model has a resolutionof about a 1/4 of degree and 50 vertical depthlevels with partial steps [1]. The grid is tripolar[16].
INITIALIZATION STRATEGY. The strategyfor initializing the reanalysis has been chosenas follows:
a 1950-1979 assimilation-free run initial-ized at 1/2 degree resolution (ORCA05)forced with ERA40, with relaxation to theEN3 monthly objective analyses, initial-ized from the NODC World Ocean Atlas1998 Series [14] blended with the PHC2.1climatology for the Arctic region [19];
a 1979-1989 assimilative run at the 1/2degree resolution;
the fields valid at 1st Jan 1989 have beeninterpolated onto the ORCA025 grid andthe 1/4 degree C-GLORS system hasstarted.
SURFACE FORCING FIELDS. The CORE
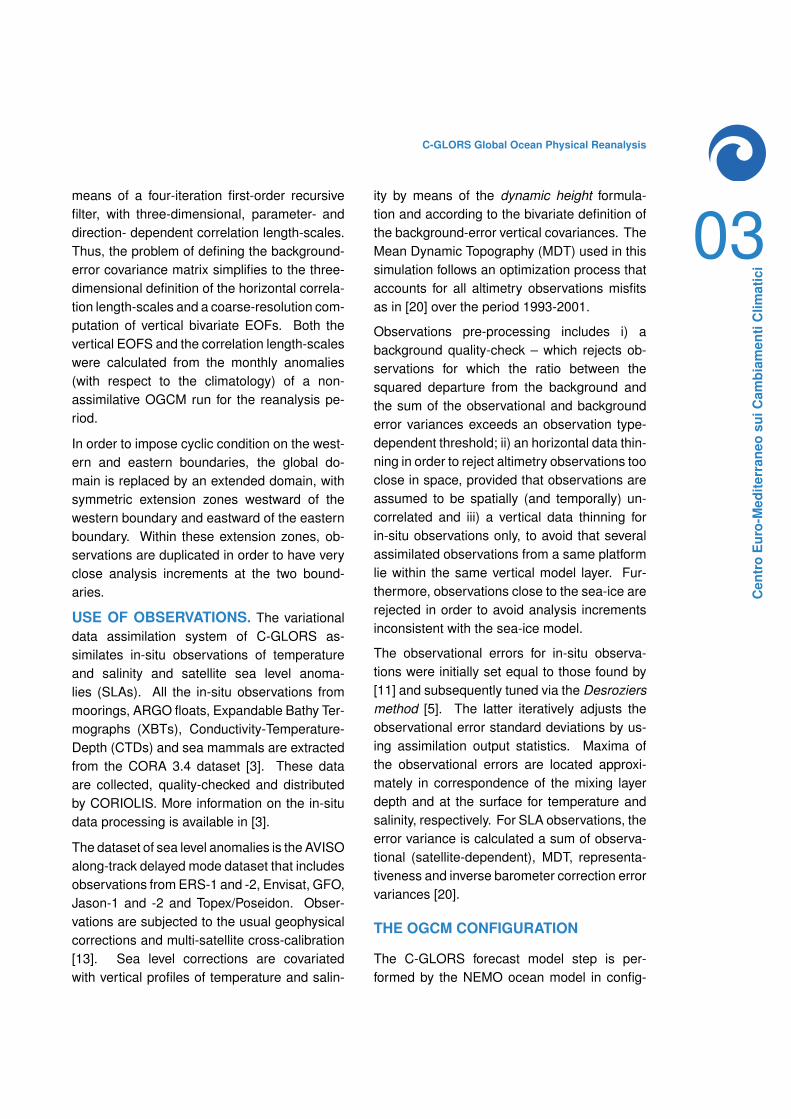
Figure 2:Difference between long-term mean (1993-2011)
C-GLORS temperature (left) and salinity (right) and WorldOcean Atlas 2009 climatology at 100 m of depth. Units
are degC and psu, respectively. The figure shows a 0.5-1degC cold bias in the Tropics and warm poleward.
bulk formulas forcing method [12] has beenadopted. The following atmospheric variableshave been used:
3-hourly turbulent variables (10 meterswinds and 2 meters temperature and spe-cific humidity);
daily radiative fluxes variables (down-ward short-wave and long-wave radia-tions) with shortwave radiation modulatedto have a diurnal cycle [2];
daily fresh water flux variables (total pre-cipitation and snow).
All the forcing fields are provided by the Euro-pean Centre for Medium-Range Weather Fore-cast (ECMWF) ERA-Interim atmospheric re-analysis project [18].
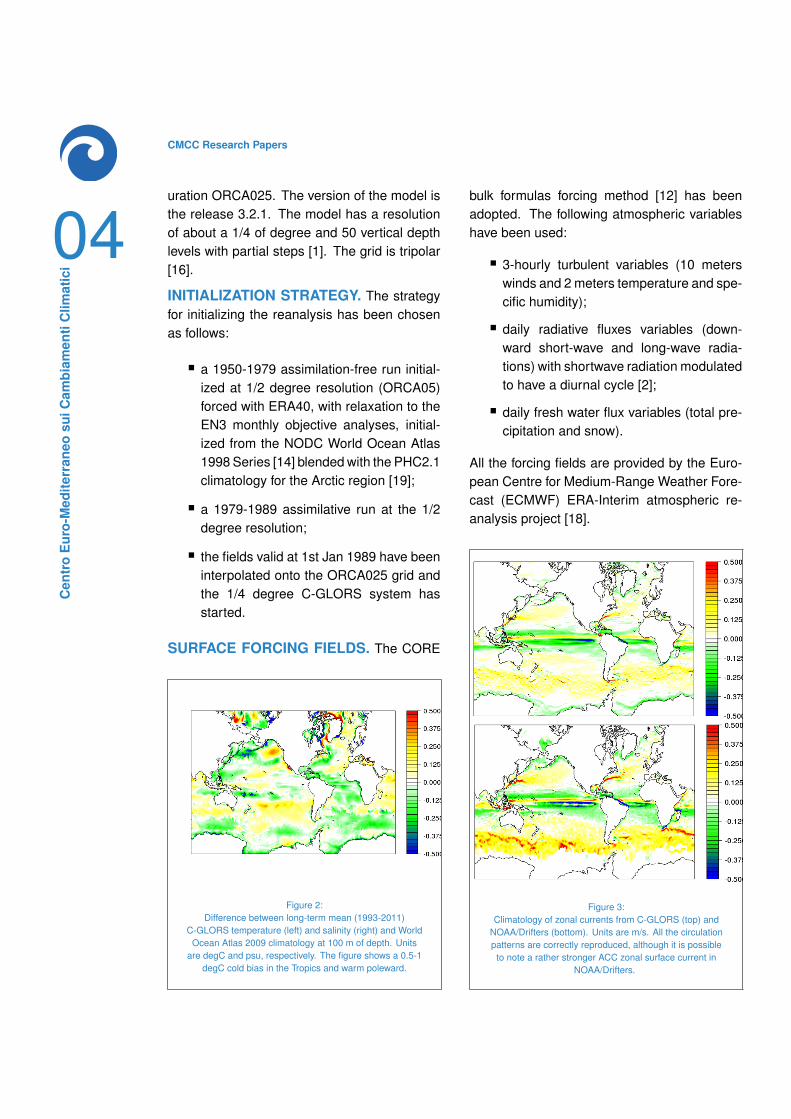
Figure 3:Climatology of zonal currents from C-GLORS (top) and
NOAA/Drifters (bottom). Units are m/s. All the circulationpatterns are correctly reproduced, although it is possible
to note a rather stronger ACC zonal surface current inNOAA/Drifters.
C-GLORS Global Ocean Physical Reanalysis
05
Cen
tro
Eur
o-M
edite
rran
eosu
iCam
biam
enti
Clim
atic
i
CORRECTIONS OF SURFACE FORC-ING FIELDS. ERA-Interim radiative fluxes andwind fields have been corrected as follows:large-scale short-wave and downward long-wave radiation fluxes have been corrected bymeans of a large-scale climatological correctioncoefficient derived by the GEWEX Surface Ra-diation Budget project; precipitation fields werecorrected by using a climatological coefficientderived from the REMSS/PMWC dataset [21].Furthermore, in order to avoid artificial drifts ofthe globally-averaged sea-surface height due tothe unbalanced fresh water budget, the globalevaporation minus precipitation minus runoffhas been set equal to zero at each model time-step.
LARGE-SCALE BIAS CORRECTION. Alarge scale bias correction (LSBC) is performedduring the model integration to avoid spuriousmodel biases and drifts. The LSBC corrects themodel tendencies every 6-hours using differ-ences between model and monthly univariateobjective analyses [11] to estimate the modelbias. The differences are filtered with a low-pass filter configured to filter out time scalesmaller than 3 months and spatial scale smallerthan 1200 Km, in order to bias correct the largescale signals only. The filtered differences arethen added to the tracer tendencies.
RUNOFF. The runoff files used in the simula-tion uses the climatology from [4] and was pro-vided by MERCATOR-Ocean. It is a monthlyclimatology that includes 99 major rivers andcoastal runoffs.
BOUNDARY CONDITIONS. The lateralboundary condition on momentum allows fora free slip. For the upper boundary a filteredfree-surface formulation has been used. Atthe ocean bottom, a linear friction is assumedand no geothermal heat flux has been consid-ered as a bottom boundary condition. Nei-ther diffusive nor advective bottom boundary
layer parametrization for tracers and momen-tum have been used.
SEA SURFACE RELAXATION. C-GLORSalso assimilates SST observations from theNOAA high-resolution daily analyses, whichuses AVHRR infrared and (from 2002) AMSR-Emicrowave radiances [17]. These observationsare assimilated during the model integrationthrough a simple nudging scheme that correctsthe net heat flux at the sea surface by means ofthe difference between observed and modeledsea surface temperature. The strength of thisrelaxation was set equal to -200 W K-1 s-1 (cor-responding to a relaxation time scale of 12 daysfor an ideal 50 m deep mixed layer). Similarly,the net freshwater flux is corrected using dif-ferences between observed and modeled seasurface salinity. The observational dataset isthe EN3 monthly objective analyses [11]. Thestrength of the freshwater relaxation is -166.7
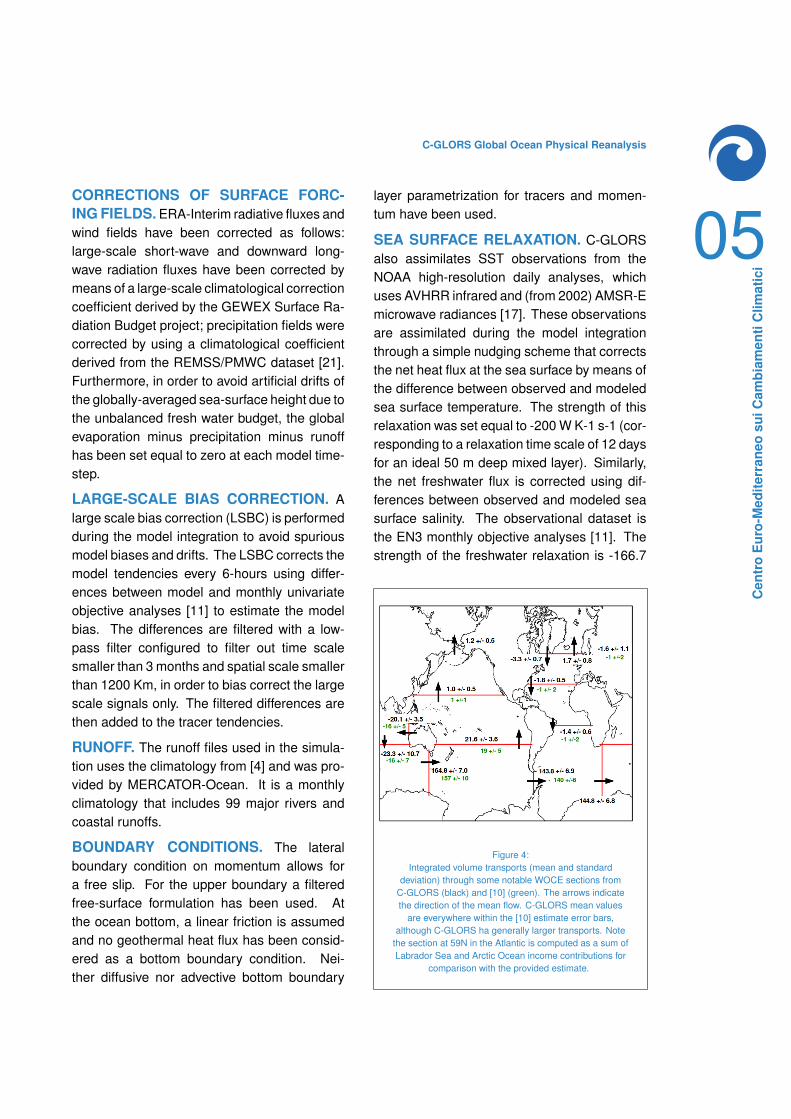
Figure 4:Integrated volume transports (mean and standard
deviation) through some notable WOCE sections fromC-GLORS (black) and [10] (green). The arrows indicatethe direction of the mean flow. C-GLORS mean values
are everywhere within the [10] estimate error bars,although C-GLORS ha generally larger transports. Note
the section at 59N in the Atlantic is computed as a sum ofLabrador Sea and Arctic Ocean income contributions for
comparison with the provided estimate.
06
Cen
tro
Eur
o-M
edite
rran
eosu
iCam
biam
enti
Clim
atic
i
CMCC Research Papers
mm/day, corresponding to a time scale of 300days for a 50 m deep mixed layer.
LIM2 SEA-ICE MODEL. The sea-ice modelused in the reanalyses is the LIM2 dynamicaland thermodynamical sea-ice model. The rhe-ology used is the EVP (elasto-visco-plastic).The assimilation of sea-ice concentration is per-formed through a simple nudging scheme thatassimilates the gridded NOAA sea-ice dailyanalysis at 1/4 degree, with a relaxation timescale of 15 days.
PHYSICS. The Turbulent Eddy Kinetic (TKE)dependent vertical diffusion scheme has beenused to compute the eddy vertical mixing coef-ficient. The vertical parametrizations include: i)the Enhanced Vertical Diffusion (EVD) scheme,ii) double diffusion mixing parametrization fortemperature and salinity, iii) a mixing lengthscale surface value as function of wind stress.The advection scheme used for tracers isthe MUSCL scheme (Monotone Upstream-centered Schemes for Conservation Laws). Forlateral diffusion a laplacian isopycnal diffusionscheme has been used with horizontal eddydiffusivity equal to 300 m2/s (the coefficient isgrid size dependent). A bilaplacian operatorhas been used for lateral viscosity of momen-tum, with horizontal eddy viscosity coefficientequal to -1.0e11 m2/s. The coefficient is gridsize power 3 dependent.
COMPUTATIONAL DETAILS
C-GLORS has run on the IBM iDataplex dx360system with Intel Xeon processors (Athenacluster). The ocean model domain is decom-posed into 320 processors for the forecast stepand 80 for the assimilation step. Wall-clocktime for the simulation was about 38 hoursper year of simulation, depending on observa-tions amount and number of 3DVAR iterationsperformed, of which about 80 % spent on the
OGCM run and the rest on the assimilation part.The model outputs have been saved as weeklymeans, subsequently post-processed to gener-ate monthly means. Surface parameters werealso saved as daily means.
CHANGES WITH RESPECT TO THEPREVIOUS VERSION
With respect to the previous version (MyOceanv2) the main changes can be summarized inthe following issues:
Re-introduction of SLA observations as-similation in the 3DVAR scheme;
Re-calibration of background-error co-variances;
Assimilation of SST observations with anudging scheme instead of the 3DVARscheme;
Use of the in-situ observations CORA 3.4dataset instead of the EN3 v2a datasets;
Introduction of a large-scale bias correc-tion scheme;
Introduction of the EVP sea-ice dynamics;
Use of the MUSCL advection scheme in-stead of the TVD scheme.
VALIDATION
An extensive validation of the reanalyses hasbeen conducted after the reanalysis productionwas completed. The methodology used duringthe validation phase is detailed in [7]. Here,we report the main findings from the validationexercise.
TEMPERATURE. We found a very small biasat surface (below 0.5 degC), a 0.5-1 degC coldbias in the Tropics and warm poleward for the100 and 300 m depth levels with respect to the
C-GLORS Global Ocean Physical Reanalysis
07
Cen
tro
Eur
o-M
edite
rran
eosu
iCam
biam
enti
Clim
atic
i
WOA09 climatology. Figure 1 shows the dif-ference (model minus climatology) at 100 m ofdepth. At 800 m the bias is relevant only incorrespondence of the ACC front (cold northof it, warm south of) while at 2000 m is neg-ligible in practice. This suggests that the re-analysis mislocates the northern boundary ofthe ACC. Globally averaged values and lineartrends of SST are in great consistency withNOAA/AVHRR SST analyses. With respect tothe EN3 analyses, both the variability and theanomalies are well reproduced by C-GLORSfor the vertical layers investigated (0-700 m, 0-2000 m and 2000 m-bottom), although an off-set between the two datasets is clearly visiblein all layers. Both datasets show a compara-ble warming below 100 m, while more incon-sistency exists near the surface. The RMSEagainst all the in-situ observations of tempera-ture shows a reasonable decreasing behaviorwith time.
SALINITY. Sea surface salinity is generallygreater in the Arctic compared to WOA2009probably due to sea-ice edge misplacement.Elsewhere, the bias presents values generallybelow 0.2 psu. At 100 m similar patterns arepresent (Figure 2), with a fresh bias (about 0.1psu) in the Indonesian region and in the Tropi-cal Atlantic and generally salty at mid-latitudes,which remains visible at 300 m of depth. Be-low, biases are rather negligible. The sea sur-face salinity trends patterns are generally sim-ilar to those from EN3 SSS except in the In-dian Ocean, although the ones in C-GLORS areslightly more pronounced. In the comparisonwith the selected moorings, values of standarddeviation of observations minus model equiv-alents are maximum near the surface, rangingfrom 0.15 to 0.35 psu. We found a larger ini-tial SSS variability w.r.t. to EN3 SSS, whichmay be due to the lack of a dense salinityobservation network in the 90s and beginning
of 2000s. Time-mean values and inter-annualanomaly in some selected layers (0-700 m, 0-2000 m and 2000 m-bottom) are generally wellcaptured by C-GLORS with respect to the EN3objective analyses. The increase in salinity be-low 100 m visible in the EN3 dataset is repro-
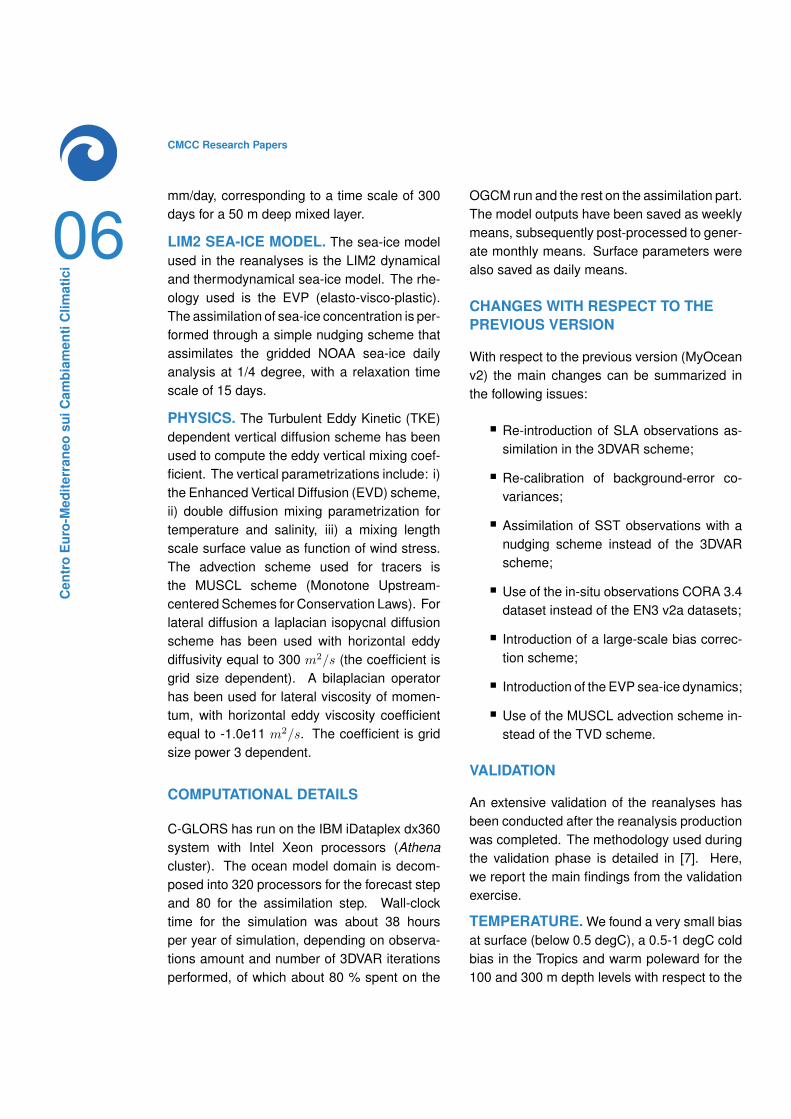
Figure 5:September Antarctic sea ice concentration 1993-2011climatology from C-GLORS (top) and NOAA/AVHRR
analyses (bottom).
08
Cen
tro
Eur
o-M
edite
rran
eosu
iCam
biam
enti
Clim
atic
i
CMCC Research Papers
duced by C-GLORS, while its partial freshen-ing near the surface within the last decade isnot present in EN3. As for temperature ob-servations, the in-situ observation minus modelstatistics show the improvements of the sys-tem with time and with the assimilation of Argofloats, which lead to smaller negative bias anda decreasing RMSE.
CURRENTS. All the near-surface circulationpatterns are correctly reproduced in the com-parison with the drifter-derived climatology, al-though it is possible to note a rather strongerACC zonal surface current in NOAA/Drifters.This is shown in Figure 3.
Vertical profiles in correspondence of the equa-torial moorings are reproduced correctly ex-cept at 90E, and C-GLORS generally presentsslightly weaker currents, while standard devia-tions range from about 20 to 30 cm/s.
SEA LEVEL. Sea level trends show simi-lar patterns in C-GLORS and AVISO, but C-GLORS is affected by larger trends in corre-spondence of the ACC front and in the GulfStream region, which depend on the SLA dataassimilation for the last 5 years of simulationdue to the optimization process of the MDT.
In the comparison with tide-gauge observations(shown in the front page), values of the corre-lation are generally satisfactory except in sometide gauge stations within the ACC, where themodel presents a variability higher then tide-gauge observation. The RMSE against along-track altimetry observations suggests that theSLA data assimilation for the last 5-10 yearsof simulation is affected by a slight increase inthe error due to the optimization process of theMDT (not shown).
TRANSPORTS. C-GLORS shows an At-lantic Meridional Overturning circulation(AMOC), on the average, about 2.5 Svtoo weak (with respect to the 17 Sv of
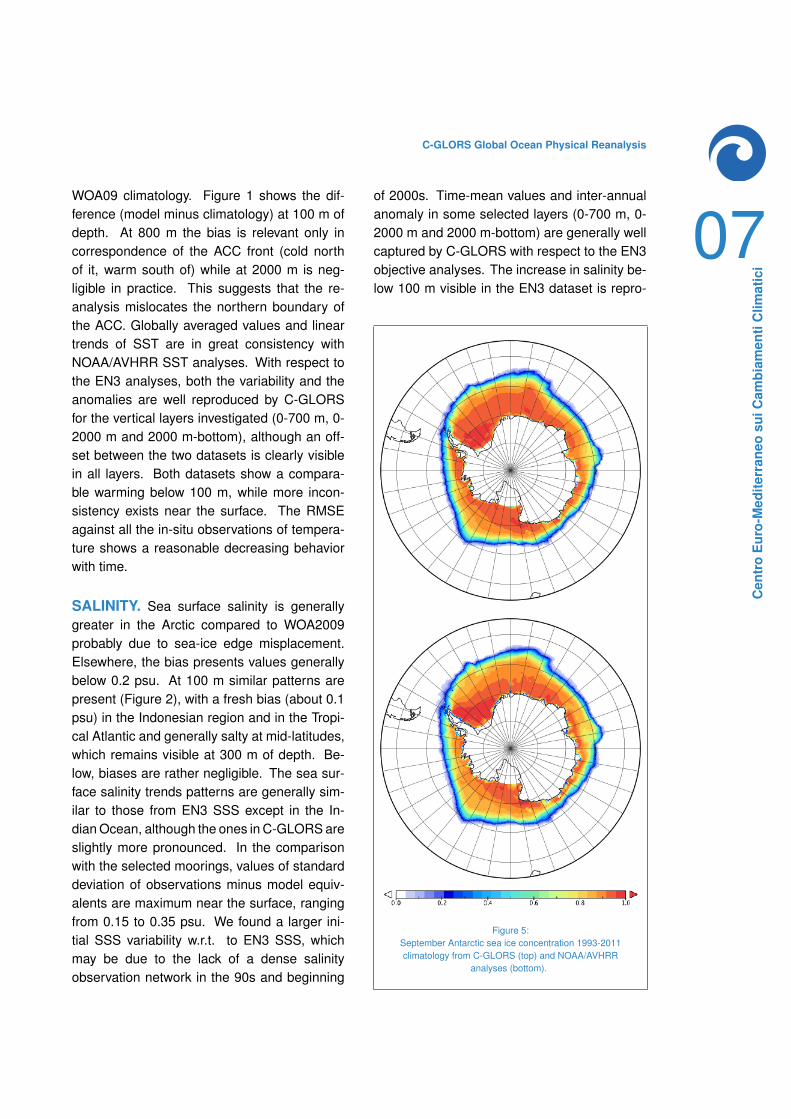
Figure 6:March Antarctic sea ice concentration 1993-2011
climatology from C-GLORS (top) and NOAA/AVHRRanalyses (bottom).The concentration in March (minima) is
underestimated, especially in the Weddel Sea.
RAPID-MOC for the period 2004-2011,not shown), although the temporal variabilityis well captured, with a correlation equal to 0.6.
C-GLORS Global Ocean Physical Reanalysis
09
Cen
tro
Eur
o-M
edite
rran
eosu
iCam
biam
enti
Clim
atic
i
Recent sensitivity studies suggested that thereintroducing the TVD tracer advection schemeinstead of the MUSCL scheme can help in alle-viating the underestimation of the AMOC.
Volume transports are in close agreement withthe values found in literature, although thetransports in the Southern Ocean are slightlyover-estimated. Figure 4 represents volumetransports for some notable WOCE sections forC-GLORS, compared with the estimates from[10].
SEA ICE. While sea-ice concentration inter-annual variability and winter-time maxima aresimulated correctly, concentrations in March forthe Antarctic and in September for the Arctic
are generally underestimated. This is visible inFigures 5 and 6 for the Antarctic sea-ice: whilethe extension during the maximum sea ice con-centration is well captured, in correspondenceof the yearly minima (March) the concentrationis under-estimated with respect to NOAA anal-yses based on AVHRR data. An anomalousincrease is also seen for the last two years ofsimulations, which is currently under investiga-tion.
MIXED LAYER DEPTH. Mixed layer depth(MLD) patterns are well reproduced (notshown), although C-GLORS overestimates theMLD in correspondence of the North AtlanticOcean deep convection areas.
PLANNED IMPROVEMENTS FOR THE NEXT RELEASE
A new release of C-GLORS is planned for official release in September 2014 at the latest. The mainimprovements and extension that are currently under testing are:
Initial Conditions: The new reanalysis system is initialized in 1979 from a 10-year spinup with 1978repeated atmospheric forcing. The new reanalysis will therefore cover all the ERA-Interim and AVHRRperiod.
Sea-ice: A stronger sea-ice concentration nudging, whose time-scale depends on the sea-ice misfit,has been succesfully tested and is able to provide a better representation of Arctic and Antarctic sea-iceminima;
Mean Dynamic Topography: is being recalculated taking into account the sea level anomaly statisticsfor the all reanalysis period. Sensitivity experiments are planned;
Advection scheme: the MUSCL scheme, while faster, has been proved detrimental to the reanalysissystem as it leads to under-estimated thermo-haline circulation. The TVD scheme will be thereforere-introduced.
KNOWN ISSUES. C-GLORS v3.1 is affectedby two known issues: i) underestimation of sea-ice minima in summer, which is not sufficientlycorrected by the sea-ice nudging; ii) the MDToptimization was performed on a 1993-2001reference period. Accordingly, there is an in-
crease in SLA misfit RMSE for the last period ofthe simulation, due to the lack of these observa-tions within the MDT optimization procedure; iii)the use of MUSCL advection scheme was vali-dated near-surface, while later we found that itleads to under-estimated transports at depth.
10
Cen
tro
Eur
o-M
edite
rran
eosu
iCam
biam
enti
Clim
atic
i
CMCC Research Papers
Bibliography
[1] B. Barnier, G. Madec, T. Penduff, J.-M.Molines, A.-M. Treguier, J. Le Sommer,J. Beckmann, C. Boning, J. Dengg, C. Der-val, C. Durand, S. Gulev, E. Remy, C. Ta-landier, S. Theeren, M. Maltrud, McCleanJ., and B. de Cuevas. Impact of partialsteps and momentum advection schemesin a global ocean circulation model ateddy-permitting resolution . Ocean Dynam.,56:543–567, 2006.
[2] D. J. Bernie, E. Guilyardi, G. Madec, J. M.Slingo, and S. J. Woolnough. Impact ofresolving the diurnal cycle in an ocean-atmosphere gcm. part 1: a diurnally forcedogcm. Clim. Dynam., 29:575–590, 2007.
[3] C. Cabanes, A. Grouazel, K. vonSchuckmann, M. Hamon, V. Turpin,C. Coatanoan, F. Paris, S. Guineht,C. Boone, N. Ferry, C. de Boyer Montegut,T. Carval, G. Reverdin, S. Pouliquen, andP.-Y. Le Traon. The cora dataset: val-idation and diagnostics of in-situ oceantemperature and salinity measurements.Ocean Sci., 9:1–18, 2013.
[4] A. Dai and K. E. Trenberth. Estimatesof freshwater discharge from continents:Latitudinal and seasonal variations. J. Hy-drometeor., 3:660–687, 2002.
[5] G. Desroziers, L. Berre, B. Chapnik, andP. Poli. Diagnosis of observation, back-ground and analysis-error statistics in ob-servation space. Q. J. R. Meteorol. Soc.,131:3385–3396, 2005.
[6] S. Dobricic and N. Pinardi. An oceano-graphic three-dimensional assimilationscheme. Ocean Modelling, 22:89–105,2008.
[7] N. Ferry, L. Bertino, K. Haines, G. Larni-col, A. Lars, S. Masina, S. Salon, S. Si-moncelli, C. Solidoro, A. Storto, M. Val-
divieso, H. Zuo, B. Levier, L. Parent, S. Hi-ollo, E. Simon, and A. Samuelsen. Cali-bration / validation definition for ocean re-analyses. Myo2-wp18-calvaldef-v1.6, My-Ocean2, 2013. pp. 37.
[8] N. Ferry, K. Haines, , S. Masina, A. Storto,M. Valdivieso, L. Parent, B. Barnier, andJ.-M. Molines. Quality information doc-ument for global ocean reanalysis prod-ucts. Myo2-glo-quid-001-004-009-010-011-v2.4, MyOcean2, 2013. pp. 123.
[9] T. Fichefet and M. A. Morales Maqueda.Sensitivity of a global sea ice model to thetreatment of ice thermodynamics and dy-namics. J. Geophys. Res., 102, 1997. 1269–12646.
[10] A. Ganachaud and Wunschm C. Improvedestimates of global ocean circulation, heattransport and mixing from hydrographicdata. Nature, 408:453–457, 2000.
[11] B. Ingleby and M. Huddleston. Quality con-trol of ocean temperature and salinity pro-files - historical and real-time data. J. Mar.Syst., 65:158–175, 2007.
[12] W. G. Large and S. G. Yeager. Diurnal todecadal global forcing for fcean and sea-ice models: the data sets and flux clima-tologies. Technical Report No 460, NCARTechnical Note, 2004.
[13] P.Y. Le Traon, F. Nadal, and N. Ducet.An improved mapping method of multi-satellite altimeter data. J. Atmos. Ocean.Technol., 15:522–534, 1998.
[14] D. Levitus, T. Boyer, M. Conkright,M. O Brien, T. Antonov, C. Stephens,C. Stathoplos, D. Johnson, and R. Gelfeld.World ocean database 1998. Atlas nesdis18, NOAA, 1998. U.S. Gov. Printing Office,Wash., D.C.
[15] G. Madec. Nemo ocean engine. Notedu pole de modelisation de l’institut
C-GLORS Global Ocean Physical Reanalysis
11
Cen
tro
Eur
o-M
edite
rran
eosu
iCam
biam
enti
Clim
atic
i
pierre-simon laplace no 27, Laboratoired’Oceanographie et du Climat, 2008. pp.219.
[16] G. Madec and M. Imbard. A global oceanmesh to overcome the north pole singular-ity. Clim. Dynam., 12:381–388, 1996.
[17] R. W. Reynolds, T. M. Smith, C. Liu,D. B. Chelton, K. S. Casey, and M. G.Schlax. Daily high-resolution blendedanalyses for sea surface temperature. J.Climate, 20:5473–5496, 2007.
[18] A. Simmons, S. Uppala, D. Dee, andS. Kobayashi. Era-interim: New ecmwf re-analysis products from 1989 onwards. InNewsletter 110. ECMWF, Winter 2006/20072007.
[19] M. Steele, R. Morley, and X. Ermold. Phc:A global ocean hydrography with a highquality arctic ocean. J. Climate, 14:2079–2087, 2001.
[20] A. Storto, S. Dobricic, S. Masina, andP. Di Pietro. Assimilating along-track al-timetric observations through local hydro-static adjustments in a global ocean re-analysis system. Mon. Wea. Rev., 139:738–754, 2011.
[21] A. Storto, I. Russo, and S. Masina. Interan-nual response of global ocean hindcaststo a satellite-based correction of precipita-tion fluxes. Ocean Sci. Discuss., 9:611–648,2012.
c© Centro Euro-Mediterraneo sui Cambiamenti Climatici 2014
Visit www.cmcc.it for information on our activities and publications.
The Euro-Mediteranean Centre on Climate Change is a Ltd Company with its registered office andadministration in Lecce and local units in Bologna, Venice, Capua, Sassari, Viterbo, Benevento and Milan.The society doesn’t pursue profitable ends and aims to realize and manage the Centre, its promotion, andresearch coordination and different scientific and applied activities in the field of climate change study.