research performances of organization of islamic
TRANSCRIPT

*Corresponding author: Abolghasem Jouyban (PhD), Tel.: +98 (411) 3379323, Fax: +98 (411) 3363231, E-mail: [email protected] Copyright © 2011 by Tabriz University of Medical Sciences
BioImpacts, 2012, 2(2), 111-122 doi: 10.5681/bi.2012.017 http://bi.tbzmed.ac.ir/
Research Performances of Organization of Islamic Conference (OIC) Members Maryam Khoubnasabjafari1, Eliza Sadeghifar2, Majid Khalili3, Khalil Ansarin1, Abolghasem Jouyban4* 1Tuberculosis and Lung Disease Research Center, Tabriz University of Medical Sciences, Tabriz, Iran 2Liver and Gastrointestinal Diseases Research Center and Faculty of Medicine, Tabriz University of Medical Sciences, Tabriz, Iran 3Medical Philosophy and History Research Center, Tabriz University of Medical Sciences, Tabriz, Iran 4Drug Applied Research Center and Faculty of Pharmacy, Tabriz University of Medical Sciences, Tabriz, Iran
Introduction Inquiry and search for knowledge have been recom-mended from Quranic sentences as “Say: Are those who know and those who do not know alike? Only the men of understanding are mindful” (Holy Quran, 39: 9). Although Muslims had very long history on exploration of scientific facts and employing them to solve the problems associated with their real life during the medieval centuries, small number of research was conducted/published by Muslim researchers between 15th and 19th centuries (El-Rauayheb 2006) and they showed up a declined pattern during last centuries when the scientific renaissance and industrial revolution happened in the Western societies with a great impact on the economic growth, life style, communications, envi-ronmental changes etc. Publication date of the first jour-nal backs to 1665 in France and the first one in the Islamic countries backs to 1827 in Egypt, followed by Turkey in 1830 and Iran in 1837 (Azizi et al 2009). The mentioned publications were not peer reviewed and the history of peer review in the world backs to 1752 (Opthof et al 2002). Similar gap of the first journal pub-lications in the Western and Islamic societies exists in
the quantity and quality of the publications from these societies. The religious initiations and the need to provide higher levels of science and technology encour-age Muslim scientists to increase their contributions in scientific publications at international levels. Research projects could be classified as basic and applied projects (Duncan 1951). The basic projects aimed to answer a scientific question and to broaden the knowledge and its outcomes may not appear for many years, whereas in an applied project, the researchers look for a practical solution to an existing problem. The process of a productive research includes the steps of input, activity, output and outcomes. Complete and comprehensive infrastructure, well-trained researchers, programmed research management system; enough budgets and a justified distribution system are required to produce qualified research outputs and outcomes. At least some of these requirements do not exist in most of organiza-tion of Islamic conference (OIC) members. In addition, cultural, political and security issues within these societies are other affecting parameters on the research performance (Rizvi 2005). The recent status of research publications of a number of OIC members were
A B S T R A C T A R T I C L E I N F O
Introduction: Scientometric analysis of academic institutions provides useful information for policy makers, international and national organizations to invest in the research fields of the institutions to gain more outputs with less cost. The objectives of this work were to report a scientometric analysis of Islamic states considering a number of indicators. Methods: The number of articles and patents published by members of organization of Islamic conference were extracted from ScopusTM along with the top journals, authors, document type, universities, language of the publications and subjects. Results: The analyses of data revealed that Turkey is the leading country followed by Iran, Egypt, Malaysia and Nigeria when total numbers of indexed articles in ScopusTM are considered. When the articles of 2006-2010 are considered the ranks are Turkey, Iran, Malaysia, Egypt and Pakistan. Conclusion: the increased pattern was observed for scientific performances of OIC members however, more investments are required to fill the gap between OIC members and the leading countries.
Keywords: Research Performance Organization of Islamic Conference Scientometrics Articles Patents
Article History: Received: 16 Oct 2011 Revised: 26 Oct 2011 Accepted: 16 Nov 2011 ePublished: 07 May 2012
Article Type: Report and Scientific Analysis

112 |
Khoubnasabjafari et al
BioImpacts, 2012, 2(2), 111-122 Copyright © 2011 by Tabriz University of Medical Sciences
investigated in the last couple of years (Yurtsever and Gulgoz 1999, Mehrdad et al 2004, Gokceoglu et al 2008, Sotudeh 2010, Fakhree and Jouyban 2011).
Scientometrics has become an important field of study in recent decades (Torres-Salinas et al 2008, Abramo et al 2009) and it includes quantitative and/or qualitative analysis of the scientific products. The number of published articles is one of the most important parameters of evaluation of the research performance of a researcher, a department, a university and even a country. This criterion could also be considered as a measure of development in a country, since there is a close relationship between scientific performance and the quality of industrial products and/or social services within a society. The research and development depart-ments play crucial roles in an industrial company or academia. The outputs of a research project could be a scientific paper published in a journal and/or a patent registered in a patent office. In addition to this quantitative tool to evaluate the research performance, citations to the published papers and/or commercializa-tion of a patent could be possibly considered as qualitative tools to assess the research performance. It is obvious that there are some other qualitative tools such as impact factor of the journal, source normalized impact per paper (SNIP), SCImago journal rank (SJR), etc. When evaluation criteria focus on quantitative measures, the researchers are interested to increase the number of publications, as it is evident from Moed findings in UK where the number of publications has been used as evaluation tool in 1992, the number of papers from British authors was increased. The criterion was changed to the number of citations in 1996, and the scholars gradually intended to publish articles with a high citation impact (Moed 2007). It should be added that there is no general agreement on the evaluation of the research performance and the indicators used for this purpose and it is not in the scope of the present work to deal with this subject. Patel et al (2011) reviewed advantages and dis-advantages of various indicators. The discussed indicators in their review were: 1) number of publica-tions, 2) number of citations, 3) impact factor, 4) H-index, 5) research funding, 6) degree of co-authorship, 7) GDP and population size, and 8) uncommon indicators (number of conference presentations, number of patents, number of doctoral students, etc.).
The resulted research evaluation data can be used as a tool for ranking (Alewell 1990, Docampo 2011), awarding, budgeting, and defining research priorities, which might be helpful in science-related decision-makings. The data used in this respect, should be as correct as possible. Different methods are available for data gathering which are most based on bibliometric approaches. The aims of this work are to evaluate the recent status of publications of Islamic countries and
compare the data with that of European countries. The main objectives of this study were to answer: • How many publications (papers and patents) were
produced by the authors of OIC and EU members over a lifetime and during 2006-2010?
• What are the relative frequencies of the lifetime publications of OIC and EU members?
• What are the contributions per capita of OIC members?
• Who are the top authors of OIC members? • What is the list of journals publishing most of OIC
members’ articles? • What is the list of top universities of OIC members? • What are the relative frequencies of publications of
OIC members? • What are the most common subjects and document
types of articles of OIC members Materials and methods Total numbers of articles indexed in ScopusTM published by the researchers of each OIC state were collected by searching the names of the countries in the affiliation section of the ScopusTM. The numbers of patents were gathered using similar method. The data was copied and pasted into an Excel file and then saved as ASCII files. After deleting inappropriate characters, the files imported to SPSS environment and the classifications among gathered data were carried out using SPSS 11.5 software. The required graphs were drawn using Excel 2003. The ScopusTM database was chosen since it was the only available and comprehensive database accessible for the authors. The summary results of these searches were used to compare the productivity of the researchers of the OIC members. The published docu-ments from 2006 to 2010 were also extracted to assess the research performance during the last five years. We considered the time period of five years since assessing research performance over a 1-5 year period is more common in the literature (as examples see Ellwein et al 1989, Kaplan et al 1992). To further investigate, top five items of top five countries were extracted and analyzed. In order to compare the results of OIC members, the data of European Union (EU) countries was also collected. The data of this work were collected from 24th December 2010 to 10th January 2011. The impact factors of year 2010 were used in this study. Also, data related to popu-lations were taken from www.who.int. Results Numbers of publications of OIC and EU members Table 1 lists the numbers of articles published by the researchers of the OIC members during last five years, the total number of lifetime articles and patents indexed in ScopusTM, the percent of contributions of OIC members and their populations.
| 113 BioImpacts, 2012, 2(2), 111-122 Copyright © 2011 by Tabriz University of Medical Sciences
Research performances of OIC members
Table 1. Total number of articles published by researchers of OIC members, percent of contribution, number of articles published in the last five years, total number of patents indexed in ScopusTM and the population
Country Total number of articles Contribution (%) of total papers 2010 2009 2008 2007 2006 Patents Populationa
Afghanistan 437 0.05 79 51 41 29 37 2 26088000 Albania 1104 0.11 167 108 92 77 68 41 3172000 Algeria 19205 1.99 2348 2668 2275 1789 1564 152 33351000 Azerbaijan 6868 0.71 692 662 592 536 388 95 8406000 Bahrain 3439 0.36 233 297 268 265 267 72 739000 Bangladesh 16672 1.73 1534 1733 1597 1433 1053 70 155991000 Benin 5981 0.62 459 625 465 515 399 47 8760000 Brunei-Darussalam 1025 0.11 103 108 100 87 66 63 382000 Burkina-Faso/Upper Volta 43 0.00 1 0 0 0 0 34 14359000 Cameroon 6978 0.72 681 652 615 588 567 84 18175000 Chad 470 0.05 24 45 32 28 41 1451 10468000 Comoros 53 0.01 6 2 2 5 2 4 818000 Cote D'Ivoir 2 0.00 1 0 0 0 0 0 18914000 Djibouti 155 0.02 15 16 7 11 8 2 819000 Egypt 93829 9.72 7897 7750 6213 5505 4951 1360 74166000 Gabon 1646 0.17 109 120 111 97 118 36 1311000 Gambia 1829 0.19 115 119 121 104 116 28 1663000 Guinea 288 0.03 27 25 23 32 20 221 9181000 Guinea-Bissau 3970 0.41 165 175 189 192 154 2 1646000 Guyana 468 0.05 27 25 23 32 27 14 739000 Indonesia 15889 1.65 1630 1686 1264 1128 1052 994 228864000 Iran 124462 12.92 23896 22379 18665 14422 10845 611 70270000 Iraq 7230 0.75 519 523 425 320 302 54 28506000 Jordan 20340 2.11 2075 1971 1876 1647 1422 6192 5729000 Kazakhstan 4945 0.51 329 380 329 328 311 241 15314000 Kuwait 16186 1.68 924 1097 1094 965 882 343 2779000 Kyrgyz 345 0.04 29 26 40 31 38 14 5259000 Lebanon 22801 2.36 2030 2063 1894 1799 1674 9247 4055000 Libya 2768 0.29 341 301 202 149 129 12 6039000 Malaysia 61541 6.38 10868 10351 7286 4802 4048 6393 26114000 Maldives 95 0.01 8 7 5 13 8 0 300000 Mali 1794 0.19 160 157 142 139 132 126 11968000 Mauritania 301 0.03 19 20 23 21 26 9 3044000 Morocco 23094 2.39 1946 2039 1780 1568 1466 511 30853000 Mozambique 1324 0.14 143 142 131 106 102 2 20971000 Niger 1831 0.19 223 215 161 103 92 129 13737000 Nigeria 51894 5.38 3809 4415 3641 3455 2974 126 144720000 Oman 6582 0.68 712 694 593 588 516 129 2546000 Pakistan 44859 4.65 6143 5771 4902 3918 3284 287 160943000 Palestine 2264 0.23 270 286 242 236 177 788 NA*
Qatar 4240 0.44 602 603 500 427 298 88 821000 Saudi Arabia 51078 5.29 5318 3938 3035 2651 2415 1803 24175000 Senegal 6311 0.65 366 368 366 335 286 45 12072000 Sierra Leone 659 0.07 38 37 23 19 15 52 5743000 Somalia 210 0.02 13 3 10 3 8 21 8445000 Sudan 5291 0.55 430 413 305 271 202 56 37707000 Suriname 253 0.03 11 13 20 13 10 9 455000 Syria 3322 0.34 368 281 335 243 215 52 19408000 Tajikistan 866 0.09 63 45 57 56 45 12 6640000 Togo 1230 0.13 87 72 84 74 69 1037 6410000 Tunisia 29852 3.09 4109 3988 3621 2786 2348 279 10215000 Turkey 256342 26.56 27975 28109 24593 23565 21674 5144 73922000 Turkmenistan 214 0.02 16 8 5 8 10 6 4899000 Uganda 7097 0.74 814 711 581 560 462 25 29899000 United Arab Emirates 14046 1.46 1762 1691 1400 1251 1157 843 4248000 Uzbekistan 7604 0.79 502 503 430 496 418 97 26981000 Yemen 1367 0.14 197 167 120 93 93 9 21732000
Sum 964989 100.00 113428 110654 92946 79914 69051 39564 1464931000
* Not Available
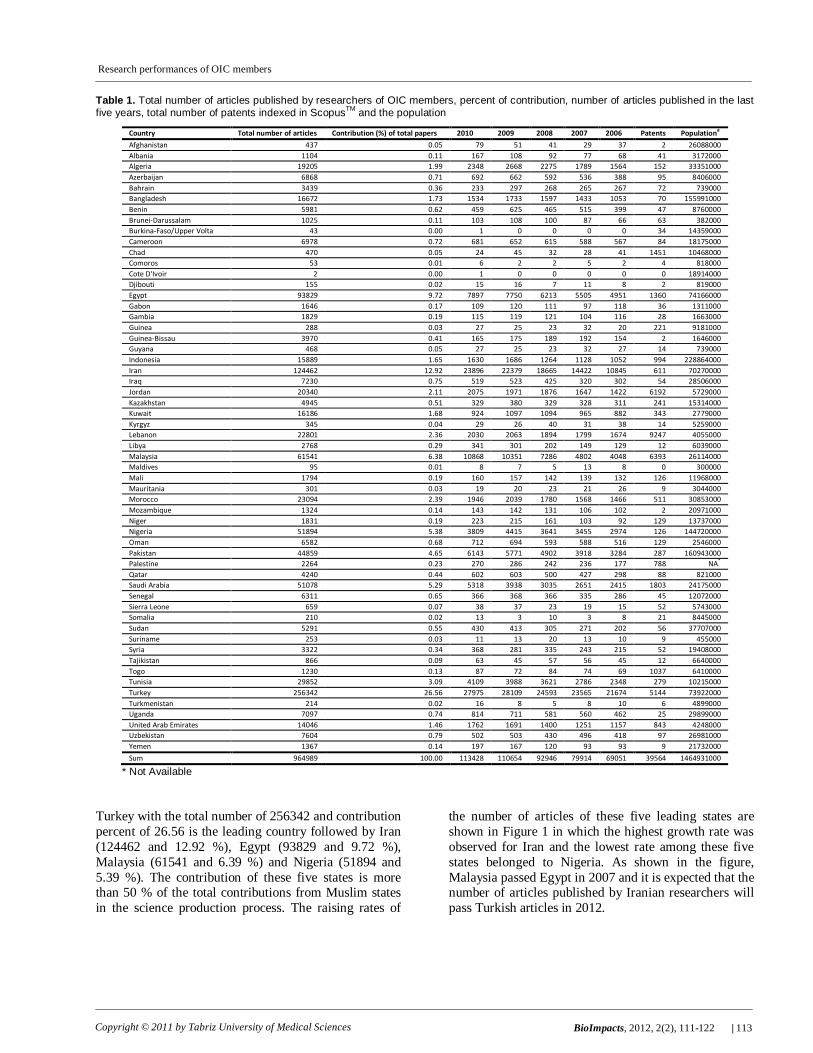
Turkey with the total number of 256342 and contribution percent of 26.56 is the leading country followed by Iran (124462 and 12.92 %), Egypt (93829 and 9.72 %), Malaysia (61541 and 6.39 %) and Nigeria (51894 and 5.39 %). The contribution of these five states is more than 50 % of the total contributions from Muslim states in the science production process. The raising rates of
the number of articles of these five leading states are shown in Figure 1 in which the highest growth rate was observed for Iran and the lowest rate among these five states belonged to Nigeria. As shown in the figure, Malaysia passed Egypt in 2007 and it is expected that the number of articles published by Iranian researchers will pass Turkish articles in 2012.
114 |
Khoubnasabjafari et al
BioImpacts, 2012, 2(2), 111-122 Copyright © 2011 by Tabriz University of Medical Sciences
Fig. 1. The growth rate of five leading states among OIC members.
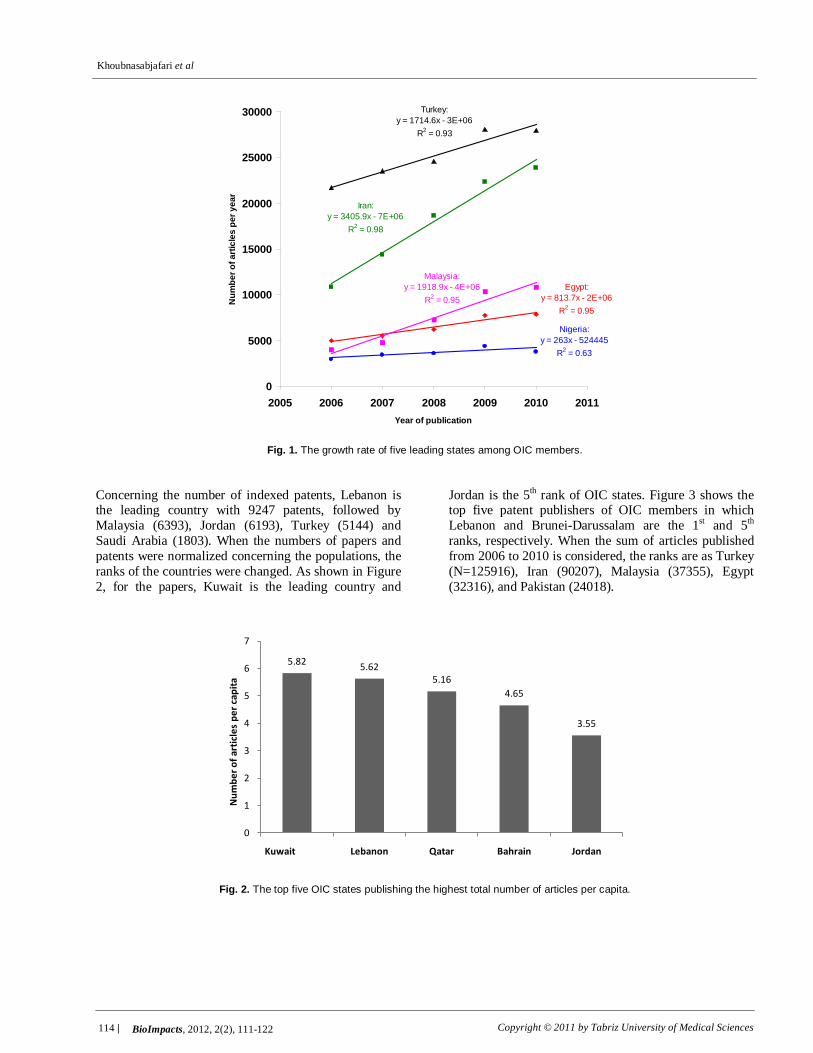
Concerning the number of indexed patents, Lebanon is the leading country with 9247 patents, followed by Malaysia (6393), Jordan (6193), Turkey (5144) and Saudi Arabia (1803). When the numbers of papers and patents were normalized concerning the populations, the ranks of the countries were changed. As shown in Figure 2, for the papers, Kuwait is the leading country and
Jordan is the 5th rank of OIC states. Figure 3 shows the top five patent publishers of OIC members in which Lebanon and Brunei-Darussalam are the 1st and 5th ranks, respectively. When the sum of articles published from 2006 to 2010 is considered, the ranks are as Turkey (N=125916), Iran (90207), Malaysia (37355), Egypt (32316), and Pakistan (24018).
Fig. 2. The top five OIC states publishing the highest total number of articles per capita.
Egypt:y = 813.7x - 2E+06
R2 = 0.95
Iran:y = 3405.9x - 7E+06
R2 = 0.98
Turkey:y = 1714.6x - 3E+06
R2 = 0.93
Malaysia:y = 1918.9x - 4E+06
R2 = 0.95
Nigeria:y = 263x - 524445
R2 = 0.63
0
5000
10000
15000
20000
25000
30000
2005 2006 2007 2008 2009 2010 2011Year of publication
Num
ber o
f arti
cles
per
yea
r
5.82 5.625.16
4.65
3.55
0
1
2
3
4
5
6
7
Kuwait Lebanon Qatar Bahrain Jordan
Num
ber o
f art
icle
s pe
r ca
pita

| 115 BioImpacts, 2012, 2(2), 111-122 Copyright © 2011 by Tabriz University of Medical Sciences
Research performances of OIC members
Fig. 3. The top five OIC states publishing the highest total number of patents per capita.
In another analysis, the total number of articles and patents published by the authors of the Arab League countries (N=22) was compared with that of non-members (N=35). The number of articles and patents of Arabs were 327653 and 22026, and those of non-Arabs were 637336 and 17538. When these numbers were converted to the percent of contributions, the figures were 33.95 % (articles) and 55.67 % (patents) for Arab authors and 66.05 % (articles) and 44.33 % (patents) for non-Arab authors. The number of published articles per capita for Arab authors was 0.001023 and for non-Arabs was 0.000557. These figures for two leading OIC
members, i.e. Turkey and Iran, were 0.003468 and 0.001771. These findings are in agreement with those of Benamer and Bakoush (2009). Table 2 listed the total number of articles, the published articles between 2006 and 2010, number of registered patents and the population of the EU countries. UK with the total article number of 2512723 and 20.76 % of contribution is the leading country among EU members followed by Germany, France, Italy and others. The total number of publications of EU members was 12104372 and the publication per capita was 0.024616. The corres-ponding figure for OIC members was 0.000659.
Table 2. The Total number of articles published by researchers of OIC members, percent of contribution, number of articles published in the last five years, total number of patents indexed in ScopusTM and the population
Country Total number of articles Contribution (%) of total papers 2010 2009 2008 2007 2006 Patents Populationa
Austria 265115 2.19 16517 15537 14850 13916 12846 70881 8327000 Belgium 355213 2.93 23210 22474 21174 19838 18723 84488 10430000 Bulgaria 65552 0.54 2943 3395 3122 3312 2577 1943 7693000 Cyprus 8165 0.07 1272 1262 939 772 655 1584 846000 Czech Republic 158299 1.31 13156 12205 11767 10631 10329 5293 10189000 Denmark 256365 2.12 16436 15365 13449 12907 12360 56857 5430000 Estonia 15751 0.13 1731 1532 1459 1381 1151 773 1340000 Finland 228453 1.89 13549 13685 13136 12817 12116 80302 5261000 France 1629213 13.46 91551 89725 84030 78917 75633 232319 61330000 Germany 2328869 19.24 126911 118879 109170 105098 104445 1116970 82641000 Greece 177280 1.46 15208 15737 14894 14078 13244 1998 11123000 Hungary 156242 1.29 7570 7523 7454 7131 7062 11012 10058000 Ireland 115721 0.96 10710 9990 8861 8134 7237 344402 4221000 Italy 1200895 9.92 72187 71877 67767 64964 60855 87192 58779000 Latvia 9806 0.08 680 698 696 525 448 643 2289000 Lithuania 19855 0.16 1965 2216 2207 1903 1870 566 3408000 Luxembourg 5446 0.04 889 778 595 455 390 10569 461000 Malta 2463 0.02 297 286 277 168 143 885 405000 Netherlands 675083 5.58 43434 40977 37096 35421 34596 233860 16379000 Poland 388387 3.21 24475 24142 23227 21774 23007 6458 38140000 Portugal 115032 0.95 13021 12188 11277 9417 9008 1517 10579000 Romania 85924 0.71 8367 9445 7416 5755 4156 1477 21532000 Slovakia 49394 0.41 3854 3859 4027 3426 3331 375 5388000 Slovenia 41654 0.34 3843 3998 3801 3462 3020 2813 2001000 Spain 742009 6.13 62903 60470 54660 50823 48226 44791 43887000 Sweden 495463 4.09 26646 25295 23961 23918 22927 162853 9078000 United Kingdom 2512723 20.76 130467 129231 123571 121581 116738 538958 60512000
Sum 12104372 100.00 733792 712769 664883 632524 607093 3101779 491727000
2.28
1.08
0.24 0.2 0.16
0
0.5
1
1.5
2
2.5
Lebanon Jordan Malaysia United Arab Emirates
Brunei-Darussalalm
Num
ber o
f art
icle
s pe
r ca
pita

116 |
Khoubnasabjafari et al
BioImpacts, 2012, 2(2), 111-122 Copyright © 2011 by Tabriz University of Medical Sciences
Top authors of OIC members
List of top 25 authors of OIC members are given in Table 3 along with their total number of publications (as a quantitative measure) and H-indices (as a qualitative measure). These data were extracted for five top authors of each OIC country and there are some authors with more publications from countries such as Turkey or Iran, however we considered just top five authors of the countries in this work.
To compare the number of publications and H-indices of the selected top authors from OIC members, their mean ± SD values were illustrated in Figures 4 and 5. The highest mean of publications among top 25 authors belongs to Malaysian authors as shown in Figure 4. Prof. H.K. Fun has published more than 1600 papers which is more than the sum of publications of 10 members of OIC states, i.e. Burkina-Faso, Comoros, Cote d’Ivoir, Djibouti, Guinea-Bissau, Maldives, Mauritania, Somalia, Suriname and Turkmenistan. The second mean value of the number of publications belongs to Turkey, followed by Iran, Saudi Arabia, Egypt, Pakistan and Lebanon. Concerning the qualitative measure of research perfor-mance of the top 25 authors, Iranian authors possess the highest H-index (32.2), followed by authors from
Turkey, Pakistan, Malaysia, Saudi Arabia, Lebanon and Egypt (see Figure 5).
Table 3. Details of top 25 authors of OIC members, and their total number of publications and H-indices
Author Country N H-index
1 Fun, H.K. Malaysia 1677 29 2 Ng, S.W. Malaysia 1485 18 3 Buyukgungor, O. Turkey 623 17 4 Heravi, M.M. Iran 467 27 5 Shafik, A. Egypt 416 23 6 Shamsipur, M. Iran 416 41 7 Haberal, M. Turkey 413 17 8 Dehghan, M. Iran 358 25 9 Yilbas, B.S. Saudi Arabia 346 22 10 Aboul-Enein, H.Y. Saudi Arabia 335 23 11 Ganjali, M.R. Iran 330 43 12 Baser, K.H.C. Turkey 328 24 13 Demirbas, A. Turkey 328 37 14 Hayat, T. Pakistan 325 33 15 Yavari, I. Iran 316 25 16 Choudhary, M.I. Pakistan 302 21 17 Yagci, Y. Turkey 295 27 18 Chantrapromma, S. Malaysia 294 17 19 Ghoneim, M.A. Egypt 245 28 20 Ahmad, V.U. Pakistan 238 16 21 Morsy, T.A. Egypt 232 9 22 Ali, S. Pakistan 231 18 23 Abuelma'atti, M.T. Saudi Arabia 230 18 24 Bhutta, Z.A. Pakistan 223 34 25 Baraka, A. Lebanon 217 20
Fig. 4. The mean ± SD of the number of published articles by top 25 authors of OIC members.
298377
217
1152
264 304397
0
200
400
600
800
1000
1200
1400
1600
1800
2000
Egypt (N=3) Iran (N=5) Lebanon (N=1) Malaysia (N=3) Pakistan (N=5) Saudi Arabia (N=3)
Turkey (N=5)
Mea
n of
tot
al n
umbe
r of
art
icle
s
OIC member (N: Number of included authors)

| 117 BioImpacts, 2012, 2(2), 111-122 Copyright © 2011 by Tabriz University of Medical Sciences
Research performances of OIC members
Fig. 5. The mean ± SD of H-indices of top 25 authors of OIC members.
Top journals publishing OIC members’ articles The collected data of top 5 journals for each country was analyzed and sum of the articles published in these jour-nals along with the impact factors of the journals were listed in Table 4. “Saudi Medical Journal” with the impact factor of 0.510 was the leading journal publishing more than 3783 papers by authors of OIC members. “Transactions of the Royal Society of Tropical Medicine and Hygiene” was the leading journal among top 25 journals concerning the qualitative measure with impact factor of 2.553. Considerable number of journals (N=11) have no impact factor. Table 5 listed details of top five journals publishing articles from top five countries of OIC in which “Applied Mathematics and Computation” is the most qualified journal from impact factor point of view followed by “Journal of Applied Polymer Science” and “Archive of Iranian Medicine”. In addition to these jour-nals, the number of publications in “Nature” is one of the indicators of university ranking systems (Docampo 2011). To provide brief information, the number of articles of the top five OIC countries were extracted and listed in the last column of Table 5. Interestingly, Nigeria with 191 articles is the leading country among
OIC members followed by Egypt, Malaysia, Turkey and Iran. Table 4. Names of top 25 journals, the number of articles published in these journals from OIC members and their available impact factors
Journal N IF
1 Saudi Medical Journal 3783 0.510 2 Acta Crystallographica Section E Structure Reports Online 3724 0.411 3 Journal of the College of Physicians and Surgeons Pakistan 2603 NA 4 Journal of the Pakistan Medical Association 2398 NA 5 Medical Journal of Malaysia 2109 NA 6 Annals of Saudi Medicine 2085 0.550 7 Tunisie Medicale 1810 NA 8 Turkish Journal of Veterinary and Animal Sciences 1721 0.342 9 Pakistan Journal of Botany 1635 0.520 10 Journal of Applied Sciences 1626 NA 11 Journal of the Egyptian Society of Parasitology 1405 NA 12 Turkish Journal of Pediatrics 1388 0.333 13 African Journal of Medicine and Medical Sciences 1340 NA 14 African Journal of Biotechnology 1325 0.565 15 East African Medical Journal 1312 NA 16 Applied Mathematics and Computation 1242 1.124 17 Desalination 1212 2.034 18 Pakistan Journal of Biological Sciences 1191 NA 19 Turkish Journal of Medical Sciences 1170 0.163 20 Anadolu Kardiyoloji Dergisi 1156 0.378 21 Chemistry of Natural Compounds 1130 0.572 22 Transactions of the Royal Society of Tropical Medicine and Hygiene 1052 2.553 23 Turkish Journal of Gastroenterology 1026 0.484 24 Aip Conference Proceedings 960 NA 25 West African Journal of Medicine 958 NA
Table 5. List of top five journals publishing the articles of top five countries of OIC, the number of published articles (N), the available impact factor of journals (IF) and number of publications in Nature
Country 1st journal 2nd journal 3rd journal 4th journal 5th journal Nature
Turkey Turkish Journal of Veterinary and Animal Sciences (N=1721, IF=0.342)
Turkish Journal of Pediatrics (N=1388, IF=0.333)
Turkish Journal of Medical Sciences (N=1170, IF=0.163)
Anadolu Kardiyoloji Dergisi (N=1156, IF=0.378)
Turkish Journal of Gastroenterology (N=1026, IF=0.484)
61
Iran Pakistan Journal of Biological Sciences (N=1191)
Journal of Applied Sciences (N=857)
Archives of Iranian Medicine (N=822, IF=0.874)
Asian Journal of Chemistry (N=773, IF=0.213)
Applied Mathematics and Computa-tion (N=656, IF=1.124)
40
Egypt Journal of the Egyptian Society of Parasitol-ogy (N=1405)
Journal of Applied Polymer Science (N=733, IF=1.203)
Pharmazie (N=724, IF=0.812) AEJ Alexandria Engineering Journal (N=650)
Applied Mathematics and Computa-tion (N=586, IF=1.124)
126
Malaysia Acta Crystallographica Section E Structure Reports Online (N=2623, IF=0.411)
Medical Journal of Malaysia (N=2109)
Singapore Medical Journal (N=730)
Journal of Applied Sciences (N=630)
Aip Conference Proceedings (N=626)
86
Nigeria African Journal of Medicine and Medical Sciences (N=1340)
African Journal of Biotechnology (N=1325, IF=0.565)
West African Journal of Medi-cine (N=882)
East African Medical Journal (N=825)
Tropical Doctor (N=485, IF=0.399) 191
20
32.2
2021.33
24.4
21
24.4
0
5
10
15
20
25
30
35
40
45
Egypt (N=3) Iran (N=5) Lebanon (N=1) Malaysia (N=3) Pakistan (N=5) Saudi Arabia (N=3)
Turkey (N=5)
Mea
n of
H-in
dice
s
OIC member (N: Number of included authors)

118 |
Khoubnasabjafari et al
BioImpacts, 2012, 2(2), 111-122 Copyright © 2011 by Tabriz University of Medical Sciences
Top universities of OIC members Table 6 listed the details of top 25 universities of the Muslim world concerning the total number of published articles. “Hacettepe Universitesi” is the leading one followed by “University of Tehran” and others. The percent of contributions of these 25 universities varied between 0.54 and 1.67 and the total percent of contribu-tion of these universities was 23.88 among published articles from all OIC members. The number of universities within 25 top universities from Turkey, Iran, Egypt, Malaysia, Saudi Arabia, Nigeria and Lebanon were 5, 5, 5, 4, 3, 2 and 1, respectively. The percent of contributions of these seven countries in publishing 230419 articles (of 25 top universities) were 26.80, 21.46, 18.36, 15.88, 9.53, 5.63 and 2.34 respectively.
Table 6. List of top 25 universities of OIC members Country University Total No.
of articles % of
contribution % of total
contribution
1 Turkey Hacettepe Üniversitesi 16082 6.98 1.67 2 Iran University of Tehran 14253 6.19 1.48 3 Turkey Orta Dogu Teknik Üniversitesi 13025 5.65 1.35 4 Malaysia University of Malaya 12109 5.26 1.25 5 Turkey Ankara Üniversitesi 11611 5.04 1.20 6 Egypt Cairo University 10843 4.71 1.12 7 Turkey Istanbul Teknik Üniversitesi 10800 4.69 1.12 8 Egypt Ain Shams University 10405 4.52 1.08 9 Iran Daneshgahe Azad Eslami 10384 4.51 1.08 10 Turkey Istanbul Üniversitesi 10228 4.44 1.06 11 Egypt National Research Center, Cairo 9672 4.20 1.00 12 Iran Sharif University of Technology 9584 4.16 0.99 13 Malaysia Universiti Sains Malaysia 9235 4.01 0.96 14 Saudi Arabia King Fahd University of
Petroleum and Minerals 9194 3.99 0.95
15 Malaysia Universiti Putra Malaysia 8423 3.66 0.87 16 Iran Tehran University of Medical
Sciences 8005 3.47 0.83
17 Nigeria University of Ibadan 7774 3.37 0.81 18 Saudi Arabia King Saud University 7557 3.28 0.78 19 Iran Daneshgahe Tarbiat Modares 7219 3.13 0.75 20 Malaysia Universiti Kebangsaan Malaysia 6818 2.96 0.71 21 Egypt Alexandria University 5749 2.50 0.60 22 Egypt Assiut University 5636 2.45 0.58 23 Lebanon American University of Beirut 5398 2.34 0.56 24 Saudi Arabia King Faisal Specialist Hospital
and Research Centre 5219 2.27 0.54
25 Nigeria Obafemi Awolowo University 5196 2.26 0.54
230419 100.00 23.88
Relative frequency of publications of OIC members
Concerning the frequencies of the languages of the published documents indexed in ScopusTM, English language is the first ranked language (93.96 %) followed by French (2.77 %), Turkish (2.39 %), Russian (0.26 %), German (0.24 %), Arabic (0.13 %), Persian (0.09 %) and other languages (0.16 %). This pattern is slightly different from the global pattern of the ranks of Russian, German, French and Spanish languages as the 2nd to 5th rank as reported by Osareh and Wilson (2000). French language documents were published mainly by the researchers of the countries which were a part of French colonies in the past including Tunisia (with 8289 docu-ments), Morocco (6084), Senegal (2879), Algeria (2178) and Cameron (1012). Mainly researchers from Turkey
published Turkish documents. Russian language publications were mainly from the ex-members of USSR including Azerbaijan (966), Uzbekistan (807), Kazakhstan (543), Tajikistan (97) and Turkmenistan (25). German language documents were published mainly by Arab countries and the top five countries publishing the highest numbers in German as the second rank language include Egypt (379), Indonesia (114), United Arab Emirates (33), Iraq (29) and Sudan (19). Arab and Iranian researchers mainly published Arabic and Persian languages documents. Careful review of the scientific documents from medieval centuries reveals that Arabic and Persian languages were the language of science on that era (El-Rouayheb 2006). However, now they are just used in very limited geographical areas. It should be noted that Arabic language was also used to report the scientific findings by non-Muslim scholars in the past (as examples see Leiser (1983) and Sarton (1927)). Further investigation using “Language search” of ScopusTM, reveals that the numbers of journals published in Turkish, Persian and Arabic languages which were indexed in the ScopusTM are ~160, ~ 25 and ~ 50. This could be a main reason for the low number of articles indexed in the ScopusTM written in these languages. It seems that there is also a problem with the indexing system of the languages with the ScopusTM database, as “Tehran University Medical Journal”, “Koomesh”, “Iranian Journal of Endocrinology and Metabolism”, “Pharmaceutical Sciences”, “Journal of Babol University of Medical Sciences”, “Iranian Journal of Obstetrics Gynecology and Infertility”, “Iranian Jour-nal of Pediatrics” and some others are publishing in Persian language however they were indexed as Arabic journals in the ScopusTM.
Subjective and document type analyses of OIC members Analysis of the published documents concerning the top five subjects for each state reveal that medicine is the first ranked subject for the majority of OIC states. Engineering is the second rank subject concerning the number of publications. Engineering was the first rank for Algeria and Iran. Physics and astronomy was the first rank subject of ex-members of USSR, i.e. Azerbaijan, Kazakhstan, Kyrgyz and Uzbekistan. Document type analysis of the publications of OIC members showed that the majority of the publications were in the form of “Article” (80.78 %) followed by “Conference paper” (10.65 %), “Review” (3.38 %), “Letter” (3.37 %) and “Article in press” (1.73 %).
Discussion
The number of papers published by the authors of a country is one of the most important indices representing the national intention toward science and technology.

| 119 BioImpacts, 2012, 2(2), 111-122 Copyright © 2011 by Tabriz University of Medical Sciences
Research performances of OIC members
Research is the first step in the process of science-technology and production, and the higher number of publication could not be resulted in achieving high technology and better quality of the products and other factors could affect this process. The progresses made in the scientific publications of the OIC members are investigated in this report and the findings are in agreement with the comprehensive investigation on leading scientists and engineers of OIC in which the number of included scientists from Turkey, Pakistan, Iran, Egypt, Malaysia, Saudi Arabia and Morocco were 81, 62, 55, 45, 27, 22 and 18 respectively (Naim 2008). Findings of this study reveal that the number of publications increased with different patterns among OIC members. There is an increased pattern in the number of publications around the world and this is due to a number of parameters including:
• Increased number of the scientific periodicals around the world (Testa 2008)
• Facilitated communications, review and publication processes of the articles using Internet.
• Providing more comprehensive indexing databases and their efforts to index more and more periodicals.
This increased pattern has been observed for the authors of OIC members as well as EU members. The number of papers published by the authors of top 20 Muslim coun-tries indexed in “Science Citation Index (SCI)” between 1990 and 1994 was compared (Anwar and Abu Bakar 1997). Although ScopusTM covers more journals when compared with SCI, however the ranks of the countries in both databases could be compared. Figures 6 and 7 compared the percent of contribution of a number of OIC members among all Muslim countries collected from Anwar and Abu Bakar report (1997).
Fig. 6. Percent of contribution of a number of OIC members in the publications of OIC during 1990-1994.
Fig. 7. Percent of contribution of a number of OIC members in the publications of OIC during 2006-2010.
17.5
14.6
9.2
7.6
4.3 4.1 4.13.4 3.1
2.6 2.5 2.4 2.1 2.1 2.1
0
2
4
6
8
10
12
14
16
18
20
Perc
ent o
f con
trib
utio
n in
pap
ers
of M
uslim
wor
ld
Papers of 1990-1994, data taken from Anwar and Abu Bakar, 1997
27.0
19.4
8.06.9
5.23.9 3.7 3.6
2.3 2.0 1.9 1.9 1.6 1.6 1.5
0
5
10
15
20
25
30
Perc
ent o
f con
trib
utio
n in
pap
ers
of M
uslim
wor
ld
Papers of 2006-2010, from this work

120 |
Khoubnasabjafari et al
BioImpacts, 2012, 2(2), 111-122 Copyright © 2011 by Tabriz University of Medical Sciences
Turkey was the leading country with nearly 12 percent increase in the contribution among publications which was the second rank in the previous study. The highest increase in the percent of contribution (17) was observed for Iran which jumped from the 12th rank to the 2nd position among OIC members. The highest decrease (-10.6) was shown for Egypt which dropped the position from the first rank to the fourth rank. These findings are in agreement with previous results (Moin et al 2005). Similar pattern was observed for the contribution of EU members for the number of articles published between
2006 and 2010 as shown in Figure 8. Concerning the increased number of articles of the authors of OIC and EU members, the increase rate of EU members is more than that of OIC members as shown in Figure 9. One of the possible reasons for this higher rate of EU members is publishing and indexing more scientific journals by European countries. According to Testa (2008), 700 new regional journals were added to Web of Science in which 364 journals were published by EU countries and 50 journals were published by the Middle East and African countries.
Fig. 8. Percent of contribution of a number of EU members in the publications of EU during 2006-2010.
Fig. 9. The growth rates of publications of EU and OIC members between 2006 and 2010.
18.6
16.9
12.5
10.1
8.3
5.7
3.7 3.5 3.22.2 2.2 2.1 2.0 1.7 1.6
0
2
4
6
8
10
12
14
16
18
20
Perc
ent o
f con
trib
utio
n in
pap
ers
of E
urop
ean
auth
ors
Papers of 2006-2010, from this work
EU:y = 33364x - 7E+07
R2 = 0.97
OIC:y = 11949x - 2E+07
R2 = 0.97
0
100000
200000
300000
400000
500000
600000
700000
800000
2005 2006 2007 2008 2009 2010 2011Year of publication
Num
ber o
f art
icle
s pe
r yea
r
| 121 BioImpacts, 2012, 2(2), 111-122 Copyright © 2011 by Tabriz University of Medical Sciences
Research performances of OIC members
Some OIC members are more active in a discipline and could assist other members by training their researchers. The rate of cooperation between OIC members is very low when compared with the cooperation with non-OIC members. As an example, in a report, 582 joint papers published by Iranian and researchers from 47 other nations, the relative frequency with co-authors from USA, UK, Canada and Australia were 20.10%, 15.29%, 14.26% and 8.42%, respectively. The sum of the corres-ponding values for 7 OIC members was 4.12% (Moin et al 2005). A number of possible reasons could be considered for lower contributions of OIC researchers including: • Limited numbers of regional journals were indexed
in databases like Web of Science or ScopusTM. As an example the number of Iranian journals indexed in Web of Science in 2005 was three (Moin et al 2005) now increased to 45 (Magiran).
• Low investment in research as it is evident from very small percent of GDP spent in research (Malekzadeh et al 2002).
• Language quality of the manuscripts sent for review processes and its effect on the overall judgment of the reviewers. Weisinger and Bellorin (1999) reported higher rate of the accepted abstracts from the third world countries in comparison to the full articles. The authors claimed that this is because of the low English quality of the submissions.
• Brain drain from OIC members mainly to North America, Europe or Australia, because of inade-quate working conditions and facilities in most of OIC countries (Rizvi 2005, de la Croix and Docquier 2011).
• Possible bias in the review process of the submis-sions (Primack et al 2009, Opthof et al 2002).
To improve the contributions of OIC members, the publishers of OIC members should try to index more publications in ScopusTM and other databases. This will increase their contributions in the knowledge production. Publishing the articles in bi-lingual journals could be another source to increase the contribution, since the articles published in Turkish, Persian or Arabic languages are only could be read by the native readers of these languages. When these articles are published in English language, they could cover more readers which will be resulted in more citations etc. The cooperation between OIC members could accelerate their develop-ment processes and improve the related indices and publishing peer review journals under supervision of OIC scientific committee is recommended to facilitate the process of scientific contribution from Islamic world. Providing English language editing services to the authors for assisting them to improve the quality of written style will increase the rate of acceptance and
citation of the articles from OIC members, since all these countries are used English language as the second and even third or fourth language. Student and academic staff programs could facilitate the collaborations among OIC members.
Conclusion As a conclusion, Muslims should keep in mind that “Verily God will not change the condition of men, till they change what is in themselves” (Holy Quran, 13:11). In recent years, a number of global issues such as “Talebanism”, “Fight against terrorism”, “Domestic conflicts”, “Conflicts among OIC members”, etc. are more influencing problems of the Muslim world which affect their research performance. In spite of media propaganda, majority of Muslims are trying to provide modern and developed societies to live in peace and justice with other religions and nations around the world. Ethical issues Not applicable in this research. Conflict of interests Authors declared no conflicts of interests. References Abramo G, D’Angelo CA and Solazzi M. 2009. Assessing public–private research collaboration: Is it possible to compare university performance? Scientometrics, 84, 173-197. Alewell K. 1990. Criteria for performance profiles of departments and universities. Scientometrics, 19, 337 – 347. Anwar MA and Abu Bakar AB. 1997. Current state of science and technology in the Muslim world. Scientometrics, 40, 23-44. Azizi MH, Raees-Jalali GA and Noroozi H. 2009. A brief history of the publication of biomedical journals in Iran between 1901 and 1979. Arch Iran Med, 12, 204-211. Benamer HTS and Bakoush O. 2009. Arab nations lagging behind other Middle Eastern countries in biomedical research: A comparative study. BMC Med Res Method, 9, 26. de la Croix D and Docquier F. 2011. Do brain drain and poverty result from coordination failure? J Econ Growth, in press. Docampo D. 2011. On using the Shanghai ranking to assess the research performance of university systems. Scientometrics, 86, 77-92. El-Rouayheb K. 2006. Opening the gate of verification: The forgotten Arab-Islamic florescence of the 17th century. Int J Middle East Studies, 38, 263-281. Ellwein LB, Khachab M and Waldman RH. 1989. Assessing research productivity: evaluating journal publication across academic departments. Acad Med, 64, 319-325. Fakhree MAA and Jouyban A. 2011. Scientometric analysis of the major Iranian medical universities. Scientometrics, 85, 205-220.

122 |
Khoubnasabjafari et al
BioImpacts, 2012, 2(2), 111-122 Copyright © 2011 by Tabriz University of Medical Sciences
Gokceoglu C, Okay AI and Sezer E. 2008. International earth science literature from Turkey – 1970-2005: Trends and possible causes. Scientometrics, 74, 409-423. Kaplan P, Mysiw WJ and Pease WS. 1992. Academic productivity in physical medicine and rehabilitation. Am J Phys Med Rehabil, 71, 81-85. Leiser G. 1983. Medical education in Islamic lands from the seventh to the fourteenth century. J History Med Allied Sci, 38, 48-75. Lindsay DD. 1951. Pure and applied research. Br Med J, 2, 1343-1344. Magiran: http://www.magiran.com, Accessed on 10th Sept 2011. Malekzadeh R, Mokri A and Azarmina P. 2002. The current status of medical sciences in Iran. Science and Technology Development in Iran. TWAS 12th General Meeting. Tehran, Iran. In: Science and Technology in Iran. Ministry of Science, Research and Technology. Islamic Republic of Iran, pp. 139-157. Mehrdad M, Heydari A, Sarbolouki MN and Etemad S. 2004. Basic science in the Islamic Republic of Iran. Scientometrics, 61, 79-88. Moed HF. 2007. UK research assessment exercise: Informed judgments on research quality or quantity. Scientometrics, 74, 153-161. Moin M, Mahmoudi M and Rezaei N. 2005. Scientific output of Iran at the threshold of the 21st century. Scientometrics, 62, 239-248. Naim STK. Leading scientists and engineers of OIC member states, COMSTECH publication, 2008, Available online at: http://comstech.org/LeadingScientists.aspx, Accessed on 10th Sept 2011. Opthof T, Coronel R and Janes MJ. 2002. The significance of the peer review process against the background of bias: Priority ratings of reviewers and editors and the prediction of citation, the role of geographical bias. Cardivas Res, 56, 339-346. Osareh F and Wilson CS. 2000. A comparison of Iranian scientific publications in the Science Citation Index: 1985-1989 and 1990-1994. Scientometrics, 48, 427-442. Primack PB, Ellwood E, Miller-Rushing AB, Marrs R and Mulligan A. 2009. Do gender, nationality, or academic age affect review decision? An analysis of submissions to the journal Biological Conversation. Biol Conver, 142, 2415-2418. Rizvi F. 2005. Rethinking “brain drain” in the era of globalization. Asia Pacific J Edu, 25, 175-192. Sarton G. 1927. Introduction to the history of science, Vol. 1, Washington, Caregie Institute of Washington. Sotudeh H. 2010. Are Iranian scientists recognized as their productivity enhances? A comparison of Iran's impact to global norms in different subfields of Science Citation Index during 2002-2005. Scientometrics, 83, 39-54. Testa J. 2008. A regional perspective on science. A report available from http://science.thomsonreuters.com/news/2008-07/8465003, Accessed on 10th Sept 2011. Torres-Salinas D, Lopez-Cózar ED and Jiménez-Contreras E. 2008. Ranking of departments and researchers within a
university using two different databases: Web of Science versus Scopus. Scientometrics, 80, 761-774. Weisinger JR and Bellorin-Font E. 1999. Latin American nephrology: Scientific production and impact of the publication. Kidney Int, 56, 1564-1590. Yurtsever E and Gulgoz E. 1999. The increase in the rate of publications originating from Turkey. Scientometrics, 46, 321-336.