research report 182 - health and safety · pdf fileanalysis techniques, ... konstantinos...
TRANSCRIPT
HSEHealth & Safety
Executive
Learning from incidents involving E/E/PE systems
Part 3 - Guidance examples and rationale
Prepared by Adelard for the Health and Safety Executive 2003
RESEARCH REPORT 182

HSEHealth & Safety
Executive
Learning from incidents involving E/E/PE systems
Part 3 - Guidance examples and rationale
PG Bishop, LO Emmet, Adelard LLP
C Johnson University of Glasgow
This report is the third of 3 parts presenting the results of an HSE-sponsored research project. The overall purpose is to create a scheme for learning from incidents that involve electrical, electronic or programmable electronic (E/E/PE) systems. Part 1 reviews existing learning processes and causal analysis techniques, examines industry practice and makes recommendations for a new scheme. Part 2 presents the recommended scheme and Part 3 (this report) gives accompanying guidance, examples and rationale.
This report and the work it describes were funded by the Health and Safety Executive (HSE). Its contents, including any opinions and/or conclusions expressed, are those of the authors alone and do not necessarily reflect HSE policy.
HSE BOOKS

© Crown copyright 2003
First published 2003
ISBN 0 7176 2790 X
All rights reserved. No part of this publication may bereproduced, stored in a retrieval system, or transmitted inany form or by any means (electronic, mechanical,photocopying, recording or otherwise) without the priorwritten permission of the copyright owner.
Applications for reproduction should be made in writing to: Licensing Division, Her Majesty's Stationery Office, St Clements House, 2-16 Colegate, Norwich NR3 1BQ or by e-mail to [email protected]
ii

ACKNOWLEDGEMENTS
Adelard LLP wishes to acknowledge numerous invaluable contributions to the project from the following people: Chris Johnson (Glasgow University), Bill Black (Blacksafe Consulting), Mark Bowell (HSE), Konstantinos Tourlas (Adelard), Viv Hamilton (Viv Hamilton Associates), Floor Koornneef (Technical University of Delft).
iii

iv
EXECUTIVE SUMMARY
This report is the third of 3 parts presenting the results of an HSE-sponsored research project. The overall purpose is to create a scheme for learning from incidents that involve electrical, electronic or programmable electronic (E/E/PE) systems. Part 1 reviews existing learning processes and causal analysis techniques, examines industry practice and makes recommendations for a new scheme. Part 2 presents the recommended scheme and Part 3 (this report) gives accompanying guidance, examples and rationale.
Typical barriers to adoption of any new learning scheme are lack of motivation for the participants, lack of perceived benefits, the implementation cost and the scheme complexity. Participants will be motivated and understand benefits if they are involved in defining the goals of the scheme and its design, and if they are notified of investigation results for incidents they reported and of changes achieved through the scheme. Maximum cost effectiveness and simplicity is attained through building incrementally on existing safety and quality management systems. Only information that is essential for the scheme’s identified goals should be recorded and analysed.
Three possible stages of implementation are identified (Stages A, B and C). The most important factor in deciding which stage is appropriate for any particular organisation is the organisation’s current learning capability. Further customisation will depend on the objectives of the scheme, available resources and existing infrastructure.
Example objectives are to reduce workplace injuries, production losses, environmental damage or cost and time overruns, to improve product quality or to collect data to demonstrate to customers that products are sufficiently reliable (ie that they are “proven in use”).
Roles in a learning scheme include the incident reporter, prioritiser, investigator, decisionmaker, implementor, archiver and the overall scheme manager.
Stage A consists of a simple incident reporting process with some local analysis of incident causes to identify immediate workplace improvements. It will generally involve only operators, supervisors and a safety manager, all at a local level. Any E/E/PES equipment involved is identified and noted but no specialist E/E/PES investigation occurs.
Stage B involves different departments in a larger company, involving operators, supervisors, production and engineering management. There may be a set of pre-defined rules to decide the extent to which incidents should be analysed. Analysis looks at root causes and can involve specialist E/E/PES investigation, perhaps using detailed checklists. Incidents are stored in a database which is periodically reviewed to compile performance reports, identify trends for further investigation and track recommendations. Users may choose to notify equipment suppliers and even involve them in larger investigations.
Stage C adds dissemination and listening functions to existing schemes, through supply chains, across separate sites for a large company, and with wider industry bodies.
A case study for an incident involving E/E/PE systems on an offshore production vessel illustrates reporting, information gathering, detailed causal analysis and generating recommendations. A two tier approach to causal analysis is demonstrated, the first using the PARC flowchart and the second employing barrier and change analysis and events and causal factor charting.
v

vi
CONTENTS
1 INTRODUCTION ...................................................................................................1
2 ADOPTION ISSUES .............................................................................................22.1 Motivation ..............................................................................................................22.2 Lack of perceived benefit.......................................................................................2 2.3 Cost.......................................................................................................................3 2.4 Complexity.............................................................................................................42.5 Wider process issues ............................................................................................4
3 APPROACHES TO IMPLEMENTING THE SCHEME ...........................................53.1 Staged implementation ..........................................................................................53.2 Current capability of the organisation.....................................................................6 3.3 Customisation of the scheme.................................................................................73.4 Supply chain infrastructure ..................................................................................11
4 EXAMPLES OF INCIDENT REPORTING ...........................................................124.1 Stage A ...............................................................................................................124.2 Stage B ...............................................................................................................164.3 Stage B E/E/PES extensions ...............................................................................21 4.4 Stage C ...............................................................................................................28
5 CONCLUSIONS ..................................................................................................31
REFERENCES............................................................................................................32
APPENDIX A CASE STUDY ILLUSTRATING DETAILED CAUSALANALYSIS..................................................................................................................33A.1 Summary.............................................................................................................33A.2 Introduction..........................................................................................................33 A.3 Elicitation and information gathering ....................................................................37 A.4 Causal analysis ...................................................................................................44 A.5 Generating recommendations..............................................................................59 A.6 Conclusions.........................................................................................................61A.7 References ..........................................................................................................61
APPENDIX B ASSESSMENT OF COMPLIANCE TO SCHEME REQUIREMENTS .......................................................................................................62B.1 Operational environment .....................................................................................62 B.2 Client community .................................................................................................62B.3 Specialisation for E/E/PES ..................................................................................62B.4 Scheme design....................................................................................................64B.5 HSE data consistency requirements ....................................................................65B.6 Scheme implementation ......................................................................................65B.7 References ..........................................................................................................66
vii
APPENDIX C SCHEME RATIONALE........................................................................67C.1 Scope of scheme.................................................................................................67 C.2 Adoption issues ...................................................................................................67 C.3 Classification scheme..........................................................................................67C.4 Causal analysis approach....................................................................................68 C.5 References ..........................................................................................................69
APPENDIX D COMPARISON AND EVALUATION OF CAUSAL ANALYSISTECHNIQUES FOR E/E/PES .....................................................................................70D.1 Introduction..........................................................................................................70 D.2 Rationale for the evaluation matrix ......................................................................70 D.3 Barrier analysis....................................................................................................70D.4 Change analysis ..................................................................................................70 D.5 Timelines.............................................................................................................72D.6 Accident fault trees ..............................................................................................72 D.7 Events and causal factors charting ......................................................................72 D.8 MORT..................................................................................................................73D.9 PRISMA ..............................................................................................................73D.10 TRIPOD .............................................................................................................73D.11 STAMP ..............................................................................................................73D.12 WBA ..................................................................................................................74D.13 CAE ...................................................................................................................74D.14 Summary ...........................................................................................................74D.15 References ........................................................................................................74
APPENDIX E WIDER ISSUES OF LEARNING IN ORGANISATIONS ......................76
viii

FIGURES
Figure 1 Implementation stages in learning from incidents ...........................................5 Figure 2 Capability evaluation ......................................................................................6 Figure 3 Example incident report................................................................................13 Figure 4 Example incident analysis report for Stage A ...............................................14 Figure 5 Example “How to” record..............................................................................15Figure 6 Example incident timeline.............................................................................18 Figure 7 Example hazard and target indentification ....................................................18 Figure 8 Example barrier analysis ..............................................................................18 Figure 9 Example problem prevention checklist .........................................................19Figure 10 Example incident analysis report for Stage B .............................................20 Figure 11 Example equipment problem sheet ............................................................22Figure 12 Example e-mail to supplier .........................................................................23Figure 13 Example equipment problem report............................................................23 Figure 14 Example e-mail response from supplier......................................................24 Figure 15 Example supplier checklist .........................................................................25Figure 16 Example user problem prevention checklist................................................27Figure 17 Example E/E/PES problem prevention recommendations ..........................28 Figure 18 Example dissemination e-mail ....................................................................29Figure 19 Example notification e-mail.........................................................................29Figure 20 Example newsletter report..........................................................................30Figure A.1 High-level architecture of the case study E/E/PES ....................................34Figure A.2 Overview of investigation schemes ...........................................................36Figure A.3 Initial incident report form..........................................................................38 Figure A.4 Causal analysis flowchart..........................................................................50 Figure A.5 ECF chart showing end-user perspective..................................................52Figure A.6 ECF chart showing developer/system integrator information.....................54 Figure D.1 IEC 61508 requirements coverage of causal analysis techniques.............71
TABLES
Table 1 Potential candidates for roles for a Stage A scheme........................................8 Table 2 Potential candidates for roles for a Stage B scheme........................................8 Table 3 Allocation of roles for example Stage A scheme............................................12Table 4 Allocation of roles for example Stage B scheme............................................16Table 5 Example incident investigation policy.............................................................17Table A.1 Example summary from automated alarm log ............................................42Table A.2 Hazard and target identification..................................................................42 Table A.3 More detailed barrier analysis ....................................................................43 Table A.4 Change analysis.........................................................................................43 Table A.5 IEC 61508 end user taxonomy ...................................................................46 Table A.6 Abridged flow chart summary .....................................................................49Table A.7 Cause/contextual factor summary ..............................................................55Table A.8 Abridged IEC 61508 causal summary ........................................................56 Table A.9 Full IEC 61508 causal summary.................................................................58 Table A.10 Recommendations summary....................................................................60
ix

x
1 INTRODUCTION
This report is the third of 3 parts presenting the results of an HSE-sponsored research project. The overall purpose is to create a scheme for learning from incidents that involve electrical, electronic or programmable electronic (E/E/PE) systems.
Part 1 reviews existing learning processes and causal analysis techniques, examines industry practice and makes recommendations for a new scheme. The project used these results to produce a draft new scheme [1]. The draft was subjected to review through an industry workshop, internal Adelard evaluation and four half-day interviews with two end users, a system supplier and a component supplier [2]. Part 2 presents the recommended scheme derived from this review process. Part 3 (this report) gives accompanying guidance, examples and rationale.
The report consists of:
· A discussion on barriers to the adoption of the scheme and general strategies for overcoming them (Section 2).
· Guidance on implementing learning from incidents for any specific organisation based on a simple organisational learning “maturity” model (Section 3). This includes:
· a self-assessment method to identify and characterise the current learning maturity of an organisation seeking to apply the scheme, and
· suggestions for an incremental adoption path based on likely benefit at different levels of “maturity”.
· Examples of possible implementations of incident handling systems at different capability levels (Section 4).
· A case study illustrating reporting, information gathering, detailed causal analysis and generating recommendations for an incident involving E/E/PE systems on an offshore production vessel (Appendix A).
· An assessment of the scheme against the requirements identified in Part 1 (Appendix B).
· A discussion of rationale for the main constituents of the scheme (Appendix C).
· A brief evaluation of the causal analysis techniques described in Appendix A of Part 1, showing how the detailed analysis techniques recommended in the scheme were selected (Appendix D).
· A discussion of some of the wider and long term issues surrounding learning from incidents that should be considered by higher maturity organisations (Appendix E).
1

2 ADOPTION ISSUES
It has to be recognised that there is likely to be resistance to any new scheme introduced in an organisation. Typical barriers to adoption are:
· lack of motivation for the participants,
· lack of perceived benefits for the scheme,
· cost in implementing and running the scheme,
· complexity of the scheme.
These issues are discussed in the following sections.
2.1 MOTIVATION
The participants in the scheme (incident data providers, analysts, and users of analysis results) need to be motivated to participate. To improve motivation, we recommend that:
· The stakeholders are fully involved in defining the scheme so they have a feeling of ownership, ie they have a role in:
· defining the goals of the scheme,
· adapting the scheme to local conditions.
· The incident reporters and analysts are given feedback to show their contributions are valued. For instance one company used the local intranet to report the outcome of every reported incident. “Softer” methods of feedback can also be effective, such as the use of staff briefings to report the outcome of reported incidents and to congratulate the reporters for their contribution.
· Participants should not be penalised for reporting incidents (especially their own mistakes). Management should encourage an open culture where mistakes are viewed as an opportunity for learning. A company that penalises its participants is unlikely to learn anything useful.
2.2 LACK OF PERCEIVED BENEFIT
The scheme has to be seen to have some effect by its stakeholders. Feedback of changes and improvements can help to generate a positive attitude. The scheme should be linked to some identifiable outcome. This could just be records of improvements to workplace practice and equipment, or it could be related to measures of company safety and performance (eg downtime, safety shutdowns, days off for injury or number of severe injuries).
It should be noted that when a new learning scheme is instituted, the frequency of incidents often increases. This does not mean that the company has suddenly become less safe or less productive—it is simply that there is less under-reporting. For example, one company found that the number of minor injuries increased when a new incident reporting scheme was introduced, but this declined over time along with the number of severe injuries.
Performance indicators should be fed back to staff, eg as trend charts. Department improvements can also be recognised, eg by annual awards.
2

2.3 COST
It is important to minimise the cost and complexity of implementing the scheme. The general rules here is to seek “maximum gain for pain” by focusing on the key areas of concern and keeping the scheme as simple as possible. Some examples are given below.
2.3.1 Make maximum use of the existing infrastructure
By building on an existing infrastructure, the costs of implementing the scheme are reduced and there is less dislocation to existing working practices. For example:
· If there is a well-established e-mail system, a simple reporting scheme can be based on emails that can be archived for later reference.
· If there is an existing quality management system, then existing forms (eg defect or problem report forms) and processes can be used to record and track incidents and their resolution.
· If there is an existing incident reporting scheme, the extensions should be adapted to fit in with the existing scheme.
· If there is a widely available IT infrastructure, this can be used for archiving, analysis and dissemination of experience.
· If there is an existing system for equipment maintenance, this might be adapted to record and track E/E/PES technical problems.
2.3.2 Tailor the scheme to meet company objectives
To maximise gain, the scheme needs to make a positive contribution to the organisation’s operations. Possible candidates for the incident reporting are:
· work place injuries,
· production and asset losses.
· environmental damage (pollution etc),
· “near misses” for the candidate incidents above.
2.3.3 Early payback
It is important for the management and participants to see that the scheme is having some actual effect on the organisation. Schemes that appear to be resource and information “black holes” will not be actively supported over the long term. The implementation should therefore be structured so that the scheme has visible effects as soon as possible. This is best achieved with an incremental approach that focuses on small changes that can be brought into effect rapidly.
3

2.4 COMPLEXITY
The scheme should be as simple as possible, because complex schemes can de-motivate and confuse the participants. It is therefore desirable to:
· require the minimum information necessary to operate the scheme;
· only ask for information it is possible to provide;
· use meaningful terms and avoid confusing jargon;
· adopt an incremental approach so that the scheme participants are not overwhelmed by a large number of organisational changes.
2.5 WIDER PROCESS ISSUES
There are also wider process issues that can impede learning, including industry fragmentation and lack of relevant competence in user organisations. These issues are discussed in more detail in Appendix E. Some have been addressed in the scheme design – such as aspects that bolster communication along the supply chain. The long-term issues should be considered by higher maturity organisations.
4
3 APPROACHES TO IMPLEMENTING THE SCHEME
As noted in Section 2, there can be many barriers to adopting the scheme or adapting one that already exists. Implementation guidance in the following sections is intended to address these concerns while enabling the organisation to learn relevant lessons from incidents.
3.1 STAGED IMPLEMENTATION
The capability to learn from incidents varies between organisations, and a staged approach to adopting the learning process is recommended. To implement the incident reporting scheme in a specific organisation:
1 Characterise the organisation’s current incident investigation capability.
2 Decide what any new scheme is intended to achieve.
3 Characterise available resources in the organisation.
4 Customise the scheme for the organisation’s capabilities, objectives and infrastructure.
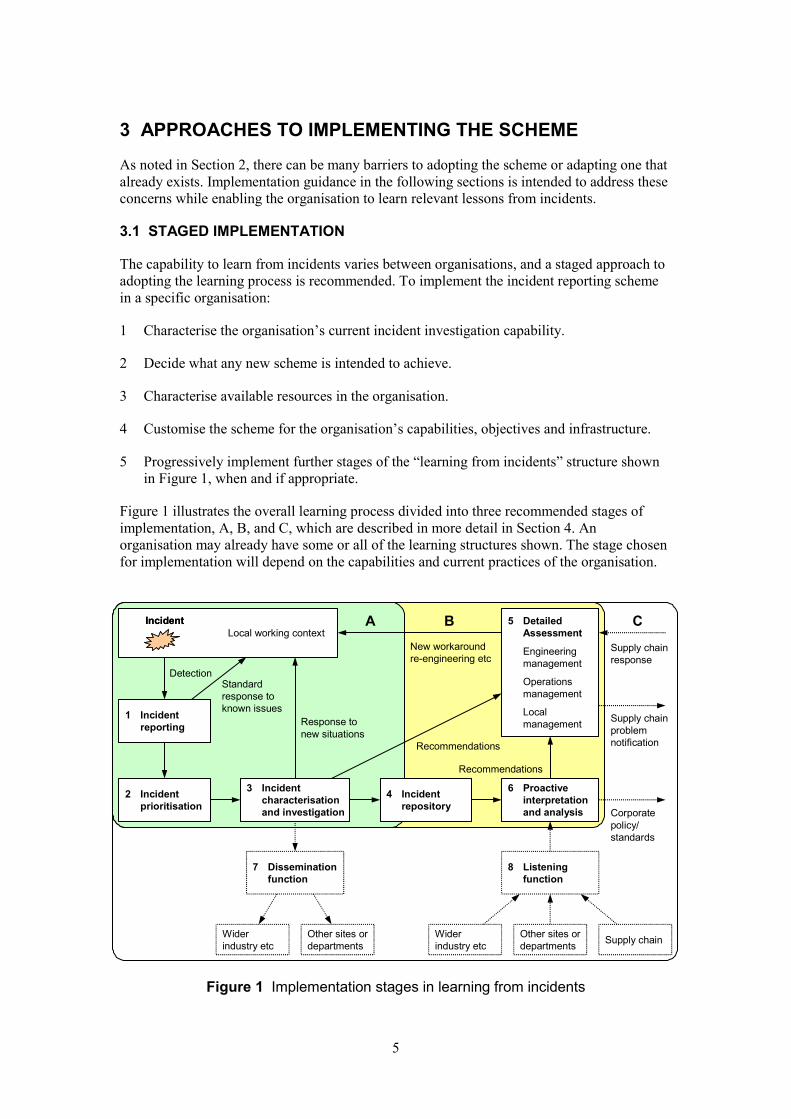
5 Progressively implement further stages of the “learning from incidents” structure shown in Figure 1, when and if appropriate.
Figure 1 illustrates the overall learning process divided into three recommended stages of implementation, A, B, and C, which are described in more detail in Section 4. An organisation may already have some or all of the learning structures shown. The stage chosen for implementation will depend on the capabilities and current practices of the organisation.
IncidentIncidentLocal working context
1 Incident reporting
2 Incident prioritisation
3 Incident characterisation and investigation
4 Incident repository
6 Proactive interpretation and analysis
5 Detailed Assessment
Engineering management
Operations management
Local management
7 Dissemination function
8 Listening function
Other sites or departments
Other sites or departments
Wider industry etc
Wider industry etc Supply chain
Detection Standard response to known issues
Response to new situations
Recommendations
Recommendations
Supply chain response
New workaround re-engineering etc
Supply chain problem notification
Corporate policy/ standards
A B C
Figure 1 Implementation stages in learning from incidents
5

3.2 CURRENT CAPABILITY OF THE ORGANISATION
To determine the stage of incident reporting to be implemented, it is necessary to establish the current capability of the organisation. Figure 2 provides a self-assessment framework. The column that contains the largest number of answers matching the organisation gives the recommended starting stage. Section 4 gives examples of implementation for each stage.
Learning capability – Implementation stage
A B C
Quality infrastructure
What kind of quality q A basic management q A company-specific q An certified quality system is in operation and review system or certified quality system in use (eg ISO
only system in use (eg 9000) ISO 9000)
What is the mechanism q Ad hoc – mostly q Analysis of reported q Periodic review of for improving personal experiences problems incidents processes? and anecdotes Design and operation
standards regularly reviewed
Incident reporting
Is there an incident reporting system in operation?
q Only serious incidents are logged, RIDDORnotifiable reports sent
q Yes, although may be primarily focused on operation activities
q Comprehensive incident reporting
Is incident reporting part of the operational infrastructure?
q No q Staff assigned incident reporting and analysis responsibilities
q Reporting and analysis
Is incident reporting easy and accessible?
q n/a q Paper forms to be filled in. Incident reports logged and filed
q Yes – easily accessible via internal IT systems
Incident investigation and analysis
Are there stated criteria q Serious incidents may q Criteria for some q Criteria for all for incident be examined at incident types incidents (and these investigation? management request criteria are effectively
applied)
Does the organisation q No q Sometimes (when q Routinely when conduct specialist complex technical technical issues are technical investigations issues identified) identified as part of incident investigation?
Dissemination and learning
Does the organisation q Not really q Some q Good participation in participate in wider industry forums and sharing with industry experience sharing (interest groups, networks seminars)?
Figure 2 Capability evaluation
6
3.3 CUSTOMISATION OF THE SCHEME
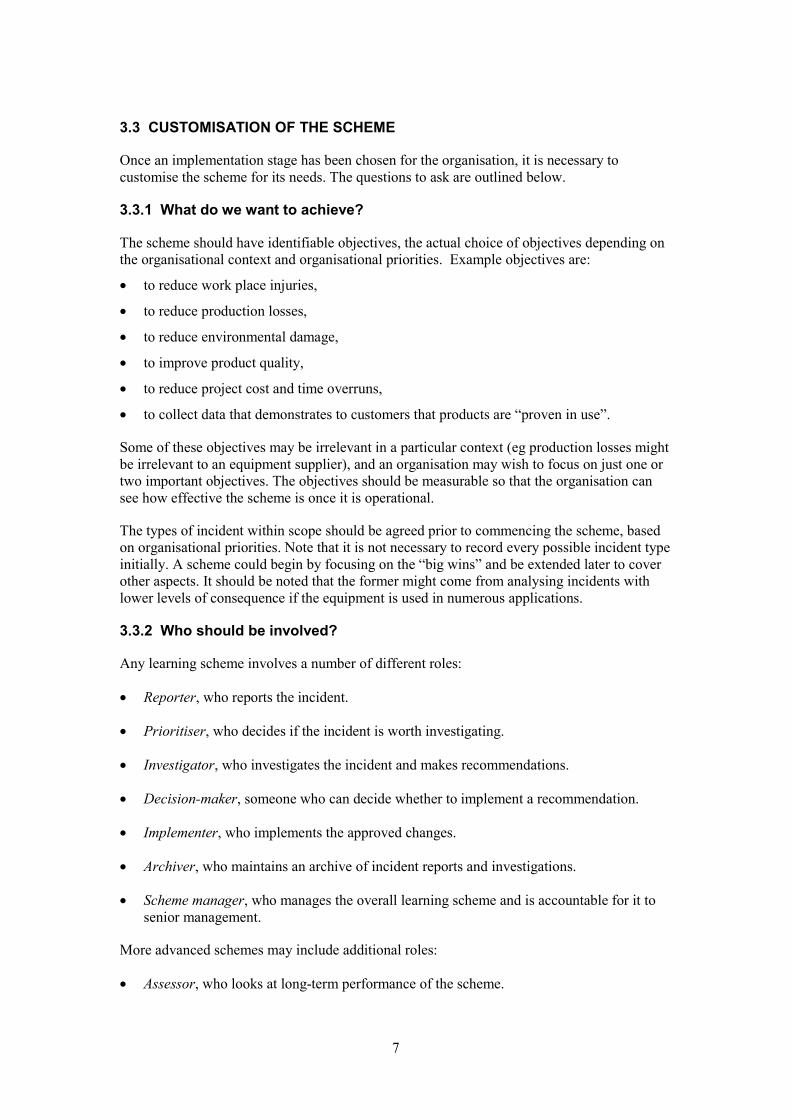
Once an implementation stage has been chosen for the organisation, it is necessary to customise the scheme for its needs. The questions to ask are outlined below.
3.3.1 What do we want to achieve?
The scheme should have identifiable objectives, the actual choice of objectives depending on the organisational context and organisational priorities. Example objectives are:
· to reduce work place injuries,
· to reduce production losses,
· to reduce environmental damage,
· to improve product quality,
· to reduce project cost and time overruns,
· to collect data that demonstrates to customers that products are “proven in use”.
Some of these objectives may be irrelevant in a particular context (eg production losses might be irrelevant to an equipment supplier), and an organisation may wish to focus on just one or two important objectives. The objectives should be measurable so that the organisation can see how effective the scheme is once it is operational.
The types of incident within scope should be agreed prior to commencing the scheme, based on organisational priorities. Note that it is not necessary to record every possible incident type initially. A scheme could begin by focusing on the “big wins” and be extended later to cover other aspects. It should be noted that the former might come from analysing incidents with lower levels of consequence if the equipment is used in numerous applications.
3.3.2 Who should be involved?
Any learning scheme involves a number of different roles:
· Reporter, who reports the incident.
· Prioritiser, who decides if the incident is worth investigating.
· Investigator, who investigates the incident and makes recommendations.
· Decision-maker, someone who can decide whether to implement a recommendation.
· Implementer, who implements the approved changes.
· Archiver, who maintains an archive of incident reports and investigations.
· Scheme manager, who manages the overall learning scheme and is accountable for it to senior management.
More advanced schemes may include additional roles:
· Assessor, who looks at long-term performance of the scheme.
7
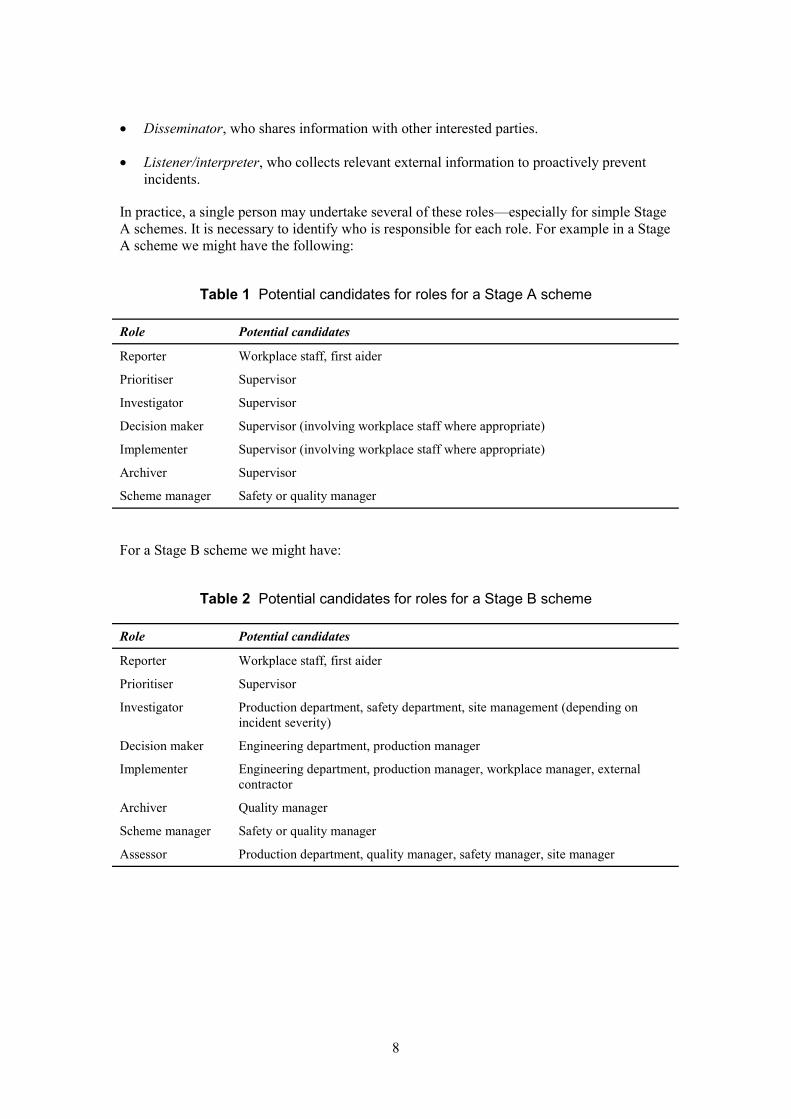
· Disseminator, who shares information with other interested parties.
· Listener/interpreter, who collects relevant external information to proactively prevent incidents.
In practice, a single person may undertake several of these roles—especially for simple Stage A schemes. It is necessary to identify who is responsible for each role. For example in a Stage A scheme we might have the following:
Table 1 Potential candidates for roles for a Stage A scheme
Role Potential candidates
Reporter Workplace staff, first aider
Prioritiser Supervisor
Investigator Supervisor
Decision maker Supervisor (involving workplace staff where appropriate)
Implementer Supervisor (involving workplace staff where appropriate)
Archiver Supervisor
Scheme manager Safety or quality manager
For a Stage B scheme we might have:
Table 2 Potential candidates for roles for a Stage B scheme
Role Potential candidates
Reporter Workplace staff, first aider
Prioritiser Supervisor
Investigator Production department, safety department, site management (depending on incident severity)
Decision maker Engineering department, production manager
Implementer Engineering department, production manager, workplace manager, external contractor
Archiver Quality manager
Scheme manager Safety or quality manager
Assessor Production department, quality manager, safety manager, site manager
8

It is necessary to ensure that all roles have been successfully allocated for the scheme to be effective. It is of course also necessary that the staff are competent to carry out their tasks. The following points are recommended:
· Ensure the roles assigned are as close as possible to activities already undertaken by staff.
· Consider how much training is needed before the scheme goes into operation (eg run through the incident handling process with an example).
· As experience builds, consider using experienced staff to help advise newcomers (eg identify a specific person to contact for advice).
· Ensure the role is defined as part of the job description with identified objectives and targets.
3.3.3 How should the scheme be implemented?
In order to minimise the effort involved, the organisation should make maximum use of the existing infrastructure. This might include the following.
If the reporters have access to e-mail and are able to use it, then it is often convenient to submit reports this way. As it is in electronic format it can be easily pasted into other official forms, and the mail headers automatically provide information of the sender, date and time.
It is also convenient for exchanging information with other departments and organisations involved in the incident handling and learning processes.
IT infrastructure
If the company has a widely available IT infrastructure, this can be used to maintain shared resources such as:
· templates of forms,
· incident records,
· investigation reports,
· periodic reviews of performance.
It can also be used to maintain procedures and guidance notes that change as a result of the incident investigation, for example:
· operational procedures,
· design processes, practices and “tips”,
· design standards and policy,
· supplier selection rules,
· system acceptance and validation procedures,
· safety management procedures and processes.
9
Existing quality management system
A company-specific or external accredited quality management system like ISO 9000 [3] has a structure very similar to that used for incident handling, in that it includes procedures for reporting, analysis, feedback and recording. Indeed, taking an extreme view, the goals of injury reduction and loss reduction might be viewed as specific sub-goals of a general quality system. In any event the infrastructure of a general quality management might be adapted to use:
· existing problem report forms for incident reporting;
· existing review records for recording the results of incident analysis;
· the quality management system to hold incident reports, investigations and recommendations, and use the review mechanisms to track the progress of recommendations.
If the existing quality management system is to be used then there will need to be consideration as to whether changes are needed to make it suitable for safety purposes. Time frames for analysis, recommendations and resulting changes may need to be shortened to ensure risk is managed appropriately.
Existing incident reporting scheme
Where an existing incident reporting scheme exists, specific extensions for dealing with E/E/PES equipment should be considered. As the equipment specific expertise is different from expertise required for general incident investigation, we need to identify:
· the interface between the technical and general incident investigations,
· who will carry out technical investigations,
· how technical problems are investigated,
· how they are recorded,
· how results are disseminated to other sites,
· how results from other sites are evaluated for potential impact.
Equipment support infrastructure
An equipment maintenance infrastructure may exist that formally records technical problems and corrective actions, and provides an archive for recording past problems so they can be analysed later. If this is the case, existing problem reporting mechanisms can be used to request technical investigations, and report results. Similarly, there could be established interfaces with suppliers that could be used to report problems to the supply chain.
3.3.4 What should be implemented?
The organisation has to identify a mechanism for passing and recording information in the incident handling process, ie they have to decide how the information arrows shown in Figure 1 are to be implemented. Possible means of transmission include:
· word of mouth,
· telephone,
10
· paper form,
· e-mail,
· electronic document or database.
Informal means of transmission (like word of mouth or telephone) can be valuable, as it can improve the level of reporting, however it is important that the information is also recorded in some permanent form (eg on paper or electronically) for later reference.
It is necessary to determine what information needs to be recorded. If there is no pre-existing infrastructure, the sample forms in Appendix E of Part 2 should be reviewed to see if they are applicable. The following questions should be asked.
· Are the specified items of information relevant for the current stage of implementation? Any redundant information should be removed.
· Are any items missing?
· Are any additional items needed?
· Is there excessive detail? Try to simplify the form as much as possible (eg remove subcategories, etc).
· Is the meaning clear? The form should be easy to understand (eg no jargon unless it aids understanding)
· Could some forms be combined? If one person is undertaking several roles, it may be convenient to use the same form for different stages. Even if more than one person is involved, merged forms may be more convenient provided people are aware of which part they must fill in.
It may be difficult to answer these questions until the forms have been applied in practice. In any case it is advisable to repeat the review of the form content and structure once the scheme has been in operation for a while.
3.4 SUPPLY CHAIN INFRASTRUCTURE
It is important that suppliers have effective processes for responding to reported technical problems. Figure 1 gives a good framework for suppliers’ learning process, although “Incident” could be replaced by “Technical problem” and “Local working context” could be “Customer”.
A suitable infrastructure can be set up by implementing a general quality management system such as ISO 9000 [3], with appropriate consideration of E/E/PES, eg through compliance with IEC 61508 [4]. If a supplier currently lacks a fully developed learning infrastructure supporting E/E/PES, the same staged approach to implementation is recommended.
11
4 EXAMPLES OF INCIDENT REPORTING
The following examples illustrate how the scheme might be implemented in different contexts and at different levels of capability.
4.1 STAGE A
This example considers a chemical company whose situation matches most closely the ‘A’ column in the capability assessment. The company does not have an established quality system or framework for incident reporting, analysis and learning. The recommended adoption path is to create a simple system for incident reporting and analysis.
4.1.1 Selected objectives
1 Reduce injuries in the local workplace.
2 Reduce production losses in the local workplace.
4.1.2 Define relevant incidents
It is necessary to define what incidents should be reported that are relevant to these objectives. In this example, these are:
· RIDDOR reportable injuries,
· “near misses” of reportable injuries,
· production and asset losses.
4.1.3 Scheme coverage
All staff and activities are localised to the work place.
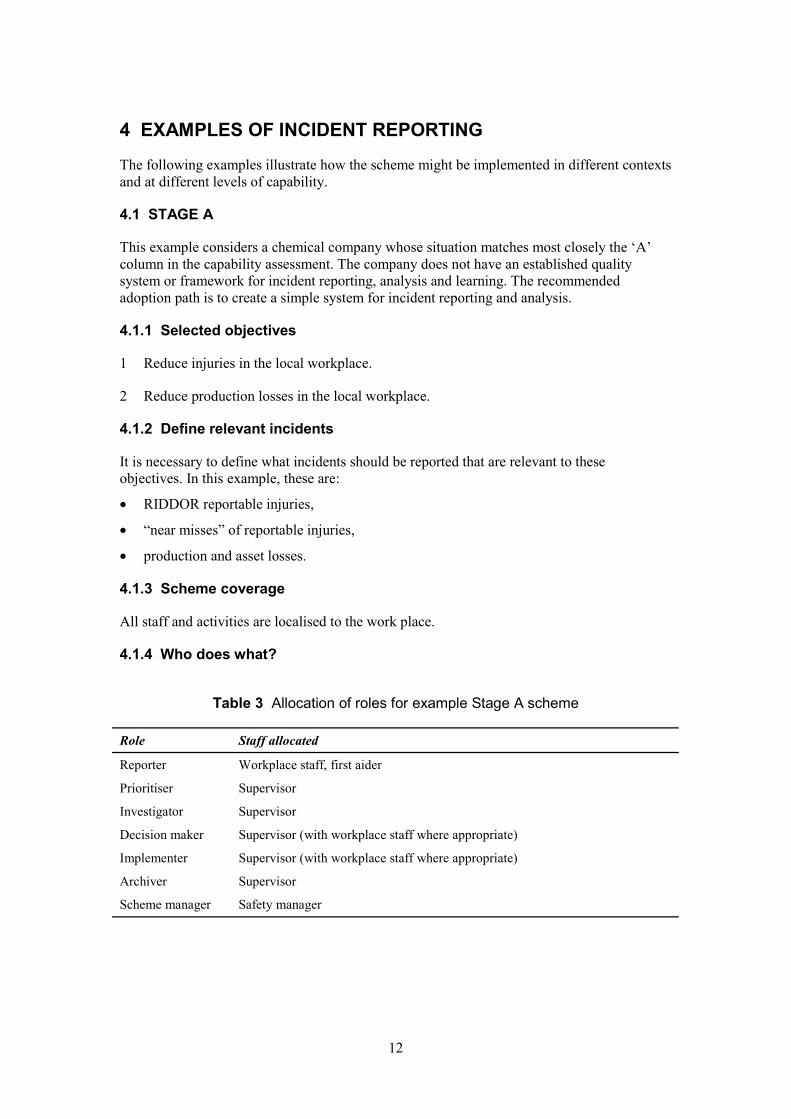
4.1.4 Who does what?
Table 3 Allocation of roles for example Stage A scheme
Role Staff allocated
Reporter Workplace staff, first aider
Prioritiser Supervisor
Investigator Supervisor
Decision maker Supervisor (with workplace staff where appropriate)
Implementer Supervisor (with workplace staff where appropriate)
Archiver Supervisor
Scheme manager Safety manager
12

4.1.5 Incident reporting
A paper-based incident report form was devised and made available in the workplace. The form:
· is simple – only limited information is required;
· implements generic scheme for reporting injury, hazardous incidents and production loss;
· records what E/E/PES equipment is involved in the incident.
Further technical investigation of E/E/PES equipment will not usually take place at Stage A. Nevertheless, it is worth recording whether E/E/PES equipment is involved to help decide whether equipment problems are a significant cause of production losses and/or injury. If so, it is likely to be worthwhile investigating these problems. This will provide motivation for progressing to Stage B.
A typical incident report form is shown in Figure 3 below. It is kept as simple as possible to minimise resistance to reporting. The workplace operative fills in the top half of the form, and the supervisor fills in the lower half.
Incident Report Your name John Scripps Date of incident 12 Jun 2003 Time of incident 15:30 Location of Incident Building A12, Batch vessel #4 Title Batch Vessel #4 overflow Describe the incident “Autofill” sequence initiated on control panel, but control system
stopped.
I heard an alarm, but we have had a lot of those recently.
As the console display showed that the vessel was empty, I used the manual override to operate the standby pump.
Vessel overflowed
For completion by the supervisor Incident reference number A12/45 Was any person hurt? No Did any damage to property occur? No, excess fluids went into drain Was there a loss of production or Production delay of 20 minutes. materials? If so how much? Loss of 500 litres of feedstock F20 In your view could this have led to No more serious consequences? If so, what could have occurred? What short term fixes or workarounds have been applied?
Manually opened the drain valves, drained vessel until the level indicator light on the batch vessel wall went off. Switched to manual mode to complete mixing.
To your knowledge, has this Yes (see incident A12/16) problem occurred before? Any electrical or electronic control Block A12 Batch process controller equipment involved?
Figure 3 Example incident report
13
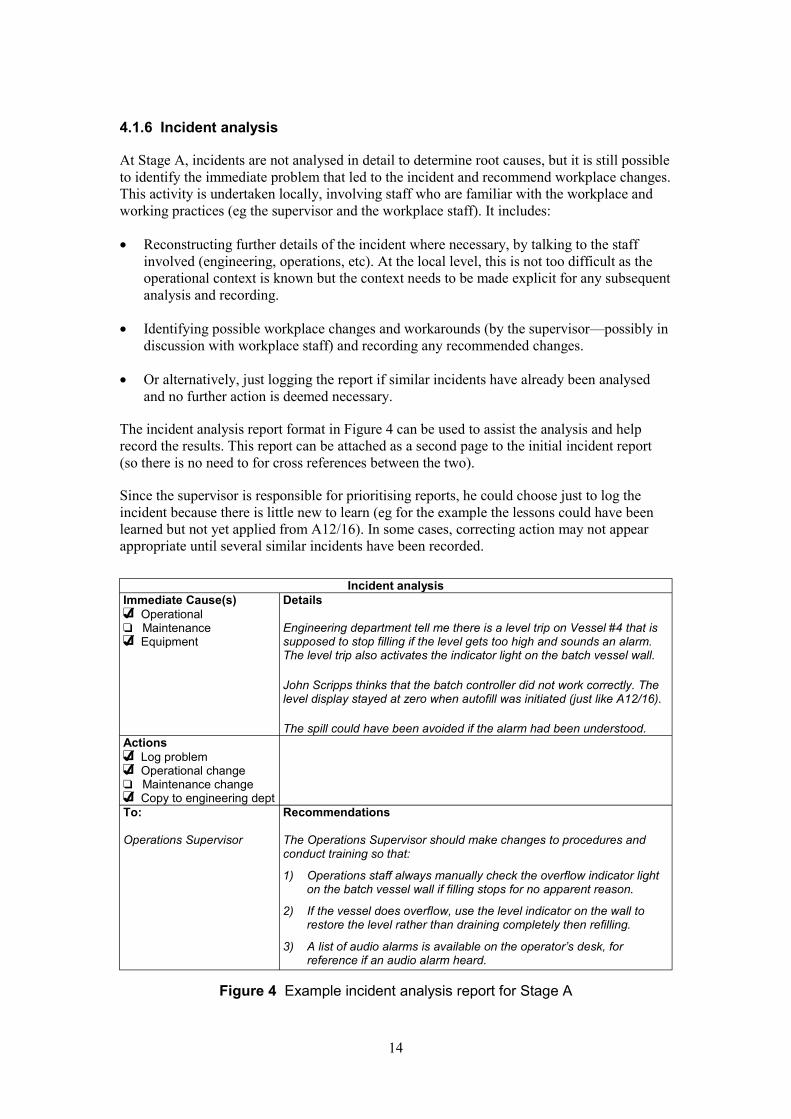
4.1.6 Incident analysis
At Stage A, incidents are not analysed in detail to determine root causes, but it is still possible to identify the immediate problem that led to the incident and recommend workplace changes. This activity is undertaken locally, involving staff who are familiar with the workplace and working practices (eg the supervisor and the workplace staff). It includes:
· Reconstructing further details of the incident where necessary, by talking to the staff involved (engineering, operations, etc). At the local level, this is not too difficult as the operational context is known but the context needs to be made explicit for any subsequent analysis and recording.
· Identifying possible workplace changes and workarounds (by the supervisor—possibly in discussion with workplace staff) and recording any recommended changes.
· Or alternatively, just logging the report if similar incidents have already been analysed and no further action is deemed necessary.
The incident analysis report format in Figure 4 can be used to assist the analysis and help record the results. This report can be attached as a second page to the initial incident report (so there is no need to for cross references between the two).
Since the supervisor is responsible for prioritising reports, he could choose just to log the incident because there is little new to learn (eg for the example the lessons could have been learned but not yet applied from A12/16). In some cases, correcting action may not appear appropriate until several similar incidents have been recorded.
Incident analysis Immediate Cause(s) q4 Operational q Maintenance q4 Equipment
Details
Engineering department tell me there is a level trip on Vessel #4 that is supposed to stop filling if the level gets too high and sounds an alarm. The level trip also activates the indicator light on the batch vessel wall.
John Scripps thinks that the batch controller did not work correctly. The level display stayed at zero when autofill was initiated (just like A12/16).
The spill could have been avoided if the alarm had been understood. Actions q4 Log problem q4 Operational change q Maintenance change q4 Copy to engineering dept To: Recommendations
Operations Supervisor The Operations Supervisor should make changes to procedures and conduct training so that:
1) Operations staff always manually check the overflow indicator light on the batch vessel wall if filling stops for no apparent reason.
2) If the vessel does overflow, use the level indicator on the wall to restore the level rather than draining completely then refilling.
3) A list of audio alarms is available on the operator’s desk, for reference if an audio alarm heard.
Figure 4 Example incident analysis report for Stage A
14
4.1.7 Incident archive
The archive can be simply a ring binder of incident report forms that is kept in the supervisor’s office.
4.1.8 Implementing the lessons learned
The local workplace needs to implement the lessons learned from the incident in order to prevent recurrence of similar incidents or to reduce their consequences. This application of experience gained includes:
· Maintaining a local list of problems and workarounds accessible by workplace staff.
· Briefing staff about new problems and workarounds (this could be done by workplace staff who devised the workaround).
· Periodically reviewing incident logs to check which incidents are the most frequent and may need further action (eg Are the workarounds being applied? Are the workarounds ineffective? Does higher management need to be informed?).
· Producing periodic reports for production management and staff on the frequency of incidents (eg injuries, stoppages, losses).
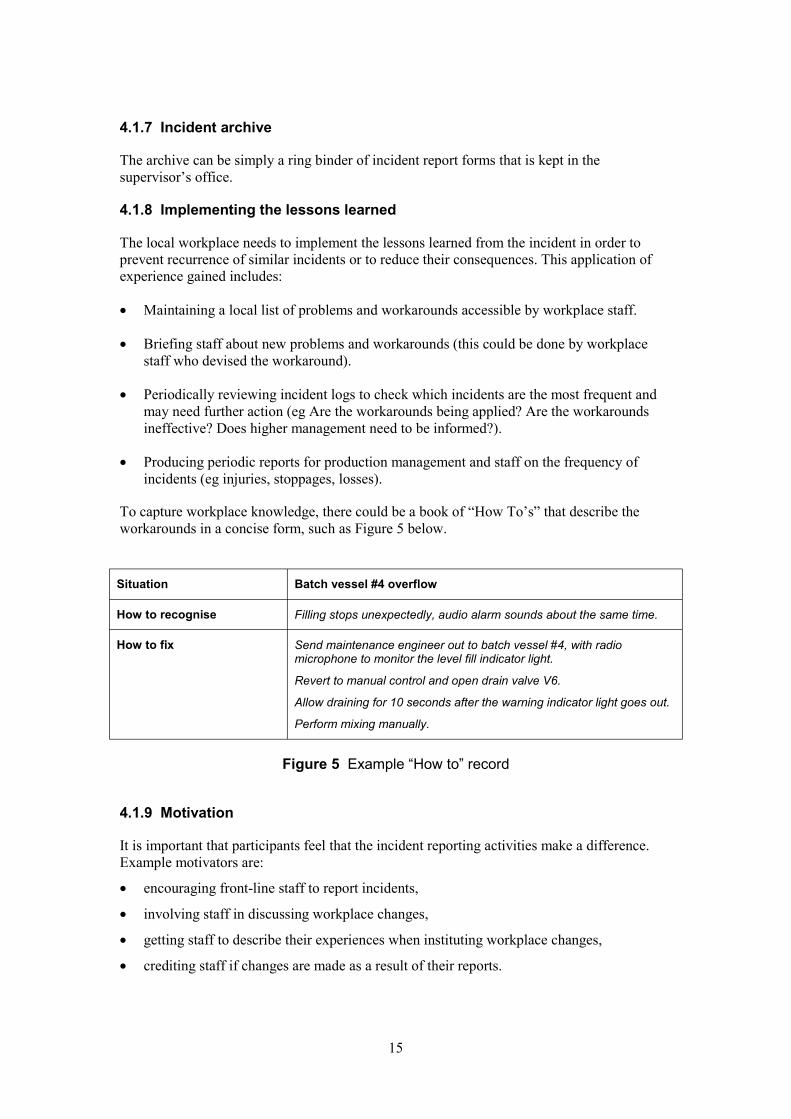
To capture workplace knowledge, there could be a book of “How To’s” that describe the workarounds in a concise form, such as Figure 5 below.
Situation Batch vessel #4 overflow
How to recognise Filling stops unexpectedly, audio alarm sounds about the same time.
How to fix Send maintenance engineer out to batch vessel #4, with radio microphone to monitor the level fill indicator light.
Revert to manual control and open drain valve V6.
Allow draining for 10 seconds after the warning indicator light goes out.
Perform mixing manually.
Figure 5 Example “How to” record
4.1.9 Motivation
It is important that participants feel that the incident reporting activities make a difference. Example motivators are:
· encouraging front-line staff to report incidents,
· involving staff in discussing workplace changes,
· getting staff to describe their experiences when instituting workplace changes,
· crediting staff if changes are made as a result of their reports.
15

4.2 STAGE B
This example considers a hypothetical chemical company (Chemco) implementing Stage B incident handling. The company has a documented set of procedures for incident reporting, analysis and recommendations. This is a more complex scheme than Stage A and involves different departments.
4.2.1 Selected objectives
1 Reduce injuries in the local workplace.
2 Reduce production losses in the local workplace.
Note that these objectives are the same as for the Stage A example.
4.2.2 Define relevant incidents
It is necessary to define what incidents should be reported that are relevant to these objectives:
· RIDDOR reportable injuries,
· production and asset losses,
· “near misses” of reportable injuries, production losses and asset losses.
These are as for the Stage A example, with the addition of “near miss” incidents that include product and asset loss.
4.2.3 Scheme coverage
This scheme involves workplace staff, production management and engineering management.
4.2.4 Who does what?
Table 4 Allocation of roles for example Stage B scheme
Role Staff allocated
Reporter Workplace staff, first aider
Prioritiser Priority rules (applied by supervisor)
Investigator Supervisor, safety manager or production manager (depending on severity), engineering manager (if technical investigation required)
Decision maker Supervisor, production manager, engineering manager (depending on incident severity)
Implementer Engineering (possibly a contractor), production manager
Archiver IT department
Scheme manager Safety manager
Assessor Production department and safety department (using IT data)
16
4.2.5 Incident reporting
The incident report used is similar to the one in Figure 3, but an electronic version of the document is maintained, and template electronic forms are available to be filled in by the supervisor.
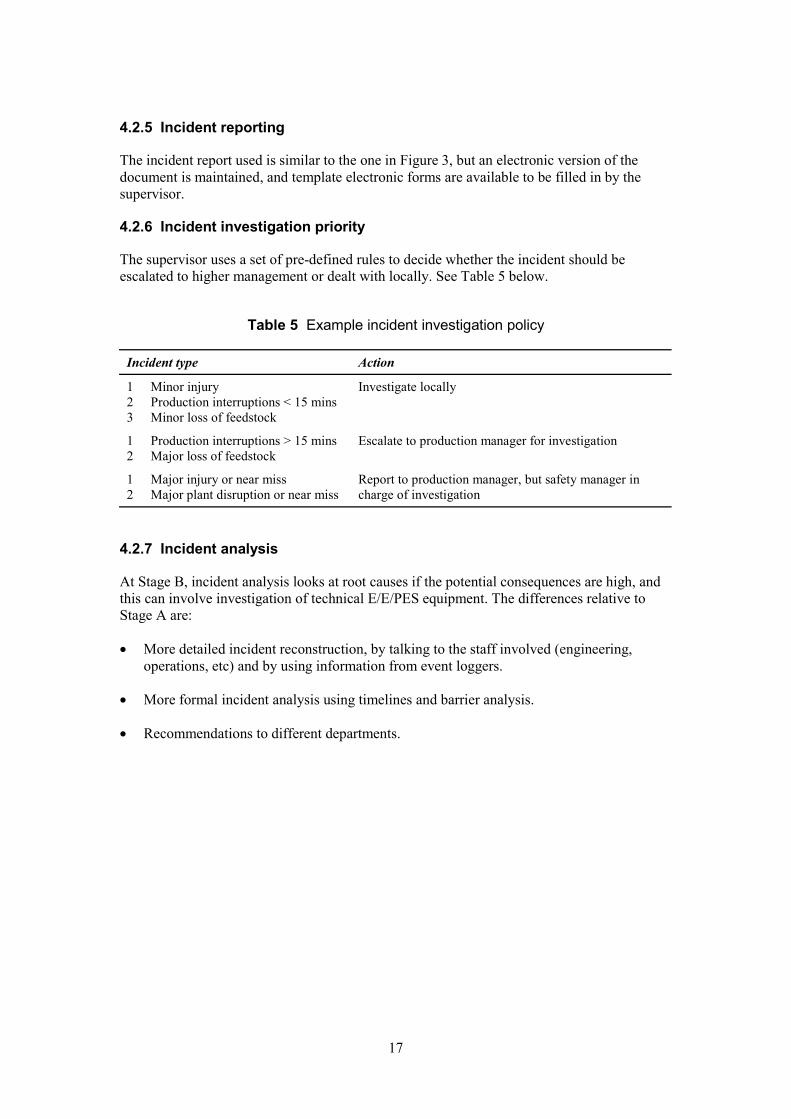
4.2.6 Incident investigation priority
The supervisor uses a set of pre-defined rules to decide whether the incident should be escalated to higher management or dealt with locally. See Table 5 below.
Table 5 Example incident investigation policy
Incident type Action
1 Minor injury Investigate locally 2 Production interruptions < 15 mins 3 Minor loss of feedstock
1 Production interruptions > 15 mins Escalate to production manager for investigation 2 Major loss of feedstock
1 Major injury or near miss Report to production manager, but safety manager in 2 Major plant disruption or near miss charge of investigation
4.2.7 Incident analysis
At Stage B, incident analysis looks at root causes if the potential consequences are high, and this can involve investigation of technical E/E/PES equipment. The differences relative to Stage A are:
· More detailed incident reconstruction, by talking to the staff involved (engineering, operations, etc) and by using information from event loggers.
· More formal incident analysis using timelines and barrier analysis.
· Recommendations to different departments.
17
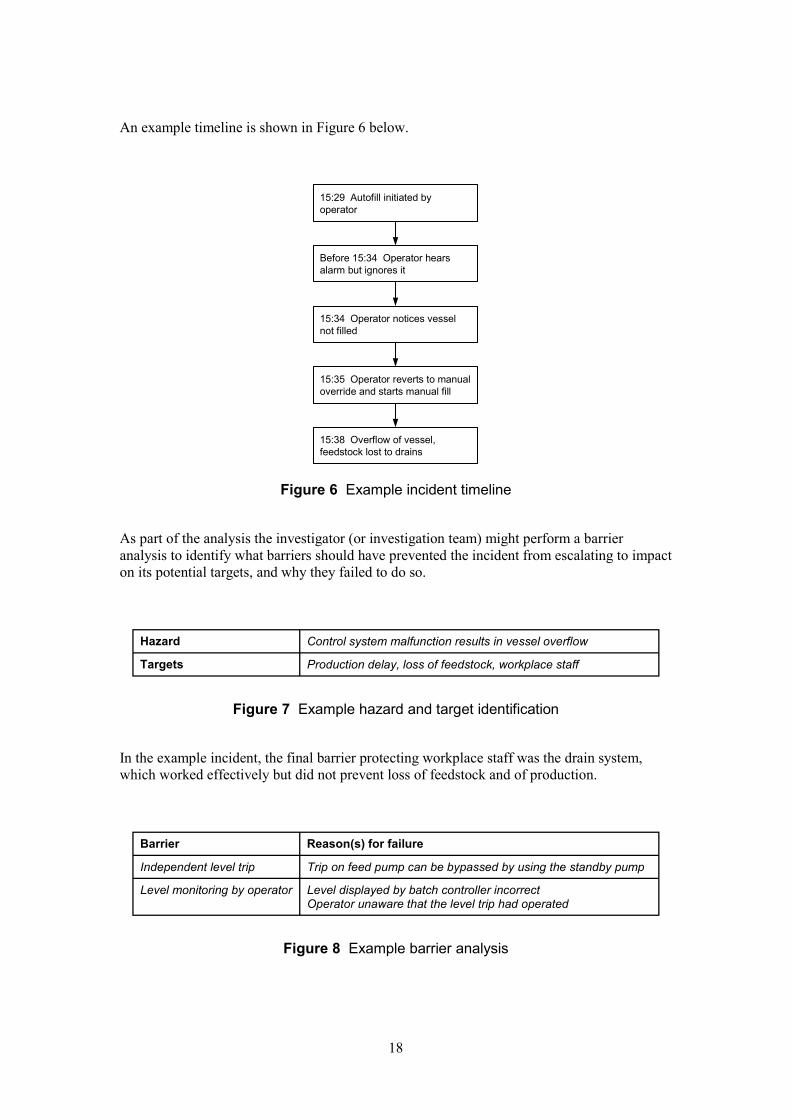
An example timeline is shown in Figure 6 below.
i ill
i
l
15:35 Operator reverts to manual overr de and starts manual f
15:34 Operator notices vessel not filled
Before 15:34 Operator hears alarm but ignores it
15:29 Autofill init ated by operator
15:38 Overf ow of vessel, feedstock lost to drains
Figure 6 Example incident timeline
As part of the analysis the investigator (or investigation team) might perform a barrier analysis to identify what barriers should have prevented the incident from escalating to impact on its potential targets, and why they failed to do so.
Hazard Control system malfunction results in vessel overflow
Targets Production delay, loss of feedstock, workplace staff
Figure 7 Example hazard and target identification
In the example incident, the final barrier protecting workplace staff was the drain system, which worked effectively but did not prevent loss of feedstock and of production.
Barrier Reason(s) for failure
Independent level trip Trip on feed pump can be bypassed by using the standby pump
Level monitoring by operator Level displayed by batch controller incorrect Operator unaware that the level trip had operated
Figure 8 Example barrier analysis
18

To help identify how the problems with the equipment could have been prevented, a checklist is used, as shown in Figure 9 below.
E/E/PES Problem Prevention Checklist – Incident would have been avoided if: q System assessment
q4 hazard and risk assessment applied/improved q better allocation of functions to people and equipment
q System design q better specification of system functions q better design and development q4 improved operation facilities q improved maintenance facilities
q Installation and commissioning
q improved installation plan/procedures q improved commissioning plan/procedures
q Validation q better validation techniques/plan q fully implement validation plan q better validation equipment q better analysis/resolution of discrepancies q4 usability assessment
q Operation and maintenance
q operation procedures improved q impact assessment of operation procedures q operation procedures properly applied q maintenance procedures improved q impact assessment of maintenance procedures q maintenance procedures properly applied q routine operation and maintenance audits q test interval changed q permit/hand over procedures q procedures to monitor system performance q selection/application of tools
q Modification q procedures applied to initiate modification in the event of systematic failures or vendor notification of faults q modification authorisation procedures q impact analysis of modification q improve modification planning (including following appropriate lifecycle) q improve implementation of modification plan q better manufacturers information q improve verification and validation of modification
Safety management q operation q maintenance q modification
q safety culture q safety audits q management of suppliers
Lifecycle Ensure adequate definition of lifecycle processes q operation, q maintenance, q modification
Competence q4 operation q maintenance q modification
q procedures for ensuring competence q4 check training, experience and qualifications of a person q specify job requirements
Verification Verification of q operation, q maintenance, q modification Documentation q operation q maintenance q modification
q check documentation available/complete q check documentation clear and correct q check documentation well structured q check documentation up to date
Functional safety assessment q operation q maintenance q modification
q introduce safety assessment q improve safety assessment q ensure adequate skills and independence of assessment team
Figure 9 Example problem prevention checklist
19

The results of the analysis are captured in the incident investigation report—see Figure 10 below.
Incident Analysis Report Investigation report ref: INV/AI2/2 Incident report ref: INC/A12/45 Incident reconstruction See time line reconstruction Analysis of causal factors See barrier analysis Investigation details See attached analysis reports
See technical investigation of the batch controller Causal factors Batch control malfunction
1) Lack of awareness of batch control failure 2) Lack of awareness of current level in vessel 3) Lack of awareness of operation of trip 4) Standby pump can still operate even if there is a level trip
on the main pump Problem prevention classification 1) Assessment: hazard and risk assessment
Capability to bypass overflow trip by using the standby pump should have been identified 2) Design: operation facilities Design should ensure operator is aware of equipment failure Design should ensure important plant status information is available to the operator 3) Validation: usability assessment Chance of operator error increased due to lack of information – audio alarm not specific 4) Operation competence: Training Operator should be made aware of the currently available alarms
Ref Recommendation Departmentrole
Priority Response deadline
1 Brief operators to assume overfill has occurred when audio alarm heard during fill operations
Operations manager
1 30 Jun 2003
2 Change operational procedures to get permit from supervisor before using the standby feed pump
Operations manager
1 30 Jun 2003
3 Ensure operating staff are briefed about the change in procedure
Operations manager
1 30 Jun 2003
4 Request engineering change to place a visible alarm on the control desk to indicate the vessel is full. Should be applied to all vessels in Block A12
Engineering manager
2 25 Jul 2003
5 Investigate why the batch controller malfunctioned and failed to indicate level to the operator
Engineering manager
3 8 Aug 2003
6 Ensure engineering standards require that all trip status signals be presented to the operator.
Engineering standards manager
3 8 Aug 2003
Figure 10 Example incident analysis report for Stage B
4.2.8 Implementing recommendations
Recommendations are sent to the appropriate department managers, who are required to report back on their status (ie rejected/accepted and when completed).
20

4.2.9 Incident archive
Electronic versions of incident reports, investigations and recommendations are held on computer files. This is a repository for incidents for the whole site and is maintained by the IT department. A database record is set up when an incident report is received, and is updated whenever new incident information is archived (eg when investigations are completed or recommendation implemented). The database record contains the:
· incident date,
· location,
· incident number,
· investigation number (if any),
· immediate cause (operations, maintenance or equipment),
· incident consequences (injury, production, etc),
· target date and status of recommendations.
4.2.10 Periodic review
The database is periodically analysed by the IT department to compile performance reports. The analysis comprises:
· overall trends for production loss and staff,
· comparison of performance for different locations,
· proportion of incidents caused by operations, maintenance and equipment,
· status of recommendations arising from incidents,
· recommendations not completed by their target dates and the associated accountable managers.
These reports are presented to senior management in the safety and production departments on a regular basis, who may take action to reverse trends, or to address “hotspot” locations where there are many incidents.
4.2.11 Motivation
Managers of the incident learning scheme can keep staff motivated by:
· ensuring that the status of incidents reported in each location is displayed locally, so the staff can see that their reports are being used;
· providing trend charts of performance, and “league tables” comparing their performance with other locations.
4.3 STAGE B E/E/PES EXTENSIONS
This section and Section 4.4 gives example forms and e-mails for a hypothetical company, Chemco.
21
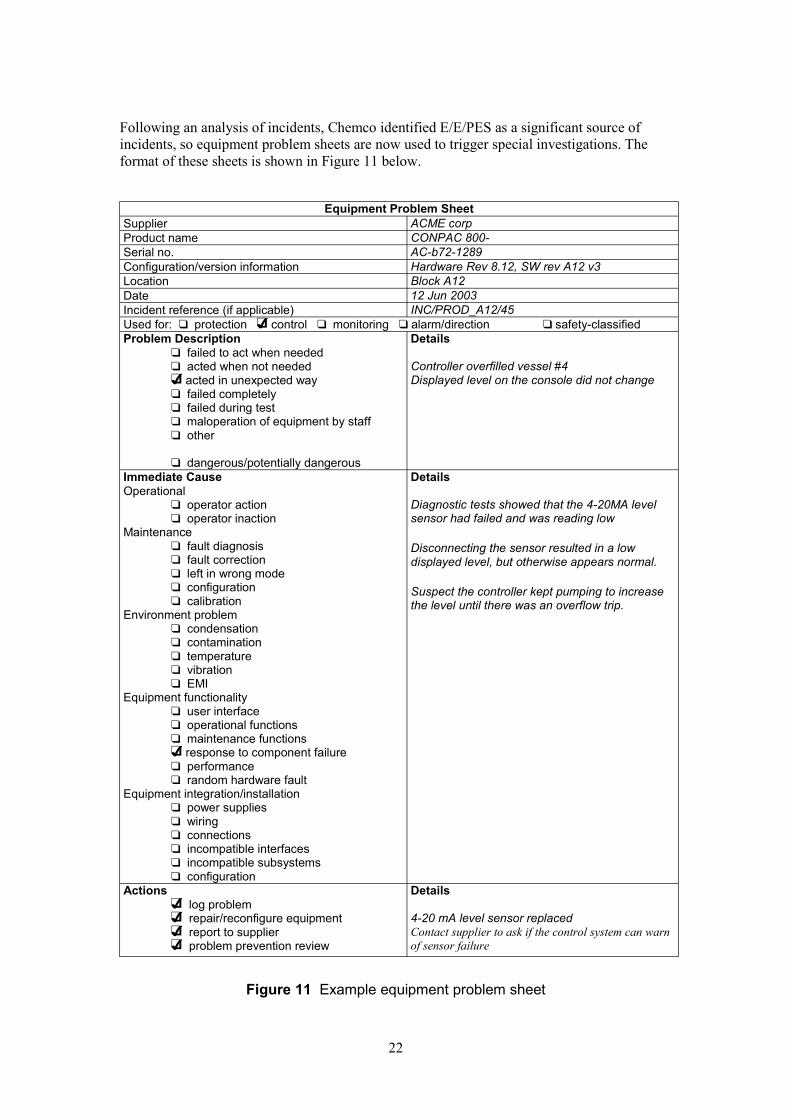
Following an analysis of incidents, Chemco identified E/E/PES as a significant source of incidents, so equipment problem sheets are now used to trigger special investigations. The format of these sheets is shown in Figure 11 below.
Equipment Problem Sheet Supplier ACME corp Product name CONPAC 800- Serial no. AC-b72-1289 Configuration/version information Hardware Rev 8.12, SW rev A12 v3 Location Block A12 Date 12 Jun 2003 Incident reference (if applicable) INC/PROD_A12/45 Used for: q protection q4 control q monitoring q alarm/direction q safety-classified Problem Description
q failed to act when needed q acted when not needed q4 acted in unexpected way q failed completely q failed during test q maloperation of equipment by staff q other
q dangerous/potentially dangerous
Details
Controller overfilled vessel #4 Displayed level on the console did not change
Immediate Cause Operational
q operator action q operator inaction
Maintenance q fault diagnosis q fault correction q left in wrong mode q configuration q calibration
Environment problem q condensation q contamination q temperature q vibration q EMI
Equipment functionality q user interface q operational functions q maintenance functions q4 response to component failure q performance q random hardware fault
Equipment integration/installation q power supplies q wiring q connections q incompatible interfaces q incompatible subsystems q configuration
Details
Diagnostic tests showed that the 4-20MA level sensor had failed and was reading low
Disconnecting the sensor resulted in a low displayed level, but otherwise appears normal.
Suspect the controller kept pumping to increase the level until there was an overflow trip.
Actions q4 log problem q4 repair/reconfigure equipment q4 report to supplier q4 problem prevention review
Details
4-20 mA level sensor replaced Contact supplier to ask if the control system can warn of sensor failure
Figure 11 Example equipment problem sheet
22

The E/E/PES problem report is held in the Engineering support database that records equipment failures and malfunctions.
This problem was passed to the supplier by e-mail:
To: [email protected]: Bill Smith <[email protected]> Subject: Problem with CONPAC 800 system for Block A12
We had a problem with the CONPAC 800 system that controls the vessels in Block A12. See attached problem report.
Is there any way to detect a level sensor problem and issue a warning to the operator?
Bill Smith
Figure 12 Example e-mail to supplier
ACME recorded this on their problem report form, see Figure 13 below.
Problem Report From Bill Smith Company Chemco Location Widnes, Lancs Date 15 Jun 2003 Details CONPAC 800 Rev 8.12, SW A12 Rev 3.
Chemco have complained that the Batch controller in Block A12 failed to inform the operator that the level sensor was suspect. See attached problem report.
Maybe we should also disable auto-control if this is detected?
Chris Curry
From: Mark Hughes, Software Development
Have checked the software A12 Rev 3, and it does check for sensor failure. If a failure is detected the level indicators go to flash mode, and auto-control is disabled for that loop,
Have talked to CONPAC system support and apparently there is a known problem with Rev 8.12 firmware. The 4-20mA fails to set the fail-flag (or DBI “don’t believe it”) indicator.
As our application software relies on the DBI flag this did not work either.
I think our application software testing used a DC volt interface configuration as that is what our test environment uses so we did not spot it during testing.
CONPAC suggest the following workaround:
1) Configure the level input as a raw signal.
2) Implement a test in the application software for a low raw ADC (below 819).
3) Perform the conversion from the raw ADC value to the level value in the application software.
CONPAC says the fail flag problem will be addressed in a later version of the CONPAC 800 software.
Figure 13 Example equipment problem report
23
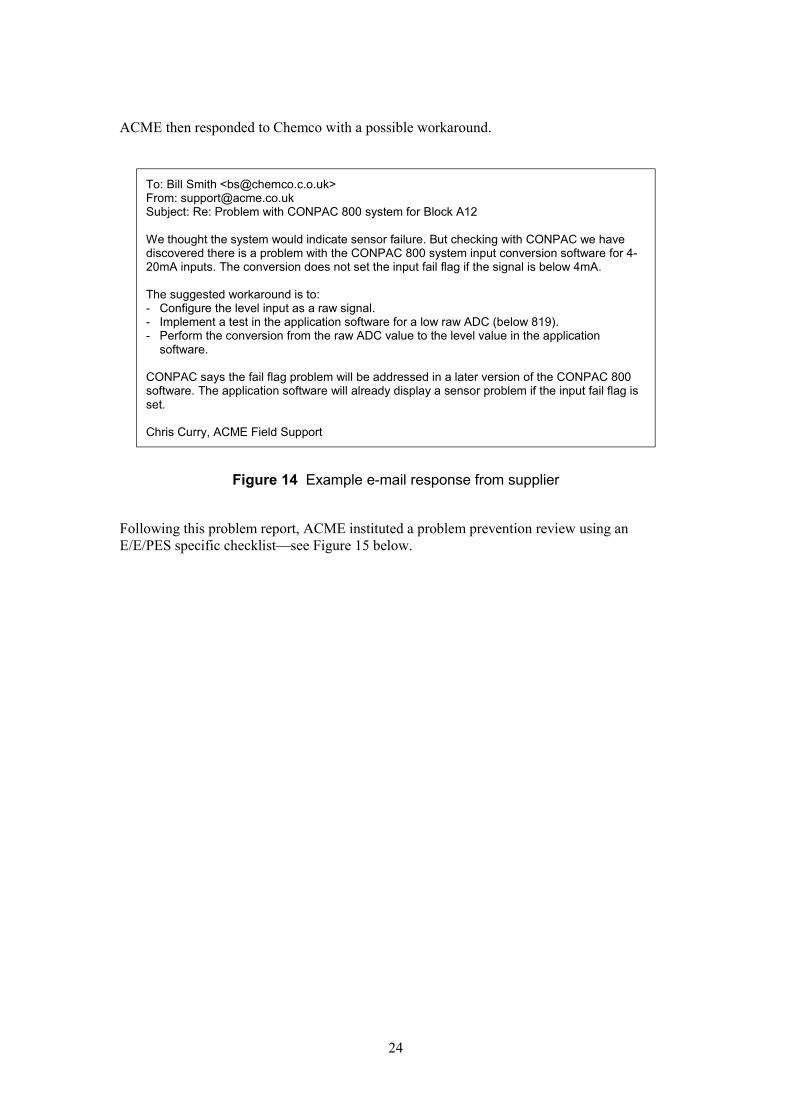
ACME then responded to Chemco with a possible workaround.
To: Bill Smith <[email protected]> From: [email protected] Subject: Re: Problem with CONPAC 800 system for Block A12
We thought the system would indicate sensor failure. But checking with CONPAC we have discovered there is a problem with the CONPAC 800 system input conversion software for 420mA inputs. The conversion does not set the input fail flag if the signal is below 4mA.
The suggested workaround is to: - Configure the level input as a raw signal. - Implement a test in the application software for a low raw ADC (below 819). - Perform the conversion from the raw ADC value to the level value in the application
software.
CONPAC says the fail flag problem will be addressed in a later version of the CONPAC 800 software. The application software will already display a sensor problem if the input fail flag is set.
Chris Curry, ACME Field Support
Figure 14 Example e-mail response from supplier
Following this problem report, ACME instituted a problem prevention review using an E/E/PES specific checklist—see Figure 15 below.
24

Checklist Details Functional requirements specification q Derivation of E/E/PES requirements from overall specification q Specification of E/E/PES requirements (structure, clarity, unambiguity) q Completeness of safety actions specified q Specification of safe (or least hazardous) state and behaviour after restart q Throughput and response requirement q Better EUC operator interfaces specification q Better operator interface to E/E/PES q Better specification of interfaces to other systems q Specification of security provisions q Specification of failure modes or failure rates q Identification of undefined relevant operating modes (eg start-up, proof test) q Identification of undefined limiting and constraint conditions Integrity requirements specification q Specification of target safety integrity level and/or target failure measures q Specify all modes of operation q Better definition of proof testing requirements q Better specification of environmental conditions Validation planning Ensure that factory q4 Better validation procedures acceptance tests q Better specification of validation environment replicate the interfaces q Better policies for resolving validation failure used on site.
Tests should have simulated sensor failure.
Hardware design and development q Better hardware safety integrity including fault tolerance and reliability analysis q Better measures for systematic safety integrity q Better response on detection of a fault q Better separation and independence q Better identification of interactions between subsystem components q Better design methods or tools q Better system architecture q Products supplied and integrated in accordance with product specifications Facilities for operation and maintenance q Provision for checking or confirmation of operator inputs q Better operator displays (complexity, confusion) q Better consideration of maintainability and testability Software requirements specification q Consistency checks against the overall specification q Check requirements are clear, unambiguous, verifiable, testable and traceable q Better identification of constraints between hardware and software q Better monitoring and testing Software design and development q Better software design methods q Better software architecture q Better support tools or programming language q Better code implementation q Better software testing Software validation q Better software validation techniques/plan q Better assessment of the validation plan q Better implementation of the validation plan
Figure 15 Example supplier checklist
25

Integration q Better hardware and software integration Installation and commissioning q Better installation procedures q Better commissioning procedures Operation and maintenance procedures q Better specification of the routine actions that need to be carried out q Better specification of actions and constraints during all modes of operation q Better maintenance procedures on fault Validation q Better implementation of validation plan q4 Better validation equipment q Better analysis/resolution of discrepancies q Better usability assessment
Factory test equipment should be able to replicate all inputs.
Safety management CONPAC did not alert q specification of necessary management and technical activities us about the fail flag q define accountability for all activities issue. q check activities are implemented and monitored Need to ensure that all q check activities are formally reviewed by all organisations component suppliers will q ensure all organisations are informed of responsibilities inform us of known q4 review suppliers for appropriate quality management system problems. Lifecycle q ensure adequate definition of detailed lifecycle q define lifecycle sub-activities q ensure scope, inputs and outputs defined for each phase Competence q procedures for ensuring competence q assess training, experience and qualification of a person q specify job requirements Verification q check verification plan is developed and complete q check verification plan is implemented q check verification plan is fully understood Documentation q check documentation is available and complete q check documentation is clear and correct q check documentation is well structured q check documentation is up to date Functional safety assessment q plan independent functional safety assessment q carry out independent functional safety assessment q ensure all phases assessed (including operation and maintenance) q ensure sufficient skills and independence in assessment team q assess tools
Figure 15 (continued) Example supplier checklist
As a result of the analysis, ACME made changes to:
1 the factory acceptance test (FAT) procedure, to ensure that sensor interfaces configured as they will be on-site;
2 the FAT test environment, which was upgraded to include simulation of 4-20mA inputs;
3 the FAT test checklist, which was updated to include tests for sensor failure.
They also instituted a supplier review to determine if their suppliers would provide notification of known problems.
26
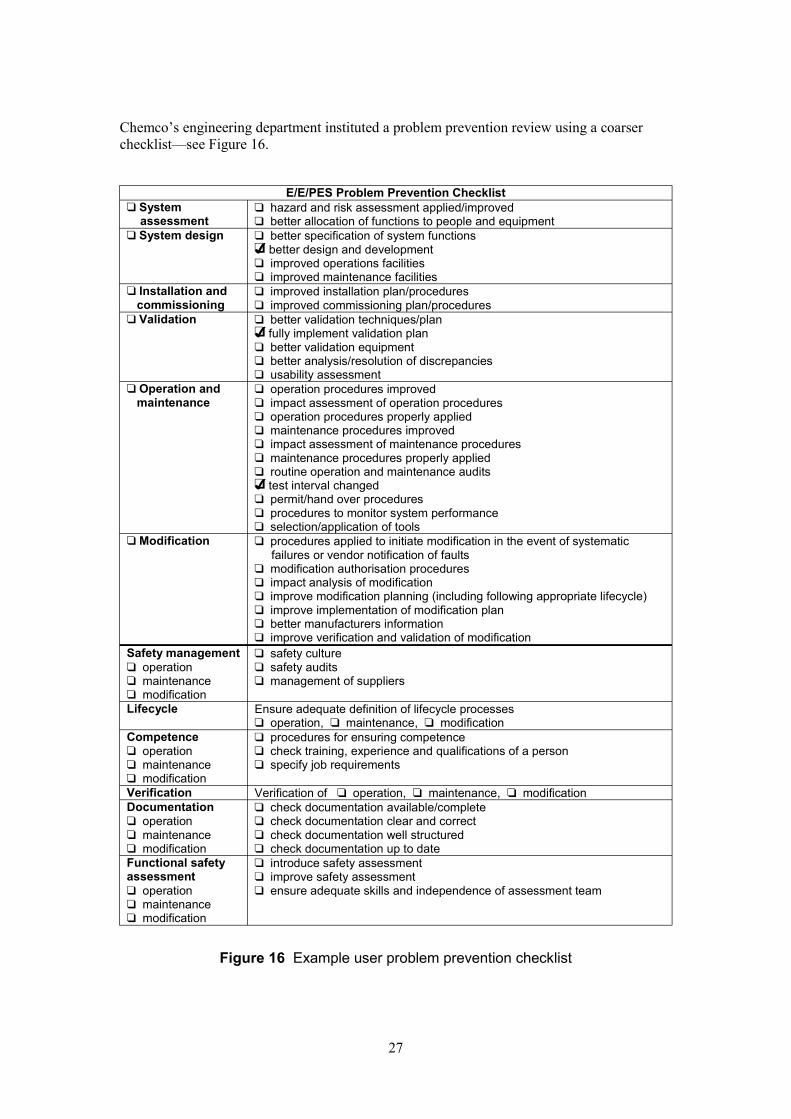
Chemco’s engineering department instituted a problem prevention review using a coarser checklist—see Figure 16.
E/E/PES Problem Prevention Checklist q System q hazard and risk assessment applied/improved assessment q better allocation of functions to people and equipment q System design q better specification of system functions
q4 better design and development q improved operations facilities q improved maintenance facilities
q Installation and q improved installation plan/procedures commissioning q improved commissioning plan/procedures q Validation q better validation techniques/plan
q4 fully implement validation plan q better validation equipment q better analysis/resolution of discrepancies q usability assessment
q Operation and maintenance
q operation procedures improved q impact assessment of operation procedures q operation procedures properly applied q maintenance procedures improved q impact assessment of maintenance procedures q maintenance procedures properly applied q routine operation and maintenance audits q4 test interval changed q permit/hand over procedures q procedures to monitor system performance q selection/application of tools
q Modification q procedures applied to initiate modification in the event of systematic failures or vendor notification of faults q modification authorisation procedures q impact analysis of modification q improve modification planning (including following appropriate lifecycle) q improve implementation of modification plan q better manufacturers information q improve verification and validation of modification
Safety management q safety culture q operation q safety audits q maintenance q management of suppliers q modification Lifecycle Ensure adequate definition of lifecycle processes
q operation, q maintenance, q modification Competence q operation q maintenance q modification
q procedures for ensuring competence q check training, experience and qualifications of a person q specify job requirements
Verification Verification of q operation, q maintenance, q modification Documentation q check documentation available/complete q operation q check documentation clear and correct q maintenance q check documentation well structured q modification q check documentation up to date Functional safety q introduce safety assessment assessment q improve safety assessment q operation q ensure adequate skills and independence of assessment team q maintenance q modification
Figure 16 Example user problem prevention checklist
27
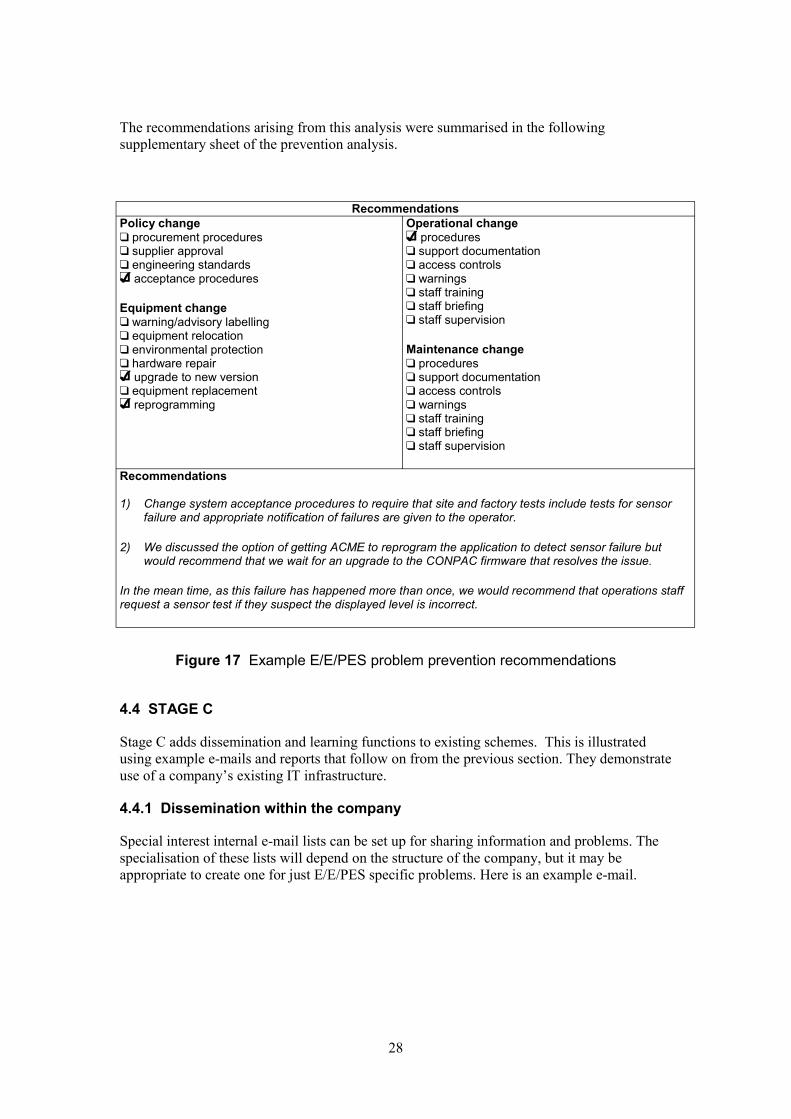
The recommendations arising from this analysis were summarised in the following supplementary sheet of the prevention analysis.
Recommendations Policy change q procurement procedures q supplier approval q engineering standards q4 acceptance procedures
Equipment change q warning/advisory labelling q equipment relocation q environmental protection q hardware repair q4 upgrade to new version q equipment replacement q4 reprogramming
Operational change q4 procedures q support documentation q access controls q warnings q staff training q staff briefing q staff supervision
Maintenance change q procedures q support documentation q access controls q warnings q staff training q staff briefing q staff supervision
Recommendations
1) Change system acceptance procedures to require that site and factory tests include tests for sensor failure and appropriate notification of failures are given to the operator.
2) We discussed the option of getting ACME to reprogram the application to detect sensor failure but would recommend that we wait for an upgrade to the CONPAC firmware that resolves the issue.
In the mean time, as this failure has happened more than once, we would recommend that operations staff request a sensor test if they suspect the displayed level is incorrect.
Figure 17 Example E/E/PES problem prevention recommendations
4.4 STAGE C
Stage C adds dissemination and learning functions to existing schemes. This is illustrated using example e-mails and reports that follow on from the previous section. They demonstrate use of a company’s existing IT infrastructure.
4.4.1 Dissemination within the company
Special interest internal e-mail lists can be set up for sharing information and problems. The specialisation of these lists will depend on the structure of the company, but it may be appropriate to create one for just E/E/PES specific problems. Here is an example e-mail.
28

To: [email protected] From: Bill Smith <[email protected]> Subject: Problem with CONPAC 800 system Rev 8.12
We have discovered that that the current version of the CONPAC 800 (Rev 8.12) has a bug in the input conversion software for 4-20mA inputs. If the sensor fails low the fail flag is not set, so the application software is unaware of the failure. I advise all sites to check whether they use CONPAC equipment with 4-20mA inputs, especiallyif the equipment is part of a safety-classified application. A workaround from our system supplier is attached.
Bill Smith
Figure 18 Example dissemination e-mail
4.4.2 Interfaces with suppliers
A formal notification scheme can be set up by system suppliers to ensure that notifications and alerts are reported to the appropriate departments of companies that use their systems. This may also be e-mail based, as shown in the following example:
To: [email protected] From: Chris Curry <[email protected]> Subject: New version of CONPAC firmware announced
I attach the CONPAC 800 release notes for Rev 8.16.
It includes a fix for the 4-20mA fail flag problem that has caused problems in some applications.
We have tested the revised firmware, and the problem seems to have been resolved
Let me know if you wish us to install the revised firmware
Chris Curry
Figure 19 Example notification e-mail
4.4.3 Interchanges with wider industry
In some industries, including the chemical industry applicable to this example, there are barriers to wider information sharing, especially at the detailed incident level. However, magazines, trade organisations and special interest groups do enable information sharing at a more general level. Here is a short report that might appear in a chemical industry newsletter or publication.
29

il i
i i
lj i
ii
0
50
2001
iM i j
j
ith i i
0
50
100
150
200
250
300
2001 2002 2003
ident
ii
i l but equii i
proporti
Chemco has been operating an incident report ng and investigation system for the past two years. It was trial ed at the W dnes plant.
The objective of the scheme is to reduce injuries and productions losses. No targets were set but the results have been quite promising, and Chemco will be apply ng it at other s tes.
The main results are shown in the graphs below. The scheme was implemented ful y in 2003 and the increase in minor in uries is thought to be due to better report ng, rather than a genuine increase in injur es. It can be seen that major injuries decline each year. Over the past 2 years there has been a decl ne in major injuries of 25%.
100
150
200
250
2002 2003
Inc dents nor In ury
M a or injury
As part of the scheme, Chemco recorded the causal factors involved in each incident wthe follow ng breakdown. Note there can be several causal factors in an inc dent.
Inccausal factors
Equipment M a ntenance O perat on
It can be seen that operat ons and maintenance prob ems dominate, pment problems do make a signif cant contr bution. Chemco intends to look at the causal factor
ons for safety-classified equipment.
Figure 20 Example newsletter report
30
5 CONCLUSIONS
This document has:
· outlined the potential barriers to adopting the scheme described in Part 2 and given general strategies for overcoming them;
· provided guidance on implementing learning from incidents for any specific organisation;
· given examples of possible implementations of incident handling systems at different capability levels.
This guidance should provide a starting pointing for implementing an incident analysis scheme that includes E/E/PES, but future work should ideally include:
· updating the guidance and scheme in the light of experience;
· creating infrastructure(s) to assist organisations in setting up learning schemes and in sharing their experience of problems and how they are overcome.
31
REFERENCES
[1] PG Bishop, LO Emmet, W Black, C Johnson, V Hamilton, F Koornneef, “HSE Learning from Incidents: D2—Outline scheme for E/E/PE in the context of IEC 61508”, Adelard Deliverable, D/221/2307/2, 2003
[2] PG Bishop, LO Emmet, K Tourlas, W Black, C Johnson, “HSE Learning from Incidents: D3—Scheme Evaluation”, Adelard Deliverable, D/226/2307/3, 2003
[3] ISO 9001:2000, Quality management systems – Requirements
[4] IEC 61508, Functional safety of electrical/electronic/programmable electronic safetyrelated systems. For further details see http://www.iec.ch/functionalsafety
32
APPENDIX A CASE STUDY ILLUSTRATING DETAILED CAUSAL ANALYSIS
Chris Johnson, Dept. of Computing Science, University of Glasgow.
A.1 SUMMARY
A range of investigation techniques have been developed to help identify the causal factors that contribute to adverse events and near miss incidents. Unfortunately, few of these techniques have been applied to support the analysis of mishaps involving electrical, electronic or programmable electronic systems (E/E/PES). In Appendix A of Part 1, we reviewed a range of causal analysis techniques that can support the investigation of this class of incidents. The following pages build on this analysis and present two complementary investigation techniques.
One is intended to provide a low-cost and lightweight approach that is appropriate for low consequence events. It is based around a flowchart that prompts investigators to identify potential causal factors through a series of questions about the events leading to a failure and the context in which an incident occurred. The second approach is more complex. It involves additional documentation and analysis. It is, therefore, more appropriate for incidents that have greater potential consequences or a higher likelihood of recurrence. This approach uses Events and Causal Factors (ECF) modelling together with particular forms of causal reasoning developed by the US Department of Energy [1].
Both approaches provide means of mapping causal factors back to the lifecycle phases and common requirements described in the IEC 61508 standard. This provides an important bridge from the products of mishap analysis to the design and operation of future safetycritical systems.
A.2 INTRODUCTION
It is important to learn as much as possible about the causes of an incident or accident if designers are to guard against any future recurrence. Causal analysis techniques provide a means of identifying the reasons why an adverse event occurred. Very few of these approaches have been applied to support the analysis of incidents involving electrical, electronic or programmable electronic systems (E/E/PES). In Appendix A of Part 1, we provided guidance on how existing causal analysis techniques can be applied to improve our understanding of E/E/PES related incidents. In this appendix, we identify two existing causal analysis techniques that provide particular support for this class of incidents and near misses. Appendix D presents the criteria that guided our decision. In contrast, we focus on the investigation schemes that incorporate these two forms of causal analysis. The output from both schemes can target the allocation of future resources following the development model that supports the IEC 61508 standard.
A.2.1 Case Study Incidents
An E/E/PES case study will be used to illustrate the investigation techniques in this paper. This incident has been chosen through consultation with HSE and industry representatives because it typifies the adverse events that currently threaten many safety-critical industries. Some details have been removed and others have been deliberately added so that the case study does not reflect any individual incident.
33
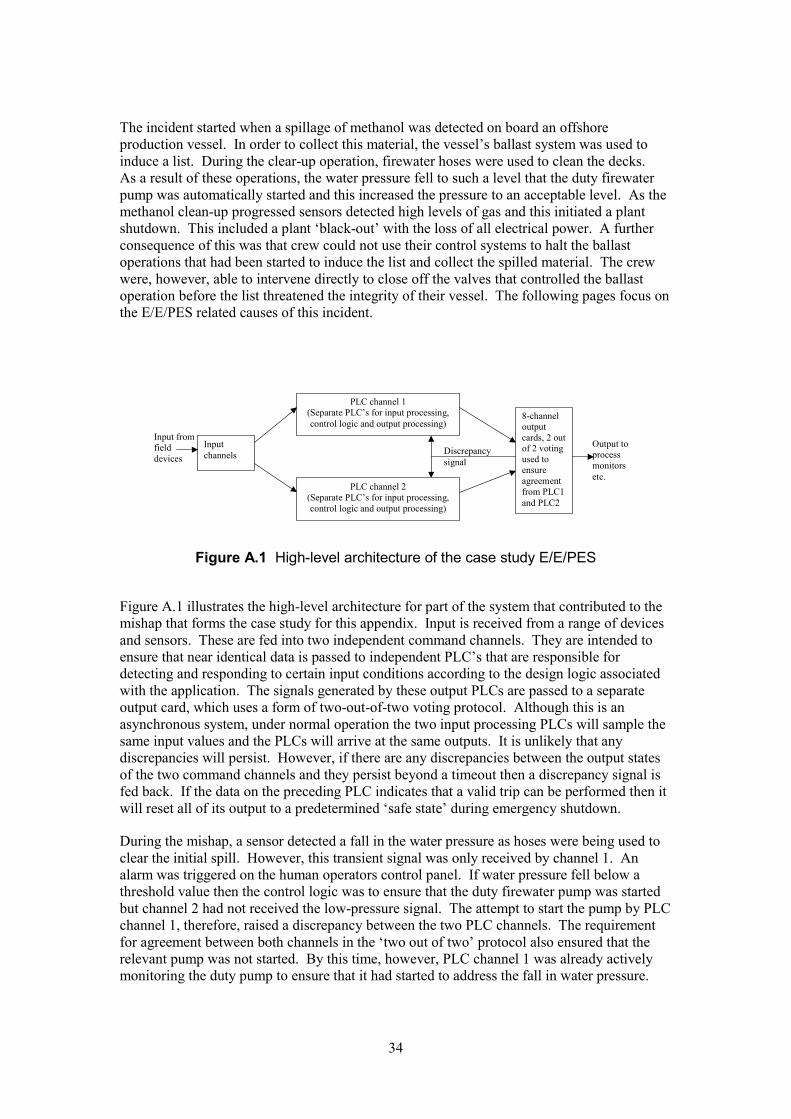
The incident started when a spillage of methanol was detected on board an offshore production vessel. In order to collect this material, the vessel’s ballast system was used to induce a list. During the clear-up operation, firewater hoses were used to clean the decks. As a result of these operations, the water pressure fell to such a level that the duty firewater pump was automatically started and this increased the pressure to an acceptable level. As the methanol clean-up progressed sensors detected high levels of gas and this initiated a plant shutdown. This included a plant ‘black-out’ with the loss of all electrical power. A further consequence of this was that crew could not use their control systems to halt the ballast operations that had been started to induce the list and collect the spilled material. The crew were, however, able to intervene directly to close off the valves that controlled the ballast operation before the list threatened the integrity of their vessel. The following pages focus on the E/E/PES related causes of this incident.
()
()
PLC channel 1 Separate PLC’s for input processing, control logic and output processing
Input channels
8-channel output cards, 2 out of 2 voting used to ensure agreement from PLC1 and PLC2
Discrepancy signal
Input from field devices
Output to process monitors etc.
PLC channel 2 Separate PLC’s for input processing, control logic and output processing
Figure A.1 High-level architecture of the case study E/E/PES
Figure A.1 illustrates the high-level architecture for part of the system that contributed to the mishap that forms the case study for this appendix. Input is received from a range of devices and sensors. These are fed into two independent command channels. They are intended to ensure that near identical data is passed to independent PLC’s that are responsible for detecting and responding to certain input conditions according to the design logic associated with the application. The signals generated by these output PLCs are passed to a separate output card, which uses a form of two-out-of-two voting protocol. Although this is an asynchronous system, under normal operation the two input processing PLCs will sample the same input values and the PLCs will arrive at the same outputs. It is unlikely that any discrepancies will persist. However, if there are any discrepancies between the output states of the two command channels and they persist beyond a timeout then a discrepancy signal is fed back. If the data on the preceding PLC indicates that a valid trip can be performed then it will reset all of its output to a predetermined ‘safe state’ during emergency shutdown.
During the mishap, a sensor detected a fall in the water pressure as hoses were being used to clear the initial spill. However, this transient signal was only received by channel 1. An alarm was triggered on the human operators control panel. If water pressure fell below a threshold value then the control logic was to ensure that the duty firewater pump was started but channel 2 had not received the low-pressure signal. The attempt to start the pump by PLC channel 1, therefore, raised a discrepancy between the two PLC channels. The requirement for agreement between both channels in the ‘two out of two’ protocol also ensured that the relevant pump was not started. By this time, however, PLC channel 1 was already actively monitoring the duty pump to ensure that it had started to address the fall in water pressure.
34

This, in turn, generated a further alarm when the pump failed to respond after a predetermined time out. The logic in PLC channel 1 responded by trying to start another pump. This created a further discrepancy with PLC channel 2, which, of course, was not even monitoring the initial command to the duty pump.
Water pressure had continued to fall throughout this period so that eventually both PLC channels received a further warning signal. They responded with commands to start the duty pump. The pump worked correctly and water pressure began to rise. At this point the operator intervened to turn off the second of the pumps; the command from PLC channel 1 to activate the reserve pump would not have had any effect without agreement from PLC channel 2 anyway. However, the discrepancy over the state of the stand-by pump persisted.
Shortly after this, gas was detected as a result of the original spill. The control logic should have resulted in commands to start the duty firewater pump and to activate a general public alarm throughout the facility. However, the two PLC channels continued to show a discrepancy. Channel 1 had set the duty pump to the reserve mentioned above. Channel 2 retained the original equipment as the duty pump. The system, therefore, performed an emergency shutdown that included a loss of electrical power. This generated a further flood of alarms. It also impaired control over the ballast operation.
It is important to observe that both the suppliers and the operators involved in the incidents that form this case study were entirely unaware of the particular failure modes before they occurred. It is also important to emphasise that the case study cannot be characterised as software or a hardware failure. It stemmed from complex interactions between a number of system components.
A.2.2 Structure of this appendix
The previous section has introduced the objectives for our work and has briefly described the case study that illustrates the remainder of this appendix. Figure A.2 provides an overview of our two investigation schemes. The following pages are structured around the stages in each of these approaches.
The next section of this appendix (A.3) addresses the first stage in the investigation process. It introduces techniques that can be used to elicit information in the aftermath of an E/E/PES related incident. Standard incident reporting forms prompt operators, investigators, component suppliers and integrators to provide necessary information about failures and near misses. We, therefore, describe the information that should be requested by these forms. We also describe how barrier and change analysis provide techniques that can be used to identify additional information requirements during the immediate response to any E/E/PES related incident.
Section A.4 goes on to describe two different forms of causal analysis. In particular, we are concerned to identify a relatively simple approach that is appropriate for lower consequence incidents. This approach uses the flowchart introduced in Part 2. Investigators can identify and categorise the causes of any E/E/PES related mishap by answering a series of questions. The responses that they provide will guide the causal analysis until problems are diagnosed in the IEC 61508 lifecycle or in the common requirements between phases of that lifecycle.
35
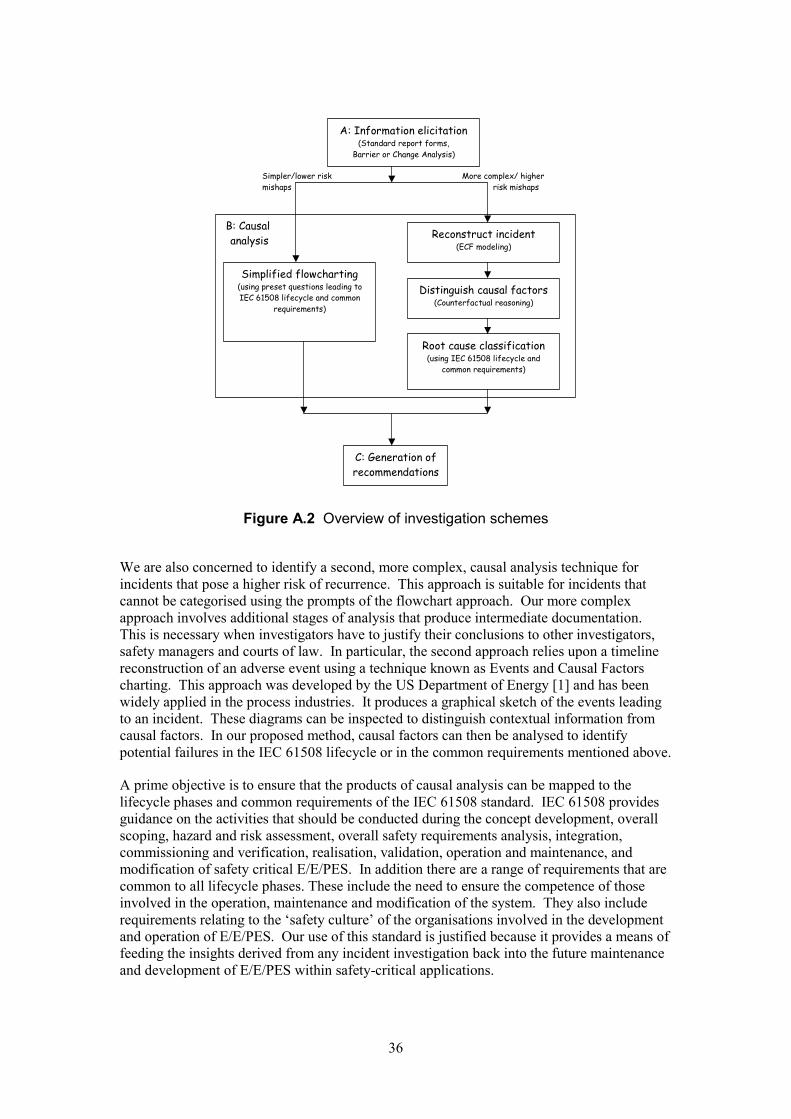
(l )
Simpli ll
)
ling)
Di ll )
( i)
lri i
i
A: Information elicitation Standard report forms,
Barrier or Change Ana ysis
C: Generation of recommendations
B: Causal analysis
ified flowcharting (using preset quest ons eading to IEC 61508 lifecyc e and common
requirements
Reconstruct incident (ECF mode
stinguish causa factors (Counterfactua reasoning
Root cause classification us ng IEC 61508 lifecycle and
common requirements
More comp ex/ higher sk m shaps
Simpler/lower r sk mishaps
Figure A.2 Overview of investigation schemes
We are also concerned to identify a second, more complex, causal analysis technique for incidents that pose a higher risk of recurrence. This approach is suitable for incidents that cannot be categorised using the prompts of the flowchart approach. Our more complex approach involves additional stages of analysis that produce intermediate documentation. This is necessary when investigators have to justify their conclusions to other investigators, safety managers and courts of law. In particular, the second approach relies upon a timeline reconstruction of an adverse event using a technique known as Events and Causal Factors charting. This approach was developed by the US Department of Energy [1] and has been widely applied in the process industries. It produces a graphical sketch of the events leading to an incident. These diagrams can be inspected to distinguish contextual information from causal factors. In our proposed method, causal factors can then be analysed to identify potential failures in the IEC 61508 lifecycle or in the common requirements mentioned above.
A prime objective is to ensure that the products of causal analysis can be mapped to the lifecycle phases and common requirements of the IEC 61508 standard. IEC 61508 provides guidance on the activities that should be conducted during the concept development, overall scoping, hazard and risk assessment, overall safety requirements analysis, integration, commissioning and verification, realisation, validation, operation and maintenance, and modification of safety critical E/E/PES. In addition there are a range of requirements that are common to all lifecycle phases. These include the need to ensure the competence of those involved in the operation, maintenance and modification of the system. They also include requirements relating to the ‘safety culture’ of the organisations involved in the development and operation of E/E/PES. Our use of this standard is justified because it provides a means of feeding the insights derived from any incident investigation back into the future maintenance and development of E/E/PES within safety-critical applications.
36
Section A.5 presents requirements for producing recommendations that are intended to address problems identified using the IEC 61508 classification. It is important that investigators assign relative priorities to each of these. Timescales should be included and any actions taken in response to the recommendations should be documented.
Section A.6 presents our conclusions. It also identifies areas for future research. In particular, we are concerned to gather feedback from the application of both techniques.
A.3 ELICITATION AND INFORMATION GATHERING
Before any causal analysis can begin it is important that investigators collect a range of information about the context in which an adverse event or near miss occurred. Unfortunately, many existing incident reporting forms are inadequate for E/E/PES related incidents. They provide an initial indication that hardware or software components are involved but often neglect to prompt staff for necessary information about the context in which the mishap occurred.
Figure A.3 provides an example of the forms that can be explicitly drafted to elicit information about an E/E/PES related incident. These forms embody a taxonomy for the classification and retrieval of adverse events. Each field helps to determine the information that will be elicited about an adverse event. Such taxonomies have a number of strengths and weaknesses. A significant benefit is that forms provide a minimum set of requirements for the information that should be obtained about an E/E/PES related incident. This is important given the lack of previous guidance on the investigation and analysis of these mishaps.
Forms help to encourage consistency by providing different investigators with a common set of information requirements. However, they can prove restrictive if analysts cannot find an appropriate category against which to classify the incident under investigation. Forms can also become unwieldy and cumbersome if investigators have to complete too many irrelevant fields. Therefore, the following information requirements should be developed to suit the particular needs of different industry sectors with the caveat that safety managers must monitor the usability of the resulting classification. A range of additional forms is included in Part 2. Rather then reproduce these examples in this appendix; the following section reviews the types of information that should be collected during an initial investigation into an E/E/PES related incident.
A.3.1 Design of E/E/PES reporting forms
The person filing an initial report of an adverse event may not know that the mishap was related to an E/E/PES. In this situation, it is important to prompt safety managers or other designated authorities to consider whether such a system was involved. If an E/E/PES is implicated then either the individual who observed the failure or a safety manager must provide initial information about the incident. The nature of this information will largely be determined by their knowledge of the systems involved. For instance, someone involved in the development or integration of an E/E/PES will be able to provide additional detail and insight beyond that which might normally be expected of a system operator. Conversely, someone involved in the operation of the application can provide information about the previous operating history an application process that might not be available to system developers. Different forms must be developed to elicit the different information available to these different groups of people. In either case, it is possible to identify minimum information requirements that should be satisfied in the immediate aftermath of an E/E/PES related incident.
37

Department: Exploration & Development Reported by: C. Wilson (Acting Operations Manager) Date of report 23rd January 2003
Location and Timing Date when the incident(s) 22nd January 2003 occurred Time when incident 11.00-13.10 hrs (GMT) occurred Location of Incident Rgius C (Offshore Production Vessel)
Identification of Equipment: Manufacturer Gryves Sensing Systems Makers name for device(s) Type II Fire and Gas Monitoring System Serial no. Contract no. 324768-A Configuration/version Unknown information Location Sensors distributed throughout vessel. Main control system hardware
located in forward electrical room.
Associated integrity level Unknown (if known)
Outcome and consequences Was any person hurt? No Did any damage to property Minor damage to manual ballast control system occurred when forcing occur? valves to close. Automated control was lost following fire and gas alarm. Was there a loss of Significant production loss. Difficult to estimate total, vessel is still not production? back in production. If so how much? In your view could this have Yes, loss of vessel stability could have occurred if control had not been led to more serious regained over the ballast operation. Loss of electrical and hydraulic power consequences? compromised main vessel power and navigation systems.
Remedial Actions What short term fixes or Manually forced ballast valves to halt transfer operation and correct list. work arounds have been Restarted the fire and gas control system. Request for advice and applied? recommendations sent to monitoring and warning system suppliers. To your knowledge, has this No. problem occurred before?
Incident Description Describe the incident in your own words
Continue on separate sheet if necessary.
A spillage of methanol was detected on board. In order to collect this material, the vessel’s ballast system was used to induce a list. During the clear-up operation, firewater hoses were used to clean the decks. As a result of these operations, the water pressure fell to such a level that the duty firewater pump was automatically started and this increased the pressure to an acceptable level. As the methanol clean-up progressed sensors detected high levels of gas and this initiated a plant shutdown. This included a plant ‘black-out’ with the loss of all electrical power.
Figure A.3 Initial incident report form
38

Identification information
It is important to identify the operating unit or organizational division that is filing the report. In many contexts, this will be obvious. For more diverse cross-sector organizations, such information can help co-workers to determine whether an adverse event is relevant to their particular operation. In confidential schemes, it is possible to request the identity of the person filing the report. In anonymous schemes this will not be possible. The lack of any contact information, therefore, makes it imperative that reporting forms are validated to ensure that they capture sufficient information to inform the subsequent analysis of E/E/PES related incidents.
Location and Timing
It is important to identify when an incident occurred. This may be some time before the consequences of the mishap were observed. These consequences might also result from several repeated failures during the operation of an E/E/PES. Incident reporting forms should also elicit location information that can help to focus further investigations even in situations where contributors are reluctant to reveal their identity.
Identification of Equipment
In an initial reporting form, it is likely that operators will only possess minimal information about the role of E/E/PES within an incident. As the investigation progresses, however, it will be important to provide information about the type of hardware and the version of any software that was involved. This information is, typically, essential for device suppliers and developers to identify and correct any potential failures. Even if it is difficult to obtain device specific information in the aftermath of a mishap, investigators can collect information to characterize the function of the E/E/PES equipment within the wider system. For example, it might provide a protection function; act as an interlock or provide signalling. E/E/PES can also support control, monitoring, alarms, database, calibration, and measurement or communications functions.
The E/E/PES channel in our case study helped to support monitoring functions associated with the provision of mitigation against fire and gas events. We might, therefore, extend the form shown in Figure A.3 to explicitly ask safety managers in this production environment whether any E/E/PES failure related to this critical aspect of system functionality.
Similarly, E/E/PES incident report forms can be developed to elicit information about the system’s mode of operation. For instance, if a particular function involves interaction between the E/E/PES and a human operator then additional human performance data must be gathered about the incident. The nature and scope of such enquiries must be revised if the function involved direct human control or if the E/E/PES were restricted to a more advisory role.
Incident Description
Incident reporting forms are often rejected or criticized by operators because they request information that is either unavailable at the time when the form must be completed or that is irrelevant to the incident being reported. In consequence, the form illustrated in Figure A.3 relies upon a free text description of the adverse event. Safety managers may have to perform additional stages of information elicitation for ‘more serious’ incidents if operators omit important information in their free-text descriptions.
39

Further problems arise if managers must use these descriptions to identify trends and patterns of failure over time. In many cases, this requires the use of databases and spreadsheets to record historic information about previous failures. Safety managers must extract key values from the natural language descriptions of each incident so that necessary information can be recorded in the computer-based systems. The alternative is to encourage operators to enter the information directly into the reporting software. This approach is difficult to sustain and can yield dubious results if individual workers have problems in interpreting the information requested by the strongly typed fields of computer-based reporting systems [2].
Outcome and Consequences
Figure A.3 also includes questions to elicit information about the outcome of an E/E/PES related mishap. The structure of an application has a significant impact on the potential consequences that are associated with E/E/PES related incidents. The outcome of a mishap involving an interconnected component may not simply be determined by that component alone but also by the services that it provides to other system components. Adverse events often expose dependencies or constraints between sub-systems that were not considered during the initial development of a safety-critical application.
The initial investigation of an E/E/PES incident should also identify the particular failure mode that affected the system. Equipment may have failed to operate when required. Conversely, it may have operated when not required or have operated in an unexpected way. In interactive applications, the operator may not have intervened to control the equipment in the manner anticipated by the designer or by line management. In particular, they may have overlooked or misinterpreted the information that was presented to them by the equipment.
As mentioned, the form in Figure A.3 only captures initial information in the aftermath of an E/E/PES related incident. Additional reporting forms must be provided to elicit more detailed data (see Part 2). Safety managers can use this additional information to determine the required integrity level associated with system functionality. This corresponds to the safety integrity level (SIL 1, 2, 3, 4 or unspecified) if IEC 61508 was used to inform system development. The determination of a SIL may be less straightforward for legacy systems where the necessary analysis need not have been performed before the adverse event. The post hoc determination of an integrity level is complicated because the SIL associated with E/E/PES functionality is independent of the actual consequence of any particular incident. This is because the SIL requirement will depend not only on the consequences but the accumulated frequency of all causes requiring the use of the same function.
Near miss incidents may encourage investigators to underestimate the level of integrity that should be associated with particular safety functions. The initial stages of an investigation should, therefore, derive some potential consequence assessment. At this stage it is worth examining the original hazard and risk assessment to ensure that the event being analysed had been identified. If the event was missing from the original analysis or the consequence wrongly predicted there may need to be some reconsideration of the required integrity level. At the highest level, this might involve distinguishing safety and non-safety. In other situations, it might be possible to introduce more fine-grained classifications in terms of lost production, environmental damage or consequent injury. The consequence and outcome section of the form illustrated in Figure A.3 must be revised to capture this information.
40

Remedial Actions
It might seem perverse to initiate corrective action during the initial stages of any incident investigation. It can be argued that any intervention should be postponed until after a more formal causal analysis has taken place. There are circumstances, however, in which the continued safety of an application requires more prompt intervention. An initial investigation can, therefore, initiate or recommend a range of corrective actions including changes either to the E/E/PES or to any equipment under control. These actions may include equipment relocation; environmental protection; hardware repair; version upgrade; equipment replacement and reprogramming. Alternatively, investigators might recommend operational changes to procedures, documentation, access control, warnings, staff training, staff briefing, supervisory practices or maintenance.
The key point is that any interim measures should be adequately documented on an incident report form so that any subsequent investigation and analysis can determine whether there is a need to initiate any further follow-up actions. The initial investigation should also consider if other functions utilize the same type of equipment, procedures or resources and whether there is an immediate need to take actions such as immediate inspection of all similar equipment.
A.3.2 Secondary elicitation techniques: Barrier and change analysis
The previous paragraphs have reviewed the information that must be elicited from incident reporting forms in the aftermath of E/E/PES related incidents. The intention is to provide a template that can be tailored to the specific needs of different organizations within a range of different industries. It should also be stressed that many operators and safety managers will require training in how to complete these forms. Additional cues can be provided, for example by distributing sample completed forms to show the detail that should be provided.
Incident reporting forms are unlikely to yield all of the information that is required about the course of an adverse event. Information must be gathered from automated system logs. Table A.1 recreates part of the alarm log from the monitoring systems in our case study application. It is apparent from this high-level summary that such event based descriptions cannot directly be used to identify the underlying causes of the incidents that they depict. A further limitation is that there may be other events, including operator interventions and management decisions that will only be indirectly represented in these logs. These different information sources must, therefore, be collated to form a more coherent overview of an incident or near miss.
A number of additional techniques extend the scope of an initial investigation to ensure that relevant information is captured in the aftermath of an E/E/PES related incident. Barrier and Change analysis provide high-level frameworks for thinking about the factors that should be considered when gathering necessary information.
41

Table A.1 Example summary from automated alarm log
Point Time State of Description State at start Current status State System the of scan once scan alarm complete
BLS_605 11:27:20 Normal Gas Acknowledged Reset Deleted Fire & detector gas
BLS_605 11:27:37 Beam Gas Nominal Generated Generated Fire & blocked detector gas
BLS_605 11:27:40 Normal Gas Generated Reset Reset Fire & detector gas
BLS_605 11:28:30 Normal Gas Reset Acknowledged Deleted Fire & detector gas
… … … … … … … …
Barrier Analysis
Barrier analysis stems from work in energy production [1]. The central idea is that incidents are caused when unwanted energy flows between a source and a target. Barrier analysis begins by drawing up tables that identify the hazard and the targets involved in an incident or accident. Table A.2 illustrates these entities for the case study in this paper. The purpose of this exercise is to determine precisely which barriers would have to fail before potential targets might actually be affected. The initial tables of barrier analysis often try to consider as many plausible targets as possible.
Table A.2 Hazard and target identification
What? Rationale
Hazard Loss of control of key functions during emergency shutdown
Targets Production system, operators, the environment …
The analysis progresses by examining the barriers that might prevent a hazard from affecting the targets. Analysts must account for the reasons why each barrier actually did or might have failed to protect the target. Table A3 illustrates the output from this stage.
As can be seen, the fire and gas system architecture illustrated in Figure A.1 was intended to prevent the hazard identified in Table A.2. The use of redundancy in a ‘two out of two’ architecture was specifically designed to reduce the number of spurious alarms that might otherwise have led to unnecessary ‘safe’ shutdowns. The meta-level point here is that Barrier analysis encourages designers to look beyond the immediate triggering events that led to the mishap. This is important because it is these triggering events that are most likely to be documented in the initial reports that are filed following E/E/PES related incidents.
42

Table A.3 More detailed barrier analysis
Barrier Reason for failure?
Fire and gas redundant system architecture
Backup ballast valve control system
Pneumatic detection system in automatic deluge equipment
Two out of two voting protocol susceptible to transient failures Knock-on effects of commands during discrepancy had unappreciated effects on state of PLC pipeline Safe-state trip on a discrepancy may create new hazards
Crew used wrong tool to operate solenoids Omissions in crew training and maintenance procedures Need for revised hazard analysis of system operation
Non-return valves leaked Need to improve maintenance standards on non-return valves
Change Analysis
Change analysis looks at the differences that occur between the actual events leading to an incident and ‘normal’ or ‘ideal’ operating practices. Table A.4 provides an example of change analysis. The first column describes the ideal condition or the condition prior to the incident. This is an important distinction because the causes of adverse events often stem from inappropriate practices that continue for many months. In such circumstances, the change analysis would focus less on the conditions immediately before the incident and more on the reasons why practice changed from the ideal some time before the mishap. As with barrier analysis, this technique encourages investigators to gather information about the longer-term, less direct, factors that contribute to a mishap.
Table A.4 Change analysis
Prior/ideal condition Present condition Effect of change
Any (serious) discrepancy should be identified by the operator and appropriate action taken to resolve discrepancy and clear any latched values.
Available generator controls should be distributed across a diverse range of PLC output cards. If a card trips then it should not disable all possible generating sets.
The discrepancy was noted at such a low level that the operator was not informed. So when he/she detected the fire pump start was spurious they halted the pump but did not resolve the discrepancy between PLC channels 1 and 2.
When the PLC channels tripped, both available generators were on the same cards.
The system was left with a latent failure in the form of the discrepancy. It was vulnerable to any genuine adverse event because the discrepancy and such an event would cause the two PLC channels to trip.
All power was lost.
43
A.3.3 Summary
This section has identified the information that must be elicited in the aftermath of an E/E/PES related incident. This includes data on the time and location of an adverse event. It also includes information that can be used to identify the E/E/PES that contributed to the incident or near miss. Operators and safety managers must also assess the potential outcome of a mishap. It is necessary to document any interim measures that are taken to safeguard the continued operation of an application process.
Reporting forms and system logs provide the primary means of gathering this information. However, barrier and change analysis also help to identify relevant information about the longer-term causes of incidents and near misses. Care must be taken to avoid the overheads associated with the capture of irrelevant or unnecessary information. Forms must be revised in the light of experience so that operators only provide information that is used within the investigative process. The intention is to provide sufficient detail to support the causal analysis that is described in the next section.
A.4 CAUSAL ANALYSIS
The previous section has identified a range of information that must be captured in the aftermath of E/E/PES related incidents. For minor mishaps and many near-miss incidents, an investigation could end after this information has been gathered. However, the integrity level of the function performed by particular equipment or the potential consequences of the incident can persuade investigators to initiate a more formal investigation. Similarly, E/E/PES applications and technology range in complexity. Causal analysis can be relatively straightforward when simple technology is used to satisfy simple functional requirements. In these simpler, low consequence cases it may be possible to directly identify causal factors without recourse to a more formal methodology providing that adequate justification is provided. With complex systems or higher ‘risk’ mishaps, a more formal approach is required.
This section, therefore, introduces two different approaches that can be applied to identify the ‘root’ causes of E/E/PES incidents from the information that has been gathered in the immediate aftermath of an adverse event. The first is based on a series of questions that guide investigators through a flowchart. This approach is relatively simple. It represents a low-cost form of causal analysis that can be applied with minimal training. This technique is insufficient for more complex incidents. The second approach, therefore, avoids any preformatted questions. Instead, it relies upon Events and Causal Factors charting [1]. Figure A.2 provides a high-level overview of these two complementary approaches within the wider investigation process.
E/E/PES mishaps stem from a diverse range of causal factors. These include operator ‘error’, maintenance issues, calibration problems, environmental issues, equipment functionality problems, equipment interfacing issues and hardware faults. In most other forms of accident or incident investigation, we would map each of these inadequacies back to the managerial and organizational influences that created the preconditions for each of these failures. For example, we might consider whether operator training had emphasized the importance of monitoring individual alarms and warnings from each of the two PLC channels.
The following paragraphs show how the output from both proposed causal analysis techniques can be used to identify the precursors of E/E/PES related incidents in particular phases or to the violation of common requirements across several phases of the development
44

lifecycle within IEC 61508. Our use of this standard provides means of using the products of mishap analysis to inform the future development and operation of safety-critical systems.
A.4.1 Root causes of E/E/PES related incidents under IEC 61508
One way of ensuring that a causal analysis technique supported redesign would be to identify those clauses in a standard that are intended to prevent particular problems from affecting the design and operation of a safety-critical system. In our case study, the decision to use the same card set to control all of the generators could be traced back to an inadequate risk assessment. Had this process been carried out in a more rigorous fashion then the common failure modes might have been identified.
This approach suffers from a number of problems. Firstly, it implies that had the company followed the standard then the incident would have been avoided. Although this is the case in the example we have included, it is in many cases difficult to find the detailed evidence required to support such counterfactual arguments [2]. There are also a number of more practical issues that must be addressed. It is unlikely that the end user will have all of the information required to trace an incident back to causes that stem from early stages in the E/E/PES lifecycle. They may also have a limited interest in supporting a more detailed causal analysis if they cannot directly affect changes in the systems that they use. Conversely, system developers may lack necessary information about how the system was deployed within a more complex application process. Unless they have access to this data then it can be difficult to pin down the particular causes of an adverse event. Some of these objections can be answered by gathering data from the different groups involved in the development of E/E/PES. This may be difficult since in many cases design teams may no longer exist by the time the equipment becomes operational.
Further problems complicate attempts to trace the causes of a mishap back to the violation of requirements in particular development standards. For instance, IEC 61508 contains a mass of detailed clauses. Any comprehensive taxonomy would be so complex that it would be unwieldy and difficult to apply. Our causal analysis techniques therefore only include headings from the main stages of development within this standard, namely:
· system conception
· overall scoping of the system
· hazard and risk assessment
· identification of overall safety requirements
· function and integrity level allocation
· planning of installation and commissioning
· planning of validation
· planning of operation and maintenance
· realization
· performance of installation and commissioning
· conduct of validation
· performance of operations and maintenance and subsequent modification.
45
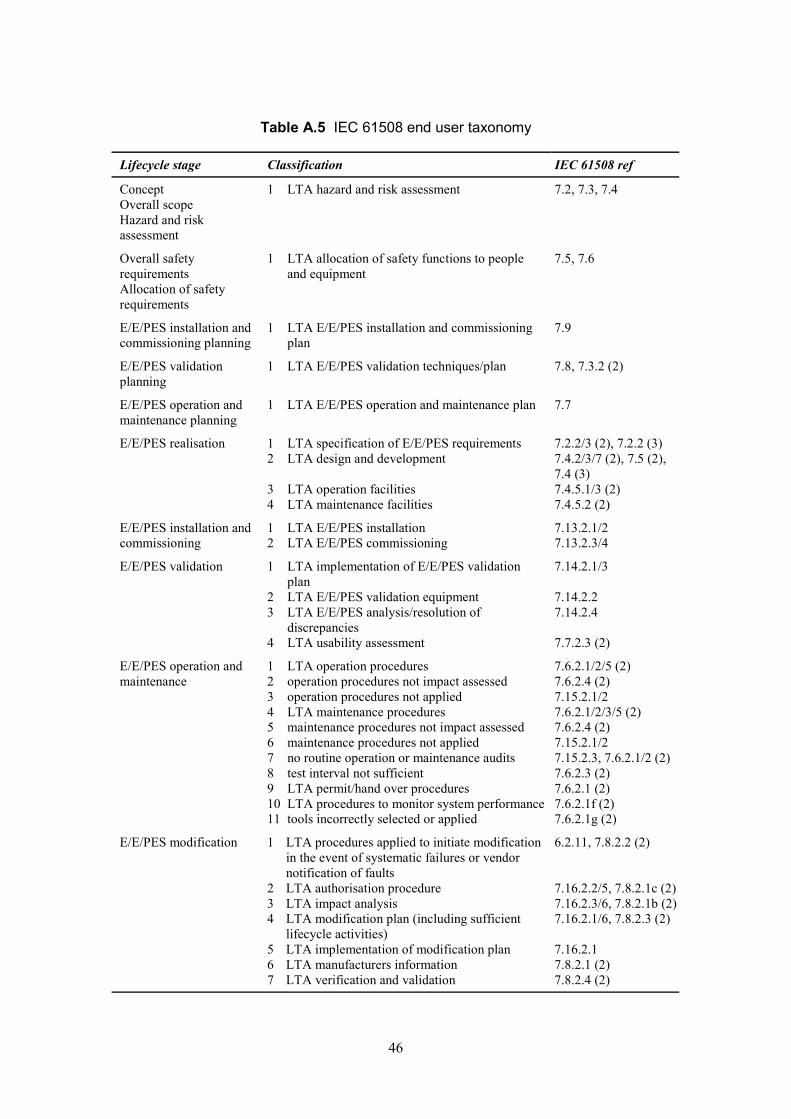
Table A.5 IEC 61508 end user taxonomy
Lifecycle stage Classification IEC 61508 ref
Concept 1 LTA hazard and risk assessment 7.2, 7.3, 7.4 Overall scope Hazard and risk assessment
Overall safety 1 LTA allocation of safety functions to people 7.5, 7.6 requirements and equipment Allocation of safety requirements
E/E/PES installation and 1 LTA E/E/PES installation and commissioning 7.9 commissioning planning plan
E/E/PES validation 1 LTA E/E/PES validation techniques/plan 7.8, 7.3.2 (2) planning
E/E/PES operation and 1 LTA E/E/PES operation and maintenance plan 7.7 maintenance planning
E/E/PES realisation 1 LTA specification of E/E/PES requirements 7.2.2/3 (2), 7.2.2 (3) 2 LTA design and development 7.4.2/3/7 (2), 7.5 (2),
7.4 (3) 3 LTA operation facilities 7.4.5.1/3 (2) 4 LTA maintenance facilities 7.4.5.2 (2)
E/E/PES installation and 1 LTA E/E/PES installation 7.13.2.1/2 commissioning 2 LTA E/E/PES commissioning 7.13.2.3/4
E/E/PES validation 1 LTA implementation of E/E/PES validation 7.14.2.1/3 plan
2 LTA E/E/PES validation equipment 7.14.2.2 3 LTA E/E/PES analysis/resolution of 7.14.2.4
discrepancies 4 LTA usability assessment 7.7.2.3 (2)
E/E/PES operation and 1 LTA operation procedures 7.6.2.1/2/5 (2) maintenance 2 operation procedures not impact assessed 7.6.2.4 (2)
3 operation procedures not applied 7.15.2.1/2 4 LTA maintenance procedures 7.6.2.1/2/3/5 (2) 5 maintenance procedures not impact assessed 7.6.2.4 (2) 6 maintenance procedures not applied 7.15.2.1/2 7 no routine operation or maintenance audits 7.15.2.3, 7.6.2.1/2 (2) 8 test interval not sufficient 7.6.2.3 (2) 9 LTA permit/hand over procedures 7.6.2.1 (2) 10 LTA procedures to monitor system performance 7.6.2.1f (2) 11 tools incorrectly selected or applied 7.6.2.1g (2)
E/E/PES modification 1 LTA procedures applied to initiate modification 6.2.11, 7.8.2.2 (2) in the event of systematic failures or vendor notification of faults
2 LTA authorisation procedure 7.16.2.2/5, 7.8.2.1c (2) 3 LTA impact analysis 7.16.2.3/6, 7.8.2.1b (2) 4 LTA modification plan (including sufficient 7.16.2.1/6, 7.8.2.3 (2)
lifecycle activities) 5 LTA implementation of modification plan 7.16.2.1 6 LTA manufacturers information 7.8.2.1 (2) 7 LTA verification and validation 7.8.2.4 (2)
46
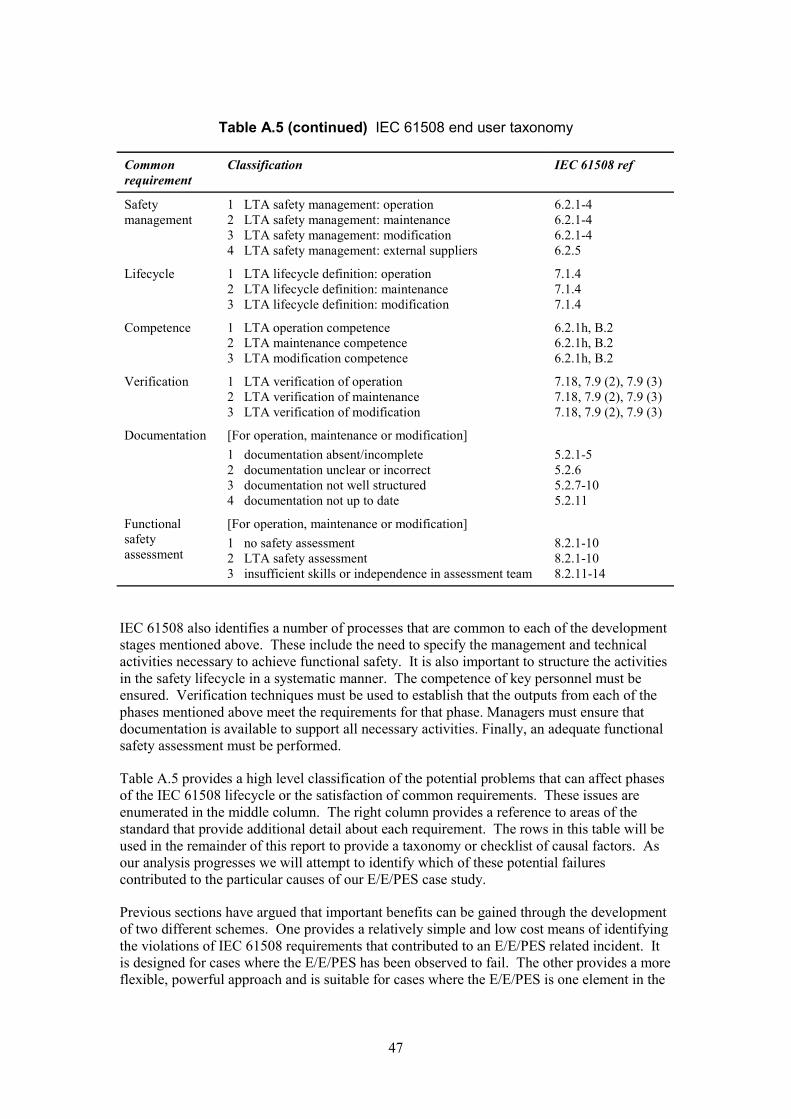
Table A.5 (continued) IEC 61508 end user taxonomy
Common Classification IEC 61508 ref requirement
Safety 1 LTA safety management: operation 6.2.1-4 management 2 LTA safety management: maintenance 6.2.1-4
3 LTA safety management: modification 6.2.1-4 4 LTA safety management: external suppliers 6.2.5
Lifecycle 1 LTA lifecycle definition: operation 7.1.4 2 LTA lifecycle definition: maintenance 7.1.4 3 LTA lifecycle definition: modification 7.1.4
Competence 1 LTA operation competence 6.2.1h, B.2 2 LTA maintenance competence 6.2.1h, B.2 3 LTA modification competence 6.2.1h, B.2
Verification 1 LTA verification of operation 7.18, 7.9 (2), 7.9 (3) 2 LTA verification of maintenance 7.18, 7.9 (2), 7.9 (3) 3 LTA verification of modification 7.18, 7.9 (2), 7.9 (3)
Documentation [For operation, maintenance or modification] 1 documentation absent/incomplete 5.2.1-5 2 documentation unclear or incorrect 5.2.6 3 documentation not well structured 5.2.7-10 4 documentation not up to date 5.2.11
Functional [For operation, maintenance or modification] safety assessment
1 2
no safety assessment LTA safety assessment
8.2.1-10 8.2.1-10
3 insufficient skills or independence in assessment team 8.2.11-14
IEC 61508 also identifies a number of processes that are common to each of the development stages mentioned above. These include the need to specify the management and technical activities necessary to achieve functional safety. It is also important to structure the activities in the safety lifecycle in a systematic manner. The competence of key personnel must be ensured. Verification techniques must be used to establish that the outputs from each of the phases mentioned above meet the requirements for that phase. Managers must ensure that documentation is available to support all necessary activities. Finally, an adequate functional safety assessment must be performed.
Table A.5 provides a high level classification of the potential problems that can affect phases of the IEC 61508 lifecycle or the satisfaction of common requirements. These issues are enumerated in the middle column. The right column provides a reference to areas of the standard that provide additional detail about each requirement. The rows in this table will be used in the remainder of this report to provide a taxonomy or checklist of causal factors. As our analysis progresses we will attempt to identify which of these potential failures contributed to the particular causes of our E/E/PES case study.
Previous sections have argued that important benefits can be gained through the development of two different schemes. One provides a relatively simple and low cost means of identifying the violations of IEC 61508 requirements that contributed to an E/E/PES related incident. It is designed for cases where the E/E/PES has been observed to fail. The other provides a more flexible, powerful approach and is suitable for cases where the E/E/PES is one element in the
47
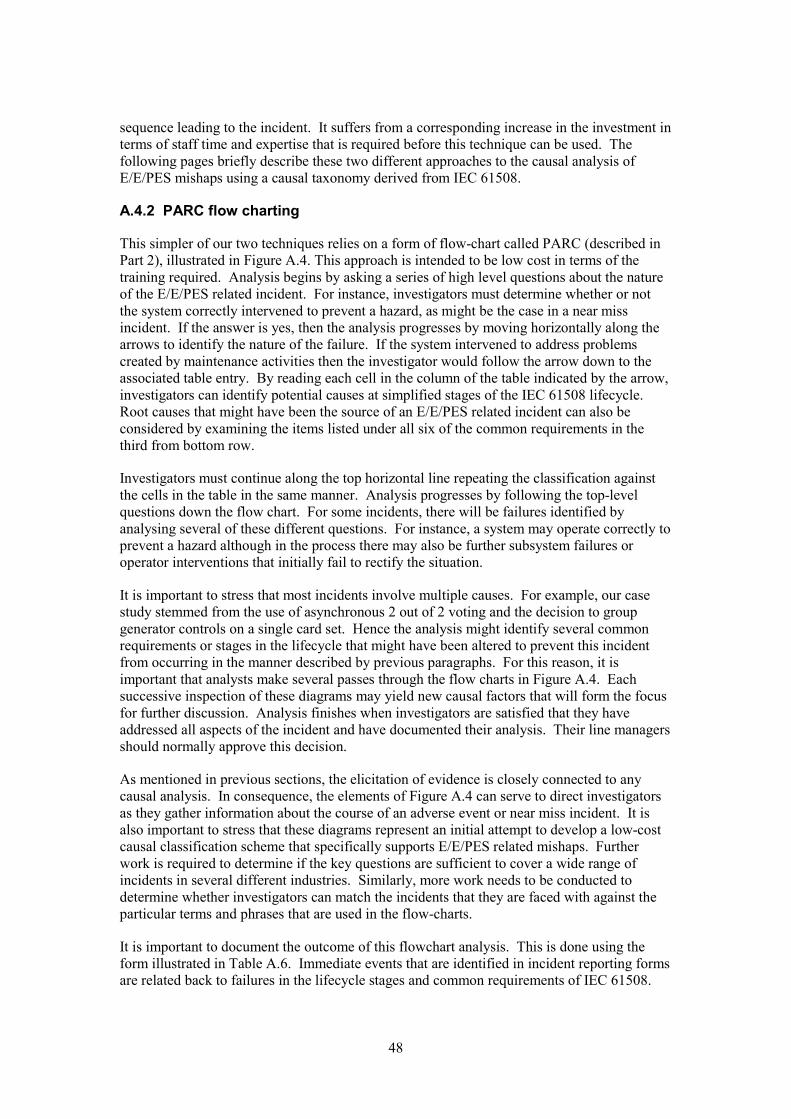
sequence leading to the incident. It suffers from a corresponding increase in the investment in terms of staff time and expertise that is required before this technique can be used. The following pages briefly describe these two different approaches to the causal analysis of E/E/PES mishaps using a causal taxonomy derived from IEC 61508.
A.4.2 PARC flow charting
This simpler of our two techniques relies on a form of flow-chart called PARC (described in Part 2), illustrated in Figure A.4. This approach is intended to be low cost in terms of the training required. Analysis begins by asking a series of high level questions about the nature of the E/E/PES related incident. For instance, investigators must determine whether or not the system correctly intervened to prevent a hazard, as might be the case in a near miss incident. If the answer is yes, then the analysis progresses by moving horizontally along the arrows to identify the nature of the failure. If the system intervened to address problems created by maintenance activities then the investigator would follow the arrow down to the associated table entry. By reading each cell in the column of the table indicated by the arrow, investigators can identify potential causes at simplified stages of the IEC 61508 lifecycle. Root causes that might have been the source of an E/E/PES related incident can also be considered by examining the items listed under all six of the common requirements in the third from bottom row.
Investigators must continue along the top horizontal line repeating the classification against the cells in the table in the same manner. Analysis progresses by following the top-level questions down the flow chart. For some incidents, there will be failures identified by analysing several of these different questions. For instance, a system may operate correctly to prevent a hazard although in the process there may also be further subsystem failures or operator interventions that initially fail to rectify the situation.
It is important to stress that most incidents involve multiple causes. For example, our case study stemmed from the use of asynchronous 2 out of 2 voting and the decision to group generator controls on a single card set. Hence the analysis might identify several common requirements or stages in the lifecycle that might have been altered to prevent this incident from occurring in the manner described by previous paragraphs. For this reason, it is important that analysts make several passes through the flow charts in Figure A.4. Each successive inspection of these diagrams may yield new causal factors that will form the focus for further discussion. Analysis finishes when investigators are satisfied that they have addressed all aspects of the incident and have documented their analysis. Their line managers should normally approve this decision.
As mentioned in previous sections, the elicitation of evidence is closely connected to any causal analysis. In consequence, the elements of Figure A.4 can serve to direct investigators as they gather information about the course of an adverse event or near miss incident. It is also important to stress that these diagrams represent an initial attempt to develop a low-cost causal classification scheme that specifically supports E/E/PES related mishaps. Further work is required to determine if the key questions are sufficient to cover a wide range of incidents in several different industries. Similarly, more work needs to be conducted to determine whether investigators can match the incidents that they are faced with against the particular terms and phrases that are used in the flow-charts.
It is important to document the outcome of this flowchart analysis. This is done using the form illustrated in Table A.6. Immediate events that are identified in incident reporting forms are related back to failures in the lifecycle stages and common requirements of IEC 61508.
48

This allocation process is guided by the questions in Figure A.4. The allocation is also supported by a justification that is intended to document any intermediate reasoning to other investigators and co-workers.
Table A.6 Abridged flowchart summary
Causal event IEC 61508 lifecycle/ Justification (route through flow chart) common requirement
Loss of electrical power Design Incorrect action taken by system-> and associated plant system takes unnecessary action->
The incident would have been prevented if design requirements were better documented (No removal of power to safety related ballast system)
Failure to control Operation and Incorrect action taken by system-> ballast operation using maintenance The incident would have been prevented if E/E/PES and delays in documentation was clear about manual action to manual operation take in the event of a power loss during ballasting
This analysis focuses on the operators’ perspective on this incident. It does not look back into the detail design and development life cycle of the E/E/PES. In order to do this, the flowcharts would have to be considerably extended. Additional questions would be needed to guide the investigator towards the lifecycle phases, such as hazard and risk assessment, and common requirements that contribute towards the development and installation of an E/E/PES.
The flow chart method is not well suited to the case study because the root cause is not a failure of the PES but originates from a failure to undertake a comprehensive hazard identification that included failure modes of the PES. Although the method can be extended, the resulting flow charts will be considerably more complex than those shown in the previous diagrams. This increased complexity arguably sacrifices many of the benefits associated with this simple approach. The resulting diagrams would extend over several pages making the questions difficult to follow at lower levels within the chart. The following section, therefore, presents a more sophisticated analytical technique that is intended to be used to extend the analysis.
A.4.3 Event and causal factor analysis
The previous section has presented a low-cost and relatively straightforward approach based on flowcharts. This is particularly appropriate for use by the members of end-user organisations engaged in operations and maintenance. These individuals, typically, have limited access to information about the conduct of early stages in the E/E/PES lifecycle. In contrast, this section presents a more complex technique that provides a further bridge between causal analysis and components of IEC 61508.
49

Sys
tem
ope
rate
s co
rrect
ly
to p
reve
nt h
azar
d
Syst
em fa
ils o
n pr
oof t
est
Syst
em fa
ils to
take
act
ion
whe
n re
quire
d or
take
s ac
tion
whe
n no
t req
uire
d
Sys
tem
ope
rate
sco
rrect
lyto
pre
vent
haz
ard
Syst
em fa
ils o
n pr
oof t
est
Syst
emfa
ils to
take
act
ion
whe
n re
quire
d or
take
s ac
tion
whe
n no
t req
uire
d
Yes
Yes
Dem
and
caus
ed b
y m
aint
enan
ce a
ctio
n D
eman
d ca
used
by
oper
atio
n er
ror
Dem
and
caus
ed b
y eq
uipm
ent d
egra
datio
n D
eman
d ca
used
by
mai
nten
ance
act
ion
Dem
and
caus
ed b
yop
erat
ion
erro
rD
eman
d ca
used
by
equi
pmen
t deg
rada
tion
Yes
Yes
Yes
Yes
Yes
Yes
Yes
Yes
Setti
ng is
in
corre
ct
Setti
ng is
inco
rrect
Failu
re c
ause
d by
mai
nten
ance
ac
tion
Failu
re c
ause
d by
mai
nten
ance
actio
n
Failu
re c
ause
d by
ope
ratio
n er
ror
Failu
re c
ause
dby
ope
ratio
n er
ror
Failu
re c
ause
d by
equ
ipm
ent
degr
adat
ion
Failu
re c
ause
dby
equ
ipm
ent
degr
adat
ion
Dem
and
caus
ed b
y in
appr
opria
te fu
nctio
n
Failu
re c
ause
d by
inap
prop
riate
fu
nctio
n
Ran
dom
ha
rdw
are
failu
re
Yes
Dem
and
caus
ed b
yin
appr
opria
te fu
nctio
n
Failu
re c
ause
d by
inap
prop
riate
fu
nctio
n
Ran
dom
hard
war
e fa
ilure
Yes
Yes
Yes
Yes
Yes
Yes
Yes
Yes
Yes
Yes
Yes
Yes
Yes
Yes
Yes
50
Figure A.4 PARC causal analysis flowchart
Log
failu
re a
nd c
heck
–
if da
nger
ous
failu
re
rate
is in
line
with
de
sign
ass
umpt
ions
–
if al
l exp
ecte
d ac
tions
oc
curre
d an
d no
un
expe
cted
act
ions
oc
curre
d –
if sa
fe fa
ilure
cau
ses
any
unex
pect
ed
actio
ns
Log
dem
and
and
chec
k –
if de
man
d ra
te is
in
line
with
des
ign
assu
mpt
ions
–
if de
man
d ca
use
was
pr
edic
ted
in h
azar
d an
d ris
k an
alys
is
– eq
uipm
ent u
sed
or
inst
alla
tion
desi
gn h
ad
been
revi
ewed
dur
ing
impa
ct a
naly
sis
– eq
uipm
ent u
sed
or
inst
alla
tion
desi
gn h
ad
been
revi
ewed
dur
ing
impa
ct a
naly
sis
– op
erat
ion
faci
litie
s or
pr
oced
ures
had
bee
n re
view
ed d
urin
g im
pact
an
alys
is
– m
aint
enan
ce fa
cilit
ies
or
proc
edur
es h
ad b
een
revi
ewed
dur
ing
impa
ct
anal
ysis
– se
tting
had
bee
n re
view
ed d
urin
g im
pact
an
alys
is
Mod
ifica
tion
– m
aint
enan
ce p
roce
dure
s w
ere
impr
oved
–
mai
nten
ance
tool
s w
ere
impr
oved
–
test
inte
rval
was
redu
ced
– ad
ditio
nal p
rote
ctio
n w
as
prov
ided
– m
aint
enan
ce p
roce
dure
s w
ere
appl
ied
– m
aint
enan
ce p
roce
dure
s w
ere
impr
oved
–
test
inte
rval
was
redu
ced
– ad
ditio
nal p
rote
ctio
n w
as
prov
ided
– co
rrect
ope
ratio
n pr
oced
ure
had
been
use
d –
oper
atio
n pr
oced
ure
was
im
prov
ed
– pe
rmit
proc
edur
es w
ere
impr
oved
– co
rrect
mai
nten
ance
pr
oced
ure
had
been
use
d –
mai
nten
ance
pro
cedu
re
was
impr
oved
–
perm
it pr
oced
ures
wer
e im
prov
ed
– m
aint
enan
ce p
roce
dure
s w
ere
appl
ied
– m
aint
enan
ce p
roce
dure
s w
ere
impr
oved
–
mai
nten
ance
tool
s w
ere
impr
oved
–
test
inte
rval
was
redu
ced
Ope
ratio
n &
m
aint
enan
ce
– eq
uipm
ent c
ondi
tion
had
been
fully
che
cked
–
equi
pmen
t con
ditio
n ha
d be
en fu
lly c
heck
ed
– op
erat
ion
faci
litie
s ha
d be
en fu
lly c
heck
ed
– m
aint
enan
ce fa
cilit
ies
had
been
fully
che
cked
–
the
setti
ng h
ad b
een
chec
ked
durin
g va
lidat
ion
Valid
atio
n
– th
e eq
uipm
ent h
ad b
een
inst
alle
d ac
cord
ing
to
desi
gn
– th
e eq
uipm
ent h
ad b
een
inst
alle
d ac
cord
ing
to
desi
gn
– op
erat
ion
faci
litie
s ha
d be
en in
stal
led
acco
rdin
g to
des
ign
– m
aint
enan
ce fa
cilit
ies
had
been
inst
alle
d ac
cord
ing
to d
esig
n
– th
e eq
uipm
ent h
ad b
een
inst
alle
d ac
cord
ing
to
desi
gn
Inst
alla
tion
&
com
mis
sion
in
g
– di
ffere
nt e
quip
men
t had
be
en s
elec
ted
– th
e in
stal
latio
n de
sign
ha
d be
en d
iffer
ent
– co
nfig
urat
ion
was
cor
rect
– di
ffere
nt e
quip
men
t had
be
en s
elec
ted
– th
e in
stal
latio
n de
sign
ha
d be
en d
iffer
ent
– op
erat
ion
faci
litie
s ha
d be
en d
esig
ned
adeq
uate
ly
– m
aint
enan
ce fa
cilit
ies
had
been
des
igne
d ad
equa
tely
– di
ffere
nt e
quip
men
t had
be
en s
elec
ted
– th
e in
stal
latio
n de
sign
had
be
en d
iffer
ent
– sp
ecifi
catio
n w
as c
orre
ct
Des
ign
– ha
zard
and
risk
ana
lysi
s ha
d co
nsid
ered
all
mod
es
of o
pera
tion
and
caus
es
– ha
zard
and
risk
ana
lysi
s ha
d co
nsid
ered
all
mod
es
of o
pera
tion
and
caus
es
– ha
zard
and
risk
ana
lysi
s ha
d co
nsid
ered
all
mod
es
of o
pera
tion
and
caus
es
Syst
em
conc
ept
Wou
ld th
e in
cide
nt h
ave
been
pre
vent
ed if
Safe
ty a
sses
smen
tD
ocum
enta
tion
Safe
ty m
anag
emen
tVe
rific
atio
nLi
fecy
cle
Com
pete
nce
– m
odifi
catio
n ha
d be
en
asse
ssed
– op
erat
ion
and
mai
nten
ance
ph
ase
had
been
ass
esse
d
– do
cum
enta
tion
had
been
upd
ated
–
acco
unta
bilit
ies
wer
e be
tter
defin
ed
– su
pplie
rs h
ad b
een
revi
ewed
– a
bette
r ver
ifica
tion
sche
me
had
been
in p
lace
–
mod
ifica
tion
lifec
ycle
w
as b
ette
r def
ined
–
mod
ifica
tion
had
been
ca
rried
out
by
mor
e co
mpe
tent
sta
ff
Mod
ifica
tion
– do
cum
enta
tion
was
cl
ear a
nd s
uffic
ient
–
safe
ty c
ultu
re w
as im
prov
ed
– au
dits
wer
e m
ore
frequ
ent
– a
bette
r ver
ifica
tion
sche
me
had
been
in p
lace
–
resp
onsi
bilit
ies
wer
e de
fined
bet
ter
– op
erat
ion
or m
aint
enan
ce
staf
f wer
e m
ore
com
pete
nt
Ope
ratio
n &
m
aint
enan
ce
Wou
ld th
e in
cide
nt h
ave
been
pre
vent
ed if
Log
failu
re a
nd c
heck
–if
dang
erou
s fa
ilure
rate
is in
line
with
desi
gn a
ssum
ptio
ns–
if al
lexp
ecte
d ac
tions
oc
curre
d an
dno
unex
pect
ed a
ctio
nsoc
curre
d–
if sa
fe fa
ilure
cau
ses
any
unex
pect
edac
tions
Log
dem
and
and
chec
k–
if de
man
d ra
te is
inlin
e w
ithde
sign
assu
mpt
ions
–if
dem
and
caus
e w
as
pred
icte
d in
haz
ard
and
risk
anal
ysis
–eq
uipm
ent u
sed
orin
stal
latio
n de
sign
had
be
en re
view
ed d
urin
g im
pact
ana
lysi
s
–eq
uipm
ent u
sed
orin
stal
latio
n de
sign
had
been
revi
ewed
dur
ing
impa
ct a
naly
sis
–op
erat
ion
faci
litie
sor
proc
edur
es h
ad b
een
revi
ewed
dur
ing
impa
ct
anal
ysis
–m
aint
enan
ce fa
cilit
ies
orpr
oced
ures
had
bee
n re
view
ed d
urin
g im
pact
anal
ysis
–se
tting
had
bee
n re
view
ed d
urin
g im
pact
anal
ysis
Mod
ifica
tion
–m
aint
enan
ce p
roce
dure
sw
ere
impr
oved
–m
aint
enan
ce to
ols
wer
eim
prov
ed–
test
inte
rval
was
redu
ced
–ad
ditio
nal p
rote
ctio
nw
aspr
ovid
ed
–m
aint
enan
ce p
roce
dure
sw
ere
appl
ied
–m
aint
enan
ce p
roce
dure
sw
ere
impr
oved
–te
st in
terv
alw
asre
duce
d–
addi
tiona
l pro
tect
ion
was
prov
ided
–co
rrect
ope
ratio
n pr
oced
ure
had
been
use
d–
oper
atio
n pr
oced
ure
was
im
prov
ed–
perm
it pr
oced
ures
wer
eim
prov
ed
–co
rrect
mai
nten
ance
pr
oced
ure
had
been
used
–m
aint
enan
ce p
roce
dure
w
as im
prov
ed–
perm
it pr
oced
ures
wer
eim
prov
ed
–m
aint
enan
ce p
roce
dure
sw
ere
appl
ied
–m
aint
enan
ce p
roce
dure
sw
ere
impr
oved
–m
aint
enan
ce to
ols
wer
eim
prov
ed–
test
inte
rval
was
redu
ced
Ope
ratio
n &
mai
nten
ance
–eq
uipm
ent c
ondi
tion
had
been
fully
chec
ked
–eq
uipm
ent c
ondi
tion
had
been
fully
che
cked
–op
erat
ion
faci
litie
sha
d be
en fu
llych
ecke
d–
mai
nten
ance
faci
litie
s ha
d be
en fu
lly c
heck
ed–
the
setti
ng h
ad b
een
chec
ked
durin
g va
lidat
ion
Valid
atio
n
–th
e eq
uipm
ent h
adbe
en
inst
alle
d ac
cord
ing
tode
sign
–th
e eq
uipm
ent h
ad b
een
inst
alle
d ac
cord
ing
tode
sign
–op
erat
ion
faci
litie
sha
d be
en in
stal
led
acco
rdin
g to
des
ign
–m
aint
enan
ce fa
cilit
ies
had
been
inst
alle
d ac
cord
ing
to d
esig
n
–th
e eq
uipm
ent h
adbe
en
inst
alle
d ac
cord
ing
tode
sign
Inst
alla
tion
&co
mm
issi
on-
ing
–di
ffere
nt e
quip
men
t had
be
en s
elec
ted
–th
e in
stal
latio
n de
sign
had
been
diffe
rent
–co
nfig
urat
ion
was
cor
rect
–di
ffere
nt e
quip
men
t had
been
sel
ecte
d–
the
inst
alla
tion
desi
gnha
d be
en d
iffer
ent
–op
erat
ion
faci
litie
sha
d be
en d
esig
ned
adeq
uate
ly
–m
aint
enan
ce fa
cilit
ies
had
been
des
igne
dad
equa
tely
–di
ffere
nt e
quip
men
t had
been
sel
ecte
d–
the
inst
alla
tion
desi
gn h
ad
been
diff
eren
t–
spec
ifica
tion
was
cor
rect
Des
ign
–ha
zard
and
risk
ana
lysi
sha
d co
nsid
ered
allm
odes
of
ope
ratio
nan
d ca
uses
–ha
zard
and
risk
ana
lysi
s ha
dco
nsid
ered
all
mod
es
of o
pera
tion
and
caus
es
–ha
zard
and
risk
ana
lysi
sha
d co
nsid
ered
all
mod
esof
ope
ratio
n an
dca
uses
Syst
emco
ncep
t
Wou
ldth
ein
cide
nt h
ave
been
pre
vent
edif
Safe
ty a
sses
smen
tD
ocum
enta
tion
Safe
ty m
anag
emen
tVe
rific
atio
nLi
fecy
cle
Com
pete
nce
–m
odifi
catio
n ha
d be
en
asse
ssed
–op
erat
ion
and
mai
nten
ance
phas
e ha
d be
en a
sses
sed
–do
cum
enta
tion
had
been
upd
ated
–ac
coun
tabi
litie
s w
ere
bette
rde
fined
–su
pplie
rs h
ad b
een
revi
ewed
–a
bette
r ver
ifica
tion
sche
me
had
been
in p
lace
–m
odifi
catio
n lif
ecyc
le
was
bet
ter d
efin
ed–
mod
ifica
tion
had
been
ca
rried
out
by m
ore
com
pete
nt s
taff
Mod
ifica
tion
–do
cum
enta
tion
was
cl
ear a
ndsu
ffici
ent
–sa
fety
cultu
re w
as im
prov
ed–
audi
ts w
ere
mor
e fre
quen
t–
a be
tter v
erifi
catio
nsc
hem
e ha
dbe
en in
pla
ce–
resp
onsi
bilit
ies
wer
ede
fined
bet
ter
–op
erat
ion
orm
aint
enan
cest
aff w
ere
mor
e co
mpe
tent
Ope
ratio
n &
mai
nten
ance
Wou
ldth
ein
cide
nt h
ave
been
pre
vent
edif

Con
tinue
d fr
om p
revi
ous
page
Con
tinue
d fr
ompr
evio
us p
age
Inco
rrect
act
ion
take
n by
sys
tem
or o
pera
tor
Inco
rrect
act
ion
take
n by
syst
em o
r ope
rato
r
Yes
Yes
No
actio
n by
op
erat
or a
llow
s de
man
d on
sys
tem
Syst
em a
ctio
ns
insu
ffici
ent t
o te
rmin
ate
haza
rd
Ope
rato
r fai
ls to
m
itiga
te h
azar
d
Syst
em ta
kes
unpr
edic
ted
actio
ns
Miti
gatio
n by
sy
stem
is
inad
equa
te
Ran
dom
ha
rdw
are
failu
re
No
actio
nby
oper
ator
allo
ws
dem
and
on s
yste
m
Syst
em a
ctio
ns
insu
ffici
ent t
ote
rmin
ate
haza
rd
Ope
rato
r fai
ls to
miti
gate
haz
ard
Syst
em ta
kes
unpr
edic
ted
actio
ns
Miti
gatio
n by
syst
em is
inad
equa
te
Ran
dom
hard
war
e fa
ilure
Yes
Yes
Yes
Yes
Yes
Yes
Yes
Yes
Yes
Yes
Yes
Yes
51
Figure A.4 (continued) PARC causal analysis flowchart
Log
failu
re a
nd c
heck
– if
dang
erou
s fa
ilure
ra
te is
in li
ne w
ith
desi
gn a
ssum
ptio
ns
– if
all e
xpec
ted
actio
ns
occu
rred
and
no
unex
pect
ed a
ctio
ns
occu
rred
– if
safe
failu
re c
ause
s an
y un
expe
cted
ac
tions
Log
dem
and
and
chec
k –
if de
man
d ra
te is
in
line
with
des
ign
assu
mpt
ions
–
if de
man
d ca
use
was
pr
edic
ted
in h
azar
d an
d ris
k an
alys
is
– ne
ed fo
r miti
gatio
n ha
d be
en re
view
ed d
urin
g im
pact
ana
lysi
s
– ne
ed fo
r miti
gatio
n ha
d be
en re
view
ed d
urin
g im
pact
ana
lysi
s
– ne
cess
ary
syst
em a
ctio
ns
had
been
revi
ewed
dur
ing
impa
ct a
naly
sis
– ne
cess
ary
syst
em a
ctio
ns
had
been
revi
ewed
dur
ing
impa
ct a
naly
sis
– op
erat
ion
faci
litie
s ha
d be
en re
view
ed d
urin
g im
pact
ana
lysi
s
Mod
ifica
tion
– op
erat
ion
proc
edur
es h
ad
been
app
lied
– op
erat
ion
faci
litie
s or
pr
oced
ures
wer
e im
prov
ed
– m
itiga
tion
proc
edur
es
wer
e ap
plie
d –
miti
gatio
n pr
oced
ures
w
ere
impr
oved
–
miti
gatio
n sy
stem
was
pr
oof t
este
d m
ore
frequ
ently
– co
rrect
ope
ratio
n pr
oced
ure
had
been
use
d –
oper
atio
n pr
oced
ure
was
im
prov
ed
– pe
rmit
proc
edur
es w
ere
impr
oved
– co
rrect
mai
nten
ance
pr
oced
ure
had
been
use
d –
mai
nten
ance
pro
cedu
re
was
impr
oved
–
proo
f tes
ting
was
mor
e fre
quen
t
– op
erat
ion
proc
edur
es
wer
e ap
plie
d –
oper
atio
n pr
oced
ures
w
ere
impr
oved
Ope
ratio
n &
m
aint
enan
ce
– op
erat
or fa
cilit
ies
had
been
fully
che
cked
–
miti
gatio
n sy
stem
had
be
en fu
lly c
heck
ed
– op
erat
ion
faci
litie
s ha
d be
en fu
lly c
heck
ed
– op
erat
ion
faci
litie
s ha
d be
en c
heck
ed d
urin
g va
lidat
ion
– op
erat
or fa
cilit
ies
had
been
che
cked
dur
ing
valid
atio
n
Valid
atio
n
– th
e eq
uipm
ent h
ad b
een
inst
alle
d ac
cord
ing
to
desi
gn
– m
itiga
tion
syst
em h
ad
been
inst
alle
d ac
cord
ing
to d
esig
n
– th
e eq
uipm
ent h
ad b
een
inst
alle
d ac
cord
ing
to
desi
gn
– th
e eq
uipm
ent h
ad b
een
inst
alle
d ac
cord
ing
to
desi
gn
– th
e eq
uipm
ent h
ad b
een
inst
alle
d ac
cord
ing
to
desi
gn
Inst
alla
tion
&
com
mis
sion
in
g
– op
erat
or fa
cilit
ies
had
been
bet
ter d
esig
ned
– th
e in
stal
latio
n de
sign
ha
d be
en d
iffer
ent
– m
itiga
tion
syst
em h
ad
been
spe
cifie
d –
miti
gatio
n sy
stem
had
be
en b
ette
r des
igne
d
– de
sign
requ
irem
ents
wer
e be
tter d
ocum
ente
d –
addi
tiona
l act
ions
had
be
en s
peci
fied
– ac
tions
had
bee
n fa
ster
–
final
act
uatio
n de
vice
was
im
prov
ed
– op
erat
or fa
cilit
ies
had
been
des
igne
d be
tter
– th
e in
stal
latio
n de
sign
had
be
en d
iffer
ent
Des
ign
– ha
zard
and
risk
ana
lysi
s ha
d co
nsid
ered
all
mod
es
of o
pera
tion
and
caus
es
– ha
zard
and
risk
ana
lysi
s ha
d co
nsid
ered
all
mod
es
of o
pera
tion
and
caus
es
– ha
zard
and
risk
ana
lysi
s ha
d co
nsid
ered
all
mod
es
of o
pera
tion
and
caus
es
– ha
zard
and
risk
ana
lysi
s ha
d co
nsid
ered
all
mod
es
of o
pera
tion
and
caus
es
– ha
zard
and
risk
ana
lysi
s ha
d co
nsid
ered
all
mod
es
of o
pera
tion
and
caus
es
Syst
em
conc
ept
Wou
ld th
e in
cide
nt h
ave
been
pre
vent
ed if
Safe
ty a
sses
smen
tD
ocum
enta
tion
Safe
ty m
anag
emen
tVe
rific
atio
nLi
fecy
cle
Com
pete
nce
– m
odifi
catio
n ha
d be
en
asse
ssed
– op
erat
ion
and
mai
nten
ance
ph
ase
had
been
ass
esse
d
– do
cum
enta
tion
had
been
upd
ated
–
acco
unta
bilit
ies
wer
e be
tter
defin
ed
– su
pplie
rs h
ad b
een
revi
ewed
– a
bette
r ver
ifica
tion
sche
me
had
been
in p
lace
–
mod
ifica
tion
lifec
ycle
w
as b
ette
r def
ined
–
mod
ifica
tion
had
been
ca
rried
out
by
mor
e co
mpe
tent
sta
ff
Mod
ifica
tion
– do
cum
enta
tion
was
cl
ear a
nd s
uffic
ient
–
safe
ty c
ultu
re w
as im
prov
ed
– au
dits
wer
e m
ore
frequ
ent
– a
bette
r ver
ifica
tion
sche
me
had
been
in p
lace
–
resp
onsi
bilit
ies
wer
e be
tter d
efin
ed
– op
erat
ion
or m
aint
enan
ce
staf
f wer
e m
ore
com
pete
nt
Ope
ratio
n &
m
aint
enan
ce
Wou
ld th
e in
cide
nt h
ave
been
pre
vent
ed if
Log
failu
re a
nd c
heck
–if
dang
erou
s fa
ilure
ra
te is
inlin
ew
ithde
sign
ass
umpt
ions
–if
all e
xpec
ted
actio
nsoc
curre
d an
d no
un
expe
cted
act
ions
oc
curre
d–
if sa
fe fa
ilure
cau
ses
any
unex
pect
ed
actio
ns
Log
dem
and
and
chec
k–
if de
man
d ra
teis
inlin
e w
ith d
esig
nas
sum
ptio
ns–
if de
man
d ca
use
was
pr
edic
ted
in h
azar
d an
d ris
k an
alys
is
–ne
ed fo
r miti
gatio
n ha
d be
en re
view
ed d
urin
g im
pact
ana
lysi
s
–ne
ed fo
r miti
gatio
n ha
d be
en re
view
ed d
urin
g im
pact
ana
lysi
s
–ne
cess
ary
syst
emac
tions
ha
d be
en re
view
ed d
urin
g im
pact
ana
lysi
s
–ne
cess
ary
syst
emac
tions
ha
d be
en re
view
ed d
urin
g im
pact
ana
lysi
s
–op
erat
ion
faci
litie
s ha
d be
en re
view
ed d
urin
g im
pact
ana
lysi
s
Mod
ifica
tion
–op
erat
ion
proc
edur
esha
d be
en a
pplie
d–
oper
atio
n fa
cilit
ies
orpr
oced
ures
wer
eim
prov
ed
–m
itiga
tion
proc
edur
es
wer
e ap
plie
d–
miti
gatio
n pr
oced
ures
w
ere
impr
oved
–m
itiga
tion
syst
emw
aspr
oof t
este
d m
ore
frequ
ently
–co
rrect
ope
ratio
n pr
oced
ure
had
been
use
d–
oper
atio
n pr
oced
ure
was
im
prov
ed–
perm
it pr
oced
ures
wer
eim
prov
ed
–co
rrect
mai
nten
ance
pr
oced
ure
had
been
use
d–
mai
nten
ance
pro
cedu
re
was
impr
oved
–pr
oof t
estin
g w
as m
ore
frequ
ent
–op
erat
ion
proc
edur
es
wer
e ap
plie
d–
oper
atio
n pr
oced
ures
w
ere
impr
oved
Ope
ratio
n &
m
aint
enan
ce
–op
erat
or fa
cilit
ies
had
been
fully
chec
ked
–m
itiga
tion
syst
em h
ad
been
fully
chec
ked
–op
erat
ion
faci
litie
s ha
d be
en fu
llych
ecke
d–
oper
atio
n fa
cilit
ies
had
been
che
cked
dur
ing
valid
atio
n
–op
erat
or fa
cilit
ies
had
been
che
cked
dur
ing
valid
atio
n
Valid
atio
n
–th
e eq
uipm
enth
ad b
een
inst
alle
d ac
cord
ing
tode
sign
–m
itiga
tion
syst
em h
ad
been
inst
alle
d ac
cord
ing
to d
esig
n
–th
e eq
uipm
enth
ad b
een
inst
alle
d ac
cord
ing
tode
sign
–th
e eq
uipm
ent h
ad b
een
inst
alle
d ac
cord
ing
tode
sign
–th
e eq
uipm
enth
ad b
een
inst
alle
d ac
cord
ing
tode
sign
Inst
alla
tion
&
com
mis
sion
-in
g
–op
erat
or fa
cilit
ies
had
been
bet
terd
esig
ned
–th
e in
stal
latio
n de
sign
ha
d be
en d
iffer
ent
–m
itiga
tion
syst
em h
ad
been
spe
cifie
d–
miti
gatio
n sy
stem
had
be
en b
ette
r des
igne
d
–de
sign
requ
irem
ents
wer
ebe
tter d
ocum
ente
d–
addi
tiona
l act
ions
had
be
en s
peci
fied
–ac
tions
had
bee
n fa
ster
–fin
al a
ctua
tion
devi
ce w
as
impr
oved
–op
erat
or fa
cilit
ies
had
been
des
igne
d be
tter
–th
e in
stal
latio
n de
sign
had
be
en d
iffer
ent
Des
ign
–ha
zard
and
risk
ana
lysi
sha
d co
nsid
ered
all
mod
es
of o
pera
tion
and
caus
es
–ha
zard
and
risk
ana
lysi
sha
d co
nsid
ered
all
mod
es
of o
pera
tion
and
caus
es
–ha
zard
and
risk
ana
lysi
sha
d co
nsid
ered
all
mod
es
of o
pera
tion
and
caus
es
–ha
zard
and
risk
ana
lysi
sha
d co
nsid
ered
all
mod
es
of o
pera
tion
and
caus
es
–ha
zard
and
risk
ana
lysi
sha
d co
nsid
ered
all
mod
esof
ope
ratio
n an
d ca
uses
Syst
em
conc
ept
Wou
ld th
ein
cide
nt h
ave
been
pre
vent
ed if
Safe
ty a
sses
smen
tD
ocum
enta
tion
Safe
ty m
anag
emen
tVe
rific
atio
nLi
fecy
cle
Com
pete
nce
–m
odifi
catio
n ha
d be
en
asse
ssed
–op
erat
ion
and
mai
nten
ance
ph
ase
had
been
ass
esse
d
–do
cum
enta
tion
had
been
upd
ated
–ac
coun
tabi
litie
s w
ere
bette
rde
fined
–su
pplie
rs h
ad b
een
revi
ewed
–a
bette
r ver
ifica
tion
sche
me
had
been
inpl
ace
–m
odifi
catio
n lif
ecyc
lew
as b
ette
r def
ined
–m
odifi
catio
n ha
d be
en
carri
ed o
ut b
y m
ore
com
pete
nt s
taff
Mod
ifica
tion
–do
cum
enta
tion
was
cl
ear a
nd s
uffic
ient
–sa
fety
cul
ture
was
impr
oved
–au
dits
wer
em
ore
frequ
ent
–a
bette
r ver
ifica
tion
sche
me
had
been
inpl
ace
–re
spon
sibi
litie
s w
ere
bette
r def
ined
–op
erat
ion
orm
aint
enan
ce
staf
f wer
em
ore
com
pete
ntO
pera
tion
&
mai
nten
ance
Wou
ld th
ein
cide
nt h
ave
been
pre
vent
ed if

First Stage: Information Elicitation and ECF Modelling
Previous sections have argued that different information will be available to end-users, suppliers and integrators of E/E/PES equipment. For instance, the following excerpt describes the end-users perspective on our case study incident that was capture by the report form in Figure A.3:
“…A spillage of methanol was detected on board an off-shore production vessel. In order to collect this material, the vessel’s ballast system was used to induce a list. During the clear-up operation, firewater hoses were used to clean the decks. As a result of these operations, the water pressure fell to such a level that the duty firewater pump was automatically started and this increased the pressure to an acceptable level. As the methanol clean-up progressed sensors detected high levels of gas and this initiated a plant shutdown. This included a plant ‘black-out’ with the loss of all electrical power ”
The report can be used to produce an initial sketch of the events leading to a mishap or near miss. Investigators can do this by identifying the key events that contributed to the E/E/PES related incident. For example, this account might yield critical events including the initial methanol spill as well as the decision to move the ballast. Other significant events include the automatic initiation of the firewater pump, the detection of methanol and the plan shutdown.
Figure A.5 shows how an events and causal factors (ECF) diagram can be used to reconstruct the operators’ perspective on our case study. As can be seen, the intention is to provide an initial overview of the immediate events that were observed by the end-users of the E/E/PES. Exact timings are omitted, as these are unlikely to be available in the immediate aftermath of an adverse event. The rectangles represent events. Ovals represent the conditions that make those events more likely. The diamond shape represents the outcome of the E/E/PES related mishap. It is important to note, however, that no assumptions are made about the direct involvement of the E/E/PES at this stage. In particular, Figure A.5 traces a line of events leading to the automatic initiation of the firewater pump but at this stage in the analysis it is not possible to determine the extent which these events played a role in the eventual loss of control.
l.
Production vesse ’s decks are
not cambered
Vessel’s ballast
Methanol spill
li
l
is .
lly l
system used to induce a st.
Contro of ballast transfer
operationlost
Fire hoses used to clean decks
Sensors detect fall in water pressure
Duty firewater pump starts automatica
Sensors detect Methanol build up
Plant shut-down initiated
Pressure returns to acceptab e range
Figure A.5 ECF chart showing end-user perspective
52
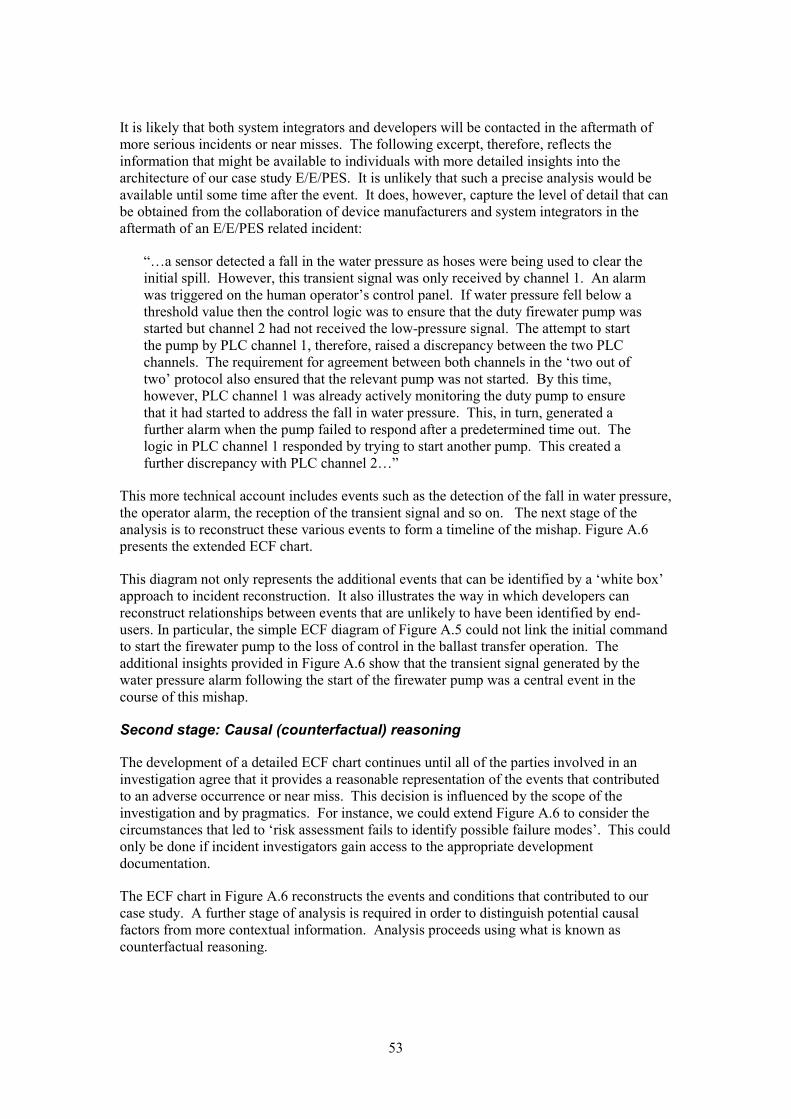
It is likely that both system integrators and developers will be contacted in the aftermath of more serious incidents or near misses. The following excerpt, therefore, reflects the information that might be available to individuals with more detailed insights into the architecture of our case study E/E/PES. It is unlikely that such a precise analysis would be available until some time after the event. It does, however, capture the level of detail that can be obtained from the collaboration of device manufacturers and system integrators in the aftermath of an E/E/PES related incident:
“…a sensor detected a fall in the water pressure as hoses were being used to clear the initial spill. However, this transient signal was only received by channel 1. An alarm was triggered on the human operator’s control panel. If water pressure fell below a threshold value then the control logic was to ensure that the duty firewater pump was started but channel 2 had not received the low-pressure signal. The attempt to start the pump by PLC channel 1, therefore, raised a discrepancy between the two PLC channels. The requirement for agreement between both channels in the ‘two out of two’ protocol also ensured that the relevant pump was not started. By this time, however, PLC channel 1 was already actively monitoring the duty pump to ensure that it had started to address the fall in water pressure. This, in turn, generated a further alarm when the pump failed to respond after a predetermined time out. The logic in PLC channel 1 responded by trying to start another pump. This created a further discrepancy with PLC channel 2…”
This more technical account includes events such as the detection of the fall in water pressure, the operator alarm, the reception of the transient signal and so on. The next stage of the analysis is to reconstruct these various events to form a timeline of the mishap. Figure A.6 presents the extended ECF chart.
This diagram not only represents the additional events that can be identified by a ‘white box’ approach to incident reconstruction. It also illustrates the way in which developers can reconstruct relationships between events that are unlikely to have been identified by endusers. In particular, the simple ECF diagram of Figure A.5 could not link the initial command to start the firewater pump to the loss of control in the ballast transfer operation. The additional insights provided in Figure A.6 show that the transient signal generated by the water pressure alarm following the start of the firewater pump was a central event in the course of this mishap.
Second stage: Causal (counterfactual) reasoning
The development of a detailed ECF chart continues until all of the parties involved in an investigation agree that it provides a reasonable representation of the events that contributed to an adverse occurrence or near miss. This decision is influenced by the scope of the investigation and by pragmatics. For instance, we could extend Figure A.6 to consider the circumstances that led to ‘risk assessment fails to identify possible failure modes’. This could only be done if incident investigators gain access to the appropriate development documentation.
The ECF chart in Figure A.6 reconstructs the events and conditions that contributed to our case study. A further stage of analysis is required in order to distinguish potential causal factors from more contextual information. Analysis proceeds using what is known as counterfactual reasoning.
53
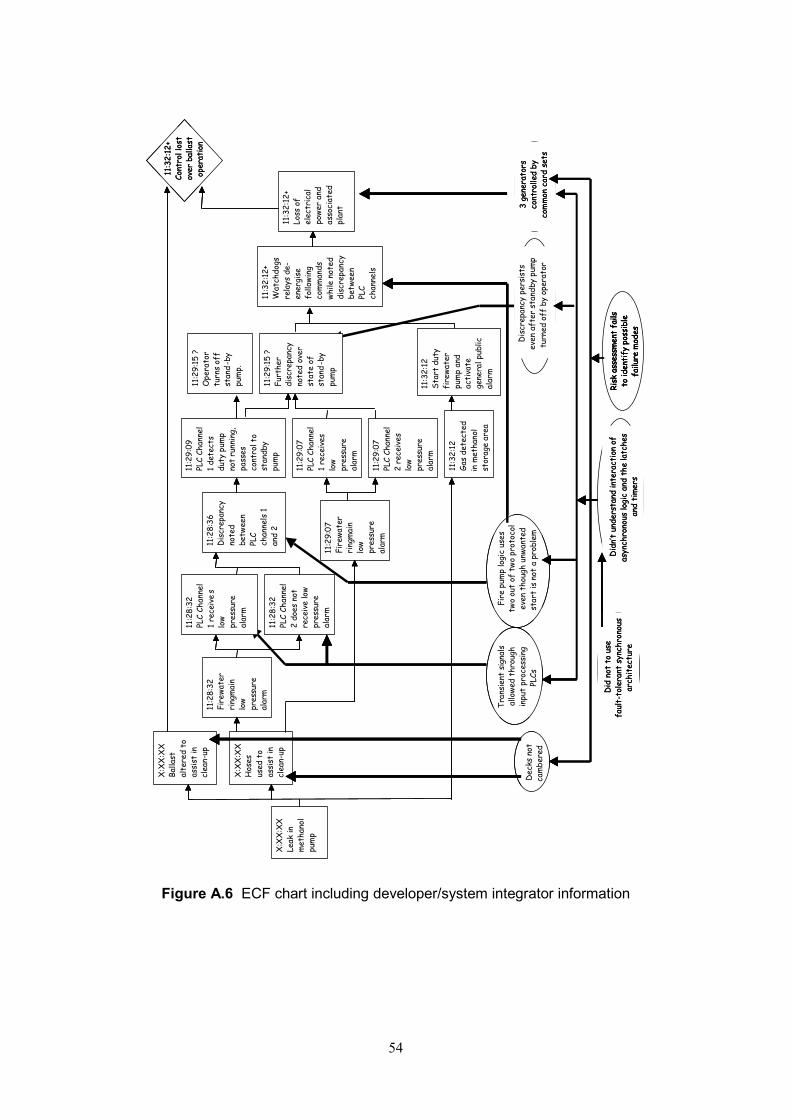
X:X
X:X
XLe
ak in
met
hano
lpu
mp
X:X
X:X
XBa
llast
alte
red
toas
sist
incl
ean-
up11
:28:
32
Fire
wate
r ri
ngm
ain
low
pres
sure
alar
m
11:2
8:32
PLC
Chan
nel
1 re
ceiv
es
low
pres
sure
alar
m
11:2
9:09
PLC
Chan
nel
1 de
tect
sdu
ty p
ump
not
runn
ing,
pass
es
cont
rol t
ost
andb
ypu
mp
11:2
8:36
Dis
crep
ancy
no
ted
betw
een
PLC
chan
nels
1an
d 2
11:2
9:15
?Fu
rthe
r di
scre
panc
y no
ted
over
st
ate
ofst
and-
bypu
mp
11:2
9:07
PLC
Chan
nel
1 re
ceiv
eslo
wpr
essu
real
arm
11:2
9:07
Fire
wate
r ri
ngm
ain
low
pres
sure
alar
m11
:29:
07PL
C Ch
anne
l2
rece
ives
lo
wpr
essu
real
arm
X:X
X:X
XH
oses
us
ed t
oas
sist
incl
ean-
up11
:28:
32PL
C Ch
anne
l2
does
not
rece
ive
low
pres
sure
alar
m
11:3
2:12
Gas
dete
cted
in m
etha
nol
stor
age
area
11:3
2:12
+W
atch
dogs
rela
ys d
e-en
ergi
sefo
llowi
ng
com
man
dswh
ile n
oted
disc
repa
ncy
betw
een
PLC
chan
nels
11:3
2:12
+Lo
ss o
f el
ectr
ical
powe
r an
das
soci
ated
plan
t
11:3
2:12
+Co
ntro
l los
tov
er b
alla
stop
erat
ion
Dec
ks n
otca
mbe
red
Tran
sien
t si
gnal
s al
lowe
d th
roug
hin
put
proc
essi
ngPL
Cs
Fire
pum
plo
gic
uses
two
out
of t
wo
prot
ocol
even
tho
ugh
unwa
nted
st
art
is n
ot a
pro
blem
3 ge
nera
tors
cont
rolle
d by
com
mon
car
d se
ts
Did
n’t
unde
rsta
nd in
tera
ctio
n of
asyn
chro
nous
logi
c an
d th
ela
tche
san
d ti
mer
s
Dis
crep
ancy
per
sist
sev
en a
fter
sta
ndby
pum
ptu
rned
off
by
oper
ator
Did
not
to
use
faul
t-to
lera
nt s
ynch
rono
usar
chit
ectu
re
11:2
9:15
?O
pera
tor
turn
s of
f st
and-
bypu
mp.
11:3
2:12
Star
t du
tyfi
rewa
ter
pum
p an
dac
tiva
tege
nera
l pub
lical
arm
Risk
ass
essm
ent
fails
to
iden
tify
pos
sibl
e fa
ilure
mod
es
X:X
X:X
X
Leak
in
met
hano
l pu
mp
X:X
X:X
X
Balla
st
alte
red
to
assi
st in
cl
ean-
up
11:2
8:32
Fi
rewa
ter
ring
mai
n lo
w pr
essu
re
alar
m
11:2
8:32
PL
C Ch
anne
l 1
rece
ive
s lo
w pr
essu
re
alar
m
11:2
9:09
PL
C Ch
anne
l 1
dete
cts
duty
pum
p no
t ru
nnin
g,
pass
es
cont
rol t
o st
andb
y pu
mp
11:2
8:36
D
iscr
epan
cy
note
d be
twee
n PL
C ch
anne
ls 1
an
d 2
11:2
9:15
?
Furt
her
disc
repa
ncy
note
d ov
er
stat
e of
st
and -
by
pum
p
11:2
9:07
PL
C Ch
anne
l 1
rece
ives
lo
w pr
essu
re
alar
m
11:2
9:07
Fi
rewa
ter
ring
mai
n lo
w pr
essu
re
alar
m
11:2
9:07
PL
C Ch
anne
l 2
rece
ives
lo
w pr
essu
re
alar
m
X:X
X:X
X
Hos
esus
ed t
o as
sist
in
clea
n-up
11
:28:
32
PLC
Chan
nel
2 do
es n
ot
rece
ive
low
pres
sure
al
arm
11:3
2:12
Ga
s de
tect
ed
in m
etha
nol
stor
age
area
11:3
2:12
+ W
atch
dogs
re
lays
de
ener
gise
fo
llowi
ng
com
man
ds
while
not
ed
disc
repa
ncy
betw
een
PLC
chan
nels
11:3
2:12
+ Lo
ss o
f el
ectr
ical
po
wer
and
asso
ciat
ed
plan
t
11:3
2:12
+ Co
ntro
l los
t ov
er b
alla
st
oper
atio
n
11:3
2:12
+Co
ntro
l los
tov
er b
alla
stop
erat
ion
Dec
ks n
ot
cam
bere
d
Tran
sien
t si
gnal
s al
lowe
d th
roug
h in
put
proc
essi
ng
PLCs
Fire
pum
p lo
gic
uses
tw
o ou
t of
tw
o pr
otoc
ol
even
tho
ugh
unwa
nted
st
art
is n
ot a
pro
blem
3
gene
rato
rs
cont
rolle
d by
co
mm
on c
ard
sets
3 ge
nera
tors
cont
rolle
d by
com
mon
car
d se
ts
Did
n’t
unde
rsta
nd in
tera
ctio
n of
as
ynch
rono
us lo
gic
and
the
latc
hes
and
tim
ers
Did
n’t
unde
rsta
nd in
tera
ctio
n of
asyn
chro
nous
logi
c an
d th
ela
tche
san
d ti
mer
s
Dis
crep
ancy
per
sist
s ev
en a
fter
sta
ndby
pum
p tu
rned
off
by
oper
ator
Did
not
to
use
faul
t-to
lera
nt s
ynch
rono
us
arch
itec
ture
Did
not
to
use
faul
t-to
lera
nt s
ynch
rono
usar
chit
ectu
re
Risk
ass
essm
ent
fails
to
iden
tify
pos
sibl
efa
ilure
mod
es
Risk
ass
essm
ent
fails
to
iden
tify
pos
sibl
efa
ilure
mod
es
11:2
9:15
?
Ope
rato
r tu
rns
off
stan
d -by
pu
mp.
11:3
2:12
St
art
duty
fi
rewa
ter
pum
p an
d ac
tiva
te
gene
ral p
ublic
al
arm
Figure A.6 ECF chart including developer/system integrator information
54

The term ‘counterfactual reasoning’ denotes a common form of argument that is used informally in many different incident investigations. Starting at the outcome event, investigators must ask whether the incident would have occurred if that event had not taken place. If the incident would still have happened then the event cannot be considered as a casual factor. For example, the incident would clearly not have happened if electrical power and associated plant had not been lost. This is, therefore, a cause of the incident. In contrast, we can argue that the incident would still have happened even if the operator had not intervened to switch-off the stand-by pump. Hence this action cannot be considered a cause of the mishap. Table A.7 provides an overview of the output from this form of analysis.
Table A.7 Cause/contextual factor summary
Event Cause/ contextual
Justification
factor
Loss of electrical power and associated plant
Cause If this had not occurred then control would have been retained over the ballast operation
Watchdog relays de-energize following commands while noted discrepancy between PLC channels
Cause If this had not occurred then electrical and hydraulic power would have been retained
Further discrepancy noted over state of stand-by pump
Cause If the operator had cleared the discrepancy between the two channels then the watchdog relays would not have de-energized following the firewater pump command
Operator turns off stand-by pump Contextual factor
The discrepancy in the state of the stand-by pump persists between the two channels even after the pump is switched off
Gas detected in methanol storage area
Contextual factor
Even if gas had not been detected in the methanol storage area a number of other events may have resulted in the mishap. For example, gas might have been detected elsewhere in the vessel or another control path involving 2 out of 2 voting might have caused the trip.
Each event in the ECF chart is listed as either a potential cause or a contextual factor in the final form of the table. A justification is provided to support this assessment because contextual factors will not be considered during subsequent analysis.
Counterfactual reasoning is non-trivial. For example, Table A.7 identified the detection of gas in the methanol storage area as a contextual factor on the basis that the incident would still have occurred even if this event had not taken place. The justification is that another triggering event is likely to have occurred. For instance, other sensors following the initial leak might have detected gas. Alternatively, the watchdog relays might have been deenergized by any other event that required 2 out of 2 voting on the PLC channels. The validity of this argument depends not only on knowledge of the E/E/PES system but also on supposition about alternative ways in which a similar incident might have developed. The difficulty of forming such counterfactual arguments is another reason why it is important to document this stage of the analysis.
55
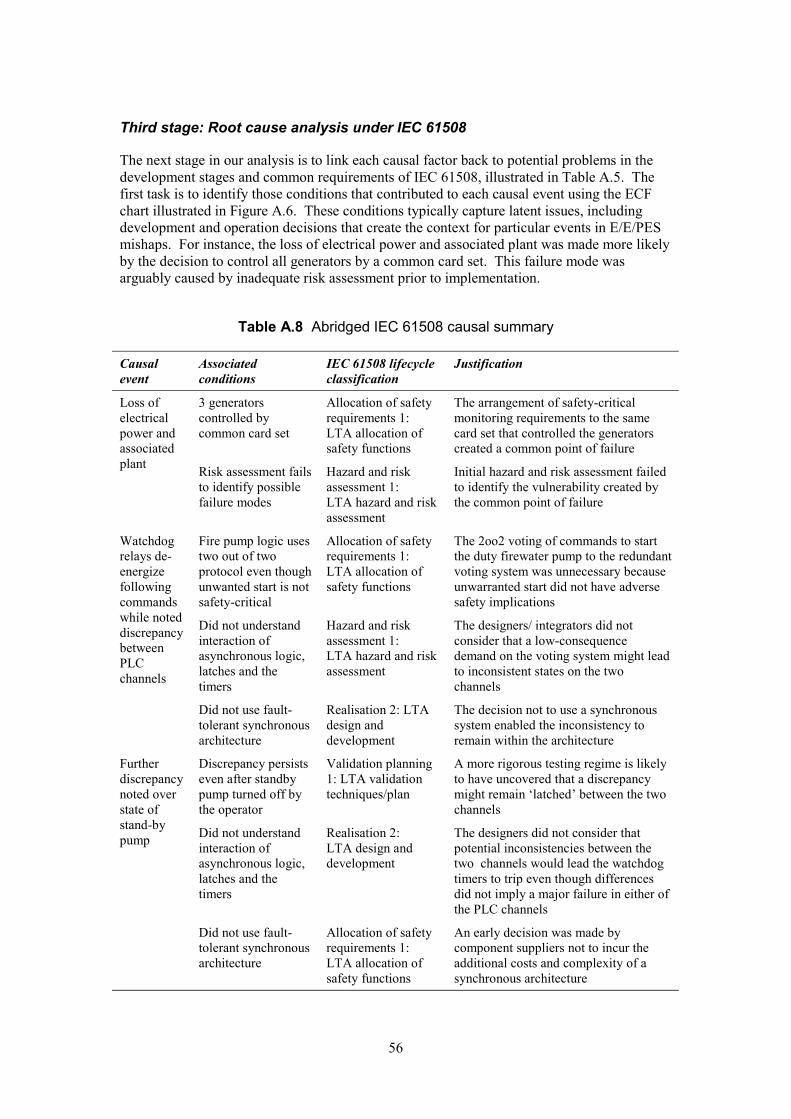
Third stage: Root cause analysis under IEC 61508
The next stage in our analysis is to link each causal factor back to potential problems in the development stages and common requirements of IEC 61508, illustrated in Table A.5. The first task is to identify those conditions that contributed to each causal event using the ECF chart illustrated in Figure A.6. These conditions typically capture latent issues, including development and operation decisions that create the context for particular events in E/E/PES mishaps. For instance, the loss of electrical power and associated plant was made more likely by the decision to control all generators by a common card set. This failure mode was arguably caused by inadequate risk assessment prior to implementation.
Table A.8 Abridged IEC 61508 causal summary
Causal Associated IEC 61508 lifecycle Justification event conditions classification
Loss of 3 generators Allocation of safety The arrangement of safety-critical electrical controlled by requirements 1: monitoring requirements to the same power and common card set LTA allocation of card set that controlled the generators associated safety functions created a common point of failure plant Risk assessment fails Hazard and risk Initial hazard and risk assessment failed
to identify possible assessment 1: to identify the vulnerability created by failure modes LTA hazard and risk the common point of failure
assessment
Watchdog Fire pump logic uses Allocation of safety The 2oo2 voting of commands to start relays de two out of two requirements 1: the duty firewater pump to the redundant energize protocol even though LTA allocation of voting system was unnecessary because following unwanted start is not safety functions unwarranted start did not have adverse commands safety-critical safety implications while noted discrepancy between PLC channels
Did not understand interaction of asynchronous logic, latches and the timers
Hazard and risk assessment 1: LTA hazard and risk assessment
The designers/ integrators did not consider that a low-consequence demand on the voting system might lead to inconsistent states on the two channels
Did not use fault- Realisation 2: LTA The decision not to use a synchronous tolerant synchronous design and system enabled the inconsistency to architecture development remain within the architecture
Further Discrepancy persists Validation planning A more rigorous testing regime is likely discrepancy even after standby 1: LTA validation to have uncovered that a discrepancy noted over pump turned off by techniques/plan might remain ‘latched’ between the two state of the operator channels stand-by pump Did not understand
interaction of Realisation 2: LTA design and
The designers did not consider that potential inconsistencies between the
asynchronous logic, development two channels would lead the watchdog latches and the timers to trip even though differences timers did not imply a major failure in either of
the PLC channels
Did not use fault- Allocation of safety An early decision was made by tolerant synchronous requirements 1: component suppliers not to incur the architecture LTA allocation of additional costs and complexity of a
safety functions synchronous architecture
56

The key point is not to arrive at an unambiguous association of lifecycle phases with the conditions that contribute to causal events. For instance, it is perfectly possible to argue that the grouping of generator controls stemmed from an inappropriate function allocation during design and development rather than inadequate hazard and risk assessment during equipment selection. The intention is to provide a focus for the analysis so that consensus can be achieved before recommendations are made.
Table A.8 associates conditions with phases in the IEC 61508 lifecycle. It does not refer to any of the IEC 61508 common requirements listed in Table A.5. These are considered during a further stage of analysis.
Investigators must, typically, conduct additional enquiries into the processes and procedures that characterise previous stages of the E/E/PES lifecycle. For example, we might argue that inadequate risk assessment described in Table A.8 was symptomatic of a less than adequate safety culture. Such a finding would be difficult to sustain without a more detailed assessment of the risk management practices that were conducted by the end-user, system integrators and developers.
Table A.9 presents the full and final form of Table A.8 for the first two causal events. As before, a justification helps others to understand why investigators found violations of common requirements in particular phases of the IEC 61508 lifecycle. This is important because the table should act as a focus for discussion. This is necessary if agreement is to be reached about the outcome of an investigation.
A further role for this analysis is to encourage investigators to look for further examples of conditions that illustrate violations of common requirements across different phases. For example, a suspicion that documentation was inadequate during the initial stages of design would encourage investigators to determine whether this problem affected other implementation and operation.
Table A.9 also includes causes that stem from particular stages in the IEC 61508 lifecycle but are unrelated to any failures in the common requirements. Previous paragraphs argued that inadequate hazard and risk assessment led to the common point of failure in the generator controls. Table A.9 does not link this shortcoming to any more general failure to satisfy common requirements in the standard. However, the table could be revised to include such a finding if this were warranted by subsequent analysis.
To summarise, this more complex approach first gathers evidence about the course of an E/E/PES related incident. This information is then used to create an ECF ‘timeline’. If the analysis is being conducted by an end-user organisation then it will often be necessary to include additional technical information from organisations and individuals involved in system development and integration. Once this has been done, it is possible to identify those conditions that make particular events more likely. The next stage is to apply a form of causal reasoning to distinguish contextual information from causal factors. This is done by constructing counterfactual arguments of the form ‘if event X had not occurred then the mishap would also not have occurred’. If this argument can be made then the event is a potential cause. If not then the accident would have occurred even if the event had not taken place and so it is classified as a contextual factor. A table is then constructed to list all of the conditions that contribute to each causal event. A two-stage analysis can then be used to associate these conditions either with specific inadequacies during phases of the IEC 61508 lifecycle or with the violation of common requirements across several different phases.
57
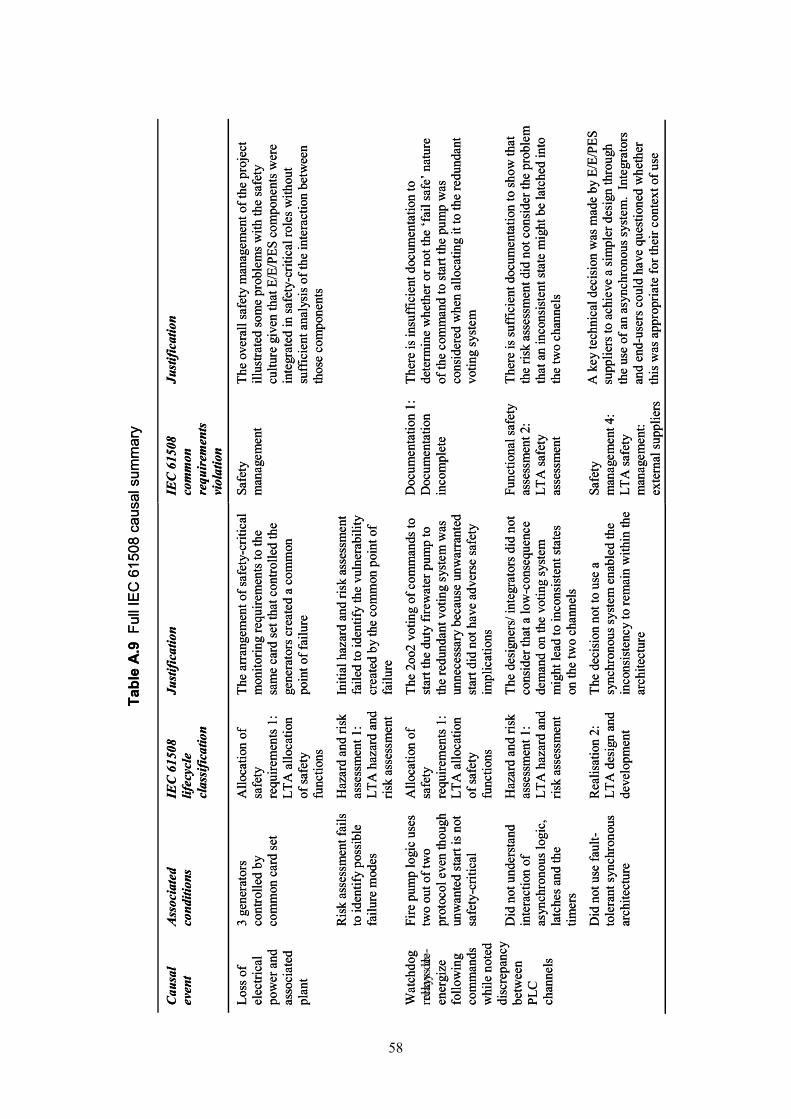
Tabl
e A.
9 Fu
ll IE
C 6
1508
cau
sal s
umm
ary
Tabl
e A.
9Fu
ll IE
C 6
1508
cau
sal s
umm
ary
Cau
sal
Ass
ocia
ted
IEC
615
08C
ausa
lA
ssoc
iate
dIE
C 6
1508
even
t co
nditi
ons
lifec
ycle
even
tco
nditi
ons
lifec
ycle
cl
assi
ficat
ion
clas
sific
atio
n
Just
ifica
tion
IEC
615
08
Just
ifica
tion
Just
ifica
tion
IEC
615
08
Just
ifica
tion
com
mon
com
mon
requ
irem
ents
requ
irem
ents
viol
atio
nvi
olat
ion
58
Loss
of
Loss
of
elec
trica
lel
ectri
cal
pow
er a
ndpo
wer
and
asso
ciat
edas
soci
ated
pl
ant
plan
t
Wat
chdo
gW
atch
dog
rela
ys d
ere
lays
de-
ener
gize
ener
gize
follo
win
gfo
llow
ing
com
man
dsco
mm
ands
whi
le n
oted
whi
le n
oted
disc
repa
ncy
disc
repa
ncy
betw
een
betw
een
PLC
PLC
chan
nels
chan
nels
3 ge
nera
tors
3 ge
nera
tors
cont
rolle
d by
cont
rolle
d by
com
mon
car
d se
tco
mm
on c
ard
set
Ris
k as
sess
men
t fai
lsR
isk
asse
ssm
ent f
ails
to
iden
tify
poss
ible
to id
entif
y po
ssib
lefa
ilure
mod
esfa
ilure
mod
es
Fire
pum
p lo
gic
uses
Fire
pum
p lo
gic
uses
two
out o
f tw
otw
o ou
t of t
wo
prot
ocol
eve
n th
ough
prot
ocol
eve
n th
ough
unw
ante
d st
art i
s not
unw
ante
dst
art i
s not
sa
fety
-crit
ical
safe
ty-c
ritic
al
Did
not
und
erst
and
Did
not
und
erst
and
inte
ract
ion
ofin
tera
ctio
n of
asyn
chro
nous
logi
c,as
ynch
rono
us lo
gic,
la
tche
s and
the
latc
hes a
nd th
e tim
ers
timer
s
Did
not
use
faul
tD
id n
ot u
sefa
ult-
tole
rant
sync
hron
ous
tole
rant
sync
hron
ous
arch
itect
ure
arch
itect
ure
Allo
catio
n of
Allo
catio
n of
safe
tysa
fety
requ
irem
ents
1:
requ
irem
ents
1:
LTA
allo
catio
nLT
A a
lloca
tion
of sa
fety
of sa
fety
func
tions
func
tions
Haz
ard
and
risk
Haz
ard
and
risk
asse
ssm
ent 1
:as
sess
men
t 1:
LTA
haz
ard
and
LTA
haz
ard
and
risk
asse
ssm
ent
risk
asse
ssm
ent
Allo
catio
n of
Allo
catio
n of
safe
tysa
fety
requ
irem
ents
1:
requ
irem
ents
1:
LTA
allo
catio
nLT
A a
lloca
tion
of sa
fety
of sa
fety
func
tions
func
tions
Haz
ard
and
risk
Haz
ard
and
risk
asse
ssm
ent 1
:as
sess
men
t 1:
LTA
haz
ard
and
LTA
haz
ard
and
risk
asse
ssm
ent
risk
asse
ssm
ent
Rea
lisat
ion
2:R
ealis
atio
n 2:
LTA
des
ign
and
LTA
des
ign
and
deve
lopm
ent
deve
lopm
ent
The
arra
ngem
ent o
f saf
ety-
criti
cal
The
arra
ngem
ent o
fsaf
ety-
criti
cal
mon
itorin
g re
quire
men
ts to
the
mon
itorin
g re
quire
men
ts to
the
sam
e ca
rd se
t tha
t con
trolle
d th
esa
me
card
set t
hat c
ontro
lled
the
gene
rato
rs c
reat
ed a
com
mon
gene
rato
rs c
reat
ed a
com
mon
poin
t of f
ailu
repo
int o
ffai
lure
Initi
al h
azar
d an
d ris
k as
sess
men
tIn
itial
haz
ard
and
risk
asse
ssm
ent
faile
d to
iden
tify
the
vuln
erab
ility
faile
d to
iden
tify
the
vuln
erab
ility
crea
ted
by th
e co
mm
on p
oint
of
crea
ted
by th
e co
mm
on p
oint
of
failu
refa
ilure
The
2oo2
vot
ing
of c
omm
ands
toTh
e2o
o2 v
otin
g of
com
man
dsto
star
t the
dut
y fir
ewat
er p
ump
tost
art t
he d
uty
firew
ater
pum
pto
the
redu
ndan
t vot
ing
syst
em w
asth
e re
dund
antv
otin
g sy
stem
was
unne
cess
ary
beca
use
unw
arra
nted
unne
cess
ary
beca
use
unw
arra
nted
star
t did
not
hav
e ad
vers
e sa
fety
star
t did
not
hav
e ad
vers
e sa
fety
impl
icat
ions
impl
icat
ions
The
desi
gner
s/ in
tegr
ator
s did
not
The
desi
gner
s/ in
tegr
ator
sdid
not
cons
ider
that
a lo
w-c
onse
quen
ceco
nsid
er th
ata
low
-con
sequ
ence
dem
and
on th
e vo
ting
syst
emde
man
d on
the
votin
g sy
stem
mig
ht le
ad to
inco
nsis
tent
stat
esm
ight
lead
to in
cons
iste
nt st
ates
on th
e tw
o ch
anne
lson
the
two
chan
nels
The
deci
sion
not
to u
se a
The
deci
sion
not
tous
e a
sync
hron
ous s
yste
m e
nabl
ed th
esy
nchr
onou
s sys
tem
ena
bled
the
inco
nsis
tenc
y to
rem
ain
with
in th
ein
cons
iste
ncy
tore
mai
n w
ithin
the
arch
itect
ure
arch
itect
ure
Safe
tySa
fety
man
agem
ent
man
agem
ent
Doc
umen
tatio
n 1:
Doc
umen
tatio
n 1:
Doc
umen
tatio
nD
ocum
enta
tion
inco
mpl
ete
inco
mpl
ete
Func
tiona
l saf
ety
Func
tiona
l saf
ety
asse
ssm
ent 2
:as
sess
men
t 2:
LTA
safe
tyLT
A sa
fety
asse
ssm
ent
asse
ssm
ent
Safe
tySa
fety
man
agem
ent 4
:m
anag
emen
t 4:
LTA
safe
tyLT
A sa
fety
man
agem
ent:
man
agem
ent:
exte
rnal
supp
liers
exte
rnal
supp
liers
The
over
all s
afet
y m
anag
emen
t of t
he p
roje
ctTh
e ov
eral
l saf
ety
man
agem
ent o
fthe
pro
ject
ill
ustra
ted
som
e pr
oble
ms
with
the
safe
tyill
ustra
ted
som
epr
oble
ms
with
the
safe
tycu
lture
giv
en th
at E
/E/P
ES c
ompo
nent
s wer
ecu
lture
giv
en th
at E
/E/P
ES c
ompo
nent
s wer
ein
tegr
ated
in sa
fety
-crit
ical
role
s with
out
inte
grat
ed in
safe
ty-c
ritic
al ro
les w
ithou
t su
ffic
ient
ana
lysi
s of t
he in
tera
ctio
n be
twee
nsu
ffic
ient
ana
lysi
s of t
he in
tera
ctio
n be
twee
nth
ose
com
pone
nts
thos
e co
mpo
nent
s
Ther
e is
insu
ffic
ient
doc
umen
tatio
n to
Ther
e is
insu
ffic
ient
doc
umen
tatio
nto
dete
rmin
e w
heth
er o
r not
the
‘fai
l saf
e’ n
atur
ede
term
ine
whe
ther
or n
ot th
e ‘f
ail s
afe’
nat
ure
of th
e co
mm
and
to st
art t
he p
ump
was
ofth
e co
mm
and
to st
art t
he p
ump
was
co
nsid
ered
whe
n al
loca
ting
it to
the
redu
ndan
tco
nsid
ered
whe
n al
loca
ting
it to
the
redu
ndan
tvo
ting
syst
emvo
ting
syst
em
Ther
e is
suff
icie
nt d
ocum
enta
tion
to sh
ow th
atTh
ere
issu
ffic
ient
doc
umen
tatio
n to
show
that
the
risk
asse
ssm
ent d
id n
ot c
onsi
der t
he p
robl
emth
e ris
kas
sess
men
t did
not
con
side
r the
prob
lem
that
an
inco
nsis
tent
stat
e m
ight
be
latc
hed
into
that
an
inco
nsis
tent
stat
em
ight
be la
tche
din
toth
e tw
o ch
anne
lsth
e tw
och
anne
ls
A k
ey te
chni
cal d
ecis
ion
was
mad
e by
E/E
/PES
A k
ey te
chni
cal d
ecis
ion
was
mad
e by
E/E
/PES
su
pplie
rs to
ach
ieve
a si
mpl
er d
esig
n th
roug
hsu
pplie
rs to
achi
eve
asi
mpl
er d
esig
nth
roug
hth
e us
e of
an
asyn
chro
nous
syst
em.
Inte
grat
ors
the
use
of a
n as
ynch
rono
us sy
stem
.In
tegr
ator
san
d en
d-us
ers c
ould
hav
e qu
estio
ned
whe
ther
and
end-
user
s cou
ld h
ave
ques
tione
dw
heth
erth
is w
as a
ppro
pria
te fo
r the
ir co
ntex
t of u
seth
is w
as a
ppro
pria
te fo
r the
ir co
ntex
t of u
se
A.5 GENERATING RECOMMENDATIONS
As can be seen in Figure A.2, the final activity in our proposed investigation and analysis approach is to produce recommendations that are intended to avoid any recurrence of an incident or near miss. Recommendations are generated using the outcome of previous stages, and are clearly domain and incident dependent. It is important, however, that investigators document the actions that are intended to avoid any recurrence of an E/E/PES related incident. Each recommendation should be associated with a priority assessment, with an individual or organisation responsible for implementing it and with a potential timescale for intervention. Typically, a safety manager will then respond with a written report stating whether each recommendation has been accepted or rejected [2].
It is important when drafting a recommendation that investigators consider whether similar interventions have been advocated in the past. Electronic information systems can be used to assist in this task. The key point, however, is that ineffective recommendations should not continue to be issued in the face of recurrent incidents. Similarly, it is important to identify situations in which recommendations are consistently rejected or inadequately implemented.
Any accepted recommendations must be disseminated to those who are responsible for acting upon them. Safety managers must also assume responsibility for checking that any necessary changes are implemented according to the agreed timescale. System documentation must be updated to reflect any subsequent modifications.
Table A.10 provides an example of a form that can be used to record recommendations from E/E/PES related incidents. As can be seen, different deadlines may be associated with actions that have different priority levels. This does not imply that high priority items will have an immediate deadline. Additional time is often necessary to ensure that subsequent interventions do not introduce further flaws in the design, operation and maintenance of safety-critical systems.
59
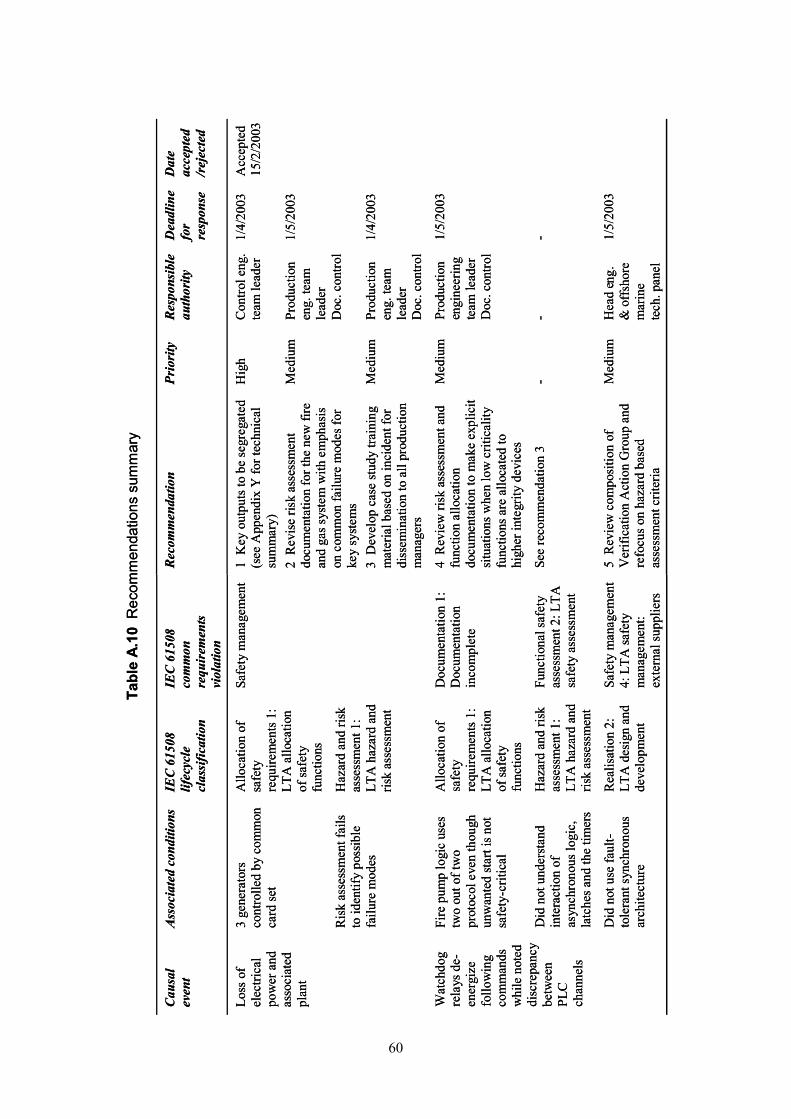
60
Tabl
e A.
10R
ecom
men
datio
ns s
umm
ary
Tabl
e A.
10R
ecom
men
datio
ns s
umm
ary
Cau
sal
Ass
ocia
ted
cond
ition
s IE
C 6
1508
IE
C 6
1508
Cau
sal
Ass
ocia
ted
cond
ition
sIE
C 6
1508
IEC
615
08
even
t lif
ecyc
le
com
mon
even
tlif
ecyc
leco
mm
oncl
assi
ficat
ion
requ
irem
ents
clas
sific
atio
nre
quir
emen
tsvi
olat
ion
viol
atio
n
Rec
omm
enda
tion
Prio
rity
R
espo
nsib
le
Dea
dlin
e D
ate
Rec
omm
enda
tion
Prio
rity
Res
pons
ible
Dea
dlin
e D
ate
auth
ority
fo
r ac
cept
edau
thor
ityfo
r ac
cept
edre
spon
se
/rej
ecte
dre
spon
se/r
ejec
ted
Loss
of
Loss
of
3 ge
nera
tors
A
lloca
tion
of3
gene
rato
rsA
lloca
tion
ofel
ectri
cal
elec
trica
l co
ntro
lled
by c
omm
on
safe
tyco
ntro
lled
by c
omm
onsa
fety
pow
er a
ndpo
wer
and
ca
rd se
t re
quire
men
ts 1
:ca
rd se
tre
quire
men
ts 1
:as
soci
ated
asso
ciat
edLT
A a
lloca
tion
LTA
allo
catio
npl
ant
plan
tof
safe
tyof
safe
tyfu
nctio
nsfu
nctio
ns
Ris
k as
sess
men
t fai
ls
Haz
ard
and
risk
Ris
k as
sess
men
t fai
ls
Haz
ard
and
risk
to id
entif
y po
ssib
le
asse
ssm
ent 1
:to
iden
tify
poss
ible
as
sess
men
t 1:
failu
re m
odes
LT
A h
azar
d an
dfa
ilure
mod
esLT
A h
azar
d an
d ris
k as
sess
men
tris
k as
sess
men
t
Safe
ty m
anag
emen
t1
Key
out
puts
to b
e se
greg
ated
H
igh
Con
trol e
ng.
1/4/
2003
A
ccep
ted
Safe
ty m
anag
emen
t1
Key
out
puts
to b
ese
greg
ated
Hig
hC
ontro
leng
.1/
4/20
03A
ccep
ted
(see
App
endi
x Y
for t
echn
ical
te
am le
ader
15
/2/2
003
(see
App
endi
x Y
for t
echn
ical
te
amle
ader
15/2
/200
3su
mm
ary)
sum
mar
y)2
Rev
ise
risk
asse
ssm
ent
Med
ium
Pr
oduc
tion
1/5/
2003
2R
evis
e ris
kas
sess
men
tM
ediu
mPr
oduc
tion
1/5/
2003
docu
men
tatio
n fo
r the
new
fire
en
g. te
amdo
cum
enta
tion
for t
he n
ew fi
reen
g.te
aman
d ga
s sys
tem
with
em
phas
is
lead
eran
d ga
s sys
tem
with
emph
asis
lead
eron
com
mon
failu
re m
odes
for
Doc
.con
trol
on c
omm
on fa
ilure
mod
es fo
r D
oc.c
ontro
lke
y sy
stem
ske
y sy
stem
s3
Dev
elop
cas
e st
udy
train
ing
Med
ium
Pr
oduc
tion
1/4/
2003
3D
evel
op c
ase
stud
y tra
inin
gM
ediu
mPr
oduc
tion
1/4/
2003
mat
eria
l bas
ed o
n in
cide
nt fo
r en
g. te
amm
ater
ial b
ased
on
inci
dent
for
eng.
team
diss
emin
atio
n to
all
prod
uctio
n le
ader
diss
emin
atio
n to
all
prod
uctio
nle
ader
man
ager
s D
oc. c
ontro
lm
anag
ers
Doc
.con
trol
Wat
chdo
gW
atch
dog
Fire
pum
p lo
gic
uses
A
lloca
tion
of
Doc
umen
tatio
n 1:
4
Rev
iew
risk
ass
essm
ent a
nd
Med
ium
Pr
oduc
tion
1/5/
2003
Fire
pum
p lo
gic
uses
A
lloca
tion
ofD
ocum
enta
tion
1:4
Rev
iew
risk
ass
essm
ent a
nd
Med
ium
Prod
uctio
n1/
5/20
03re
lays
de-
rela
ys d
e-tw
o ou
t of t
wo
safe
ty
Doc
umen
tatio
n fu
nctio
n al
loca
tion
e ngi
neer
ing
two
out o
ftw
o sa
fety
Doc
umen
tatio
nfu
nctio
n al
loca
tion
e ngi
neer
ing
ener
gize
ener
gize
prot
ocol
eve
n th
ough
re
quire
men
ts 1
: in
com
plet
e do
cum
enta
tion
to m
ake
expl
icit
t eam
l ead
erpr
otoc
ol e
ven
thou
ghre
quire
men
ts 1
:in
com
plet
edo
cum
enta
tion
tom
ake
expl
icit
t eam
l ead
erfo
llow
ing
follo
win
gun
wan
ted
star
t is n
ot
LTA
allo
catio
n si
tuat
ions
whe
n lo
w c
ritic
ality
D
oc. c
ontro
lun
wan
ted
star
t is n
ot
LTA
allo
catio
nsi
tuat
ions
whe
n lo
w c
ritic
ality
Doc
.con
trol
com
man
dsco
mm
ands
safe
ty-c
ritic
al
of sa
fety
fu
nctio
ns a
re a
lloca
ted
tosa
fety
-crit
ical
of sa
fety
func
tions
are
allo
cate
dto
whi
le n
oted
whi
leno
ted
func
tions
hi
gher
inte
grity
dev
ices
func
tions
high
er in
tegr
ityde
vice
sdi
scre
panc
ydi
scre
panc
yD
id n
ot u
nder
stan
d H
azar
d an
d ris
k Fu
nctio
nal s
afet
y Se
e re
com
men
datio
n 3
--
D
id n
ot u
nder
stan
dH
azar
d an
d ris
kFu
nctio
nal s
afet
ySe
e re
com
men
datio
n 3
--
-be
twee
nbe
twee
n in
tera
ctio
n of
as
sess
men
t 1:
asse
ssm
ent 2
: LTA
inte
ract
ion
ofas
sess
men
t 1:
asse
ssm
ent 2
: LTA
PL
CPL
C
chan
nels
ch
anne
lsas
ynch
rono
us lo
gic,
LT
A h
azar
d an
d sa
fety
ass
essm
ent
asyn
chro
nous
logi
c,LT
A h
azar
d an
d sa
fety
ass
essm
ent
latc
hes a
nd th
e tim
ers
risk
asse
ssm
ent
latc
hes a
nd th
e tim
ers
risk
asse
ssm
ent
Did
not
use
faul
t-R
ealis
atio
n 2:
Sa
fety
man
agem
ent
5 R
evie
w c
ompo
sitio
n of
M
ediu
m
Hea
d e n
g.
1/5/
2003
Did
not
use
faul
t-R
ealis
atio
n 2:
Safe
ty m
anag
emen
t5
Rev
iew
com
posi
tion
ofM
ediu
mH
ead
e ng.
1/5/
2003
tole
rant
syn
chro
nous
LT
A d
esig
n an
d 4:
LTA
safe
ty
Ver
ifica
tion
Act
ion
Gro
up a
nd
& o
ffsh
ore
tole
rant
syn
chro
nous
LTA
des
ign
and
4: L
TA sa
fety
Ver
ifica
tion
Act
ion
Gro
up a
nd
& o
ffsh
ore
arch
itect
ure
deve
lopm
ent
man
agem
ent:
refo
cus o
n ha
zard
bas
ed
mar
ine
arch
itect
ure
deve
lopm
ent
man
agem
ent:
refo
cuso
n ha
zard
bas
ed
mar
ine
exte
rnal
supp
liers
as
sess
men
t crit
eria
t e
ch. p
anel
exte
rnal
supp
liers
asse
ssm
ent c
riter
iat e
ch. p
anel
A.6 CONCLUSIONS
A range of techniques has been developed to support the analysis and investigation of adverse events and near miss incidents. Very few of these techniques have been specifically designed to support the investigation of E/E/PES related incidents. This report, therefore, introduces two investigation methods for this class of adverse events. The first builds on a relatively simple flowchart. Investigators can identify and categorise the causes of a mishap by answering a series of questions. The responses that they provide guide the causal analysis to underlying problems in the design, development or operation of the E/E/PES. The technique is best suited to incidents where it can be established that the cause arises out of the E/E/PES safety lifecycle and not through interaction with the EUC or EUC control system.
The second, more complex, approach introduces several additional stages of analysis. It is appropriate for more complex incidents where the questions that guide a simpler form of analysis may not be directly applicable. These additional stages also provide intermediate documentation that is necessary when investigators must justify their conclusions to other investigators, safety managers and courts of law. In particular, this second approach relies upon a timeline reconstruction of an adverse event using a technique known as events and causal factors (ECF) charting. This produces a graphical sketch of the events leading to an incident. This can then be used to distinguish contextual information from causal factors. In our proposed method, these causal factors are then analysed to identify potential failures in the E/E/PES lifecycle using a checklist approach.
Both of our investigation techniques have been tailored to provide information that guides the future development and operation of safety-critical systems. In particular, the flowchart and checklist help investigators to map from the causes of an E/E/PES related incident to the clauses of the IEC 61508 standard. IEC 61508 provides guidance on the activities that should be conducted during the concept development, overall scoping, hazard and risk assessment, overall safety requirements analysis, integration, commissioning and verification, realisation, validation, operation and maintenance, and modification of safety critical E/E/PES. In addition there are a range of requirements that are common to all lifecycle phases. These include the need to ensure the competence of those involved in the operation, maintenance and modification of the system. They also include requirements relating to the ‘safety culture’ of the organisations involved in the development and operation of E/E/PES. Our use of this standard is justified because it provides a means of feeding the insights derived from any incident investigation back into the future maintenance and development of E/E/PES within safety-critical applications.
A.7 REFERENCES
[1] Department of Energy, DOE Guideline Root Cause Analysis Guidance Document, Office of Nuclear Energy and Office of Nuclear Safety Policy and Standards, U.S. Department of Energy, Washington DC, USA, DOE-NE-STD-1004-92, http://tis.eh.doe.gov/techstds/standard/nst1004/nst1004.pdf, 1992.
[2] C.W. Johnson (2003 in press), A Handbook for the Reporting of Incidents and Accidents, Springer Verlag, London, UK.
61

APPENDIX B ASSESSMENT OF COMPLIANCE TO SCHEME REQUIREMENTS
A set of scheme requirements was identified in Part 1, and an assessment of compliance to the requirements is given below.
B.1 OPERATIONAL ENVIRONMENT
1 Scheme should link to existing systems, not just to existing incident reporting and analysis but also to safety management systems, control logging, risk management, etc.
The current industry practice was determined in Part 1, and crosschecked in [1]. The information flows to stakeholders inside and outside the organisation were identified (see Section 3 of Part 2).
2 The scheme has to be implementable by industry – and allow an evolutionary approach.
The generic incident handling (Section 3 of Part 2) is based on current practice drawn from different industries, different sizes and different positions in the supply chain. Subsets of the incident handling scheme are linked to different levels of maturity in Section 3 of this part. The E/E/PES extensions are designed as an add-on to current practice (see Section 4 of Part 2). Implementation issues are covered in this part. An incremental approach is possible if we address the different stakeholders who can benefit from the information – probably starting with the actions that affect the immediate working environment, so that the benefits of incident reporting are evident to the incident reporters.
B.2 CLIENT COMMUNITY
3 We can assume client community will at least comply with RIDDOR. However this does not necessarily imply that there is a pre-existing incident reporting and analysis scheme internal to the company (RIDDOR allows telephone reporting).
Implementation options could recommend lightweight technologies for reporting and analysis approaches (e-mail, etc).
4 The scheme should be applicable to organisations at different levels of maturity and organisational complexity. (Note we need to interview low maturity organisations.).
Scheme elements are mapped on to existing reporting structures and responsibilities in this part.
B.3 SPECIALISATION FOR E/E/PES
5 The scheme should use terminology and concepts from IEC 61508 as a basis, but should not be bound completely to this if certain aspects are not fully covered or if we consider the standard’s terminology to be a barrier to the target user’s understanding. The scheme should not depend on detailed knowledge of IEC 61508 or on the technical terms used within it.
The incident report will identify what happened to E/E/PES involved in the incident. These failures should be consistent with the top-level system hazards identified in the risk analysis. This information can be used to check the completeness of the analysis.
62
The analysis of incident causes will identify why the failure occurred (eg operation, configuration, random failure, etc).
The root cause analysis identifies how the problem occurred at that point in the IEC 61508 lifecycle and this can be used to improve the process to prevent a recurrence of such problems in future systems (eg via training, competence, procedures, techniques, standards, tools, etc). See Appendices A to D of Part 2.
6 The scheme should cover E/E/PES users, E/E/PES system designers and E/E/PES product suppliers.
Where the causal analysis identifies a problem in the realisation of the E/E/PES system, this should be reported to the relevant supplier (together with an incident severity). From a user perspective the E/E/PES is a black box where the user can only describe the symptoms rather than the cause. However the supplier can identify why the failure occurred (so the problem can be fixed) and how it can be prevented by changes in the supplier’s lifecycle (so the process can be improved to avoid the problem in future). See 3.6.2, 4.5.1 and Appendix D of Part 2.
7 The scheme should fit in with existing incident reporting and analysis schemes but the focus of our study is on E/E/PES specific aspects. (We might need to develop process models after the consultation to help define the interface between general and E/E/PES specific aspects and also between the core guidance and wider issues such as incident reporting, incident investigation and process improvement).
We have identified the additional information required to cover incident involving E/E/PES systems. As far as possible this can be implemented using different E/E/PES technical investigations and supporting forms. See Section 4 and Appendix E of Part 2.
8 The scheme needs to identify necessary "pre-conditions", ie elements for incident recording and analysis that are needed before it can be specialised for E/E/PES related incidents.
The elements of a general incident and recording scheme are given in Section 3 of Part 2, and also covered in the example incident reporting forms in Appendix E of Part 2.
9 The scheme should identify where an E/E/PES is involved in an incident, and whether changes in E/E/PES related aspects (taking a wide interpretation - training, process etc, as well as E/E/PES implementation) could have averted or contained the incident.
The E/E/PES involved in the incident will be identified in the incident report, recommendations arising from the causal analysis will cover remedial action in associated elements, ie people and procedures associated with the E/E/PES as well as changes to one or more PES to prevent or mitigate the incident (see Section 4 of Part 2).
63

B.4 SCHEME DESIGN
10 The scheme should take account of the criticality and potential consequence of the incident. The measure of criticality will depend on the scheme user. Vendors may measure this by safety integrity level, users by consequence
Section 3.4 of Part 2 identifies factors affecting incident priority. Investigation of E/E/PES problems is also prioritised (Section 4.3 of Part 2). Investigations might only be done the first time a particular kind of incident occurs, if the worst-case effect is not serious. The severity of E/E/PES problem is propagated to the supplier in the user equipment problem report (see Figure E.2 of Part 2).
11 The core scheme should be concrete (to simplify implementation – especially for smaller companies, and to improve comparability), eg state overall principles, implementation approach, and example forms etc that can be adopted by clients.
Concrete example forms have been produced for smaller companies (Appendix E of Part 2). Guidance on mapping to existing schemes is given in this part.
12 The duty holder's viewpoint has to be established and addressed when devising the scheme, Note a duty holder organisation is likely to have several roles to consider.
The learning process model identifies different roles within the organisation (eg operations, engineering and management) who are able to learn from E/E/PES incidents. The scheme recognises that different organisations have different viewpoints and can control different parts of the process. This affects the tailoring of the causal analysis taxonomy (see Section 5 of Part 2 and Appendix A of Part 2). It is also reflected in the information passed to the different E/E/PES stakeholders such as the engineering departments and the supply chain (see Sections 3 and 4 of Part 2).
13 The scheme should be based on current industry practice and emerging practice where relevant.
The scheme makes use of information on incident reporting schemes gathered in the survey and scheme evaluation (see Part 1 and [1]).
14 The scheme should cover recursive causal analysis, but provide guidance on when to 'stop'. In particular it should encourage consideration of root causes rather than taking a 'sticking plaster' approach.
This is covered in the general incident investigation policy (3.4 of Part 2) and the technical investigation (4.4 of Part 2). When to stop is also conditioned by whether a particular stakeholder has control over the identified root causes and whether there is anything to be gained from an investigation (eg the causes may already be known).
15 The scheme should include the generation of recommendations from identified root causes.
Discussed briefly in 3.5.4 of Part 2. The assumption is that the recommendations follow directly from the causal analysis, since the causes have been deliberately framed in terms of actions that would have avoided the incident. Specific help is provided for some scenarios in Appendices A and C of Part 2 and A.4 of this part.
64
16 The scheme should address confidentiality issues (of reporter, incident details, causal analysis, etc)
Our experience indicates that industry does not favour confidential reporting, partly because they favour an “open culture” and also because it is difficult to gather further information if the reporter is anonymous. The issues are discussed in Section 3.3 of Part 2. However anonymity might well be required if incidents are to be shared outside the company (see Section 3.6 of Part 2).
17 The scheme should consider how to make learning the lessons effective, so that lessons learned through incidents in one system are used to prevent the incident being repeated in others.
The overall process of learning in described in Section 3 of Part 2, and specific enhancements for learning from E/E/PES incidents are identified in Section 4 of Part 2.
B.5 HSE DATA CONSISTENCY REQUIREMENTS
18 Scheme should have a common taxonomy to aid consistent characterisation, retrieval and analysis but not be restrictive. For example make use of free text and/or allow subclassifications. Nonetheless, it is believed that a common causal taxonomy is likely to be most important in achieving consistency within a domain.
We propose a classification that is linked to the types of action that can be used to remedy the problem (either now or in the future) – see Section 5 of part 2.
19 Repeatability of reporting and analysis is a desirable goal, but not at the expense of coverage or consistency.
As identified in the workshop [1], repeatability is difficult as there are many organisational and personal biases. However the proposed classification does cover E/E/PES behaviour, the E/E/PES problem and underlying causes of the problem from the perspective of the investigating organisation.
B.6 SCHEME IMPLEMENTATION
20 The scheme should include recommendations on necessary competence (eg recommend the use of teams in causal analysis to ensure good coverage of viewpoints, using the people enough knowledge of the operational context, etc). Causal analysis (techniques, teams used, formality of approach, validation etc) should be proportional to the potential criticality of the incident. The potential criticality will very often differ from the actual outcome.
There is guidance on causal analysis methods, with criteria for selection in Appendix A.
21 The scheme should include recommendations on process aspects, such as validation of incident report and causal analysis classifications.
The stages and the process activities are given in Sections 3 and 4 of Part 2. Section 3.3 of Part 2 identifies the need for validation of the incident details and the fact that an open reporting culture helps to ensure that reports can be checked. The guidance in this part covers tailoring of the process for any specific organisation.
65
22 The scheme should document adoption issues for consideration by the implementer. This should include guidance on cultural factors (eg creating trust for confidential and open systems, encouraging participation) and training.
Adoption issues were covered and identified in Part 1 and [1], and these has influenced the scheme design (putting greater emphasis on simplicity and usability). Cultural and adoption issues are covered in this part.
23 Some guidance should be given on what defines an incident. This could change depending on the perspective of the organisation using the scheme.
In practice the scheme may well cover incidents that are not safety-related but have an economic impact (see 3.4 of Part 2). From an E/E/PES perspective, an incident could simply be a technical problem (eg found in testing) that needs to be investigated for potential impact (see 4.3 of Part 2). The types of incident that are relevant in a general incident reporting scheme are listed in 3.4 of Part 2. The incidents chosen will be company specific, and the choice of relevant incidents is addressed in this part.
B.7 REFERENCES
[1] PG Bishop, LO Emmet, K Tourlas, W Black, C Johnson, “HSE Learning from Incidents: D3—Scheme Evaluation”, Adelard Deliverable, D/226/2307/3, 2003.
66

APPENDIX C SCHEME RATIONALE
C.1 SCOPE OF SCHEME
We had a choice of either:
· a full incident reporting scheme that includes E/E/PES; or
· an “add-in” to existing incident reporting schemes that covered E/E/PE aspects.
We chose the second option because it involves the minimum change for organisations with existing incident reporting schemes. It is clear that many organisations have their own forms and processes, but few have specific procedures for E/E/PES. Adding separate forms and a separate “technical investigation” is simpler. An E/E/PES analysis could well be undertaken by different personnel in a different department (eg an instrument engineer rather than an operations supervisor).
Companies with no scheme at all are still supported because we describe a generic incident reporting scheme that would need to be implemented first before the E/E/PES additions are deployed.
C.2 ADOPTION ISSUES
It was clear from [2], that adoption had to be carefully considered. To be successful it was important to maximise “gain for pain”. So the scheme should yield a company benefit (better production, lower sick pay, fewer injuries, etc). We needed an incremental scheme that can be progressively implemented. In practice a generic scheme needs to be implemented first and the company convinced of the benefits. Even in the generic scheme we identify various levels of increasing sophistication so the scheme can evolve. The E/E/PES aspects are separated as much as possible so that these can also be added in incrementally.
The example forms should provide a starting point for the scheme implementation, but we need to build on existing structures wherever possible (eg existing quality management, engineering procedures, and safety management processes). We hope that the separation of E/E/PES aspects will minimise management disruptions and implementation costs and simplify the identification of personnel to implement the activities.
C.3 CLASSIFICATION SCHEME
One of the original goals of the scheme was to use a consistent classification. The first issue was to decide what should be classified. In [1], we developed quite a complex classification including:
1 A context classification – the application area for the E/E/PES.
2 A failure mode classification – what type of failure behaviour is exhibited.
3 A problem classification – the immediate cause of the failure (this including problems in surrounding E/E/PES infrastructure (personnel, other systems).
4 A problem prevention classification – where in the system lifecycle the problem could have been prevented during development. This is linked to our analysis of IEC 61508 causal classification categories.
67

5 A rectification classification – how the problem was resolved. Ideally the E/E/PES should be re-engineered, but in practice the problem might be resolved by changes in the operation or maintenance regimes.
This disjoint set of classifications could potentially allow cross-industry analyses of different equipment types in many different ways.
However consultation in [2] indicated there was no perceived benefit to the user organisation from items 1 or 5 and, as we need to encourage adoption, these have been discarded. Information about the context would be helpful to the supply chain, but should only be supplied as when the problem is reported (ie not be included in the classification).
The remaining classifications were designed to follow directly from the causal analysis and hence require minimum effort to derive.
E/E/PES problem reports could be part of an engineering maintenance database (rather than the more generic incident database). The classification of E/E/PES problems and causes could be useful in longer-term data analyses, for example in identifying excessive dangerous failures or the most significant causes of problems.
It was also important that the scheme was not too intimidating and over complex to apply. The taxonomy hierarchy can be “pruned” to an acceptable level of complexity.
C.4 CAUSAL ANALYSIS APPROACH
Here again we faced the problem of choosing between generic methods of incident analysis and E/E/PES-specific approaches. It is apparent from [2] that large companies have their own incident analysis methods and would be reluctant to change. Companies without explicit methods do not want complicated schemes, and in the case of equipment suppliers the analysis is focused on the cause of the failure—not the overall incident that could be quite complex.
We therefore decided to focus on the E/E/PES specific aspects that are often not covered directly in existing schemes. We thought a “technical investigation” sub-activity on an E/E/PES “problem” would be easier to incorporate and would not conflict with existing approaches. The PARC method, using a PRISMA style flow chart, was developed in [1] and evaluated in [2], together with a simple checklist approach based on the set of classifications described in Section 5 of Part 2. These approaches address the same issues, namely failure behaviour, problem causing failure and the root cause of the problem. Generally speaking, the end-user organisations preferred the flowchart, while the suppliers preferred checklists.
Many different incident reconstruction and analysis methods are reviewed in Part 1, and in this part several causal analysis methods are selected, described and applied in a case study to determine the underlying causes (and classified using the end user classification from Appendix B of Part 2). The PARC method is clearly more limited in application than the other methods, confirming that it is best used either for simple incidents or as part of a more general incident investigation where a technical investigation is invoked. The case study shows that it is possible to use the IEC 61508 taxonomy with any analysis method, as an extra stage to classify the underlying failures in terms of the requirements of IEC 61508. The advantage of the E/E/PES-specific analysis (flowchart or checklist) is that the classification is actually used to aid the analysis. However there is no reason why a checklist cannot be used
68
in conjunction with any general causal analysis technique (once an E/E/PES specific problem has been identified as a causal event in the incident).
In appendix D we have provided a rationale for our selection of a suitable subset of methods that should be effective and relatively easy to apply, the main objective being to select techniques that provided adequate coverage of the IEC 61508 taxonomy (see Appendix A of Part 2). We cannot enforce such methods, but we can illustrate their use, as we have done in Appendix A.
C.5 REFERENCES
[1] PG Bishop, LO Emmet, W Black, C Johnson, V Hamilton, F Koornneef, “HSE Learning from Incidents: D2—Outline scheme for E/E/PE in the context of IEC 61508”, Adelard Deliverable, D/221/2307/2, 2003.
[2] PG Bishop, LO Emmet, K Tourlas, W Black, C Johnson, “HSE Learning from Incidents: D3—Scheme Evaluation”, Adelard Deliverable, D/226/2307/3, 2003.
69

APPENDIX D COMPARISON AND EVALUATION OF CAUSAL ANALYSIS TECHNIQUES FOR E/E/PES
Chris Johnson, Dept. of Computing Science, University of Glasgow.
D.1 INTRODUCTION
Most companies and regulatory organizations lack the resources to train investigators in a range of different causal analysis techniques. It is, therefore, important to help managers focus finite resources on ‘appropriate’ analytical techniques. One means of doing this is to identify those causal analysis techniques that provide the greatest support for the integration with IEC 61508 proposed in the previous section. Figure D.1, therefore, provides a subjective assessment of the support that each of causal analysis techniques provides for the identification of failures in the IEC 61508 requirements enumerated in table A.5. The causal analysis techniques include those discussed in Appendix A, and in Appendix A of Part 1 that surveyed the range of techniques available.
D.2 RATIONALE FOR THE EVALUATION MATRIX
It is important to stress that Figure D.1 documents subjective evaluations. They reflect the author’s experience of applying each of the approaches to a series of E/E/PES related incidents in domains that range from international space missions through to healthcare and the offshore process industries. These assessments were validated in consultation with members of the HSE and experts on the IEC 61508 standard.
D.3 BARRIER ANALYSIS
Barrier analysis provides strong support for the overall analysis of E/E/PES related incidents [1]. It can be used to identify the failure of protection devices at a relatively high level of granularity. Hence, it is likely that it will prove a useful means of identifying problems in the overall scope of a project. Tracing the way in which an initial threat can be propagated to a target can also support the identification of hazards. In contrast, this technique has relatively little to say about the planning of activities such as the detailed installation and commissioning of an E/E/PES except where these processes give rise to hazards or can be viewed as barriers.
It is for this reason that we would recommend barrier analysis as a relatively accessible and low cost means of performing an initial causal analysis. More complex incidents may, however, require that additional modelling and analysis facilities provided by other approaches.
D.4 CHANGE ANALYSIS
Change analysis is similar to barrier analysis in that is provides a means of investigating incidents at a relatively high level of granularity [1]. This approach focuses on the differences between what actually did happen and what was supposed to happen. The intended behaviour of the E/E/PES can partially be derived from the documentation associated with IEC 61508 development and by other legal and regulatory documents. It might, therefore, be used to identify violations and problems associated with all of the requirements illustrated in table A.5.
70

- -
Elic
itatio
n an
d an
alys
is te
chni
ques
Barri
er a
naly
sis
IEC 61508 lifecycle phase C
hang
e an
alys
is
Concept - - s S s S s - SS S Ev
ent b
ased
tech
niqu
es
Overall scope S S - - s S s S s - S Ti
mel
ines
Hazard and risk assessment s s s s s S s s S - S
Acci
dent
faul
t tre
es
Overall safety requirements S S - - s s s S S - S Ev
ents
and
cau
sal f
acto
rs c
harti
ng
Allocation S s s - S s s S s Fl
owch
arts
and
taxo
nom
ies
Planning of I & C, V and O & M - s s s S S S - s s -M
OR
T Realisation - S S s S - s - S S -
PRIS
MA
Installation and commissioning - s S s S s s s s S s Ac
cide
nt m
odel
s Validation s s s s S s s s - S s
TRIP
OD
Operation and maintenance s S S s S s s S S S s
STAM
P Modification - S S s S s s - S S s
Argu
men
tatio
n te
chni
ques
IEC 61508 common requirements
Why
-Bec
ause
ana
lysi
s Competence s s s s S s s S s s s
CAE
dia
gram
s Lifecycle - s s s S s s s s s s
Verification s s s s S s s s s s s
Safety management s s s s S s s s s s s
Documentation s s s s S s s s s s s
Functional safety assessment s s s s S s s s s s s
Key
S Fully supported s Partially supported - Not supported
Figure D.1 IEC 61508 requirements coverage of causal analysis techniques
71
It is important to stress, however, that a number of problems complicate the application of this approach. In particular, it cannot easily be applied if end-users or suppliers have only partial access to this documentation. Similarly, it can be difficult to reverse engineer expected operational behaviour for legacy systems.
D.5 TIMELINES
Timelines differ from barrier and change analysis because they provide strong support for the detailed modelling of what actually happened during an E/E/PES related incident [2]. Problems arise when IEC 61508 requirements cannot be directly related to particular events. For example, the common requirement to ensure competence would have to be represented as specific events that were intended to ensure this requirement. Some event-based techniques such as ECF avoid this limitation by enabling investigators to represent the conditions that make failure events more likely. For instance, a lack of competence might provide the condition that makes it more likely a test will not uncover a potential bug. Unfortunately, conditions are not a standard part of most timelines. Hence, this approach may only be suitable for identifying specific failures in the lifecycle phases of IEC 61508.
D.6 ACCIDENT FAULT TREES
Accident fault trees have many of the strengths and weaknesses of timelines [3]. Their ability to identify failures and violations of IEC 61508 requirements is, however, compromised by the lack of temporal information in the logic diagrams. This is a strength if investigators cannot determine the exact ordering of particular events. In general, however, the lack of temporal information creates problems for investigators who must reason the detailed sequence of operations executed by an E/E/PES in the course of an adverse event. This also creates problems for the analysis of IEC 61508 requirements. There are dependencies between the various stages of the development lifecycle. Hazard and risk assessment should precede operation and maintenance. It is difficult to represent the violation of such requirements using this modelling and analysis technique.
D.7 EVENTS AND CAUSAL FACTORS CHARTING
As mentioned in previous paragraphs, the introduction of conditions into an event-based model can offer significant advantages [1]. In particular, it enables investigators to trace problems in satisfying the common requirements in 61508 that cannot easily be related to specific events. These conditions can capture the precursors or latent factors that make particular failure events more likely. For instance, a lack of adequate documentation may prevent E/E/PES integrators from identifying particular failure modes when developing more complex systems such as the redundant channels in our case study.
It is possible to criticise the incorporation of conditions into event-based models. Conditions can be represented by the specific events that lead to them. For example, instead of claiming that the documentation was inadequate we would be forced to identify particular instances when named individuals failed to adequately document their work. Although these arguments are important, the problems of obtaining information can prevent end-users, integrators and developers from tracing these specific events. Hence, we would argue for the retention of conditions in techniques such as ECF.
72

D.8 MORT
MORT provides strong support for the identification and analysis of problems in the management mechanisms that are intended to protect safety-critical systems [4]. Figure D.1 therefore denotes that this causal analysis technique might support the analysis of failures in the IEC 61508 common requirements. These relate to management activities in ensuring competence, establishing safety management procedures etc. MORT also contains branches that relate to risk assessment processes. It can, therefore, be argued that the application of this approach will uncover problems in the lifecycle requirements that relate to hazard and risk assessment.
There is, at present, little support in MORT for a detailed analysis of the problems that might complicate the realisation of E/E/PES related systems. The original technique could be refined to provide this support, for example following the approach advocated in Leveson’s software fault trees [5].
D.9 PRISMA
The PRISMA approach has much to recommend it in terms of its simplicity and previous successful applications in a range of different industries [6]. The subjective assessment in Figure D.1 is less a reflection of the underlying ideas behind the technique than it is an assessment of the existing classification schemes. As with MORT, it would be entirely possible to tailor this approach to E/E/PES and thereby turn the partial support assessments into full support. For example, PRISMA can consider engineering, construction and materials as key issues in the technical reasons for an adverse event. We could extend this flowchart to represent the requirements associated with realisation phase in Figure D.1. This observation motivates the development of a candidate analysis scheme for E/E/PES based on an extended flowchart (see Appendix C of Part 2).
D.10 TRIPOD
TRIPOD is based around concepts that were introduced in barrier analysis [7]. In addition, however, it also considers the preconditions that can compromise system defences. These preconditions can, in turn, be related to latent failures and general failure types. From this is follows that TRIPOD will have the same strengths and weaknesses as barrier analysis but with specific improvements for analysing the requirements of IEC 61508 whenever those requirements are compromised by the general failure types. The initial list of these more general causes did not include software failure. As with MORT and PRISMA, however, this could be rectified through the subsequent tailoring of the approach to support the analysis of E/E/PES related incidents.
D.11 STAMP
STAMP is intended to take a novel and distinct approach to the identification of causal factors in adverse events [8]. A control model is developed and flaws in the constraints between system components are identified using a form of checklist. This checklist in its current form provides strong guidance on the identification of problems in risk and hazard assessment. It offers less support for identifying the meta-level validation processes that must be used to ensure that constraints between control entities are satisfied. Introducing more sophisticated hierarchical control models could do this. STAMP would require considerable additional development work to derive an approach that was more directly tailored to the analysis of IEC 61508 requirements failures.
73

D.12 WBA
WBA is a very flexible technique. It compasses a two-stage approach in which an incident is reconstructed using a version of a timeline [9]. This then drives a more formal analysis of the necessary and sufficient causes of an adverse event. Relatively little is said about the content of the arguments rather than the form that they must take. Rules are provided to establish that a causal argument is correct without predetermining what types of failures or behaviours that argument is about. This makes it difficult to classify the degree of support that this approach provides as a tool to identify the failure of IEC 61508 requirements. This flexibility is achieved at a cost in terms of the level of skill and expertise that must be acquired before the technique can be applied.
D.13 CAE
CAE provides a high-level overview about the arguments and evidence that supports particular conclusions. The approach is similar to WBA in that there is little explicit support for the analysis that must be used to identify key components of the resulting graphical structures [10]. For example, there is no procedure that can be used to help investigators determine what evidence would need to be gathered in order to demonstrate a failure in the safety management of an E/E/PES related system. As with the other techniques, this guidance can be provided by extending the various stages in the existing approach.
D.14 SUMMARY
This appendix has provided a subjective comparison of a range of different causal analysis techniques. The evaluation is based on a previous investigation that used each approach to analyse the causes of the same E/E/PES related incident that forms the case study in this paper. For more information, the interested reader is directed to Appendix A of Part 1. In contrast, this appendix assesses whether each technique can be used to identify potential shortcomings in the lifecycle stages and common requirements within IEC 61508. The analysis summarized in Figure D.1 and justified by the previous paragraphs has motivated our decision to develop a flowchart-based approach and an event modelling approach to the causal analysis of E/E/PES related incidents.
It is important to stress that alternative techniques, including the control theory approach of STAMP, might also have been used to support our analysis. Further work is required in order to demonstrate that the subjective evaluations identified in Figure D.1 can be sustained into the practical experience gained from applying the two proposed analysis techniques.
D.15 REFERENCES
[1] Department of Energy, DOE Guideline Root Cause Analysis Guidance Document, Office of Nuclear Energy and Office of Nuclear Safety Policy and Standards, U.S. Department of Energy, Washington DC, USA, DOE-NE-STD-1004-92, http://tis.eh.doe.gov/techstds/standard/nst1004/nst1004.pdf, 1992.
[2] C.W. Johnson (2003 in press), A Handbook for the Reporting of Incidents and Accidents, Springer Verlag, London, UK.
[3] W. van Vuuren, Organisational Failure: An Exploratory Study in the Steel Industry and the Medical Domain, PhD Thesis, Institute for Business Engineering and Technology Application, Technical University of Eindhoven, Eindhoven, The Netherlands, 2000.
74

[4] W.G. Johnson, MORT Safety Assurance Systems, Marcel Dekker, New York, USA, 1980.
[5] N. Leveson, (1995), Safeware: System Safety and Computers, Addison Wesley, Reading, MA, USA.
[6] T.W. van der Schaaf, PRISMA: A Risk Management Tool Based on Incident Analysis, International Workshop on Process Safety Management and Inherently Safer Processes, October 8-11, Orlando, Florida, USA, 242-251, 1996.
[7] P. Hudson and J. Reason and W. Wagenaar and P. Bentley and M. Primrose and J. Visser, Tripod-Delta: Pro-active Approach to Enhanced Safety, Journal of Petroleum Technology, 40, 58-62, 1994.
[8] N. Leveson, (2002), A Systems Model of Accidents. In J.H. Wiggins and S. Thomason (eds) Proceedings of the 20th International System Safety Conference, 476-486, International Systems Safety Society, Unionville, USA.
[9] P. Ladkin and K. Loer (1998), Why-Because Analysis: Formal Reasoning About Incidents, Bielefeld, Germany, Document RVS-Bk-98-01, Technischen Fakultat der Universitat Bielefeld, Germany.
[10] C.W. Johnson, The London Ambulance Service, Computer Aided Dispatch System: A Case Study in the Integration of Accident Reports and the Constructive Design of Safety-Critical Computer Systems, Reliability Engineering and Systems Safety, 71, 3, 311-326, 2001.
75
APPENDIX E WIDER ISSUES OF LEARNING IN ORGANISATIONS
In this appendix we take a broader perspective on organisational learning and briefly discuss issues surrounding the “learning from incidents” processes we have presented in the body of Parts 1, 2 and 3.
Organisational learning is many faceted, and not just limited to learning from incidents. Support for it will involve consideration of a number of different systems and processes.
Most complicating issues arise from broad cultural changes in industry as a whole over the last twenty years, including:
· Shorter professional trajectories within organisations – Professional trajectories are changing within industry, with staff moving in and out of a wider range of organisations. This means that the “know-how” of industry is much more fluid, and is less aggregated within specific organisations and professional disciplines.
· Industry churn and fragmentation – Industry as a whole is increasingly fragmented, with increased “sub-contracting” styles of business and operation. Sometimes for large projects the organisation that delivers a system may not be involved with its operation or maintenance. Another issue related to the way the industry career and commercial structure is changing is that of maintaining professional expertise and maintaining a feel for how things actually operate at the “sharp end” out in the field.
· Role and style of standardisation – Standards and regulation have generally changed from a prescriptive to a goal-based approach. Therefore there is more of an onus on organisations to identify best practices rather than to merely follow a simple “checklist” of issues to demonstrate compliance. However, maintenance of standards and project documentation is often a core means by which lessons learned can be fed back into design and operations processes. Thus the classical approach to recording lessons and experience in standards (internal and external) is in some part “against the grain” of modern styles of regulation.
The scheme is designed to address, at least in part, some of these issues. For example, the inclusion of supply chain notification and proactive “listening” functions is one attempt to introduce more cohesion across supply chains that are typically fragmented. Another example is the inclusion of internal checklists and incident repositories, which in themselves record relevant equipment and operation experience.
Although much of this document focuses on processes and techniques for organisational learning from incidents, it is important to recognise that its individuals are an organisation’s most valuable intellectual asset . Indeed, one view is that “organisation learning” is merely an umbrella term that encompasses and describes a variety of individual learning activities.
In practice, one finds that professional memory (ie artefacts and “externalised” individual knowledge) is supported by filing cabinets of “old” material and the ubiquitous “boxes in the loft” syndrome where old information is stored “just in case”. Nonetheless, this information is sometimes needed as a form of risk management on a personal, technical and company level.
76
Systematic organisation support for individual learning includes:
· Cultural support for individual learning. The culture and environment must be conducive to learning. For example, a blame culture will tend to create denial and too much pressure will leave no space or energy for learning. Reward and recognition systems should be designed to promote individual learning.
· Competence requirements for learning. Individuals need to acquire understanding and skills to help them learn more effectively and to plan and manage their own learning.
· Providing learning supervisors. Organisations need processes for workplace mentoring, and managers and supervisors need to be trained to coach and manage their staff in learning activities.
· Support for connecting people. Knowledge must transfer freely up, down and across the organisation. ‘Yellow pages’ type directory tools can help people to identify who has particular skills or expertise.
· Information literacy skills. Individuals need skills to enable them to access, communicate and manage information effectively. Skills include web literacy, information management (including avoiding information overload), communication skills and research skills.
· Access to explicit knowledge. Individuals need to be able to access all relevant documentation and papers, eg project libraries, professional community resources, corporate intranets, web documents.
· Support for managing explicit knowledge. Individuals need to be able to use systems that help them manage personal and team documentation effectively, such as training materials, research and project documents.
· Good communications. Individuals need to be able to contact people effectively. Good communication also entails systems that help manage communication such as voice messaging and spam filters for e-mail.
Standards and project documentation are an important source of organisational memory but are not necessarily recognised as such. Organisations should systematically collect their experience on standards, and the rationale for their requirements and their interpretation, from all available viewpoints.
Maintenance of professional expertise can also be a problem. Changes in technology and engineering education cause key competence requirements to shift over time. This has been problematic when the ability to understand key notations is lost, for example in older specifications and drawings. There is therefore a need to find the right balance between people’s expertise and formal documentation.
Other documentation that contains an organisation’s corporate memory may include other project documentation apart from standards, which may pose a risk if not available. Such is the importance of this other documentation, that its maintenance and use is crucial to the whole corporate memory problem. Although standards have a reasonably well-defined lifecycle of use, feedback and maintenance, other documentation (eg code listings and peripheral project documentation) is much less well supported by such systematic processes.
77

Another approach to the problems of corporate memory is to increase the sharing of knowledge and expertise through the use of networks of related professionals. Simple web based computer tools could provide for such groups across remote geographical sites (eg internet-type newsgroups, web sites, “bulletin boards” and “weblog” software). Thereafter, there is a need to consider how experience gained from such networks may be disseminated more widely outside the professional group.
Other aspects of knowledge sharing are better supported through processes of shared participation and apprenticeship. Some aspects of specialist expert knowledge (especially the how-to-do-it engineering knowledge) may be difficult to formalise and articulate; in these cases the circulation of personnel could provide means of transferring and sharing specialist knowledge. Other options include setting up mentor-apprentice relationships to support the transfer of highly specialised engineering competence.
78

Printed and published by the Health and Safety ExecutiveC30 1/98
Printed and published by the Health and Safety ExecutiveC1.10 12/03

9 78071 7 627905
ISBN 0-7176-2790-X
RR 182
£15.00