research report 250 - citeseerx.ist.psu.edu
TRANSCRIPT

HSE Health & Safety
Executive
Active pendulation control system (APCS)
Part 1 - Work Done and Current Status Part 2 - Control strategy & system robustness
Part 3 - Potential Applications
Prepared by the Universities of Glasgow and Strathclyde for the Health and Safety Executive 2004
RESEARCH REPORT 250

HSE Health & Safety
Executive
Active pendulation control system (APCS)
Part 1 - Work Done and Current Status Part 2 - Control strategy & system robustness
Part 3 - Potential Applications
D Clelland, BSc(Hons), MSc BS Lee, BSE, MSc, PhD, CEng, MRINA
D Vassalos, BEng(Hons), PhD, CEng, FRINA Department of Naval Architecture & Marine Engineering
Universities of Glasgow and Strathclyde Henry Dyer Building 100 Monrose Street
Glasgow G4 0L2
The uncontrolled pendulation motions of crane loads during offshore lifting operations not only present hazard to personnel and equipment but are also one of the key factors in limiting the operational efficiency of many offshore activities. This problem has been ‘tolerated’ for decades simply for the lack of a practical solution.
Two main projects have been undertaken to tackle this problem: one aiming to establish the technical feasibility of the concept of active pendulation control mainly through model test and the other attempting to demonstrate its feasibility in full scale prototype. This report outlines the work undertaken during these projects and presents the key findings and is in three parts.
In Part 1 the control strategy and the process of designing the controller is described in some detail, and some issues, which arose during the implementation phase of the work, are discussed. An indication of the robustness of the control algorithm and the APCS mechanism is given at component level in Part 2, and the potential application of the concept in offshore lifting and shipping industry is briefly discussed in Part 3.
This report and the work it describes were funded by the Health and Safety Executive (HSE). Its contents, including any opinions and/or conclusions expressed, are those of the authors alone and do not necessarily reflect HSE policy.
HSE BOOKS

© Crown copyright 2004
First published 2004
ISBN 0 7176 2877 9
All rights reserved. No part of this publication may bereproduced, stored in a retrieval system, or transmitted inany form or by any means (electronic, mechanical,photocopying, recording or otherwise) without the priorwritten permission of the copyright owner.
Applications for reproduction should be made in writing to:Licensing Division, Her Majesty's Stationery Office, St Clements House, 2-16 Colegate, Norwich NR3 1BQ or by e-mail to [email protected]
ii

Acknowledgements
The authors would like to acknowledge the contributions made by Halliburton Subsea and Caley Ocean Systems who took part in the demonstration part of the project. We are very grateful to the officers and crew of MV Arctic Kalvic and MV Typoon for their unstinting help during the trials often in difficult circumstances.
The theoretical work and model tests were supported by EPSRC.The demonstration and sea trials were carried out with the financial support of EC,RTD Project No.OG00171/95 UK/NL.
iii

iv

TABLE OF CONTENTS
EXECUTIVE SUMMARY 1
1. BACKGROUND 3
2. INTRODUCTION 5
3. THEORETICAL STUDIES AND MODEL TESTS 6 3.1 Open Loop Tests 63.2 Closed Loop Control Of Linear Track System 133.3 Ship Based Crane Model Tests 22
4. PROTOTYPE TESTS AND DEMONSTRATION 284.1 Approach Adopted 284.2 Design Phase 294.3 Implementation Phase 324.4 Sea Trials 39
5. CONCLUSIONS 44
APPENDIX A RESULTS OF OPEN AND CLOSED LOOP TESTS ON CABLE-BODY SYSTEM
45
APPENDIX B RESULTS OF OPEN AND CLOSED LOOP TESTS ON SHIP BASED CRANE MODEL 57
APPENDIX C PHOTOGRAPHS OF PROTOTYPE SEA TRIALS 61
v


EXECUTIVE SUMMARY
The uncontrolled pendulation motions of crane loads during offshore lifting operations not only present hazard to personnel and equipment but are also one of the key factors in limiting the operational efficiency of many offshore activities. This problem has been ‘tolerated’ for decades simply for the lack of a practical solution.
A research team at the University of Strathclyde has developed a feasible solution called Active Pendulation Control System (APCS), and so far has been able to show its effectiveness in model scale and in prototype trials. This set of reports describes the work carried out so far on this concept and discusses its potential applications.
Two main projects have been undertaken: one aiming to establish the technical feasibility of the concept mainly through model test and the other attempting to demonstrate its feasibility in full scale prototype. The work undertaken during these projects are outlined and the key results are presented.
The control strategy and the process of designing the controller is described in some detail, and some issues, which arose during the implementation phase of the work, are discussed. An indication of the robustness of the control algorithm and the APCS mechanism is given at component level together with the potential application of the concept in offshore lifting and shipping industry.
1

1

2

1. BACKGROUND
One of the biggest problems associated with lifting operations offshore is the swinging motion of the load being handled. This, often alarming, motion is largely due to the fact that the vessel on which the crane is installed undergoes constant motions. The boom tip of the crane is situated quite a distance away from the centre of motion of the vessel, and therefore any rotational motion of the vessel is translated into large linear motions of the boom tip. This in turn excites the freely hanging load which behaves exactly like a pendulum the suspension point of which is swaying.
The resulting swinging motion, or pendulation, can be very large and is often the critical factor limiting any operation involving lifting in rough weather. The pendulatory motion of a load weighing anything from a few tonnes to hundreds of tonnes can present danger to personnel and cause serious damage to equipment/vessel. For some vessels the motion is so severe that operation in seastate 3 can be jeopardised, while cranes designed to have very short free hoist cable may be able to operate in seastate up to 5. This is obviously detrimental to the overall operability of offshore systems, and a simple and practical solution to solve this problem will be enormously beneficial in improving the efficiency of hydrocarbon extraction offshore, or any other activities involving lifting at sea.
The vast majority of crane systems used in the maritime environment have no means of controlling the motions caused by the sea, wind and other external disturbances. Previous efforts of motion control have resulted in a somewhat primitive and dangerous practice of attaching harness cables to the hoist wire and pulling manually. Recently, however, passive systems have been developed and used to some effect. These utilise hydraulic pistons which are designed to act as damping elements tuned to operate in specific conditions of load mass and seastate. Both passive heave and pendulation control systems have been developed for small scale launch/recovery operations (e.g. davits for launching FRC).
These passive systems operate under open-loop control. The major disadvantage of passive systems is that changes in the load or the frequency of the disturbance will de-tune the system. Consequently, they are only used for specific launch/recovery operations where load parameters are essentially fixed.
Active heave compensation systems employ motion sensors coupled with hydraulic actuators forming a feedback loop to actively control the heave motion or associated loads over a range of varying system parameters. Some active heave compensation systems for offshore cranes have recently been developed, but these do not attempt to compensate for pendulation. The concept of pendulation control on land is well understood and has been implemented on some gantry and crawler crane systems at dock sides and so on. Sea disturbances are of course absent from these systems. The approach to the control problem, resulting from modelling of land overhead cranes is to keep the angle between the boom of the crane and the hoist line constant. This approach is not applicable to a crane operating offshore, since the crane is not mounted on an inertial reference system. As yet, there are no active pendulation control systems which can be used for general crane based operations in an offshore environment.
The proposed APCS addresses the limitations of passive pendulation damping systems by introducing active control. The control philosophy of the APCS is based on the fact that, since the vessel and the crane move in the same inertial reference system, to keep the load within prescribed limits in space, the instantaneous position of the load has to be calculated
3

from measurements of ship motions, angle between the suspension line and the boom, and the geometry of the crane structure.
4

2. INTRODUCTION
The feasibility of the APCS was investigated theoretically by the University of Strathclyde with the funding from EPSRC and industry. Model tests were used to investigate the basic physical characteristics of the pendulation phenomenon and the effectiveness of a number of control strategies. Following the successful conclusion of the project, an EU-funded (THERMIE) prototype demonstration project was undertaken by a consortium led by Strathclyde University in 1996 – 1999. Through this project it was possible to demonstrate that the concept can provide a practical solution to the pendulation problem. Further studies since then showed that the concept can be employed for a number of safety-critical operations of offshore and shipping industries.
The Health and Safety Executive contracted the University of Strathclyde to record the work done so far on the APCS concept and investigate the issues associated with its practical implementation.
The main aims of the current project are as follows:
(a) To review the work done on the concept of the APCS and evaluate its robustness in practical application.
(b) To examine the potential application of the concept in offshore lifting and other areas.
The work is to be carried out in three stages as follows:
(1) The work undertaken so far on this concept, particularly the prototype design and trials, will be reviewed and recorded.
(2) The control strategy and equipment will be examined for their robustness when applied for practical operations. Potential weaknesses in hardware and software will be identified, and ways of improving the reliability will be considered.
(3) Practical implementation and safety issues will be taken into account to identify and appraise the potential applications in offshore lifting and other areas.
This is the first of two reports on the project to be submitted to the Health and Safety Executive and, addressing the first of the work scope, reviews the results of major project on this topic carried out to date.
5

3. THEORETICAL STUDIES AND MODEL TESTS
The work was carried out primarily
(a) to determine the severity of the problem in offshore work through a numerical work on the crane boom tip motions and the pendulation system of the load suspended from a crane boom tip;
(b) to investigate the physical characteristics of the swinging phenomenon to enable a mathematical model mainly through model tests;
(c) to devise a feedback control mechanism to control the pendulation motions and to develop a number of control strategies;
(d) to test the effectiveness of the control strategies through model experiments.
3.1 OPEN LOOP TESTS
Open loop tests were carried out to investigate the dynamic characteristics of the particular cable body system used in this study, to ensure that the measurement systems did not interfere with the system dynamics and to give a benchmark for the comparison of the various control strategies.
Test System
Details of the system used for the open loop tests are shown in Fig.1.1.
trolley
x
m
linear track
l
Fig.1.1 Diagrammatic representation of system used in open loop tests
The system comprises a trolley mounted on a low friction linear track. A 3mm flexible stainless steel cable is attached to the trolley with a mass attached to its free end. The trolley is driven by a closed loop positional servo system. When driven by a range of sinusoidal input signals the dynamic response (cable angle) of the cable body system can be determined. The system allows variation of payload mass, cable length, excitation amplitude and frequency.
6

Only limited parameter variations were carried out since the dynamics of such a system are well known although particular values such as cable damping cannot be determined analytically.
The instantaneous trolley position and cable angle were measured via a continuous track low friction servo potentiometers then sampled and stored on a computer.
Mathematical Model
It can be easily shown that such a system, with the inclusion of a velocity dependent damping term, can be represented by the following non linear differential equation :-
2 �� �ml T � bT � gml sinT � xml �� cosT (1)
where m = mass of the payload and cable l = cable length to centre of mass of cable/payload b = damping ratio g = gravitational acceleration T = cable angle relative to vertical x = trolley instantaneous position
For small cable angles, ( T � 20 $ ), equation 1 can be linearised to :-
�� �ml 2T � bT � gmlT � xml �� (2) Therefore, the natural frequency of this system is
gZn l (3)
All of the parameters in the above equations are easily determined apart from the cable damping term which can only be found from experiment.
A set of tests was carried out to determine the frequency response of the system for two parameters: payload mass, m; and cable length, l. The measured frequency response of the system was compared to the predicted behaviour of a second order linear system. The experimental data was fitted using a least squares approach to a standard second order transfer function of the form
2KZ nRAO 2 2 � (4) � s � 29Z s �Zn n
where Z n is the undamped natural frequency and is related to the damped natural
frequency, Z byd
Z d Z 1 �9n
7

The term, 9 , is the damping ratio.
Summary of Open Loop Test Results
Figs 1.2 and 1.3 show results from test runs where the mass and the cable lengths were varied. It can be seen from the graphs that the system exhibits the characteristics of a welltuned system. The peak response frequency is very near the natural frequency of the cablebody system and is a function of cable length as was shown earlier. The narrow bandwidth and large peak is indicative of a system with very low damping.
Figs 4 and 5 show a comparison of the cable body systems for each of the two cable lengths to the best fitted second order linear transfer function. The results of fitting the measured data in this way give values of equivalent damping in the order of 0.006.
Prediction of the natural frequency using Eq. 3 shows good agreement, as expected. The value of equivalent damping is extremely low. It was observed that away from the peak the system exhibited a linear amplitude response whereas at resonance the system behaved linearly only for very small input amplitudes. This is as expected, since the analytical model assumes small amplitude motions.
The task of the control system was to increase the value of system damping and move the closed loop natural frequency away from the open loop value while maintaining acceptable stability margins.
8

Cable Frequency Response Cable Length = 0.5m Mass = 0.5 Kg
Gai
n (
Deg
rees
/cm
)
Gai
n (
Deg
rees
/cm
)
80
70
60
50
40
30
20
10
00.2 0.3 0.4 0.5 0.6 0.7 0.8 0.9 1
Frequency ( Hz )
Cable Frequency Response Cable Length = 0.5m Mass = 2.0 Kg
80
70
60
50
40
30
20
10
00.2 0.3 0.4 0.5 0.6 0.7 0.8 0.9 1
Frequency ( Hz )
Fig.1.2 Samples of cable frequency response from open loop tests with cable length 0.5m
9

Cable Frequency Response Cable Length = 0.7m Mass = 0.5 Kg
Gai
n (
Deg
rees
/cm
)G
ain
( D
egre
es/c
m )
80
70
60
50
40
30
20
10
00.2 0.3 0.4 0.5 0.6 0.7 0.8 0.9 1
Frequency ( Hz )
Cable Frequency Response Cable Length = 0.7m Mass = 2.0 Kg
80
70
60
50
40
30
20
10
00.2 0.3 0.4 0.5 0.6 0.7 0.8 0.9 1
Frequency ( Hz )
Fig.1.3 Samples of cable frequency response from open loop tests with cable length 0.7m
10

Frequency Response of 0.5m cable
90
80
70N
orm
alis
ed G
ain
60
50
40
30
20
10
0
Fitted
Measured
0.2 0.3 0.4 0.5 0.6 0.7 0.8 0.9 1
Frequency ( Hz )
Phase Response of 0.5m cable
0
-20
-40
-60
-80
-100
-120
-140
-160
-180
0.2 0.3 0.6 0.7 0.8 1
Ph
ase
(deg
rees
)
0.4 0.5 0.9 Fitted
Measured
Frequency ( Hz )
Fig.1.4 Transfer function of 0.5m cable
11

Frequency Response of 0.7m cable
0
10
20
30
40
50
60
70
80
90
No
rmal
ised
Gai
n
Fitted
Measured
0.2 0.3 0.4 0.5 0.6 0.7 0.8 0.9 1
Frequency ( Hz )
Phase Response of 0.7m cable
0 1
Ph
ase
( d
egre
es )
-180
-160
-140
-120
-100
-80
-60
-40
-20 0.2 0.3 0.4 0.5 0.6 0.7 0.8 0.9 Fitted
Measured
Frequency ( Hz )
Fig.1.5 Transfer function of 0.7m cable
12

3.2 CLOSED LOOP CONTROL OF LINEAR TRACK SYSTEM
To investigate the behaviour of various closed loop system strategies the previous open loop apparatus was modified so that it could be used for closed loop tests.
Test set-up
The arrangement for the closed loop tests using the linear track system is shown in Fig.1.6 below.
trolley bearings
x excitation
m
linear track l
Fig.1.6 Diagrammatic representation of system used in closed loop linear track tests
The open loop apparatus of Fig.1.1 was essentially mounted on linear bearing sets such that the whole assembly was free to move in the x direction under the influence of an external excitation. The system was excited by a linear servo position system which could drive the system with both sinusoidal and random motions with a given spectrum.
Control System Strategies
The task of the control system was to maintain the mass at a fixed known position directly under the trolley thereby minimising the cable angle relative to gravity (pendulation). This was achieved by automatically moving the trolley, in the x direction, in some prescribed manner.
Three control strategies were initially tested:-
(i) Maintaining the absolute trolley x position ignoring the cable angle.
(ii) Minimising the change in cable angle whilst ignoring the trolley position.
(iii) A combination of the above where the system will generally maintain the trolley x position but will also minimise the cable swing.
All of the control strategies were carried out using a sampled data system where appropriate signals were sampled and used to provide control inputs to the trolley servo. A conversion rate of 20Hz was used throughout and all signals were sampled and output (via a zero order hold) with 12 bit resolution.
13

Actuation was carried out using DC servo motors driven by proprietary analogue servo amplifiers.
Measurements
The following parameters were measured and logged on a computer:-
x� Excitation The disturbance to the system in the x direction.
x� Cable angle The angle of the cable w.r.t. a gravitational vertical.
x� Cable x The x position of the cable relative to the trolley.
x� Trolley x The x position of the trolley w.r.t. the linear track.
x� Trolley abs The absolute position of the trolley w.r.t. a fixed x datum.
Trolley Servo
For all of the above tests the trolley servo system was designed to have a flat response over the frequency range of interest. The trolley servo system employed both position and velocity feedback with gains Kp and Kv respectively. These gain values were fixed for all of the closed loop tests.
Although this type of response would be unrealistic in practice, due to the time lags in some large hydraulic/electric actuator systems, it would ensure that the closed loop behaviour of the test system was due only to the combination of cable/body and controller dynamics.
The frequency response of the servo system with the cable/mass attached to the trolley is shown in Fig.1.7 below.
14

Closed Loop Boom Servo Response
0
1
0.2
0.4
0.6
0.8
Gai
n
Ph
ase
(deg
)
0 0.2 0.4 0.6 0.8 1 1.2 1.4 1.6
Frequency(hz)
Boom Servo Phase Response
0
-20
-40
-60
-80
-100
-120
-140
-160
-180
0 1 1.2 1.40.2 0.4 0.6 0.8 1.6
Frequency(hz)
Fig.1.7 Frequency response of boom servo system
Test Schedule
The tests took the form of both open and closed loop runs over a frequency range covering the major dynamic response of the cable-body system. The systems were excited using both pure sinusoidal disturbances and pink noise disturbances with different centre frequencies.
The excitation frequencies were chosen so that the whole of the dynamic response of the cable-body system could be investigated, particularly near the cable resonant response, and not using any particular scaling factor.
The excitation amplitude was set to the maximum that the open loop system could endure without causing damage to the cable angle measurement system (+/- 80 degrees)
15

The test schedule is shown below in Table 1.1 and was repeated for each of the three control strategies.
Table 1.1 Test schedule
Sinusoidal tests frequency range 0.1 to 1.0 Hz frequency increment 0.1 Hz amplitude 50mm Random tests centre frequency 0.5Hz and 0.7Hz variance 50mm Cable/Body Parameters Cable length 500m Cable natural frequency 0.7Hz Cable diameter 3mm Mass 0.5 kg
Observation on the Results
Some of the results of the tests are shown in Appendix A.
(a) Control Strategy 1
This method compensates for the disturbance by moving the trolley in such a manner that the cable top excitation is minimised. The block diagram of this strategy is shown in Fig.1.8.
As can be seen from this figure the cable-body system is outside of the loop and hence there is no direct control action on the cable mass. This type of control has been used in a number of offshore applications (heave compensation in particular) where the disturbance is measured and then its effects compensated for in a feedforward structure with the dynamics of the cable body system being ignored.
The requirement for this method to operate successfully is that all major disturbances have to be accurately measured and the open loop system must be well-behaved (constant with a reasonable damping ratio). The trolley x position could have been measured directly giving a feedback structure but the cable system would still be outside of the loop.
A typical result of the sinusoidal tests is shown in Fig.A.1. At the start of each test the control system is turned on and about half way through the control is switched off.
As expected, the closed loop system gave satisfactory results when the excitation frequency is away from the cable-body natural frequency. Near the cable natural frequency significant uncontrolled cable swing took place and at resonance a potentially unstable response where the cable angle grew with time. This type of result is expected considering the very low value of cable damping. Away from resonance the system performs satisfactorily and this method could be viable as long
16

as the excitation frequencies remain below the cable resonance frequency and that no other disturbances act on the cable system. It is most unlikely that in a practical situation the excitation frequencies would be above the cable natural frequency.
(b) Control Strategy 2
This method uses a feedback signal measured directly from the cable so as to compensate for any disturbances on the system which causes the mass to move in the x direction relative to the trolley. The block diagram is shown in Fig.1.9. A traditional proportional plus derivative controller was used to give both high loop gain and closed loop damping.
The result of a typical sinusoidal test is shown in Fig.A.2. Once again the control is initially on and then switched off. A small unavoidable offset of 1.5 cm in the cable measuring system indicates the point at which the control is switched off.
The performance was poor at frequencies below the cable resonance and comparison with strategy 1 showed that it is superior over this region. Near resonance, however, this method gave superior results although the penalty is increased control effort manifested through the increased actuator movement (Trolley x) over strategy 1.
This method also has the advantage over strategy 1 in that any other disturbance acting on the system (e.g. aerodynamic effects on the mass) will be compensated for automatically.
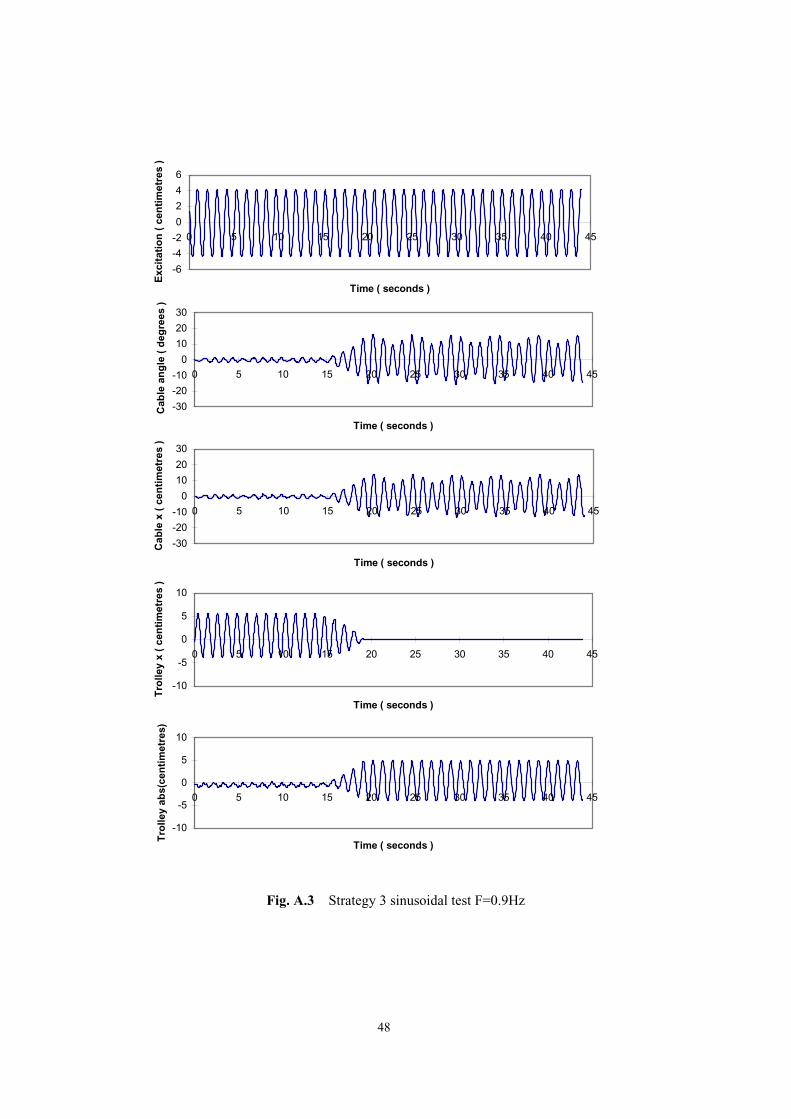
(c) Control Strategy 3
This method uses a combination of strategies 1 and 2. The block diagram of the combined system is shown in Fig.1.10. The disturbance is measured, processed and input to the servo controller as before. The disturbance input bypasses the PD controller. The cable angle is measured, compared to a fixed datum (the desired trolley x position) and, after processing via the PD algorithm, is combined with the disturbance input.
At frequencies away from the cable resonant response the outer loop has a very low gain and the closed loop response is dominated by the strategy 1 disturbance input, i.e. the system minimises the cable excitation and the cable dynamic response is small. At frequencies near resonance the outer loop gain increases significantly and the system then acts as in strategy 2 where the PD controller increases the closed loop damping. At this point the strategy 1 loop still minimises the cable top excitation.
The results of the sinusoidal tests (a typical case is shown Fig.A.3) produced good closed loop performance throughout the frequency range. Furthermore, due to the reduced cable top excitation, due to strategy 1, the control effort due to the strategy 2 loop is significantly reduced.
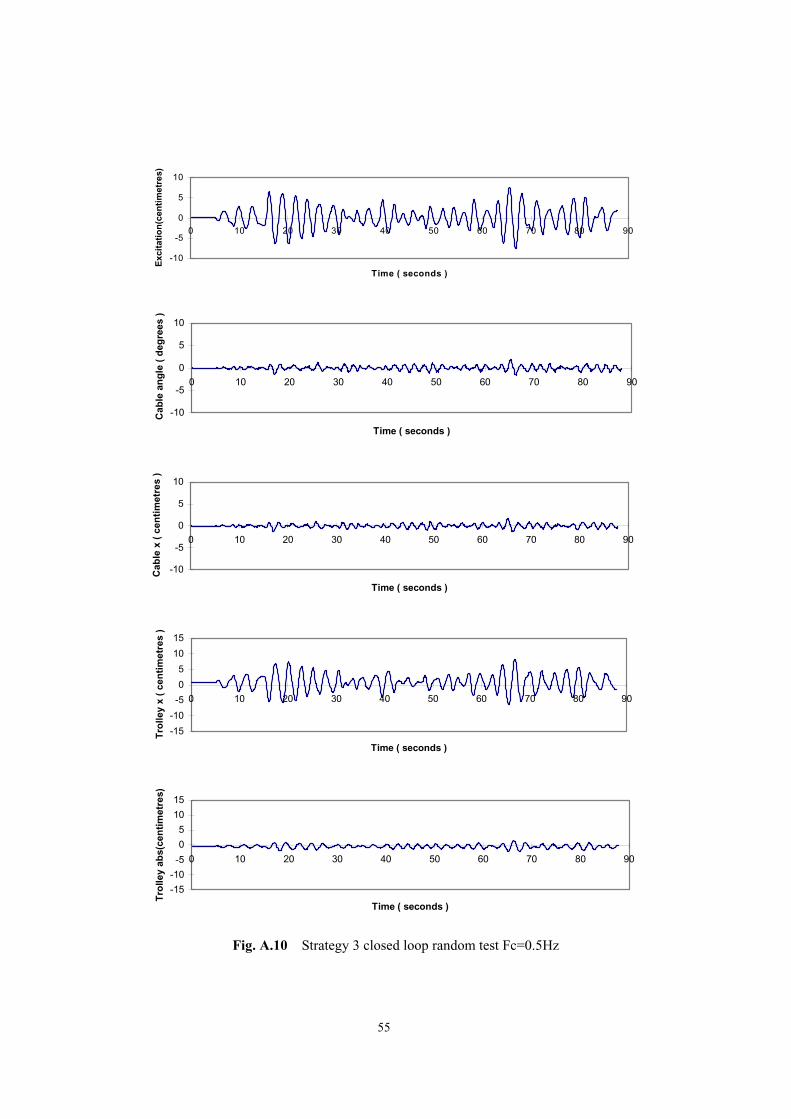
(d) Random inputs
It is true to say that offshore systems never undergo pure sinusoidal excitations. The sea spectrum encountered by a vessel consists of an infinite number of frequencies, albeit in a narrow frequency band. The vessel dynamics in turn will filter this wave input to produce a set of motion responses with a still narrower bandwidth. It is this
17

motion response which excites the cable systems on offshore cranes. Whether a large response from the cable system is produced depends on the wave-excited vessel motions at the time coinciding or being close to the cable natural frequency. Since the cable natural response can vary between, for example, 6 and 13 seconds (for cable length of 10m and 40m respectively) and vessel motions between 6 and 25 seconds, we see that this situation can easily arise.
The random inputs chosen for the closed loop tests were selected to have energy spectra similar to sea spectra with two centre frequencies, one at 0.5Hz - just below the cable natural frequency of 0.7 Hz; and another coincident with the cable natural frequency.
Figs A4 and A5 show the open loop response to the two excitations, while the closed loop result for each of the three strategies is shown in Figs A6 – A11.
The results mirrored the sinusoidal tests. The response from the strategy 1 method showed large cable angles being recorded at the cable natural frequency for both input spectra. Strategy 2 fared somewhat better, especially for the case where the input centre frequency coincides with the cable natural response. As with the sinusoidal tests this method produces large (undesirable) control actions.
Strategy 3 produced good results for both input spectra and also control actions do not exceed the disturbance input amplitude.
For the reasons mentioned above it was decided to use this strategy for the ship based model experiments.
18

Ke
Exci
tatio
n Tr
olle
y x
/ A
mp
/M
otor
Trol
ley
Serv
o Kp+
Kvs
Cab
le
angl
e D
esire
d Tr
olle
y x
Cab
lebo
dy
Fig
. 1.8
S
trat
egy
1 -
mai
ntai
ning
trol
ley
x po
sitio
n
19

PD c
ontro
ller
Trol
ley
x
Am
p Se
rvo Kp+
Kvs
Kc+
Kds
Mot
or/
Cab
le/
Trol
ley
body
C
able
D
esire
d an
gle
Trol
ley
x
tC
able
po
Fig
. 1.9
St
rate
gy 2
- m
inim
ise
chan
ges
in c
able
ang
le
20

Am
p t
Ke
Serv
o Kp+
Kvs
Des
ired
Trol
ley
x
Cab
le p
o
Exci
tatio
n
cont
rolle
r
Trol
ley
x
Mot
or/
Cab
le/
Trol
ley
body
C
able
an
gle
Fig
. 1.1
0 S
trat
egy
3 -
com
bina
tion
21

3.3 SHIP BASED CRANE MODEL TESTS
Crane Model
To investigate the behaviour of the pendulation controller on a system which more closely models the geometry and operating environment of an offshore crane, a scale model of an offshore pedestal crane was designed and constructed in the Department's Laboratory.
The model crane was based on a 1:40 scale Huissmann OPC-B 6000 offshore pedestal crane.
The model was designed to operate in 3 degrees of freedom, with independent control of slewing, luffing and winch operations, although only the latter two modes were used in the study. Actuation was carried out by DC servomotors coupled with belt-drive gearboxes to provide the required torque with reasonable motor rpm.
The model was fitted with a gimbal arrangement which incorporated a proprietary low inertia potentiometer, used to measure the hoist cable angle. This system typically gave a cable angle measurement to an accuracy of +/- 2.0 degrees. Measurements of the boom angle and winch (cable length) were obtained directly from the respective servo feedback components.
Ship Model
The ship model used in this study was an existing barge type model. The principal dimensions and parallel body cross section are shown below in Fig.1.11.
Length = 2.5 m Breadth = 0.5 m Draught = 0.25 m Displacement = 270 Kg
Fig.1.11 Cross section of a barge model and its main dimensions
22

Crane Servo Systems
As with the previous linear track tests the crane servo systems were based on analogue controllers using both velocity and positional feedback tuned to provide a flat response over the test range. The boom luffing servo control also used a small amount of integral action to give good low frequency tracking without the requirements of excessive loop gain.
As in the linear track tests no attempt was made to model the behaviour of existing crane control drive systems so that all observed dynamic responses were due to the ship response, crane geometry and cable-body dynamics. The system was tuned and calibrated to give an accuracy of r1 degree for the boom angle setting and 3mm winch resolution.
Details of the servo systems are summarised below.
Luffing Servo
Motor Type G12M4T Printed armature DC servo motor with tacho Gearing 18:1 Synchronous Belt system Feedback Single turn Servo pot Servo Amp EM100A Linear transistor 200Watt Control Closed loop position/velocity Range 40 degrees
Winch Servo
Motor Type G12M4TGearingFeedbackServo Amp EM100BControlRange 0-1m
As above direct drive Multi turn Servo pot
Linear transistor 48Watt Closed loop position/velocity
Test Set-up
Model tests were carried out at the Department's Sea Keeping facility. Schematics of the model arrangements in the tank is shown below in Figs 1.12 and 1.13:-
23

Roll Measurement system
Beach
Wave Maker
16.75m
m
L1 L2
2.5
Fig.1.12 Test set-up: view along the ship model
Moorings
Ship
Crane Boom
Wave direction
Fig.1.13 Test set-up: plan view
24

The model was placed beam-on to the waves with the boom pointing toward the incoming wave train. This situation was chosen to give the maximum excitation to the ship and the hoist cable. The model was loosely tethered to give freedom to roll, heave and sway, whilst minimising drift which would corrupt the roll measurement system.
The ship roll motion was measured using two linear displacement transducers attached via wires mounted amidships across the beam. For small motions there is a simple geometric relationship between the transducer outputs and the ship roll.
As in the linear track tests all signals from the crane were sampled via a computer and used to calculate the required control action which was then output to the boom servo.
The following measurements were made for all of the ship based tests:-
Signal Measurement Method
x� Boom angle servo pot on crane boom motor
x� Cable angle gimballed pot attached to hoist wire on boom tip
x� Winch position servo pot on crane winch motor
x� Ship roll motion twin LVDT system (described above)
x� Boom servo input command output from control computer
x� Wave profile resistance type wave probe
Test Description
Both sinusoidal and random waves were used to investigate the closed loop performance of the Strategy 3 control scheme. Some changes were made to the original strategy 3 control program to account for the crane geometry.
The tests were not designed to represent an accurate model of the full scale situation, rather ship parameters were chosen so as to cause large excitations of the boom tip for the given cable length used.
The range of test frequencies was limited at the low frequency end (f < 0.5 Hz) by the lack of ship’s response and at the high frequency end (f > 0.85 Hz) by large drift motions. The mean boom angle was set to 62 degrees which closely matches the normal operating angle for the OPC 6000 crane.
The hoist wire length was chosen so that the cable natural frequency lay in the middle of the test range. The cable length was fixed at 50cm for all of the tests except for the cases where the cable length was varied with sinusoidal profiles over a range from 30 to 70 cm.
25

Significant wave values are based on a scale factor of 1:40.
The details of the test runs are given in Table 1.2 below:-
Table 1.2 Conditions of test runs
Sinusoidal tests Model Scale Full Scale frequency range 0.6 to 0.8 Hz 0.095 to 0.126Hz frequency increment 0.05 Hz 0.008 Hz amplitude 10 mm 0.4m Random tests centre frequency 0.7Hz , 0.8 Hz 0.11Hz and 0.126Hz significant value 2.5, 5 and 7.5cm 1, 2 and 3m Cable/Body Parameters Cable length 500mm, 300 - 700mm 20m, 12 - 28 m Cable natural frequency 0.7 Hz, 0.91 - 0.56Hz 0.11Hz, 0.14 - 0.094Hz Cable diameter 3mm 120 mm Mass 1.0 kg 64 tonnes
Observation of the Results
The results of a typical regular wave tests are shown in Figs B.1 and B.2. For each of the five frequencies tested the controller gain was varied so that the control was initially on, then ramped down so that the cable system was open loop and then ramped up again. The cable angle increased rapidly once the control is off with cable angles approaching 70 degrees regardless of input frequency.
As with the linear trolley tests the system performed better near the cable natural frequency where the outer feedback loop (see Fig.1.10) is dominant over the feedforward boom compensation input. This is likely due to deficiencies in the roll measuring system which was used to generate the feedforward signal.
It was evident from the roll motion time histories that there is some coupling between the crane system and the ship. This was particularly true for the low frequency runs where the excitation frequency approached the ship's natural roll response (0.5Hz or 12 seconds full scale). This natural roll period of the model is low, since we would expect it to be nearer 20 seconds which would de-tune the parametric excitation from the boom to the boat. More important, perhaps, is the flat bottomed hull with rounded corners which is a geometry known to have very low roll damping. The crane model itself was heavier than the appropriately scaled OPC B-6000 due to requirements of the servo systems. The mass was high due to requirements of the cable angle measurement system which needed high tension in the hoist wire to give a stable signal.
26

Nevertheless the system was capable of stabilising the load throughout the cable's resonant response with large uncontrolled cable swings of over 70 degrees reduced to 8 degrees at worst and 4 degrees at best.
Results from the random wave tests show a similar behaviour to the regular tests. With the control off in even the smallest of test seas the cable swings violently with maximum values of over 70 degrees.
For the largest sea state the worst cable response shown was ±10 degrees maximum.
One final test was carried out where the winch paid out and reeled in the hoist cable with a sinusoidal profile and amplitude of 20 cm. The results of this are shown in Fig.B.3. The closed loop system showed no marked difference in performance from the similar case which had the cable length fixed.
27

4. PROTOTYPE TESTS AND DEMONSTRATION
A prototype crane was constructed to demonstrate, through offshore trials, an automatic control system that reduces the pendulation of suspended loads in offshore lifting operations
4.1 APPROACH ADOPTED
The project was conducted in three main phases as follows:
(a) Preparatory studies and development of time-domain simulation programs. (b) Design, construction and commissioning of the prototype crane. (c) Sea trials of the prototype crane.
During the preparatory phase, some crane models were sought out and a suitable one selected as the basis of the prototype design. At the same time a suite of computer programs were written to simulate the behaviour of the prototype crane with and without the APCS implemented. These programs were then used extensively for subsequent design and modification work.
There are three main components of the APCS crane: the controller including the instrumentation; the crane including hydraulic actuators; and power pack including hydraulic control valves. Control algorithms were developed and tested on the computer simulator to ascertain their effectiveness. Eventually one algorithm was selected, but another much simpler (and hopefully more robust) algorithm was also retained as a back-up. The power requirement was estimated from a series of time-domain simulation studies, using these algorithms and the probable ship motion characteristics in realistic sea conditions.
The simulation was also used to estimate the maximum inertial forces the crane structural members would be subjected to for a given seastate. Based on this data, the crane structure and the control mechanism were designed and constructed.
With the crane manufactured and the controller designed, it was then possible to design the instrumentation system. Since the instrumentation system was to be exposed to the rigours of service only for a short period of time, it was decided to minimise the cost by reducing the degree of weather-proofing.
When all the equipment was ready, they were tested on land and the calibration of the instrumentation system and the controller was carried out. Minor modifications were made to the mechanism to ensure smooth sea trials.
The first sea trial was used to ascertain how well the system worked in a realistic operational condition, while the second was used to refine the system further and obtain system performance data.
28

4.2 DESIGN PHASE
(a) Controller
In spite of the findings during the theoretical and model test studies, a more prosaic approach was decided upon and it was originally decided to compensate for the disturbance due to the vessel motions by moving the crane boom in such a manner that the cable top excitation is kept below a minimum level. The feedback signal measured directly from the cable was to be used with the assistance from a feed-forward signal. At this stage it was thought to be insufficient to rely on the limited control range of the boom tip motion. However, it turned out during the prototype sea trial that in fact only a limited control range is required for effective operation of the APCS.
Accordingly, the control scheme was devised with the feed-forward dominating below the cable resonance frequency and the feedback loop dominating near the cable resonance. In this respect it should be appreciated that the cable resonant frequency constantly varies with the cable length.
The model tests showed that the cable oscillation amplitudes of as high as 70° could be effectively reduced to less than 8°, with a worst case observed of 10° in random waves equivalent to 3m significant height full scale (seastate 5). This was a very encouraging result, as it was achieved with a control scheme which was yet to be designed properly. The effects of variable cable length were tested, but no marked difference in performance was observed. Cross coupling between the boom motion and the ship’s roll motion was observed during some of the tests. However, the crane model was rather large relative to the ship model, and it is thought that such unfavourable combination of crane dynamics and vessel stability and dynamic characteristics can be avoided through careful design.
For the design of control algorithm ‘realistic’ operational seastates were created by using the JONSWAP spectral model. The motion response transfer functions were obtained for two ships (one monohull and the other semi-submersible) which were thought likely to be the sea trial platforms. From these data a number of realisations of the boom tip motion were produced and were used as the basis for the design and test of the controller.
Simulation showed that an arm length of 2.5m and 25° swing (equivalent to 1m horizontal amplitude) might be sufficient for a significant wave height of about 2.75m. The state-feedback control which involves position and velocity feedback in this case, has the advantage of not resulting in windup when the actuator saturates. The expected performance of such a controller for a number of seastates is given in Table 1.3.
(b) Control Mechanism
At the very outset of the project it was intended to control the ‘in-line’ pendulation with luffing of the boom. It was then pointed out that this would be cumbersome and inefficient, as the whole boom would have a very high inertia. Moreover, there is the
29

problem of control being non-linear, as the horizontal movement of the boom tip is a function of the boom angle.
Then another control mechanism was designed with the configuration shown in Fig.1.14. The control was to be achieved through the actuator arm pushing or pulling the hoist cable as required. After a preliminary investigation, it soon became evident that this arrangement would not do for many reasons. Apart from the minor problems that can be expected from the friction on the hoist cable, this arrangement would have required highly impractical structures to be constructed around the base of the hydraulic cylinder near the tip of the boom in order to ensure the movement of the actuator arm in the desired direction.
It was finally decided that the basic structure of a knuckle boom crane be adopted for controlling the in-plane (or luffing) pendulation. The out-of plane swing (at right angles to the line of the boom) would then be controlled by slewing control modified slightly to accommodate higher rate control. This left a few structural design problems, but the final configuration arrived at is shown in Fig.1.15, although the actuator was finally mounted horizontally rather than along the boom.
Fig.1.14 Method 1 Fig.1.15 Method 2 (final version)
30

Table 1.3 Significant motion responses of boomtip (Rockwater Monohull)
Wave Heading 0° 45° 90°
Hs = 2.25m
Vert. Acc. (m/s2) 0.53 0.47 0.37
Yaw Rate (°/s) 0 0.20 0.24
Yaw Acc. (°/s2) 0 0.20 0.29
Hs = 3.25m
Vert. Acc. (m/s2) 0.78 0.68 0.57
Yaw Rate (°/s) 0 0.27 0.28
Yaw Acc. (°/s2) 0 0.24 0.32
Hs = 4.25m
Vert. Acc. (m/s2) 1.12 0.96 0.83
Yaw Rate (°/s) 0 0.38 0.35
Yaw Acc. (°/s2) 0 0.32 0.40
Hs = 4.75m
Vert. Acc. (m/s2) 1.28 1.09 0.94
Yaw Rate (°/s) 0 0.43 0.38
Yaw Acc. (°/s 2) 0 0.36 0.44
(c) Power Pack And Hydraulic Components
The design of the powerpack hydraulics was based on the requirement to supply power to a number of secondary controlled hydraulic motors in addition to the main structural features. The power pack was designed to provide sufficient hydraulic pressure at the required speed of actuator movement. It was decided early on that the ‘maximum’ power demand would not be catered for, but an accumulator would be used to provide infrequent peak demands of the power. This reduced the capacity of the hydraulic pump to about 70%.
The specifications of the powerpack are as follows: Maximum pump pressure of 350 bars Maximum flow rate of the main pump at 740 l/min Installed power of 160 kW.
31

(d) Instrumentation System
The measurement system is required to measure the motions of the vessel and various parameters of the crane system. In order to minimise the cost, the instrumentation system was to be water- and otherwise weather-proofed only temporarily. This opened up the availability of the instruments which could be used for the prototype.
The main instrumentation requirements are as follows:
- The angle of rotation of the crane base (slew angle) and its rate of change - The angle of the crane boom relative to the vessel deck - The angle of the hoist cable to the vertical in two planes - Ship motions (roll, pitch and heave) - Crane hoisting speed and hoist length.
It became evident that all the angles could be measured using suitable potentiometers. An inertial motion reference unit (TSS type 335-B) was selected for measuring the vessel motions.
(e) Crane Structure
The crane was designed to have a safe working load of 5 tonnes, and the design finally decided upon is given in Fig.1.16.
The main boom consists of a tapered box section, 9.58m long from the main pivot point. A knuckle head, 3.5m long, is pivoted from the boomtip.
4.3 IMPLEMENTATION PHASE
(a) Controller
The implementation of the controller is based around a computer program running on a PC. The system provides the crane driver with current status information of the control system through the use of a user-friendly interface. A modern graphical user interface is used to graphically show geometrical data in numeric form, acquired from the crane sensors and to show in diagrammatic form the current aspect of the cable geometry in the luffing and slewing control directions. The control program allows modification of many of the controller system settings through a tabbed dialogue box.
The control program was developed using the DOS operating system to guarantee that the control function could run at the correct frequency. Using Turbo Pascal and the Borland Graphics Interface (BGI), a framework was developed so that a true graphical user interface could be used.
A normal graphical user interface to a real time program causes problems in most applications, as the updating of graphical screen objects takes priority over all other processing. This type of system cannot guarantee that the control function runs at a
32

constant frequency. To overcome this problem, a messaging system was developed. A messaging system takes the form of a communications channel within the program. Packets of data, or messages, are created when the user interacts with the keyboard or the mouse. The messages are then placed in the communications stream. At the heart of the system is the idle loop. The idle loop allows each message to be processed consecutively. By placing the control function in the timing loop, the control function has the ultimate say on whether the messages can be processed. This assures the control function is always called on time.
Two different control strategies have been implemented inside the control function, namely a Root-Locus design and a LQG based design. The Root-Locus controller is a fairly robust method. Although it does not perform as well as the LQG method in the computer simulations, it is simple to implement.
The LQG controller, on the other hand, is much more complex. The LQG controller is tuned for certain sea states and crane geometry conditions, and it requires a scheduling system to store and change the controller constants when the sea and geometry conditions change. The LQG controller’s schedule covers most of the sea and geometry conditions. If, however, the boundaries of the LQG schedule are ever exceeded, then the schedule will select a Root-Locus mode. The LQG system controls the pendulation much better than the Root-Locus system, but it can fail to function well when very large oscillations occur and under these conditions the Root-Locus controller will automatically take over.
To allow the data to be acquired and sent to the crane, hardware expansion cards have to be installed into the control PC. These cards consist of ADC and DAC converters, which convert the analogue voltages, measured from the crane sensors, to the digital numbers required by the control function and also produce analogue voltages to drive the crane servo valves. All the processing systems working on the acquired data are connected to a system similar to the messaging system of the graphical user interface. An error system is employed in which messages represent error levels and are used to put the control system into different operational modes. This allows the system to swap between Anti-Pendulation control and Direct control at either the drivers or the control systems request. The error messaging system also allows each different procedure to update internal settings when changed through the settings tabbed dialogue box.
Figs 1.17, 1.18 and 1.19 show some representative screen dumps of the control software in operation.
(b) Construction of the Crane
The crane was fabricated from three main sub-components as follows:
Boom
The main boom has been fabricated into a tapered box section as shown in Fig.1.16. The boom is placed on two large bearings which will allow the boom structure to be raised and lowered to different angles via the luffing actuator. At the extreme end of the boom there is the main sheave.
33

The boom has the mechanism for controlling the swing of the test load at the tip. This mechanism consists of a “rope guide” positioned around the rope, which is used to transmit the correcting loads delivered via a hydraulic cylinder. Some considerable time and effort was devoted to determine the optimum arrangements for the anti-swing mechanism. An excessively long swing arm would require a very long hydraulic cylinder powering it and therefore large power pack pumps to power the cylinders quickly.
Boom Support Structure
The boom pivot bearing is mounted onto sturdy support brackets on the boom support structure. The main luffing cylinder is positioned between the boom support structure and the boom. The boom support structure is a substantial construction designed to endure the high dynamic loads during operation.
At the base of the support structure is a bearing system which allows the crane to slew around the base axis. The maximum slewing angle was designed to be in the region of 120q. However, investigations have shown that this may not be the best solution. Accordingly a system comprising a hydraulic slip ring unit has been employed which will allow unlimited travel in the slewing direction. The base of the main support structure will contain a large conventional ring gear. The ring gear is used to provide a driving path for the slew motor. A single slewing motor acting through a gearbox has been selected and fitted onto the crane structure.
The Base
The base transmits the loads generated by the crane and its motions through the slewing bearing system and down to the vessel deck. The base of the crane will eventually be bolted or welded to the deck of the trial vessel via a purpose built load spreading plate.
34

Fig.1.16 The final design of the APCS crane prototype (not to scale)
35

Fig.1.17 Control software set-up interface
36

Fig.1.18 An output display of control simulation software
37

Fig.1.19 An output display of control software
(c) Dry Tests and Commissioning
The instrumentation system was tested and calibrated. The information was then incorporated into the control software. The work carried out was as follows:
(i) Connection of the instruments (mostly potentiometers) to the power source. (ii) Calibration of the instruments and checking of linearity, etc. (iii) Modification of computer control software to incorporate the calibration data. (iv) Adjustment of the instruments.
The instruments were found to be in excellent working order. However, it was pointed out that they would have to be better weather-proofed for offshore work, even for a few days operation. Consequently, all potentiometers were subsequently water-proofed.
Crane Hydraulic Control
The crane operation was tested manually to make sure that it is in safe working order and that the valves are working normally. Hydraulic controls were tested in the following steps:
38

(i) Testing the basic functional operations of the hydraulic pumps and actuators with manually controlled valves.
(ii) Setting up the hydraulic servo interface cards to obtain the desired system gain/stability and hysteresis compensation. This work was essential for working with low level command signals from the controlling computer.
(iii) Testing of the crane by injecting low frequency command signals into the servo cards to determine the open loop frequency responses of the various crane control modes.
(iv) Introducing the controlling computer, and hence closing the various feedback loops.
(v) Testing exhaustively the operation of the closed loop system to determine the final optimal values for the various control gains.
The above work was carried out for luffing only, as the slewing valve was found to be faulty. This problem persisted until the mobilisation for the first sea trial.
Crane Hardware
The mechanical working parts of the crane were minutely observed and examined for any sign of possible future fault developing. As a result, a number of components in the sensor head and the control box, housing the servo interface cards, etc., had to be replaced/modified. The major modifications were:
- Welding the sensor head securely and applying a coat of paint. - Tidying cables from the control box into a hose. - Making the control box watertight by installing a gland at the bottom of the box where
the cables enter.- Replacing the cable bush on the sensor head with nylon rollers.
In addition, it was decided to prepare a set of spare parts for the most vulnerable components for the sea trial.
4.4 SEA TRIALS
(a) First Trial
After much delay due to the designated trial ships being constantly engaged in commercial activities, a decision was made to use a ship chartered by one of the project partners. The vessel, called the Arctic Kalvik, is an offshore support ship of 90m length with adequate deck space for the installation of the crane.
Mobilisation onto the vessel was postponed four times due to bad weather , and problems experienced by other prior work. However, the crane was eventually mobilised successfully in late April 1999.
39

In order to determine the performance and sensitivity of the system the following test variables were identified :-
x� Sea state low, medium, high x� Crane slew angle 0°, 45°, 90° and varying from 0° to 90° x� Load 0.5, 1 and 1.5 tonne x� APCS mode off/on x� Cable length resonance close to maximum vessel response x� Wave direction varying (0° to 360°)
It was impractical to try all of these combinations due to constraints on vessel time and prevailing weather conditions. The approach taken, therefore, was to establish which parameters make the motion compensation more or less effective. This was achieved by fixing the sea state and test weight while varying the slew angle. The vessel was slowly sailed in a large circle to investigate the effects of vessel motions due to varying sea directions on the control system performance.
It was decided to use a relatively small load of 500kg for this trial for safety. The hoist cable length was chosen to give a resonant frequency as near to the ship’s maximum motion response for the given sea conditions as possible.
The relatively calm weather conditions were not ideal for the trials, with sea states around 1 and 2. Nevertheless a large amount of data was recorded and the APCS was shown to work very effectively. Pendulation motions in both the slewing and luffing directions were effectively negated by the control system. An example of this is shown in Fig.1.20. Here pendulation of nearly 50° amplitude with APCS turned off can be seen to be brought under control to less than 5° amplitude within a cycle or two.
This result was the more impressive, as it was achieved with a less than satisfactory instrumentation system.
A number of conclusions were drawn from this trial as follows:
- A further trial would be necessary to assess the performance as much as possible. - The Active Pendulation Control System is technically feasible. - The sensors need to be improved.
40

(b) Second Trial
After carrying out modifications to the apparent defects which came to light during the first sea trial and much tuning work, another opportunity for sea trials presented itself in early September 1999.
The vessel chosen, the MV TYPHOON, was a small, 50m long, ocean going tug. The vessel was chosen to give larger motions than the arctic Kalvik and also higher frequency motions, which would offer a more severe test for the APCS.
Mobilisation was more difficult than before - the smaller vessel having less deck space made fitting the crane a long and difficult task. The vessel did not have a sufficient electrical supply so a generator, adapted for marine applications, was used to power the hydraulic power pack and all the computer and instrumentation systems.
Once underway, it became apparent that there was a fault in the hydraulic system whereby the flow rate would saturate when the control pressure was demanded by the system. Various attempts at re-routing hydraulic lines and purging air produced little results. It was, therefore, decided to use another pump in parallel with the main pump in an attempt to maintain the flow rate demanded by the control system. This gave some improvement but the system would still saturate under heavy load. Photographs of the trials are shown in Appendix C.
Due to time constraints it was decided to carry on with the trials to investigate the performance of the APCS on a small vessel in moderate seas where the actuation system was less than perfect.
The results were quite surprising as can be seen from Fig.1.21. Even with the hydraulic problems the system eventually stabilised the load. This was an important result, because this showed that the system does not require the hydraulic system to accurately follow the command signals. This indicates that the APCS control algorithm is robust as it continues to compensate for not only the excitation of the load but also the deficiencies in the hydraulic system. This will allow for a relaxation on the specification of the final hydraulic system.
Offshore trials are often fraught with delays and technical problems. Having the right vessel at the right time and under the desired environmental conditions can be problematic to say the least. The APCS trials followed in this pattern although a good deal of operational experience with the APCS in the field was gained.
41

0
APCS Trials MV ARCTIC KALVIC
An
gle
(de
g)
25
15
5
-5
-15
-25
(Cable Luf f A ngle Deg)
Cable Slew A ngle (Deg)
10 20 30 40 50 60 70 80 90 100
Time (sec)
Fig.1.20 Time history of luff and slew angles of the hoist wire – first trial. (APCS was ramped on at t = 30s and ramped off at t = 80s. Drastic reductions in these angles
can be seen when the control is active.)
42

-5
5
15
25
0
lew
APCS Trials MV TYPHOON
-25
-15
10 20 30 40 50 60 70 80 90 100
Tim e (sec)
An
gle
(de
g)
Cable Luf f A ngle (Deg)
Cable S A ngle (Deg)
Fig.1.21 Time history of luff and slew angles of the hoist wire – second trial with sub-optimal control. (APCS was ramped on at t = 10s and ramped off at t = 60s. Drastic reductions in these
angles can be seen when the control is active.)
43

5. CONCLUSIONS
(a) The prototype system was shown to work on two typical offshore support vessels.
(b) From the results obtained it can be surmised that moving to a larger vessel which will have smaller and lower frequency motions would only improve the system performance.
(c) Even when sub-optimal actuators are used (as in trial 2), the system will still compensate for the pendulation motions. This allows for a relaxation in the specification of the hydraulic system and reduces structural loads on the crane.
(d) For commercialisation of APCS refinement of the instrumentation system and a more robust design of power pack will be required. Furthermore, reengineering of the safety-critical elements of system will be necessary.
(e) The prototype has attracted high level of interest from all sectors of offshore industry.
44

APPENDIX A
RESULTS OF OPEN AND CLOSED LOOP TESTS ON CABLE-BODY SYSTEM
45

6
Tro
lley
abs
(cen
tim
etre
s)
Tro
lley
x (
cen
tim
etre
s )
Cab
le x
( c
enti
met
res
) C
able
an
gle
( d
egre
es )
E
xcit
atio
n (
cen
tim
etre
s )
4
2
0
-2
-4
-6
0 10 20 30 40 50 60 70 80
Time ( seconds )
10
5
0
-5
-10
0 10 20 30 40 50 60 70 80
Time ( seconds )
10
5
0
-5
-10
0 10 20 30 40 50 60 70 80
Time ( seconds )
6
4
2
0
-2
-4
-6
0 10 20 30 40 50 60 70 80
Time ( seconds )
6
4
2
0
-2
-4
-6
0 10 20 30 40 50 60 70 80
Time ( seconds )
Fig. A.1 Strategy 1 sinusoidal test F=0.1Hz
46

Tro
lley
Exc
itat
ion
( c
enti
met
res
abs(
cen
tim
etre
s)
Tro
lley
x (
cen
tim
etre
s )
Cab
le x
( c
enti
met
res
) C
able
an
gle
( d
egre
es )
)
6
4
2
0
-2
-4
-6
0 5 10 15 20 30 35 40 4525
Time ( seconds )
30
20
10
0
-10
-20
-30
0 5 10 15 20 25 30 35 40 45
Time ( seconds )
30
20
10
0
-10
-20
-30
0 5 10 15 25 30 35 40 4520
Time ( seconds )
8642
0-2-4
0 5 10 15 20 30 35 40 4525
Time ( seconds )
10
5
0
-5
-10
0 5 10 15 20 25 30 35 40 45
Time ( seconds )
Fig. A.2 Strategy 2 sinusoidal test F=0.6Hz
47
Tro
lley
abs(
cen
tim
etre
s)
Tro
lley
x (
cen
tim
etre
s )
Cab
le x
( c
enti
met
res
) C
able
an
gle
( d
egre
es )
E
xcit
atio
n (
cen
tim
etre
s )
6
4
2
0
-2
-4
-6
0 5 10 15 20 25 30 35 40 45
Time ( seconds )
30
20
10
0
-10
-20
-30
0 5 10 20 25 30 35 40 4515
Time ( seconds )
30
20
10
0
-10
-20
-30
0 5 10 15 20 25 30 35 40 45
Time ( seconds )
10
5
0
-5
-10
0 5 10 20 25 30 35 40 4515
Time ( seconds )
10
5
0
-5
-10
0 5 10 20 25 30 35 40 4515
Time ( seconds )
Fig. A.3 Strategy 3 sinusoidal test F=0.9Hz
48

Tro
lley
abs(
cen
tim
etre
s)
Tro
lley
x (
cen
tim
etre
s )
Cab
le x
( c
enti
met
res
) C
able
an
gle
( d
egre
es )
E
xcit
atio
n (
cen
tim
etre
s )
10
5
0
-5
-10
0 10 20 30 40 50 60 70 80 90
Time ( seconds )
30
20
10
0
-10
-20
-30
0 10 20 30 40 50 60 70 80 90
Time ( seconds )
30
20
10
0
-10
-20
-30
0 10 20 30 40 50 60 70 80 90
Time ( seconds )
10
5
0
-5
-10
0 10 20 30 40 50 60 70 80 90
Time ( seconds )
15
10
5
0
-5
-10
-15
0 10 20 30 40 50 60 70 80 90
Time ( seconds )
Fig. A.4 Open loop random test Fc=0.5Hz
49

-6 -4 -2 0 2 4 6 8
0
Exc
itat
ion
( c
enti
met
res
)
10 20 30 40 50 60 70 80 90
-5
0
5
10
0
-10
10 20 30 40 50 60 70 80 90
Tro
lley
x (
cen
tim
etre
s )
Cab
le x
( c
enti
met
res
) C
able
an
gle
( d
egre
es )
Tro
lley
abs(
cen
tim
etre
s)
Time ( seconds )
45 35 25 15 5
-5-15-25-35-45
0 10 20 30 40 50 60 70 80 90
Time ( seconds )
45 35 25 15 5
-5-15-25-35-45
0 10 20 30 40 50 60 70 80 90
Time ( seconds )
Time ( seconds )
15
10
5
0
-5
-10
-15
0 10 20 30 40 50 60 70 80 90
Time ( seconds )
Fig. A.5 Open loop random test Fc=0.7Hz
50

Tro
lley
abs(
cen
tim
etre
s)
Tro
lley
x (
cen
tim
etre
s )
Cab
le x
( c
enti
met
res
) C
able
an
gle
( d
egre
es )
E
xcit
atio
n (
cen
tim
etre
s )
10
5
0
-5
-10
0 10 20 30 40 50 60 70 80 90
Time ( seconds )
10
5
0
-5
-10
0 10 20 30 40 50 60 70 80 90
Time ( seconds )
10
5
0
-5
-10
0 10 20 30 40 50 60 70 80 90
Time ( seconds )
15
10
5
0
-5
-10
-15
0 10 20 30 40 50 60 70 80 90
Time ( seconds )
15
10
5
0
-5
-10
-15
0 10 20 30 40 50 60 70 80 90
Time ( seconds )
Fig. A.6 Strategy 1 closed loop random test Fc=0.5Hz
51

Cab
le x
( c
enti
met
res
) C
able
an
gle
( d
egre
es )
Tro
lley
abs
(cen
tim
etre
s)
Tro
lley
x (
cen
tim
etre
s )
Time ( seconds )
453525155
-5 -15 0 10 20 30 40 50 60 70 80 90 -25 -35 -45
Time ( seconds )
453525155
-5 -15 0 10 20 30 40 50 60 70 80 90 -25 -35 -45
Time ( seconds )
15
10
5
0
-5
-10
-15
0 10 20 30 40 50 60 70 80 90
Time ( seconds )
15
10
5
0
-5
-10
-15
0 10 20 30 40 50 60 70 80 90
Time ( seconds )
Fig. A.7 Strategy 1 closed loop random test Fc=0.7Hz
52
-6 -4 -2 0 2 4 6 8
0
Exc
itat
ion
( c
enti
met
res
)
10 20 30 40 50 60 70 80 90

Tro
lley
x T
rolle
y ab
s(ce
nti
met
res)
(c
enti
met
res)
C
able
x (
cen
tim
etre
s )
Cab
le a
ng
le (
deg
rees
)
Exc
itat
ion
(cen
tim
etre
s)
10
5
0
-5
-10
0 10 20 30 40 50 60 70 80 90
Time ( seconds )
10
5
0
-5
-10
0 10 20 30 40 50 60 70 80 90
Time ( seconds )
10
5
0
-5
-10
0 10 20 30 40 50 60 70 80 90
Time ( seconds )
15
5
-5
-15
0 10 20 30 40 50 60 70 80 90
Time ( seconds )
15
10
5
0
-5
-10
-15
0 10 20 30 40 50 60 70 80 90
Time ( seconds )
Fig. A.8 Strategy 2 closed loop random test Fc=0.5Hz
53

Tro
lley
abs(
cen
tim
etre
s)
Tro
lley
x (
cen
tim
etre
s )
Cab
le x
( c
enti
met
res
) C
able
an
gle
( d
egre
es )
E
xcit
atio
n (
cen
tim
etre
s )
86420
-2-4-6
0 10 20 30 40 50 60 70 80 90
Time ( seconds )
10
5
0
-5
-10
0 10 20 30 40 50 60 70 80 90
Time ( seconds )
10
5
0
-5
-10
0 10 20 30 40 50 60 70 80 90
Time ( seconds )
15
10
5
0
-5
-10
-15
0 10 20 30 40 50 60 70 80 90
Time ( seconds )
15
10
5
0
-5
-10
-15
0 10 20 30 40 50 60 70 80 90
Time ( seconds )
Fig. A.9 Strategy 2 closed loop random test Fc=0.7Hz
54
Tro
lley
abs(
cen
tim
etre
s)
Tro
lley
x (
cen
tim
etre
s )
Cab
le x
( c
enti
met
res
) C
able
an
gle
( d
egre
es )
E
xcit
atio
n(c
enti
met
res) 10
5
0
-5
-10
0 10 20 30 40 50 60 70 80 90
Time ( seconds )
10
5
0
-5
-10
0 10 20 30 40 50 60 70 80 90
Time ( seconds )
10
5
0
-5
-10
0 10 20 30 40 50 60 70 80 90
Time ( seconds )
15
10
5
0
-5
-10
-15
0 10 20 30 40 50 60 70 80 90
Time ( seconds )
15
10
5
0
-5
-10
-15
0 10 20 30 40 50 60 70 80 90
Time ( seconds )
Fig. A.10 Strategy 3 closed loop random test Fc=0.5Hz
55

Tro
lley
abs(
cen
tim
etre
s)
Cab
le x
( c
enti
met
res
) T
rolle
y x
( ce
nti
met
res
) C
able
an
gle
( d
egre
es )
E
xcit
atio
n (
cen
tim
etre
s) 86420
-2-4-6
0 10 20 30 40 50 60 70 80 90
Time ( seconds )
10
5
0
-5
-10
0 10 20 30 40 50 60 70 80 90
Time ( seconds )
15
10
5
0
-5
-10
-15
0 10 20 30 40 50 60 70 80 90
Time ( seconds )
10
5
0
-5
-10
0 10 20 30 40 50 60 70 80 90
Time ( seconds )
15
10
5
0
-5
-10
-15
0 10 20 30 40 50 60 70 80 90
Time ( seconds )
Fig. A.11 Strategy 3 closed loop random test Fc=0.7Hz
56

APPENDIX B
RESULTS OF OPEN AND CLOSED LOOP TESTS ON SHIP BASED CRANE MODEL
57

40
50
60
70
80B
oo
m a
ng
le (
deg
) W
ave
(cm
) B
oo
m C
om
man
d (
deg
)R
oll
(deg
)C
able
an
gle
(d
eg)
0 10 20 30 40 50 60
Time (s)
605040302010
0 0 10 20 30 40 50 60
Time (s)
10
5
0 0
-5
-10
0 610 20 30 40 50
Time (s)
20
15
10
5
0 0-5 0 610 20 30 40 50
Time (s)
3
2
1
0
-1
-2
-3
0 6010 20 30 40 50
T im e (s)
Fig.B.1 Sinusoidal test F=0.6 Hz
58

40
50
60
70
80
Bo
om
an
gle
(d
eg)
Wav
e (c
m)
Bo
om
Co
mm
and
(d
eg)
Ro
ll (d
eg)
Cab
le a
ng
le (
deg
)
0 20 40 60 80 100 120 140
Time (s)
302520151050
0 20 40 60 80 100 120 140
Time (s)
10
5
0
-5
-10
0 100 12020 40 60 80 140
Time (s)
15
10
5
00 20 40 60 80 100 120 140
Time (s)
5
3
1
-1
-3
-5
0 100 120 14020 40 60 80
Time (s)
Fig.B.2 Closed loop random test Fc=0.7Hz, Hs=1m
59

40
50
60
70
80
Bo
om
an
gle
(d
eg)
Cab
le a
ng
le (
deg
)
0 20 40 60 80 100 120 140
Tim e (s)
252015105 0
0 20 40 60 80 100 120 140
Time (s)
-5
0
5
10
0 100 120Ro
ll (d
eg)
-10
20 40 60 80 140
Time (s)
0
5
10
15
0 100 120 140
Bo
om
Co
mm
and
(d
eg)
20 40 60 80
Time (s)
-5
-3
-1
1
3
5
0 100 120 14020 40 60 80
Wav
e (c
m)
Win
ch (
cm)
T ime (s)
80
60
40
20
00 20 40 60 80 100 120 140 160
Time (s)
Fig.B.3 Closed loop random test Fc=0.7Hz, Hs=1m, variable cable length
60

APPENDIX C
PHOTOGRAPHS OF PROTOTYPE SEA TRIALS
61

FIRST TRIAL
Fig.C.1 Control cabin with the computer and monitoring equipment
Fig.C.2 MV Arctic Kalvic, the platform for first sea trial
62

Fig.C.3 Installation of hydraulic system on Arctic Kalvic
Fig.C.4 En route to the trial area
63

SECOND TRIAL
Fig.C.5 General arrangement of crane, power pack and control cabin on MV Typhoon
Fig.C.6 Trial in progress showing the knuckle boom arrangement
64

Fig.C.7 Trial in progress (stern quarter)
Fig.C.8 Trial in progress (port beam)
65

PART 2
CONTROL STRATEGY AND SYSTEM ROBUSTNESS

ii

TABLE OF CONTENTS
PART 2 CONTROL STRATEGY AND SYSTEM ROBUSTNESS
EXECUTIVE SUMMARY 1
1. INTRODUCTION 3
2. CONTROL SYSTEM AND ITS DESIGN 52.1 Control System 52.2 Operator Inputs 62.3 Reference Input 62.4 Crane Hydraulics 72.5 Cable 72.6 Undriven Pendulum 82.7 Driven Pendulum 92.8 Linearised Driven Pendulum – Slew & Luff Axes 102.9 Crane 112.10 Ship Motions 112.11 Control System Design 11
3. APCS IMPLEMENTATION 133.1 Data Processing 133.2 Control Computer 133.3 Sensors 13
4. CONCLUSIONS 17
PART 3 POTENTIAL APPLICATIONS 19
iii

iv

EXECUTIVE SUMMARY
The uncontrolled pendulation motions of crane loads during offshore lifting operations not only present hazard to personnel and equipment but are also one of the key factors in limiting the operational efficiency of many offshore activities. This problem has been ‘tolerated’ for decades simply for the lack of a practical solution.
A research team at the University of Strathclyde has developed a feasible solution called Active Pendulation Control System (APCS), and so far has been able to show its effectiveness in model scale and in prototype trials. This set of reports describes the work carried out so far on this concept and discusses its potential applications.
Two main projects have been undertaken: one aiming to establish the technical feasibility of the concept mainly through model test and the other attempting to demonstrate its feasibility in full scale prototype. The work undertaken during these projects are outlined and the key results are presented.
The control strategy and the process of designing the controller is described in some detail, and some issues, which arose during the implementation phase of the work, are discussed. An indication of the robustness of the control algorithm and the APCS mechanism is given at component level together with the potential application of the concept in offshore lifting and shipping industry.
1

2

1. INTRODUCTION
In Part 2 the control strategy and equipment is examined for their robustness when applied to practical operations. A detailed description of the control system and its implementation is presented, potential weaknesses in hardware and software are identified, and ways of improving the system reliability is considered.
3

4

2. CONTROL SYSTEM AND ITS DESIGN
2.1 CONTROL SYSTEM
The simplified outline of the control system for the luff axis is shown in Fig.2.1 below. For simplicity only the luff axis is shown as the slew control has a similar layout. Furthermore the details of the crane’s standard hydraulic control system are not shown nor the processing of the input/sensor signals. The slew and luff axes are uncoupled and thus the associated controls systems act independently of each other. This was predicted from both the experimental and simulation studies and borne out by the full-scale trials. Both controllers can thus be designed separately and if required, may be operated separately.
k2
T
input
+
-
k1+
+
.
T
gth
( )
³ refref II ,
.
dt
dT
p
Crane hydraulics
Cable luff,
Reference
Ship motions
Crane
Cable len
Cable
Operator inputs luff rate
Transform Geometry
Boom osition
Fig.2.1 Outline of control system (luff axis)
2.2 OPERATOR INPUTS
One of the underlying philosophies of the APCS system design is to ensure that the interface between the crane operator and the crane is essentially unaltered. The operator has effectively a luff rate control and a slew rate control to move the crane in the luff and slew directions as in traditional crane control systems. The operator will be unaware that the APCS system is operating except that uncontrolled pendulation of the load will be substantially reduced. When the APCS system is disabled i.e. control gains
5

k1 & k2 set to zero then the crane control system reverts to a ‘normal’ non - APCS condition.
To prevent over energetic motions of the crane and to minimise dynamic loading of the crane structure and wear and tear on the hydraulic components some processing of the operator signals is carried out to set limits on the maximum velocity and acceleration of the slew and luff axes in accordance with the crane design specifications. This is necessary since the primary crane functions will be transmitted via the fast acting APCS servo-valves even when the APCS is disabled. High speed of operation with minimal time delays is required for high performance of the control system but not required for the normal operator inputs. Hence the crane operator input commands are passed through a limiter.
Both the luff and slew rate inputs are integrated to produce luff and slew angles respectively which are ultimately used in the control system to generate the positional error signal for the luff and slew axes. The operator input processing scheme is shown below in Fig.2.2.
Raw operator Processed
inputs outputs
Slew rate Filter Slew Limiter
Luff rate Filter
Slew rate
Luff rate
Gain
Slew angle
Gain Luff Limiter
Luff angle
Slew Integrator
Luff Integrator
Fig.2.2 Operator input processing
2.3 REFERENCE INPUT
This input sets the overall goal of the specific axis and represents the average desired angle of the crane wire with respect to gravity. This is normally taken to be 00 for most practical purposes.
6

2.4 CRANE HYDRAULICS
This block represents the transfer function of the crane hydraulic system. For the purposes of this study and with the usual difficulty on obtaining a definitive transfer function, the response of the hydraulic system was modelled by a first order lag term as shown in Eq.5.
) ( t bx dy
� t ay ) ( (5) dt
where y is the output and x the commanded input to the hydraulic system. The constants a and b determine the gain and time lag of the system.
This type of model is appropriate to describe the dominant response of such systems. The amount of lag, or the magnitude of the system time constant, depends on the detail design of the hydraulic circuits and in particular, the performance of the hydraulic servo-valves employed to carry out the control action. Typical values of actuator lag (time constant 0.5-2.5 seconds) were employed during simulation studies, which seemed to suggest that the APCS was relatively insensitive to the amount of lag. Further evidence of this, during full-scale trials, whereby the gain of the hydraulic system was reduced to artificially generate a substantial lag showed that the system still performed adequately.
The nature of the response of the simulated hydraulic system is illustrated in Fig.2.3, which shows the step response of the hydraulic system with two values of time constant.
2.5 CABLE
The movement of the crane boom and the motions superimposed by the vessels motions combine to provide the excitation in the form of an external acceleration to the cable system. The cable is modelled by a linearised damped and driven pendulum. The motion is assumed to be small when the system is operating under APCS control.
This system consists of a mass m, which is attached to a spherical joint, representing the boom tip of the crane, via the host cable. For simplicity we show only the luff axis here. It is assumed that there is sufficient positive tension in the hoist wire such that the wire always remains completely straight.
7

Fig.2.3 Step response of hydraulic system
I
FR
y
FA
m
n
x
Cable length, l
G = mg
External acceleration
Mass x acceleration
Fig.2.4 Cable model
2.6 UNDRIVEN PENDULUM
The restoring force FR �G sinI �mg sin I
where m is the mass of the pendulum (crane load) and g is the acceleration due to gravity.
8

Under the assumptions that there is sufficient tension in the hoist wire such that the wire always remains completely straight, and that the cable length is fixed, the mass can only move on the circumference of a circle with radius l. The position of the mass along this circular trajectory is lI and the velocity and acceleration of the mass is therefore
. ..
lI l and I restively. Application of Newton’s laws gives:- ..
mlI� mg sinI 0 .
Dividing this by ml gives..
Z I 0 sinI 0 ,�
where the natural frequency Z g is a function of the length of the hoist cable. 0 l
For a ‘real’ pendulum or a hanging crane load there is always some energy dissipation due to damping, which can be represented as a force proportional to the velocity of the mass
.. .
Z IJ I 0 sinI 0� �
The term J represents the (usually small and unknown) viscous damping coefficient, which is a function of the cable manufacture, wire tension, aerodynamic drag and other factors.
2.7 DRIVEN PENDULUM
We can now apply a driving force, due to the accelerations of the vessel and the crane operator commands, which combine to cause the boom tip of the crane to move in some manner.
In the frame moving with the suspension point (i.e. in the crane coordinate system), the mass feels any applied acceleration as pseudo force :
.. ..
� x m 0 e � y m ey � mgeyFA x 0
where x0 and y0 are the coordinates of the suspension point (crane boom) and ex and ey
are unity vectors in the x (luff) and y (vertical) directions.
FA contains two terms – a term due to the gravitational acceleration, mgey and a term due to the acceleration of the suspension point in the luff and vertical directions. The restoring force FR is the projection of FA onto the unity vector
n cosI e � sin I ex y
This is tangential to a circle of radius equal to the cable length, l.
9

Thus, .. ..
(FR nFA � x m cosI � g m � y sin ) Io 0
The equation of motion for the damped, driven pendulum with arbitrary motion of its suspension points is, therefore,
.. .. ..
mlI� mg sinI � x m 0 cosI � my sinI0
Dividing by ml and adding the damping term as before,
.. .... .
Z IJ I 0 2 sinI �
x0 cosI � y
sinI� � 0
l l
2.8 LINEARISED DRIVEN PENDULUM – SLEW & LUFF AXES
For small angles cos I #1, sin I#I hence:-.. ..
.. .2� � 0 I Z IJ I �
x0 � y0 I
l l
We can extend this analysis to include the slew axis as shown in Fig.2.5.
T
mg
m
I
x
z
y
Cable length, l
Luff axis
Slew axis
Fig.2.5 Cable model for slew and luff axes
10

Using a similar approach, the dynamic equation for the slew axis is .. ..
2 00 l l
We can now combine these to give a concise form representing the motion of the cable system given arbitrary inputs. Note that the luff and slew axes are uncoupled.
TZ
º »¼
TI ª «¬
»»»»» ¼
�
� « « « « «¬
º »¼
TI ª «¬
º ª
T
y0
l( 0 � Z �
..ºªº..ª
� � �
J T » »¼ I
« «¬
» »¼ I
« «¬
�T..
�
º ª »¼
« ¬
T
x0 0 ..
z0
l
..
l
0
)
z y0
.
.
.. .
T J
1 0
0 1
2.9 CRANE
This block details the transfer function describing the mechanical components of the crane. The assumption is made that the stiffness of the crane is considerably higher than the rest of the closed loop system i.e. the poles of the mechanical system are some distance from the rest of the system. Due to this assumption the crane dynamics can be ignored and we are only concerned with the geometric transformation from the luff/slew motion of the hydraulic actuators to the motion of the boom tip.
2.10 SHIP MOTIONS
The motions of the vessel are measured using a proprietary motion reference system. The outputs of this system are transformed geometrically to provide estimates of the luff and slew motions, which are superimposed on the boom tip of the crane by the motion of the vessel.
2.11 CONTROL SYSTEM DESIGN
The design of the control system comprises determining the two control gains k1 and k2
for each of the luff and slew axes (see Fig.2.1). As previously mentioned the two axes are uncoupled so that the selection of the control gains for each axis are independent and may be carried our separately.
The control gains are determined via root locus methods. These methods allow the open loop response of the system, which is determined by the location of the system poles to be altered by the control action, which places the poles of the closed loop system in a more desirable position. The amount the poles of the system require to be moved is a direct reflection of the control effort required via the actuators. Setting a stringent requirement on the position of the closed loop poles (i.e. the nature of the closed loop response) to give a very desirable response may lead to the closed loop system demanding large control efforts.
11

Since the control effort in the APCS comes about by effectively moving the crane it is important that the control effort required is as small as possible to minimise wear and tear on the hydraulic system and to ensure that the control system does not call upon the crane to carry out large excursions.
A suitable performance/control effort balance was carried out via simulation of the system to determine a suitable response characteristic with acceptable levels of control action.
One further aspect, which required attention, is the fact that the model for the cable dynamics contained a term relating to the cable length. As the cable length is varied, it is necessary to continuously recalculate the control system gains so that the desired response is obtained over the range of operating conditions envisaged. The relationship between the cable length and the control gains was determined via simulation studies of the specific system. These values may be further refined during commissioning of the system whereby precise information on the response of the crane/hydraulic system and the cable damping is obtained.
12

3. APCS IMPLEMENTATION
In this section the hardware and software employed by the APCS is reviewed with particular emphasis on the reliability of the major system components.
3.1 DATA PROCESSING
An overview of the system implementation is shown in Figs 2.6 and 2.7. This shows the major data processing operations required for the normal APCS operation. A number of steps involve filtering and range checking to ensure that the control system produces a bounded set of outputs to prevent large control actions being called for by the system. Limits are placed on critical velocities and accelerations, which allows the system to either ‘back off’ the control action or to shut down if certain values are exceeded.
Once the APCS system has been shut down the crane returns to its normal non - APCS state in a similar manner to shutting down an autopilot or dynamic positioning system and returning manual control.
3.2 CONTROL COMPUTER
The APCS prototype was implemented using a PC based computer coupled to a proprietary industrial quality data acquisition & control system. The system may also be implemented using a standard PLC (Programmable Logic Controller) with suitable analogue I/O capability.
Modern industrial control computers come equipped with a number of hardware/software devices to ensure that they are operating within specified limits i.e. I/O range & calibration checking, watchdog timers etc.
The system is implemented using the philosophy of sampling input data steams in their raw or unprocessed form and carrying out as much as possible in the digital domain of the control computer. This ‘all eggs in one basket’ approach reduces the overall system component count and minimises the requirement to re-calibrate analogue sub-systems. This approach also allows for sensors to be replaced with minimum expertise.
Redundancy may be built in by having two computers running simultaneously although, as mentioned previously, loss of the control computer returns the crane to its ‘normal’ operating mode so this may not be required.
3.3 SENSORS
Signals from sensors are input to the system, and after suitable processing and combination with the operator inputs, command signals to the servo-valves for each of the slew, luff axes and boom axes are generated. The implementation scheme is shown in Figs 2.5 and 2.6.
There are a large number of signals from external sensors required for the operation of the APCS system. If we consider the requirements for some hardware redundancy then
13

this number can quickly become very large. The external sensors may be grouped as follows:
(a) Ship Motion Sensors
The current implementation of the APCS requires knowledge of the roll and pitch motions of the vessel. This was carried out, during the trials, by a standard motion reference unit (MRU). These devices have been incorporated in a number of marine systems involving dynamic positioning and ride control and navigation systems. This technology no longer requires gyro stabilised platforms and as a consequence of this has a higher degree of reliability.
Installation, positioning and alignment of these devices is a non-trivial task and the device must be protected from the effects of the environment and mechanical shock. For best results the MRU is mounted close to the ship motion centre, which is usually some distance form the crane that in turn necessitates long cable runs.
The added complexity of measuring the vessel motions is seen as a potential weakness in the system and ongoing work is being carried out to remove this requirement.
(b) Crane Sensors
A number of sensors are required on the crane to measure the boom, luff and slew angles. These are direct measurements (non inertial) devices and as such have a high degree of accuracy and reliability. They are based on either rotary encoder technology or linear (LVDT) technologies. Both these technologies have been well established in many industrial control and monitoring applications. Usually these devices come with a high degree of mechanical and environmental protection.
14

Slew
com
man
d
Luf
f co
mm
and
Cab
le s
lew
ang
le
Cab
le lu
ff a
ngle
Ship
rol
l
Ship
pitc
h
Cra
ne s
lew
ang
le
Boo
m c
omm
and
Cra
ne lu
ff a
ngle
Cra
ne b
oom
ang
le
Cab
le le
ngth
h
Analogue Inputs
Boo
m
cont
rolle
r (l
uff)
Cra
ne r
oll
Tra
nsfo
rmat
ion
Cra
ne p
itc
Dif
fere
ntia
tor
Cal
cula
te s
lew
ca
ble
angl
e
(re
lati
ve to
gr
avit
y)
Lim
iter
Fi
lter
& g
ain
Filte
r &
Gai
n R
ange
che
ck
Cal
cula
te lu
ff
cabl
e an
gle
(rel
ativ
e to
gr
avit
y)
Lim
iter
Fi
lter
& g
ain
Filte
r &
Gai
n R
ange
che
ck
Filte
r &
Gai
n R
ange
che
ck
Filte
r &
Gai
n R
ange
che
ck
Filte
r &
Gai
n R
ange
che
ck
Filte
r &
Gai
n R
ange
che
ck
Filte
r &
Gai
n R
ange
che
ck
Filte
r &
Gai
n R
ange
che
ck
Dif
fere
ntia
tor
Slew
co
ntro
ller
Dif
fere
ntia
tor
sche
dule
r
Inte
grat
or
Luf
f co
mm
and
Slew
com
man
d
Fig
.2.6
C
ontr
ol s
yste
m im
plem
enta
tion
15

Luff velocity
Boom velocity
Slew velocity
Velocity limiter Gain
Velocity limiter Gain
Velocity limiter Gain Boom velocity command
Luff velocity command
Slew velocity command
Ana
logu
e ou
tput
s
Command signals Command signals to from Fig. 5 servo valves
Fig.2.7 Control system implementation
(c) Cable Sensors
Three sensors are required to monitor the state of the cable system. One is used to measure the cable length, which is required for the controller gain settings, and to provide information to the APCS on the vertical position of the payload. This is achieved using an encoder or magnetic pickup on the winch drum of the crane. Once again these devices are now ‘industry standard’, indeed many offshore cranes will have this technology already installed while carrying out normal crane operations.
The other requirement is to measure the luff and slew angles of the cable relative to the crane. Once again the measurement technology is based on proven rotary or linear devices. These devices are incorporated into a gimbal arrangement attached to the crane boom.
The measurement system requires that the cable remain in tension so that the position of the crane load may be inferred from the angles of the hoist cable. Given the maximum accelerations of a typical vessel, in even large sea states, this assumption is valid when the crane load is in air.
Due to the increased damping of submerged bodies the APCS system is not usually required to operate in these circumstances. Although as long as the cable remains in tension the APCS will operate as normal with the payload submerged.
16

4. CONCLUSIONS
Systems of this degree of automatic control are becoming more common in offshore applications – in particular there are similarities with heave compensation, tension control systems and ride control systems.
Such systems are usually employed to carry out a specific or a narrow range of operational tasks as part of a larger dedicated system, for example, diving bell launch systems or drilling compensators. The APCS, on the other hand, is required to carry out a large number of different but ‘routine’ tasks using one of the most useful pieces of offshore equipment i.e. the offshore crane. This aspect places a particular burden on the operability and the perceived safety of the system deployment.
The APCS was successfully demonstrated under simulated operating conditions, which proved that the concept was realisable. The system was based on a four tonne crane, which incorporated high-speed servo-valves to drive the slew and luff control axes. While the slew control axis was realised by slewing the crane the luffing action was constrained to act over a smaller sub-boom, which removed the requirement to actuate the, normally high inertia, luffing axis of the crane. This was just one solution to providing suitable control action without moving the entire crane structure – other methods are currently under investigation.
The philosophy behind the APCS is to provide an upgrade path to existing cranes in the lifting range up to around 50 tonnes with minimal disruption to the existing crane controls. For larger lift capacities a detailed redesign would be envisaged. The system is designed for ‘every day’ lifting operations and not for the one-off heavy lifts, which are usually performed by large vessels, which can wait for the most favourable weather conditions.
Many of the components required to retrofit an existing crane are available as ‘off the shelf’ items with a proven track record in this type of harsh environment. The control system is designed such that large-scale pendulation motions of the load are attenuated while minimising the control effort required.
The APCS requires a large number of inputs from external sensors for the system operate correctly. This complexity is seen as a major drawback to the successful implementation of a practical system and steps to reduce the minimum required number of sensors are currently underway.
17

18

PART 3
POTENTIAL APPLICATIONS
19

The APCS idea has a very wide range of application areas, in fact wherever there is a need for weight handling through crane-like structures which are in motion. Nearly all of the applications can be realised through retrofitting and a minimum disturbance to the existing structures. Potential applications include the following:
a. Light-to-medium weight lifting in offshore industry
This was the initial area targeted by the APCS, with the main capacity of up to 50 tonnes. Such operations are the ‘bread and butter’ of ship-based lifting operations. Tasks include moving equipment around the deck, launching and retrieving ROV’s, handling subsea equipment and transferring cargo, both loose and unitised. Due to the frequent nature of these tasks they are often required to be carried out in unfavourable weather conditions giving rise to pendulation problems due to ship motions. Furthermore these operations are sometimes carried out by relatively small vessels which suffer from larger waveinduced motions.
Some of the objects handled by crane belonging to this category are very expensive items, such as ROV’s and subsea units, but, above all, the risk to personnel posed by the load swinging ‘out of control’ is significant. This operational hazard can be minimised or nullified through the application of the APCS.
b. Ship-to-ship cargo/personnel transfer
The most obvious situation of ship-to-ship cargo transfer takes place, for example, between a supply boat and an FPSO. The difficulty here is that both of the vessels involved in the operation undergo substantial motions. In this case it is not only the pendulation which presents hazards but also the relative motions of the vessels. The control problem becomes more complicated by the order of one more dimension. Fortunately, however, passive and active heave compensation systems for cranes which are reasonably effective do exist. To reduce risks in this type of operation it will be well worth considering the possibility of combining heave compensation with the APCS. The performance system requires a careful examination through time-domain simulation.
One of the subjects receiving much attention in Europe at present is the efficient and cleaner transportation network where shipping is given prominence as a vital part of the network. One problem that presents itself is the efficient intermodal cargo transfers. This will be mostly in the interfaces of ship-to-shore, shore-to-lorry or shore-to-train, but in some circumstances it could be between ship-to-ship, for example, between a crosschannel ferry and vessels of inland waterways. The idea of ship-to-ship APCS can also be applied in these cases.
c. Power-assisted, hand-guided weight handling
During the mustering work for the offshore trials of APCS it was discovered, almost by accident, that a relatively heavy load suspended from the APCS crane could be moved by applying a very small sideways force on the load. The prototype APCS was not
20

configured for this type of application, and it was not possible to demonstrate the APCS used in this way. However, the great potential for this application was highly exciting, as in this mode the idea can be used on land as well as offshore. It is thought that the range of hand-guided weight handling can be improved by incorporating the control of boom angle in some way. This remains to be examined more closely.
d. Life-boat and fast rescue craft handling
One of the major problems associated with rescue boat launching and recovery operations is the swinging, or pendulation, of the boat whilst being suspended from the davits. The uncontrolled motions of the swinging boat can present a risk of injury to personnel and hamper rescue operations in even moderate weather conditions.
It is true that passively damped handling system for rescue craft is in wide use in offshore industry. However, it can be shown that launching rescue craft from passenger vessels with their high freeboard and associated launch heights presents additional problems to those encountered by more conventional offshore handling operations.
A preliminary study was carried out to identify the potential problems associated with the traditional methods employed to overcome these handling difficulties and to investigate probable improvement in performance when the APCS idea is introduced to rescue craft handling in the form of Active Pendulation Controlled Davits (APCD).
While launching from a davit the main problem is the risk of impacting the rescue craft with the mother vessel. APCD proposed here will attempt to reduce the safety-critical transverse pendulation by employing ‘luffing control’. The system can be based on a conventional single point rescue craft davit with some minor modifications. A possible configuration is shown in Fig.3.1.
The study included a simple time-domain simulation with a number of scenarios involving various sizes of the vessel and freeboard for a number of typical seastates. The swinging of the rescue craft was studied for while launching and recovery is carried out. In all but one of the simulation runs the excessive pendulation and subsequent collisions of the rescue boat with the hull of the passenger vessel, while the APCD system is disabled, was quite evident.
Furthermore each of the vessels experienced a dangerous launch condition during the lowering phase. Once the APCD system is activated the pendulation is greatly reduced to such an extent that the initial separation between the rescue boat and the mother vessel is re-established. In all the tested cases the APCD system greatly reduced the swinging of the rescue boat to less than one metre. Fig.3.2 presents the performance of one case of the APCD compared to the freely swinging rescue craft. For a rescue craft of capacity 10 persons (total weight of 3.5 tonnes) the hydraulic power required for the pendulation control was estimated to be only about 20KW.
21

Fig.3.1 Proposed APCD for rescue boat handling.
0 100 200 300 400 500 600-5
0
5Vessel 3 W inch speed=30m/min Hs=4.5m
Rol
l (de
g)
0 100 200 300 400 500 600-2
0
2
4
Sw
ay (
m)
0 100 200 300 400 500 6000
10
20
30
Cab
el L
engt
h(m
)
0 100 200 300 400 500 600-20
0
20
Sep
arat
ion
(m)
Time (s)
o CONTROL OFF o CONTROL ON
Fig.3.2 A sample APCD simulation result
22

Printed and published by the Health and Safety ExecutiveC30 1/98
Printed and published by the Health and Safety Executive C0.06 07/04

ISBN 0-7176-2877-9
RR 250
78071 7 628773£25.00 9