research report 331 - health and safety executive · hse health & safety executive generic...
TRANSCRIPT

HSEHealth & Safety
Executive
Generic review of Offshore Division research in structural integrity 2000
Prepared by Forbes Engineering Ltd for the Health and Safety Executive 2005
RESEARCH REPORT 331

HSEHealth & Safety
Executive
Generic review of Offshore Division research in structural integrity 2000
Vanessa Forbes Forbes Engineering Limited
Haslemere Surrey
In order to prepare topic strategies for the focus of future structural integrity research efforts, it was considered necessary to take a look back at the research projects undertaken or sponsored by HSE OD. The aim was to create a clear picture to enable OD to identify what have been the main ‘drivers’ for structural integrity research. The aim was to identify where resources have been focused, how this has changed over the years, and to assess, where possible, the contribution of project results to offshore safety as a whole, and what has been achieved in identified subject areas.
This report and the work it describes were funded by the Health and Safety Executive (HSE). Its contents, including any opinions and/or conclusions expressed, are those of the authors alone and do not necessarily reflect HSE policy.
HSE BOOKS

© Crown copyright 2005
First published 2005
ISBN 0 7176 2987 2
All rights reserved. No part of this publication may bereproduced, stored in a retrieval system, or transmitted inany form or by any means (electronic, mechanical,photocopying, recording or otherwise) without the priorwritten permission of the copyright owner.
Applications for reproduction should be made in writing to: Licensing Division, Her Majesty's Stationery Office, St Clements House, 2-16 Colegate, Norwich NR3 1BQ or by e-mail to [email protected]
ii
___________________________________________________________________________________________________________________________________________________________________________________________ ______________
_________________________________________________________________________________________________________________________________________________________________________________________________________
Forbes Engineering Lii
TABLE OF CONTENTS
1. INTRODUCTION..................................................................................................11.1 Objectives .............................................................................................................................................11.2 Scope of work .......................................................................................................................................1
2. GATHERING & SCREENING OF DATA............................................................22.1 Information provided by RSU.............................................................................................................2
2.1.1 Project data.......................................................................................................................................22.1.2 OT project reports data ..................................................................................................................22.1.3 Project conclusions text .................................................................................................................2222
2.2 Initial assessment and screening of data........................................................................................32.2.1 Strategy areas ..................................................................................................................................32.2.2 Project costs .....................................................................................................................................52.2.3 Project start dates ............................................................................................................................6
3. QUANTITATIVE DATA EXTRACTION AND ASSESSMENT .......................... 83.1 Data extracted................................................................................................................................... 83.2 Graphical representations .............................................................................................................. 8
3.2.1 Key contractors identified for each strategy area .................................................................... 83.2.2 Project costs, with time, for each strategy area ........................................................................133.2.3 OT project reports produced for each strategy area................................................................18
4. DATA ANOMALIES.............................................................................................204.1 Project data from Herald................................................................................................................. 204.2 OT report information from Herald.............................................................................................. 204.3 Conclusion text from Herald.......................................................................................................... 20
5. KEY CONTRACTORS AND UNIVERSITIES ...................................................215.1 Key contractors ................................................................................................................................ 215.2 University details.............................................................................................................................. 215.3 University projects by strategy area............................................................................................. 225.4 University projects by project start date ...................................................................................... 23
6. TRENDS OBSERVED .......................................................................................246.1 Strategy area spend......................................................................................................................... 246.2 HSE and industry funding............................................................................................................... 246.3 Cost of projects ................................................................................................................................. 266.4 Contractors ....................................................................................................................................... 266.5 Universities ....................................................................................................................................... 286.6 OT project reports produced.......................................................................................................... 286.7 Post-project evaluation.................................................................................................................... 30
7. CONCLUDING REMARKS................................................................................30
iii

___________________________________________________________________________________________________________________________________________________________________________________________ ______________
_________________________________________________________________________________________________________________________________________________________________________________________________________
Forbes Engine-R01Rev2
LIST OF FIGURESFigure 1: Pie chart showing number of projects in each of the ten strategy areas ...........................................................4Figure 2: Pie chart showing cost to HSE of the projects in each of the ten strategy areas .............................................4Figure 3: Bar chart showing cost of the projects in each of the ten strategy areas .........................................................5Figure 4: Bar chart showing average cost of projects in each of the ten strategy areas .................................................6Figure 5: Bar chart showing cost to HSE / total project cost in each of the strategy areas ............................................6Figure 6: Bar chart showing cost to HSE and total cost against start date of project .....................................................7Figure 7: Pie chart of main contractors for area A = ageing (Total cost to HSE ~£4.2million).......................................8Figure 8: Pie chart of main contractors for area C=components (Total cost to HSE ~£12.3 million).............................9Figure 9: Pie chart of main contractors for area D=dissemination (Total cost to HSE ~£1.1million).............................9Figure 10: Pie chart of main contractors for area E=extreme events (Total cost to HSE ~£5.4million)........................10Figure 11: Pie chart of main contractors for area F = foundations (Total cost to HSE ~£6.2million)...........................10Figure 12: Pie chart of main contractors for area I=standards/guidance (Total cost to HSE ~£3.2million)................11Figure 13: Pie chart of main contractors for area M = materials (Total cost to HSE ~£3.9million)...............................11Figure 14: Pie chart of main contractors for area O=metocean/response (Total cost to HSE ~£22million)................12Figure 15: Pie chart of main contractors for area R = risk (Total cost to HSE ~£2.1million)..........................................12Figure 16: Pie chart of main contractors for area S = systems (Total cost to HSE ~£3.1million)..................................13Figure 17: Bar chart showing project costs, by start date, for area A = ageing..............................................................13Figure 18: Bar chart showing project costs, by start date, for area C = components .....................................................14Figure 19: Bar chart showing project costs, by start date, for area D = dissemination..................................................14Figure 20: Bar chart showing project costs, by start date, for area E = extreme events .................................................15Figure 21: Bar chart showing project costs, by start date, for area F = foundations .....................................................15Figure 22: Bar chart showing project costs, by start date, for area I = standards and guidance .................................16Figure 23: Bar chart showing project costs, by start date, for area M = materials ..........................................................16Figure 24: Bar chart showing project costs, by start date, for area O = metocean/response........................................17Figure 25: Bar chart showing project costs, by start date, for area R = risk....................................................................17Figure 26: Bar chart showing project costs, by start date, for area S = systems ............................................................18Figure 27: Bar chart showing number of OT project reports produced, by strategy area.............................................19Figure 28: Bar chart showing cost to HSE of projects performed by universities, 1975-2000.......................................20Figure 29: Bar chart showing number of projects undertaken by universities, 1975-2000 ............................................22Figure 30: Bar chart showing average cost to HSE of projects by universities, 1975-2000...........................................22Figure 31: Bar chart showing cost to HSE and total project cost against start date of project for university projects
...........................................................................................................................................................................................23Figure 32: Bar chart showing cost to HSE and total project cost against start date of project, for university
projects .............................................................................................................................................................................23Figure 33: Bar chart showing cost to HSE/total project cost, annually from 1995-9 ......................................................24Figure 34: Cumulative cost to HSE against start date of project, for each strategy area...............................................25Figure 35: Bar chart showing number of open OT project reports produced, by report production year..................29Figure 36: Bar chart showing number of projects started and number of open OT project reports ...........................29
LIST OF TABLESTable 1: Cost and number of projects in each strategy area................................................................................................3Table 2: Percentage number and cost of projects in each of the ten strategy areas ........................................................3Table 3: Percent of projects that produced an open OT project report, by strategy area.............................................18Table 4: Closed projects with blank conclusions ................................................................................................................20Table 5: Closed projects with incomplete conclusions.......................................................................................................20Table 6: Top 20 projects by cost to HSE, sorted by strategy area....................................................................................26Table 7: Alphabetical list of contractors that appear in the top ten (for all strategy areas)..........................................27Table 8: Alphabetical list of all educational establishments (for all strategy areas)......................................................29
iv

___________________________________________________________________________________________________________________________________________________________________________________________ ______________
_________________________________________________________________________________________________________________________________________________________________________________________________________
Forbes Engineering Limited
1. INTRODUCTION
1.1 Objectives
In order to prepare topic strategies for the focus of future structural integrity research efforts, it was considered necessary to take a look back at the research projects undertaken or sponsored by HSE OD. The aim was to create a clear picture to enable OD to identify what have been the main ‘drivers’ for structural integrity research. The aim was to identify where resources have been focused, how this has changed over the years, and to assess, where possible, the contribution of project results to offshore safety as a whole, and what has been achieved in identified subject areas. The work to be carried out in this project is built up in six key OD strategy areas. These are:
1. The integrity of fixed installations 2. The integrity of jack-up installations 3. The integrity of floating installations 4. Metocean 5. Response to rare events 6. Materials
Aside from these strategy areas, a number of subject areas have been identified, which encompass aspects from across the strategy areas. These are:
R Risk (New technology) I Standards and guidance C Components S Systems A Ageing – inspection, reassessment, history, repairs etc. M Materials O Metocean/Response of structures F Foundations E Extreme events D Dissemination (effectiveness)
1.2 Scope of work
A quantitative assessment of the research projects from 1975 to date was performed. The initial work was to gather and screen the appropriate information. The Herald database contained information on the past projects, which total some 3000. To assess the relevance and importance of the outcome of each project it was necessary to determine what reports were issued from each project. An initial screening of the OT project reports was undertaken, in order to clarify the extent and detail of the information that is currently available.
A list of attributes was developed by which the outcome of a research project could be assessed in terms of impact of the project. For example, a measurable positive outcome could be inclusion into guidance. This forms the basis for a second phase will then be able to focus on such areas, and it is envisaged that identification of those factors that contribute to a ‘successful’ R&D project may be ascertained. The quantitative data relating to the project subject area, title, cost, start and end dates, were extracted from the database, where the data were manipulated and presented in a number of tabular and graphical outputs to enable trends and direction to be identified, against time. Specific areas where data had not been located, or where anomalies existed were identified.
Another aspect of this work was to extract from the data provided, the key contractors and universities for each of the ten subject areas, and how this changed with time, for each of the ten strategy areas.
1

___________________________________________________________________________________________________________________________________________________________________________________________ ______________
_________________________________________________________________________________________________________________________________________________________________________________________________________
Forbes Engineering
2. GATHERING & SCREENING OF DATA
2.1 Information provided by RSU
2.1.1 Project data
The initial work carried out was to gather and screen the appropriate information. The Herald database currently contains information on all the past projects (which total in excess of 3000 projects). Information was extracted and provided by RSU from the following programme areas:
• Administration and Dissemination
• Compliant/Floating & Self Elevating Structures
• Concrete Structures
• Engineering Hazards
• Evacuation and Survival
• Fire and Blast
• Fire and Explosion
• Fire, Explosion & Rela ted Hazards
• Fluid Loading
• Foundations and Piling
• Integrity Monitoring/NDT
• Marine and Helicopter Operations
• Marine Corrosion and Fouling
• Oceanography
• Pipelines and Risers
• Repairs and Pile/Sleeve Connections
• Risk and Reliability
• Risk Assessment
• Steel Structures
• Unknown
Information was provided in the form of a spreadsheet with the following column headings:
• Project number
• Project Title
• Contractor
• Cost to HSE
• Total Cost
• Start Date
• End Date
2.1.2 OT project reports data
In order to make an assessment of the relevance and importance of the outcome of each project; it is necessary to determine what reports have been issued from each project. This information is available in another part of the Herald database and an extract was provided by RSU for this project. For all projects the OT project reports issued were described in terms of OT report number and title.
2.1.3 Project conclusions text
Data were also provided by RSU in the form of a rich text file generated from the Herald for Windows Report Writer, which showed the project number and conclusions text, where available, for the above projects.
2

_________________________________________________________________________________________________________________________________________________________________________________________________________
F
2.2 Initial assessment and screening of data
2.2.1 Strategy areas
An initial assessment of the data revealed that of the projects with OD, over 1200 were to be included in this study of structural integrity R&D projects. Once the strategy areas had been assigned to each
of these projects, the following spread was found as in Table 2 and Figure 1:
Are a
Description Number of
projects
Cost to HSE
(£million )
Project cost
(£million)
HSE Cost Project
cost
A Ageing: inspection, reassessment, history, repairs. 120 4.2 20.3 21%
C Components 175 12.3 23.9 51%
D Dissemination (effectiveness) 18 1.1 1.6 73%
E Extreme events 138 5.4 13.7 39%
F Foundations 97 6.2 19.3 32%
I Standards and guidance 125 3.2 5.7 58%
M Materials 112 3.9 14.0 28%
O Metocean/Response of structures 257 22.0 43.4 51%
R Risk (New technology) 82 2.1 5.2 40%
S Systems 92 3.1 14.1 22%
Table 1: Cost and number of projects in each strategy area
Area Description Number of projects
Cost of projects
A Ageing: inspection, reassessment, history, repairs. 10% 7%
C Components 14% 19%
D Dissemination (effectiveness) 1% 2%
E Extreme events 11% 8%
F Foundations 8% 10%
I Standards and guidance 10% 5%
M Materials 9% 6%
O Metocean/Response of structures 22% 35%
R Risk (New technology) 7% 3%
S Systems 8% 5%
Table 2: Percentage number and cost of projects in each of the ten strategy areas
3

_________________________________________________________________________________________________________________________________________________________________________________________________________
Forbes Engineer
S A
C14%
M
8% 10%
R7%
Key: A = Ageing: inspection, reassessment, history, repairs C = Components D = Dissemination: including effectiveness E = Extreme events
O D F = Foundations 22% 1% I = Standards and guidance
M = Materials O = Metocean/response R = Risk (new technology) S = Systems
E 11%
F9% 8%
I10%
Figure 1: Pie chart showing number of projects in each of the ten strategy areas
It can be seen that the top three strategy areas in terms of numbers of projects were firstly, Metocean/Response of structures (22%), then Components (14%) and thirdly Extreme events (11%). The strategy areas with the lowest number of projects were the Dissemination (effectiveness) (1%) followed by Risk - New technology (7%). An initial assessment was also made for the ten strategy areas in terms of cost to HSE. In total, the structural integrity R&D projects accounted for almost £65 million in cost to HSE, since 1975. The spread of this cost across the ten strategy areas is shown in
Figure 2.
S AR 5% 7%
3%
C 19%
E 8%
F
Key: A = Ageing: inspection, reassessment, history, repairs C = Components D = Dissemination: including effectiveness E = Extreme events F = Foundations
O I = Standards and guidance35% D M = Materials
2% O = Metocean/response R = Risk (new technology) S = Systems
10% M I6% 5%
Figure 2: Pie chart showing cost to HSE of the projects in each of the ten strategy areas
4

_________________________________________________________________________________________________________________________________________________________________________________________________________
It can be seen that the top three strategy areas in terms of cost to HSE were firstly, Metocean/Response of structures (35%), then Components (19%) and thirdly Foundations (10%). The
Co
st (
£ t
ho
usa
nd
s)
strategy areas with the lowest number of projects were the Dissemination (effectiveness) (2%) followed by Risk - New technology (3%).
2.2.2 Project costs
From the bar chart in Figure 3, it can be seen that the strategy area with the highest cost to HSE has been that of Metocean/Response of structures, and the area with the least has been Dissemination.
Figure 3 shows the cost to HSE of the projects in each of the ten areas, whilst being compared to the total cost of the project (for example, a JIP). In terms of total project cost, the area with the most spend was again that of Metocean/Response of structures, and the area with the least total spend was
again Dissemination (effectiveness). Additional information is represented in Figure 4 which shows the average cost of projects in terms of HSE spend, for each of the ten strategy areas. The highest average is for Metocean/response and the lowest average is for standards and guidance.
Another way to represent the data is to show the HSE cost divided by the total project cost, as shown
in Figure 5. This can identify those strategy areas where the industry funded a significant part of costs. The strategy areas with the lowest HSE cost compared to total project cost was for Ageing (21%) and Systems (22%); whilst the strategy area with the highest contribution by HSE was Dissemination (73%) and Standards and Guidance (58%). The latter two are logical, and it is to be expected that HSE would provide almost a significant proportion of the funding for dissemination and standards/guidance R&D projects.
50,000
45,000
40,000
35,000
30,000
25,000
20,000
15,000
10,000
5,000
0 A C D E F I M O R S
Cost to HSE
Total project cost
Key: A = Ageing: inspection, reassessment, history, repairs C = Components D = Dissemination: including effectiveness E = Extreme events F = Foundations I = Standards and guidance M = Materials O = Metocean/response R = Risk (new technology) S = Systems
Strategy area
Figure 3: Bar chart showing cost of the projects in each of the ten strategy areas
5

_________________________________________________________________________________________________________________________________________________________________________________________________________
Forbes En
100
0
10
20
30
40
50
60
70
80
90
A C D E F I M O R S
Ave
rag
e p
roje
ct c
ost
(£
th
ou
san
ds)
Key: A = Ageing C = Components D = Dissemination E = Extreme events F = Foundations I = Standards/guidance M = Materials O = Metocean/response R = Risk S = Systems
Strategy area
Figure 4: Bar chart showing average cost of projects in each of the ten strategy areas
100%
0%
20%
40%
60%
80%
A C D E F I M O R S
Co
st
to H
SE
To
tal
pro
ject
co
st
Strategy area
Figure 5: Bar chart showing cost to HSE / total project cost in each of the strategy areas
2.2.3 Project start dates A preliminary assessment was also made concerning the project start date in conjunction with the
project cost. This was performed for five yearly intervals and is shown in Figure 6. It should be noted that for those projects where no start date information was available, that a ‘forced’ start date was included –based on preceding and subsequent projects. Projects after 1979 were not affected.
6

_________________________________________________________________________________________________________________________________________________________________________________________________________
Forbes En
40,000
35,000C
os
t o
f p
roje
ct
(£ t
ho
us
an
ds
)
30,000
25,000
20,000
15,000
10,000
5,000
0 1975-80 1980-85 1985-90 1990-95 1995-date
HSE cost
Total project cost
Start Date of Project
Figure 6: Bar chart showing cost to HSE and total cost against start date of project
It can be seen that the first period, 1975-1980 shows the greatest cost to HSE, which then decreases until 1995. For the period 1995-date, a slight increase is exhibited. The total project spend increased from the period 1975-80 to 1980-85. A slight decrease is shown for the next three periods, before a slight increase is exhibited in the period 1995-date. The relative changes in cost to HSE are more pronounced than the changes in total project cost for the periods studied.
7

_________________________________________________________________________________________________________________________________________________________________________________________________________
Forbes E
3. QUANTITATIVE DATA EXTRACTION AND ASSESSMENT
3.1 Data extracted
The initial task was to ascertain into which subject area category each of the projects could be placed. Once this had been performed, and checked by OD, the quantitative data relating to the project subject area, title, cost, start and end dates, were then able to be extracted from the spreadsheet provided by RSU. This was then manipulated and processed such that it could be presented in a number of tabular and graphical outputs in order to enable trends and direction to be identified, against time. Once the initial data extraction tasks had been performed, examples of the various tabular and graphical outputs were discussed with OD in order to ascertain the optimum and agreed method for presentation. Thus for each of the ten subject areas the following graphs were produced from a spreadsheet in Excel:
• Scatter plot: start date against project cost to HSE
• Scatter plot: start date against cumulative cost to HSE
• Pie chart: main contractors
• Bar chart: project costs by start date (HSE and total)
The data pertaining to the OT project reports and conclusions of the projects from Herald were input into MS Access. The following reports were generated in Access to provide information on:
• OT project reports – Project no, title, contractor, report no., title – by area
• Contractor information – by area
• Project conclusions – by area
3.2 Graphical representations
The following graphs have been produced from the data supplied by RSU.
3.2.1 Key contractors identified for each strategy area
AEA Technology Top Ten Contractors by Cost to HSE
AEA Technology University College London AEA Consultancy Services Wimpey
14%
EQE International Ltd4%
Technical Software Consultants Ltd
3%
Lloyd's Register of MSL Engineering Ltd
3%
TWI 3%
W S Atkins 3%
Other (49 contractors)
41%
University College London EQE International Ltd12% Technical Software Consultants Ltd Lloyd's Register of Shipping MSL Engineering Ltd TWI W S AtkinsAEA Consultancy
Services Other (49 contractors) 7%
Wimpey 7%
Shipping 3%
Figure 7: Pie chart of main contractors for area A = ageing (Total cost to HSE ~£4.2million)
8

_________________________________________________________________________________________________________________________________________________________________________________________________________
Forbes Engi
TWI 23%
BP Chemicals & BP Oil Intl Ltd
6% Wimpey
6%
AEA Consultancy Services
Top Ten Contractors by Cost to HSE
TWIOther (48 contractors) J P Kenny Technology Ltd
32% National Engineering Laboratory BP Chemicals & BP Oil Intl Ltd Wimpey AEA Consultancy Services University College London University of SurreyJ P Kenny British Steel Corporation/Technical
9% Technology Ltd
Lloyd's Register of Shipping Other (48 contractors)
Lloyd's Register2%
British Steel National Engineering
2% Laboratory8%
University of Surrey3%
University College London4%
5%
Figure 8: Pie chart of main contractors for area C=components (Total cost to HSE ~£12.3 million)
PAFA Consulting British Steel 2% Top Ten Contractors by Cost to HSE
Norwegian Petroleum Directorate
16%
NMI 7%
MAI Consultants 2%
Other (4 contractors)
<1%
Forbes Engineering Ltd 2%
Engineers 2%
MTD Ltd 3%
Lloyd's Register 2% CIRIA
Norwegian Petroleum Directorate NMI Institute of Oceanographic Sciences (DL) MTD Ltd MAI Consultants Forbes Engineering LtdInstitute of PAFA Consulting EngineersOceanographic
Sciences (DL) Stressprobe Ltd J P Kenny Technology Ltd4% Other (4 contractors)
CIRIA 62%
Figure 9: Pie chart of main contractors for area D=dissemination (Total cost to HSE
~£1.1million)
9

_________________________________________________________________________________________________________________________________________________________________________________________________________
Forbes Engineerin
Steel Construction Institute
12%
Other (58 contractors) 34%
Advanced Mechanics &
Engineering Ltd
Dovre Safetec Ltd 2%
Warrington Fire & Materials Centre
2%
BRE / Fire Research Station
British Gas Plc & R+D 23%
Technica Ltd 4%
Christian Michelsen Research
2%
Lloyd's Register of Shipping
2%
Top Ten Contractors by Cost to HSE
British Gas Plc & R+D NERC Steel Construction Institute Technica Ltd Advanced Mechanics & Engineering Ltd BRE / Fire Research Station Warrington Fire & Materials Centre Dovre Safetec Ltd Christian Michelsen Research
NERC Lloyd's Register of Shipping
14% Other (58 contractors)
2% 3%
Figure 10: Pie chart of main contractors for area E=extreme events (Total cost to HSE ~£5.4million)
Top Ten Contractors by Cost to HSE Other (58 contractors) British Gas Plc
17%
NERC
Technica Ltd
& R+D 30%
British Gas Plc & R+D NERCLloyd's Register of
Shipping Steel Construction Institute 2% Technica Ltd
Advanced Mechanics & Engineering Ltd Research
Christian Michelsen BRE / Fire Research Station
2% Warrington Fire & Materials Centre Dovre Safetec Ltd Dovre Safetec Ltd
3% Christian Michelsen Research Warrington Fire & Lloyd's Register of ShippingMaterials Centre Other (58 contractors)
4% BRE / Fire Research
Station4%
Advanced Mechanics & Engineering Ltd
4%
5% Steel Construction
24%Institute5%
Figure 11: Pie chart of main contractors for area F = foundations (Total cost to HSE
~£6.2million)
10
_________________________________________________________________________________________________________________________________________________________________________________________________________
Forbes Engi
Lloyd's Register of Shipping Top Ten Contractors by Cost to HSE
12% Lloyd's Register of Shipping
Other
3%
(49 contractors) W S Atkins Engineering Services
W S Atkins Engineering Advanced Mechanics & Engineering Ltd49% Services
Various8% University, Cranfield MSL Engineering Ltd
Advanced Mechanics & Offshore Certification Bureau Engineering Ltd TWI
6% Failure Control Limited Institute of Oceanographic Sciences (DL)
Various Other (49 contractors)4%
University, Cranfield 4%
MSL Engineering Ltd 4%
Offshore Certification TWI Bureau
4%Lloyd's Register
of Shipping Failure Control Limited
3% 3%
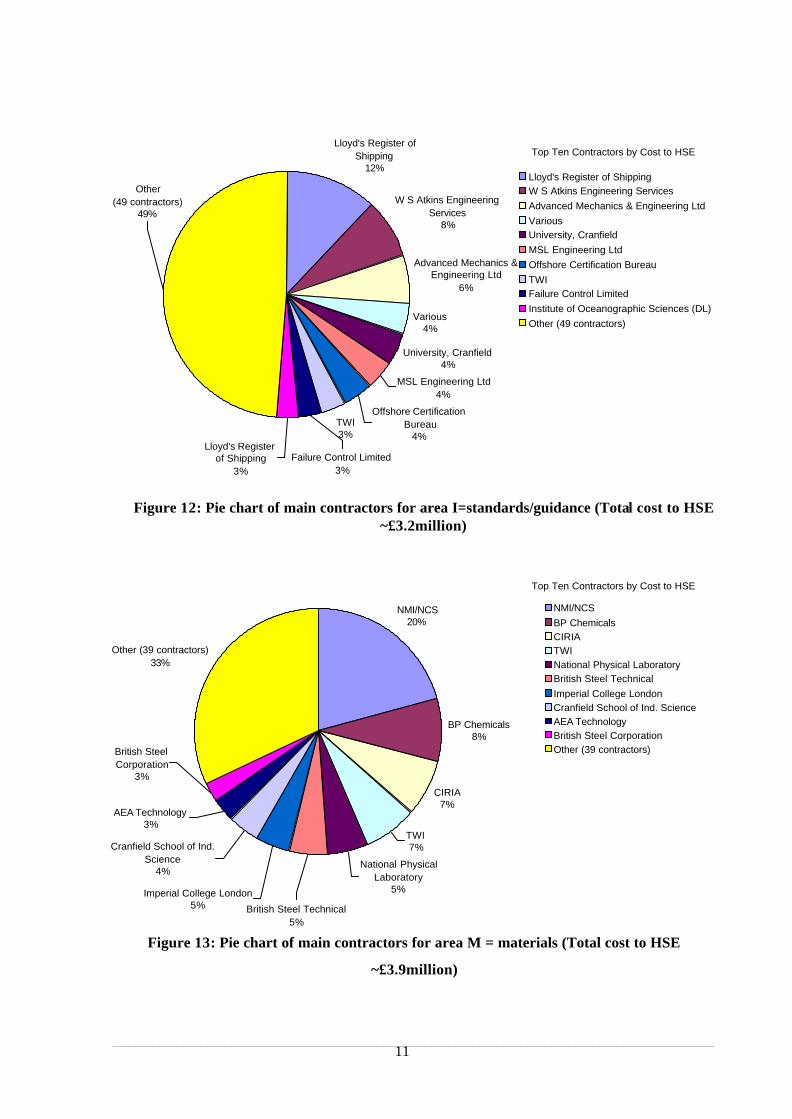
Figure 12: Pie chart of main contractors for area I=standards/guidance (Total cost to HSE ~£3.2million)
Top Ten Contractors by Cost to HSE
NMI/NCS 20%
TWI 7%
National Physical Laboratory
5%Imperial College London
NMI/NCS BP Chemicals CIRIA
Other (39 contractors) TWI33% National Physical Laboratory
British Steel Technical Imperial College London Cranfield School of Ind. Science AEA TechnologyBP Chemicals
8% British Steel Corporation Other (39 contractors)British Steel
Corporation3%
CIRIA 7%
AEA Technology 3%
Cranfield School of Ind. Science
4%
5% British Steel Technical 5%
Figure 13: Pie chart of main contractors for area M = materials (Total cost to HSE
~£3.9million)
11

_________________________________________________________________________________________________________________________________________________________________________________________________________
Forbes
Top Ten Contractors by Cost to HSE
Inst of Oceanographic Sciences (DL) NMI
The City University
Other (73 contractors)
NMI 10%UKOOA
British Maritime Technology
7%
NERC 5%
BP Chemicals & Oil Intl Ltd 2%
Meteorological Office 2%
University of Edinburgh 1%
18% Inst of Oceanographic Sciences (DL)
36% Dunstaffnage Marine Laboratory
1% UKOOA British Maritime Technology NERC BP Chemicals & Oil Intl Ltd Meteorological Office University of Edinburgh The City University Other (73 contractors)
9% Dunstaffnage Marine Laboratory
9%
Figure 14: Pie chart of main contractors for area O=metocean/response (Total cost to HSE ~£22million)
MSL Engineering Ltd Top Ten Contractors by Cost to HSE 10%
MSL Engineering Ltd Det Norske Veritas
Det Norske Veritas
W S Atkins 5%
Technica Ltd 4%
Civil Aviation Authority 4%
Principia Mechanica Ltd
MTD Ltd 3%
Lloyd's Register of Shipping
3%
J P Kenny Technology Ltd10% R M Consultants Ltd
W S Atkins Other Technica Ltd
(34 contractors) Civil Aviation Authority42% Principia Mechanica Ltd
Technology Ltd J P Kenny
MTD Ltd 9% Lloyd's Register of Shipping
Other (34 contractors)
R M Consultants Ltd 7%
3%
Figure 15: Pie chart of main contractors for area R = risk (Total cost to HSE ~£2.1million)
12

_________________________________________________________________________________________________________________________________________________________________________________________________________
Top Ten Contractors by Cost to HSE
AEA Consultancy Services Other BOMEL
(34 contractors)
BOMEL 17%Advanced Mechanics &
Engineering Ltd 5%
Det Norske Veritas 5%
Exxon 3%
UMIST 3%
W S Atkins 2%
Kockums Computer Systems
2%
BMT Fluid Mechanics Ltd
2%
18% AEA Consultancy Services
27%
CIRIA Advanced Mechanics & Engineering Ltd Det Norske Veritas Exxon UMIST W S Atkins Kockums Computer Systems BMT Fluid Mechanics Ltd Other (34 contractors)
CIRIA 16%
Figure 16: Pie chart of main contractors for area S = systems (Total cost to HSE ~£3.1million)
3.2.2 Project costs, with time, for each strategy area
0
2000
4000
6000
8000
10000
12000
14000
16000
18000
20000
Co
st £
(th
ou
san
ds)
Cost to HSE
Project Cost
1975-80 1980-85 1985-90 1990-95 1995-date Start Date
Figure 17: Bar chart showing project costs, by start date, for area A = ageing
13

_________________________________________________________________________________________________________________________________________________________________________________________________________
F
0
2000
4000
6000
8000
10000
12000
14000
16000
18000
20000 C
ost
£ (
tho
usa
nd
s)
Cost to HSE
Project cost
Co
st £
(th
ou
san
ds)
1975-80 1980-85 1985-90 1990-95 1995-date Start Date
Figure 18: Bar chart showing project costs, by start date, for area C = components
20000
18000 Cost to HSE
16000 Project cost
14000
12000
10000
8000
6000
4000
2000
0 1975-80 1980-85 1985-90 1990-95 1995-date
Start Date
Figure 19: Bar chart showing project costs, by start date, for area D = dissemination
14

_________________________________________________________________________________________________________________________________________________________________________________________________________
0
2000
4000
6000
8000
10000
12000
14000
16000
18000
20000 C
ost
£ (
tho
usa
nd
s)
Cost to HSE
Project cost
Co
st £
(th
ou
san
ds)
1975-80 1980-85 1985-90 1990-95 1995-date Start Date
Figure 20: Bar chart showing project costs, by start date, for area E = extreme events
20000
18000
16000
14000
12000
10000
8000
6000
4000
2000
0 1975-80 1980-85 1985-90 1990-95 1995-date
Cost to HSE
Project cost
Start Date
Figure 21: Bar chart showing project costs, by start date, for area F = foundations
15

_________________________________________________________________________________________________________________________________________________________________________________________________________
0
2000
4000
6000
8000
10000
12000
14000
16000
18000
20000 C
ost
£ (
tho
usa
nd
s)
Cost to HSE
Project cost
1975-80 1980-85 1985-90 1990-95 1995-date Start Date
Figure 22: Bar chart showing project costs, by start date, for area I = standards and guidance
0
2000
4000
6000
8000
10000
12000
14000
16000
18000
20000
Co
st £
(th
ou
san
ds)
Cost to HSE
Project cost
1975-80 1980-85 1985-90 1990-95 1995-date Start Date
Figure 23: Bar chart showing project costs, by start date, for area M = materials
16

_________________________________________________________________________________________________________________________________________________________________________________________________________
0
2000
4000
6000
8000
10000
12000
14000
16000
18000
20000 C
ost
£ (
tho
usa
nd
s)
Cost to HSE
Project cost
1975-80 1980-85 1985-90 1990-95 1995-date
Start Date
Figure 24: Bar chart showing project costs, by start date, for area O = metocean/response
0
2000
4000
6000
8000
10000
12000
14000
16000
18000
20000
Co
st £
(th
ou
san
ds)
Cost to HSE
Project cost
1975-80 1980-85 1985-90 1990-95 1995-date Start Date
Figure 25: Bar chart showing project costs, by start date, for area R = risk
17

_________________________________________________________________________________________________________________________________________________________________________________________________________
20000 C
ost
£ (
tho
usa
nd
s)
18000
16000
14000
12000
10000
8000
6000
4000
2000
0 1975-80 1980-85 1985-90 1990-95 1995-date
Cost to HSE
Project cost
Start Date
Figure 26: Bar chart showing project costs, by start date, for area S = systems
3.2.3 OT project reports produced for each strategy area
For each of the ten strategy areas, the percentage number of projects that produced open OT project
reports was derived, as shown in Table 3 below. Data pertaining to not openly available reports were not made available during this study, and were therefore not included. These confidential reports may have arisen from reports into incidents or accidents, or are internal HSE documents, or are reports which were incorporated into the formulation of the Guidance Notes in 1990. It should be noted that this interrogation included projects still currently ‘ongoing’. It can be seen that the strategy area with the highest percentage was Components (34%) and the area with the lowest was Dissemination (6%).
In order to ascertain an overall picture of how many OT project reports are produced, the number of reports per project was derived, for each of the ten strategy areas. The results of this are shown in
Figure 27.
Area Description % projects produced OT project reports
A Ageing – inspection, reassessment, history, repairs etc. 30%
C Components 34%
D Dissemination (effectiveness) 6%
E Extreme events 21%
F Foundations 13%
I Standards and guidance 18%
M Materials 13%
O Metocean/Response of structures 18%
R Risk (New technology) 20%
S Systems 34%
Table 3: Percent of projects that produced an open OT project report, by strategy area (NB: Does not include OTN reports)
18

_________________________________________________________________________________________________________________________________________________________________________________________________________
Forbes Engi
66%
80%82%
88% 82%
87%
79%
94%
66% 70%
0%
10%
20%
30%
40%
50%
60%
70%
80%
90%
100% %
of
pro
jec
ts
Not openly available 1 report
2 reports 3 reports 4 or more reports
A C D E F I M O R S
Strategy area
Figure 27: Bar chart showing number of OT project reports produced, by strategy area
19

_________________________________________________________________________________________________________________________________________________________________________________________________________
Forbe
4. DATA ANOMALIES
4.1 Project data from Herald
Part of the scope of work included the identification of specific areas where data are missing, or where data anomalies exist. This was to enable the scope of the second phase to address these areas, and decide how best to move forward with the resources available.
Of the 1200 or so projects studied within this scope, there were a significant number whose data provided were incomplete as supplied by RSU from the Herald database.
Some 35 projects did not have a start or end date, and over 400 projects had no end date. This would imply either that they are unfinished, or that the data in Herald is missing. Some 85 projects had zeros entered into the fields for cost to HSE and total project cost. A total of 10 projects had no entries for both the cost to HSE and total project cost.
4.2 OT report information from Herald
A total of 1018 OT project reports were included in the data as supplied by RSU. These reports were OTH, OTI, OTO, OTM and OTR and did not include OTN. Of these, 30 reports had no project data (project number or title). The Access database was developed in order to link the OT data with the project details supplied earlier by RSU.
4.3 Conclusion text from Herald
Of the 1052 conclusion texts supplied by RSU, a total of 64 entries were blank and a further 100 had incomplete or inadequate conclusion entries (e.g. xxx, qwerty, or ttt). However, these conclusions did not relate to just the structural integrity projects subset, and as a result the Access database was therefore required in order to link the conclusions data with the relevant strategy area project information.
Table 4 and Table 5 show the project numbers that had blank conclusions and incomplete conclusions respectively.
62 692 1057 1753 2732 2888 2986 3034 3368 3475 3499 3538
3544 3550 3559 3611 3621 3733 3753 3798 3870
Table 4: Closed projects with blank conclusions
1047 2272 2328 2398 2445 2532 2709 2730 2757 2761 2792 2825
2885 2887 2896 2911 2921 2929 2940 2967 3000 3007 3015 3017
3019 3027 3031 3051 3084 3094 3095 3097 3104 3106 3108 3110
3118 3130 3134 3143 3146 3148 3153 3176 3191 3199 3200 3214
3218 3223 3226 3231 3241 3269 3279 3281 3285 3310 3311 3317
3335 3342 3353 3371 3385 3401 3406 3407 3413 3414 3415 3416
3425 3426 3457 3466 3469 3470 3485 3492 3503 3522 3540 3554
3570 3573 3574 3577 3579 3591 3595 3607 3627 3629 3632 3640
3678 3681 3692 3699
Table 5: Closed projects with incomplete conclusions
20
_________________________________________________________________________________________________________________________________________________________________________________________________________
Forbes E
5. KEY CONTRACTORS AND UNIVERSITIES
5.1 Key contractors
Another aspect of this work was to extract from the data provided, the key contractors and universities for each of the ten subject areas, and to assess, if possible, how this has changed with time. For each
of the ten strategy areas, the top ten contractors were identified, in terms of cost to HSE. Table 7 shows the alphabetical listing of the contractors that appeared in the top ten lists according to strategy areas. Those strategy areas that relate to each of the contractors are also shown. Contracts placed with educational establishments represent some 11% of the total HSE spend, and 12% of the number of projects placed by HSE.
5.2 University details
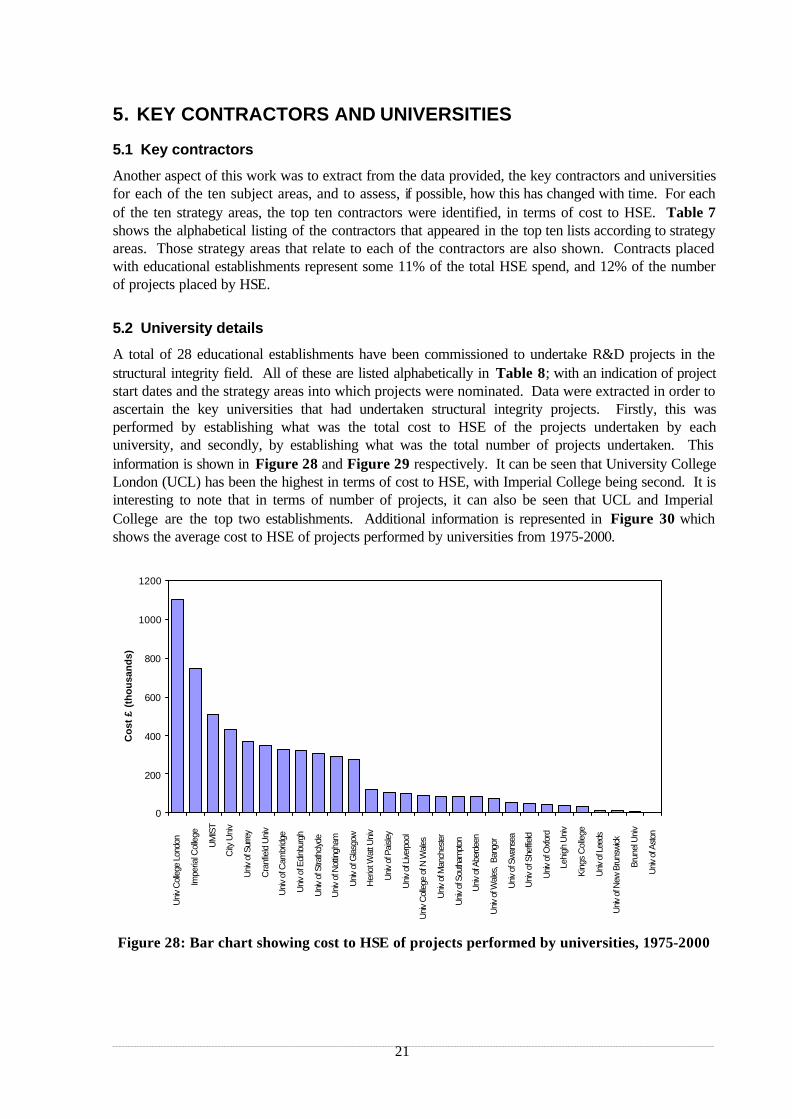
A total of 28 educational establishments have been commissioned to undertake R&D projects in the
structural integrity field. All of these are listed alphabetically in Table 8; with an indication of project start dates and the strategy areas into which projects were nominated. Data were extracted in order to ascertain the key universities that had undertaken structural integrity projects. Firstly, this was performed by establishing what was the total cost to HSE of the projects undertaken by each university, and secondly, by establishing what was the total number of projects undertaken. This
information is shown in Figure 28 and Figure 29 respectively. It can be seen that University College London (UCL) has been the highest in terms of cost to HSE, with Imperial College being second. It is interesting to note that in terms of number of projects, it can also be seen that UCL and Imperial
College are the top two establishments. Additional information is represented in Figure 30 which shows the average cost to HSE of projects performed by universities from 1975-2000.
0
200
400
600
800
1000
1200
Co
st £
(th
ou
san
ds)
Univ
Coll
ege
Lond
on
Impe
rial C
olle
ge
UMIS
T
City
Uni
v
Univ
of S
urre
y
Cra
nfie
ld U
niv
Uni
v of
Cam
brid
ge
Uni
v of
Edi
nbur
gh
Univ
of S
trath
clyde
Univ
of N
ottin
gham
Univ
of G
lasgo
w
Her
iot W
att U
niv
Univ
of P
aisley
Univ
of L
iverp
ool
Univ
Coll
ege
of N
Wale
s
Univ
of M
anch
este
r
Univ
of S
outh
ampt
on
Univ
of A
berd
een
Univ
of W
ales,
Bang
or
Univ
of S
wans
ea
Uni
v of
She
ffield
Univ
of O
xford
Lehi
gh U
niv
King
s C
olle
ge
Univ
of Le
eds
Univ
of N
ew B
runs
wick
Brun
el U
niv
Univ
of A
ston
Figure 28: Bar chart showing cost to HSE of projects performed by universities, 1975-2000
21

_________________________________________________________________________________________________________________________________________________________________________________________________________
F
Ave
rage
pro
ject
cos
t to
HS
E (
£ th
ousa
nds)
N
um
ber
of
pro
ject
s
120
100
80
60
40
20
0
30
25
20
15
10
5
0
Figure 30: Bar chart showing average cost to HSE of projects by universities, 1975-2000
5.3 University projects by strategy area
The cost to HSE and total cost of projects undertaken by universities was derived for each strategy
area, and is shown in the bar chart in Figure 31. It can be seen that the strategy area with the highest cost to HSE was that for components, followed by metocean/response projects. The strategy areas with the highest total costs were ageing, followed by metocean/response. [This is slightly different to the trend observed across all contractors, where metocean/response was the highest cost, and
components was second (see Figure 3)].
22
UM
IST
140
Her
iot W
att U
niv
Uni
v of
Pai
sley
Uni
v of
Man
ches
ter
Uni
v of
Wal
es,
Ban
gor
Uni
v of
Cam
brid
ge
Uni
v of
Edi
nbur
gh
City
Uni
v
Uni
v of
Sur
rey
Uni
v of
Not
tingh
am
Uni
v of
She
ffiel
d
Uni
v C
olle
ge o
f N W
ales
Uni
v C
olle
ge L
ondo
n
Uni
v of
Oxf
ord
Impe
rial
Col
lege
Uni
v of
Str
athc
lyde
Lehi
gh U
niv
Kin
gs C
olle
ge
Cra
nfie
ld U
niv
Uni
v of
Gla
sgow
Uni
v of
Sou
tham
pton
Uni
v of
Sw
anse
a
Uni
v of
Liv
erpo
ol
Uni
v of
Abe
rdee
n
Uni
v of
Lee
ds
Uni
v of
New
Bru
nsw
ick
Bru
nel U
niv
Uni
v of
Ast
on
Figure 29: Bar chart showing number of projects undertaken by universities, 1975-2000
Univ
Coll
ege
Lond
on
Impe
rial C
olle
ge
Cra
nfie
ld U
niv
UMIS
T
Univ
of G
lasgo
w
Univ
of S
trath
clyde
City
Uni
v
Univ
of A
berd
een
Univ
of L
iverp
ool
Univ
of S
urre
y
Uni
v of
Cam
brid
ge
Uni
v of
Edi
nbur
gh
Univ
of N
ottin
gham
Univ
of S
outh
ampt
on
Univ
of S
wans
ea
Univ
Coll
ege
of N
Wale
s
Brun
el U
niv
Her
iot W
att U
niv
King
s C
olle
ge
Lehi
gh U
niv
Univ
of A
ston
Univ
of Le
eds
Univ
of M
anch
este
r
Univ
of N
ew B
runs
wick
Univ
of O
xford
Univ
of P
aisley
Uni
v of
She
ffield
Univ
of W
ales,
Bang
or

_________________________________________________________________________________________________________________________________________________________________________________________________________
Forbe
0
1000
2000
3000
4000
5000
6000
7000
8000
Pro
ject
co
st (
£ t
ho
usa
nd
s)
HSE cost
Total project cost
A C D E F I M O R S Strategy area
Figure 31: Bar chart showing cost to HSE and total project cost against start date of project for university projects
The high spend on ageing related projects is accounted for by three key projects: two at UCL (P2341 and 2736) on Inspection reliability trials library in 1989, and Inter-calibration of Offshore NDT (ICON) in 1992, and the third at the University of Paisley (P538) for Assessment of NDT equipment in 1980.
5.4 University projects by project start date
When the start date of the projects undertaken at universities was studied it was found that the period in which HSE spent the most was 1985-90. However, in terms of total project cost, the period with the
most spend was 1990-95 by some considerable margin. This is shown in the bar chart in Figure 32.
This trend is different to that exhibited when all contractors are considered (see Figure 6) where all time periods exhibited total project spend that was not immeasurably different.
0
1000
2000
3000
4000
5000
6000
7000
8000
9000
Pro
ject
co
st (
£ t
ho
usa
nd
s)
HSE cost
Total project cost
1975-80 1980-85 1985-90 1990-95 1995-date
Start date of project
Figure 32: Bar chart showing cost to HSE and total project cost against start date of project, for university projects
23

_________________________________________________________________________________________________________________________________________________________________________________________________________
6. TRENDS OBSERVED
6.1 Strategy area spend
In order to examine the comparative costs of the different strategy areas, a cumulative plot was
produced, shown in Figure 34 overleaf. It can be clearly seen from this graph that the area with the highest spend has been that of metocean/response (O). For this area, there has been a steady increase in spend, with marked increases in the around 1985-88, and then a rising increase in spend since about 1990. The area with the next highest spend has been that of components (C). This shows a steady increase in spend since 1983-date. The area with the third highest spend is that of foundation (F). In 1985 there was a marked increase in spending, which was again shown in 1992-3. For the strategy areas of ageing (A), dissemination (D), standards/guidance (I), materials (M), risk (R) and systems (S) there has been a steady increase in spend since 1975 to date. However, for the strategy area of extreme events (E) there has been marked increases in spend since 1996.
6.2 HSE and industry funding
The strategy area with the highest industry contribution has been shown to be that of ageing (A), with systems (S) and materials (M) following. The areas with the lowest industry contribution have been
found to be standards/guidance (I) and dissemination (D) [see Figure 5].
The bar chart in Figure 33 shows the HSE cost divided by the total project cost for each of the ten strategy areas, annually since 1995. It can be seen that the proportion of industry funding has decreased in the recent years. For 1995-97 only one or two of the strategy areas were 100% HSE funded, whereas in 1998, three strategy areas were 100% HSE funded, and in 1999 a total of six areas were fully funded by HSE. The data for 2000 represents the first six months, and has therefore not been included.
120%
100%
80%
60%
40%
20%
0% 1995
Co
st
to H
SE
To
tal
pro
ject
co
st
A C D E F I O M R S
19991996 Start Date1997 1998
Figure 33: Bar chart showing cost to HSE/total project cost, annually from 1995-9
24

___________________________________________________________________________________________________________________________________________________________________________________________________________________________________________________________________________________________________________________________________
Forbes E
1974 1976 1978 1980 1982 1984 1986 1988 1990 1992 1994 1996 1998 2000 2002Start Date
Cu
mu
lati
ve c
ost
to
HS
E £
(m
illi
on
s)
A C D E F
I O M R S
£5m
£10
£25m
£20m
£15m
Figure 34: Cumulative cost to HSE against start date of project, for each strategy area
25

________________________________________________________________________________________________________________________________________________________________________________ _________________________
6.3 Cost of projects
A list was compiled of the most costly projects, and the top 20 are detailed in Table 6.
Area Project No.
Project Title
Contractor Start Date
End Date
Total Cost
Cost to HSE
C 149 UKOSRP - Tubular Joints (Test) TWI Jun-76 Jul-90 £1,989k £1,989k
C 152 UKOSRP - Large Joint Fatigue NEL Jun-76 Jul-90 £981k £981k
C 695 Guidelines: Submarine Pipeline Spans II J P Kenny Jun-82 Feb-88 £786k £786k
C 169 UKOSRP - Management AEA Consult.Serv Jun-76 Jan-91 £675k £675k
C 2532 Grouted Pile/Sleeve Connections BP Chemicals Sep-89 Dec-96 £1,453k £654k
E 2191 N Sea Seismicity Program 1986-8 NERC Jan-87 Mar-91 £760k £760k
F 2094 Large-Scale Pile Tests BP Oil Intl Limited Nov-85 Nov-90 £4,118k £1,161k
M 340 Hot Oil Pipeline Corrosion NMI/NCS May-78 Mar-86 £800k £800k
O 146 UKOOA Metocean Data Collection I UKOOA Jun-76 Feb-88 £3,718k £1,115k
O 691 Measurt of Currents/Topography NW Slope IOS Jul-83 Nov-87 £1,063k £1,063k
O 37 Marine Information & Advisory Services NERC Apr-76 n/k £2,025k £935k
O 692 UKOOA Metocean Data Collection II UKOOA Apr-82 n/k £2,876k £910k
O 90 Christchurch Bay Part 1- Procurement NMI May-76 n/k £906k £906k
O 497 Deep Water Current Measurt Rockall Trough IOS Jan-80 Feb-85 £805k £805k
O 495 Wave Climate in UK Waters IOS Jan-80 Nov-86 £796k £796k
O 717 Long Term Deep Water Current Meter
Measurement Dunstaffnage Lab Jun-82 Jul-89 £772k £772k
O 267 Christchurch Bay PT5 - New Experiment BMT Ltd Feb-77 May-86 £660k £660k
O 1039 Near Surface Current Measurements ‘84-6 Dunstaffnage Lab Mar-86 Jan-93 £627k £627k
O 496 Measurement/analysis Currents in Celtic Sea IOS Jan-80 n/k £584k £584k
S 680 UKOSRP II AEA Consult.Serv May-82 5-Jan-93 £3,250k £812k
Table 6: Top 20 projects by cost to HSE, sorted by strategy area (IOS = Institute of Oceanographic Sciences)
It can be seen that the most expensive projects in the structural integrity section were started between 1976 and 1989. Thus, this could be taken as an indication that the cost of individual projects has reduced over the years. The most expensive projects were the testing of large scale pipes, by BP started in 1985, and the collection of metocean data by UKOOA started in 1976 and continued as a second phase in 1982.
6.4 Contractors
For each of the strategy areas, a list of the ten contractors that had the highest cost to HSE was drawn up. From these lists, the following table was produced; to show the areas in which contractors were
identified, and to indicate the time period in which projects were commissioned, see Table 7. The list has been sorted alphabetically by contractor. It is interesting to note that some of those contractors that appear in the list have not had recent projects, and this will be due to the high cost to HSE of early projects.
Contractor Start A C D E F I M O R S
Advanced Mechanics & Engineering Ltd 1988-98 • • • AEA Consultancy Services / Technology 1975-98 • • • • BMT Fluid Mechanics Ltd 1989-99 • BOMEL 1985-97 • BP Chemicals & BP Oil Intl Ltd 1975-99 • • • • BRE / Fire Research Station 1982-95 •
26

________________________________________________________________________________________________________________________________________________________________________________ _________________________
Contractor Start A C D E F I M O R S
British Gas Plc & R+D 1986-99 • British Maritime Technology 1976-89 • British Steel Corporation/Technical 1976-98 • • Christian Michelsen Research 1988-98 • CIRIA 1975-85 • • • Civil Aviation Authority 1990-92 • Det Norske Veritas 1980-2000 • • Dovre Safetec Ltd 1995-2000 • Dunstaffnage Marine Laboratory 1980-86 • EQE International Ltd 1992-99 • Exxon 1972-89 • Failure Control Limited 1984-93 • Forbes Engineering Ltd 2000 • Fugro McCelland Ltd 1985-2000 • Imperial College London 1977-99 • Institute of Oceanographic Sciences (DL) 1975-93 • • • J P Kenny Technology Ltd 1980-86 • • • Kockums Computer Systems 1989 • Lloyd's Register of Shipping 1976-95 • • • • • • MAI Consultants 1993 • Meteorological Office 1984-2000 • MSL Engineering Ltd 1992-2000 • • • MTD Ltd 1987-95 • • National Engineering Laboratory 1976-91 • National Physical Laboratory 1976-83 • NERC 1976-87 • • • NGI 1982-93 • NMI 1976-84 • Norwegian Petroleum Directorate 1982 • Offshore Certification Bureau 1984-95 • Ove Arup & Partners 1977-93 • PAFA Consulting Engineers 1991-2000 • Principia Mechanica Ltd 1983 • R M Consultants Ltd 1991-98 • Steel Construction Institute 1989-2000 • Stressprobe Ltd 1980 • Taywood Engineering 1978-86 • Technica Ltd 1982-93 • • Technical Software Consultants Ltd 1995-2000 • TWI 1976-2000 • • • • UKOOA 1976-1982 • UMIST 1978-2000 • University, City 1980-88 • University College London 1977-98 • • University of Cambridge 1977-96 • University of Edinburgh 1981-96 • University of Surrey 1982-88 • University, Cranfield 1977-2000 • • W S Atkins 1976-99 • • • • Warrington Fire & Materials Centre 1989 • Wimpey 1977-90 • •
Table 7: Alphabetical list of contractors that appear in the top ten (for all strategy areas)
27

________________________________________________________________________________________________________________________________________________________________________________ _________________________
6.5 Universities
For all strategy areas, a complete list of the universitie s that had carried out projects for HSE was drawn up. The following table was produced; to show the areas in which universities were identified,
and to indicate the time period in which projects were commissioned, see Table 8. The list has been sorted alphabetically by university. Again, some of those universities that appear in the list have not had recent projects, and this will be due to the high cost to HSE of early projects.
Start date A C D E F I M O R S
Brunel University 1980 • City University 1980-98 • • • Cranfield University 1977-2000 • • • • Heriot Watt University 1999 • Imperial College 1977-2000 • • • • • Kings College 1978 • Lehigh University 1990 • UMIST 1978-2000 • • • University College London 1977-98 • • • • • University College of N Wales 1986-98 • University of Aberdeen 1980-95 • • • University of Aston 1984 • University of Cambridge 1977-96 • • • University of Edinburgh 1981-96 • • • University of Glasgow 1976-99 • • • • • • University of Leeds 1995 • University of Liverpool 1976-99 • • • University of Manchester 1990 • University of New Brunswick 1992 • University of Nottingham 1976-91 • University of Oxford 1994 • University of Paisley 1980 • University of Sheffield 1992 • University of Southampton 1976-87 • University of Strathclyde 1976-87 • • • • • University of Surrey 1982-88 • • University of Swansea 1997-98 • • University of Wales, Bangor 1996 •
Table 8: Alphabetical list of all educational establishments (for all strategy areas)
6.6 OT project reports produced
A key deliverable of structural integrity R&D projects has to be the OT project reports produced at the completion of the work. The number of OT project reports produced in each of the strategy areas has
been shown in Figure 27. It was shown that the strategy areas with the highest number of OT project reports were systems (S), components (C) and ageing (A). Those areas with the lowest number of OT project reports were foundations (F) and dissemination (D).
In order to examine how the number of OT project reports produced per year has changed since 1975,
Figure 35 was produced. It can be seen that the most reports were produced in 1998 and 1987 respectively. The overall trend, however, is that there is a decline in reports from 1977 to 1985, with a marked increase in 1987, before a gradual decline until 1993 when it would appear that no OT project reports were produced. The number then increases to a peak in 1998, followed by a subsequent fall in 1999. It should be noted that there were problems with printing in the early mid 1990s, which may
28

_________________________________________________________________________________________________________________________________________________________________________________________________________
account for the rapid decrease in reports produced. It should also be noted that the data supplied by RSU did not include OTN reports (which are internal HSE documents).
80
70
60
Nu
mb
er
of
OT
re
po
rts
50
40
30
20
10
0
1975
1976
1977
1978
1979
1980
1981
1982
1983
1984
1985
1986
1987
1988
1989
1990
1991
1992
1993
1994
1995
1996
1997
1998
1999
OT report production YEAR
Figure 35: Bar chart showing number of open OT project reports produced, by report production year
0
50
100
150
200
250
300
Nu
mb
er o
f P
roje
cts
and
op
en O
T p
roje
ct r
epo
rts
Number of projects started
Number of open OT reports produced
1975-80 1980-85 1985-90 1990-95 1995-date Date
Figure 36: Bar chart showing number of projects started and number of open OT project reports
29
________________________________________________________________________________________________________________________________________________________________________________ _________________________
6.7 Post-project evaluation
The information held in the Herald database provides a general picture for most projects in terms of conclusions. Overall, it would appear that less than 30% of projects have produced an openly available project report.
It is generally believed that a ‘successful’ R&D project can be viewed as one that has met the aims and objectives as set at the start of the work, and where the work has increased knowledge or understanding of specific technical issues. In addition, it can be where a project has uncovered new ideas or developed new methods for assessment, evaluation or testing. It is important that any R&D project is carried out with clear and logical approach with a methodical attitude, such as that included in the ROAMEF principle (Rationale, Objectives, Aim, Method, Evaluation, Follow-up). A project should be well communicated, not merely in terms of an internal HSE report, but where applicable, additional dissemination from external reports, articles, workshop contribution, or conference presentations may be appropriate.
An adequate summary of aims, findings and conclusions should also be prepared, either by the contractor, or by the HSE RO. This is currently to be input in the Herald database, but it would appear that some fields are perhaps not filled as fully as they should be.
30

________________________________________________________________________________________________________________________________________________________________________________ _________________________
For
7. CONCLUDING REMARKS The aim of this work was to provide a generic quantitative assessment of the research projects undertaken to date, in the field of structural integrity. Ten subject areas were identified and used within this work, which encompassed aspects from six key OD strategy areas. Information was obtained from RSU relating to 20 programme areas. The subject area with the highest HSE spend and the largest number of R&D projects was that of metocean/response (O) with components (C) second, and with extreme events (E) in third. Dissemination (D) showed the lowest HSE spend. This spend may be low because a significant proportion of OD dissemination is covered under individual projects.
An assessment was also made of industry contribution to the R&D projects. It was found that the strategy areas with the lowest HSE cost compared to total project cost were for Ageing (A) and Systems (S); whilst the strategy area with the highest contribution by HSE was Dissemination (D) and Standards and Guidance (I). The latter two are logical - it is to be expected that HSE would provide a significant proportion of the funding for dissemination and standards/guidance R&D projects. A study of the data revealed that the overall trend is that the proportion of industry contribution has decreased over recent years. This is likely to be due to the low oil price in the late 1990s, in combination with downsizing of companies, company mergers and streamlining.
A preliminary assessment was also made concerning the project start date in conjunction with the project cost. The first period, 1975-1980 shows the greatest cost to HSE, which then decreases until 1995. For the period 1995-date, a slight increase is exhibited. The total project spend increased from the period 1975-80 to 1980-85. A slight decrease is shown for the next three periods, before a slight increase is exhibited in the period 1995-date. The relative changes in cost to HSE are more pronounced than the changes in total project cost for the periods studied
The main contractors and the universities who have carried out the R&D projects on structural integrity have been identified, for each of the ten subject areas, and for the overall programme as a whole. Almost 60 contractors fall within the top ten list for all subject areas. A total of 28 universities undertook projects. Dates as to when the contractors and universities started projects has also been identified in order that the change, with time, can be deduced.
The number of OT project reports produced in each subject area was identified – however, this did not include OTN reports that are confidential to HSE. The subject areas with the highest number of OT project reports were systems (S), components (C) and ageing (A). Those areas with the lowest number of OT project reports were foundations (F) and dissemination (D). It was found that the most OT project reports were produced in 1998 and 1987 respectively. The overall trend, however, is that there is a decline in reports from 1977 to 1985, with a marked increase in 1987, before a gradual decline until 1993 when it would appear that no OT project reports were produced. The number then increases to a peak in 1998, followed by a subsequent fall in 1999. There were problems with printing in the early mid 1990s that may account for the rapid decrease in reports produced.
From the data supplied by RSU, there were fields where data was missing or where the entry was incomplete in the Herald database. Approximately 30% of projects had no end date specified, and 3% had no start or end dates. Some 8% had no HSE cost and no total project cost. From the OT data supplied, some 3% of the OT project reports had no project data (project number, project title, contractor). From the conclusions text as entered in Herald, 10% of the conclusions were incomplete or inadequate, with a further 2% having a blank field.
A brief discussion has been presented on the attributes that contribute to a ‘successful’ project. Such a project may be considered as one that has met the aims and objectives as set at the start of the work, and where the work has increased knowledge or understanding of specific technical issues.
31

Printed and published by the Health and Safety ExecutiveC30 1/98
Printed and published by the Health and Safety ExecutiveC0.06 03/05

9 78071 7 629879
ISBN 0-7176-2987-2
RR 331
£20.00

Generic re
view
of O
ffshore
Divisio
n re
search
in stru
ctura
l inte
grity 2
000
HS
E BO
OK
S