research report 634 effect of road seal type on resistance ... · effect of road seal type on...
TRANSCRIPT

Effect of road seal type on resistance to traffic stresses
December 2017 KL Neaylon, L Harrow and L van den Kerkhof Opus Research Opus International Consultants Ltd NZ Transport Agency research report 634 Contracted research organisation –Opus research

ISBN 978-1-98-851284-6 (electronic) ISSN 1173-3764 (electronic)
NZ Transport Agency Private Bag 6995, Wellington 6141, New Zealand Telephone 64 4 894 5400; facsimile 64 4 894 6100 [email protected] www.nzta.govt.nz
Neaylon, KL, L Harrow and L van den Kerkhof (2017) Effect of road seal type on resistance to traffic stresses. NZ Transport Agency research report 634. 55pp.
Opus International Consultants Ltd. was contracted by the NZ Transport Agency in 2016 to carry out this research.
This publication is copyright © NZ Transport Agency. This copyright work is licensed under the Creative Commons Attribution 4.0 International licence. You are free to copy, distribute
and adapt this work, as long as you attribute the work to the NZ Transport Agency and abide by the other licence terms. To view a copy of this licence, visit http://creativecommons.org/licenses/by/4.0/. While you are free to copy, distribute and adapt this work, we would appreciate you notifying us that you have done so. Notifications and enquiries about this work should be made to the Manager Research and Evaluation Programme Team, Research and Analytics Unit, NZ Transport Agency, at [email protected].
Keywords: chipseal; horizontal stress; surface wear; transverse shear stress; tyre-pavement contact stress

An important note for the reader
The NZ Transport Agency is a Crown entity established under the Land Transport Management Act 2003. The objective of the Agency is to undertake its functions in a way that contributes to an efficient, effective and safe land transport system in the public interest. Each year, the NZ Transport Agency funds innovative and relevant research that contributes to this objective.
The views expressed in this research report are the outcomes of the independent research, and should not be regarded as being the opinion or responsibility of the NZ Transport Agency. The material contained in the report should not be construed in any way as policy adopted by the NZ Transport Agency or indeed any agency of the NZ Government. The report may, however, be used by NZ Government agencies as a reference in the development of policy.
While research reports are believed to be correct at the time of their preparation, the NZ Transport Agency and agents involved in their preparation and publication do not accept any liability for use of the research. People using the research, whether directly or indirectly, should apply and rely on their own skill and judgement. They should not rely on the contents of the research reports in isolation from other sources of advice and information. If necessary, they should seek appropriate legal or other expert advice.

Acknowledgements
The authors would like to thank the steering group and the peer reviewers for their participation and assistance in this project.
Steering group members:
Robert Busuttil (NZTA)
Jeff Waters (Fulton Hogan)
Les Jones (Calibre Consulting)
Peer reviewers:
Bryan Pidwerbesky (Fulton Hogan)
Darcey Rogers (Road Science)
Thanks also Shaun Cook, Jeremy Wu and Steve Bagshaw (Opus) for their assistance in the development of the CAST test procedure.
Abbreviations and acronyms
AGD average greatest dimension of a chip sample
ALD average least dimension of a chip sample
CAST circular accelerated surfacing tester
CNC compiler numerical control
CSIR Council for Scientific and Industrial Research
EVA ethylene-vinyl acetate
HCV heavy commercial vehicle
NHTSA National Highway Traffic Safety Administration
OGPA open graded porous asphalt
PBD polybutadiene
PMB polymer modified binder
SAE Society of Automotive Engineers
SAMI strain alleviating membrane interlayer
SANRAL South African National Roads Agency Ltd
SBS styrene butadiene styrene
SMA stone mastic asphalt
5
Contents
Executive summary ................................................................................................................................................ 6 Abstract ...................................................................................................................................................................... 8 1 Introduction .................................................................................................................................................. 9 2 Literature Review .................................................................................................................................... 10
2.1 Tyre-pavement interaction ................................................................................... 10 2.1.1 Vertical Stress ......................................................................................... 12 2.1.2 Slip angle ................................................................................................ 14 2.1.3 Transverse shear stress ........................................................................... 15 2.1.4 Coulomb Friction ..................................................................................... 18 2.1.5 Summary of the tyre-pavement interaction .............................................. 18
2.2 Surfacing treatments ............................................................................................ 19 2.2.1 New Zealand ............................................................................................ 19 2.2.2 Australia.................................................................................................. 21 2.2.3 South Africa ............................................................................................ 22 2.2.4 Comparison of chip grades/sizes ............................................................. 23
2.3 Surfacings and their resistance to shear forces ..................................................... 25 2.3.1 Experimental experience ......................................................................... 25 2.3.2 Empirical experience ............................................................................... 26 2.3.3 Summary of guidelines for chip seals and their resistance to shear forces 32
3 Mechanisms contributing to seal damage .................................................................................... 34 4 Methodology to compare seal strength ......................................................................................... 39
4.1 The circular accelerated surfacing tester (CAST) ................................................... 39 5 Plan for future research........................................................................................................................ 44
5.1 Experimental definition of failure ......................................................................... 44 5.2 Horizontal shear stress ........................................................................................ 45 5.3 Chip seal treatment design .................................................................................. 45 5.4 Chip seal binder testing ....................................................................................... 46 5.5 Plan for stage 2 research ...................................................................................... 47
5.5.1 Tyre ........................................................................................................ 47 5.5.2 Chipseal treatment design ....................................................................... 47
6 Conclusions ............................................................................................................................................... 49 7 References .................................................................................................................................................. 50 Appendix A: Test procedure ............................................................................................................................ 53

6
Executive summary
This report details research carried out from 2016 to 2017 as the preparatory stage of a larger programme to understand how chipseals might be improved to withstand increases in horizontal shear forces imposed by traffic loadings. The research aimed to develop an understanding of the mechanisms and factors that lead to chip loss resulting from surface shear stresses, and develop a methodology for testing seal performance under realistic but controlled laboratory conditions.
A literature review was undertaken in three parts.
1 An examination of the tyre-pavement interaction showed the pavement design assumption that the tyre contact patch is circular with a uniform stress distribution is very much an oversimplification. It may have worked for pavement design at depth but is not appropriate for the pavement surfacing. The influence of the tyre slip angle and the tyres transverse shear stress is discussed in the review.
2 A review of chipseal treatment types was undertaken. Different surfacing treatments can resist different amounts of surface shear stress. Different countries may also have differing interpretations of treatments despite giving them the same name. New Zealand, Australia and South Africa were chosen for comparison because they have an historical reliance on chipseals, and therefore the longest developmental experience.
3 These surfacings and their resistance to traffic-induced shear forces were investigated, based on experimental experience, empirical experience and published guidelines.
A methodology is provided to compare seal strengths under simulated conditions.
There are risks involved in testing various treatments for surfacing failure on a public road network, because of the inability to control weather and loading variables. Because of this a laboratory simulation of traffic shear forces was conducted, where all variables could be held constant and only one measured change at a time could be made. This simulation was undertaken using the Opus circular accelerated surfacing tester, a purpose-built machine for testing materials generally used in road surfacing. It can be used to test a range of surfacing materials such as surfacing binders, surfacing aggregates and pavement marking materials.
A rotating pair of pneumatic tyres apply horizontal shear force as they travel around a circular track at up to 50 km/h. The short radius of the rotating arms ensures a high level of shear stress, or ‘scuffing’, was applied to the test seal surface to support the accelerated nature of the test. Four samples could be inserted into the track for simultaneous testing providing a constant environment for comparative testing.
The tester was housed in an insulated enclosure allowing testing to be undertaken in a temperature-controlled environment. The surface temperature and air temperature could be controlled separately to cover the range of temperatures experienced in the field (typically -7 to +55 °C).
Changes in the surface were measured using stereo photography (micro-photogrammetry) to generate a 3D image that was converted into a dataset of surface points (x, y, z coordinates), at up to 0.1 mm resolution (figure 4.2).
A test procedure was developed, with salient points appended.
Stage two of this research project will compare the shear resistance of single seals, racked-in seals and two-coat seals. For this testing the following is proposed:

Executive summary
7
Constants
• tyre type
• vertical loading
• tyre speed
• binder (180/200 pen bitumen)
• aggregate – grade 3 and grade 5, washed and dried to constant weight, sourced from a single quarry (Winstone Belmont), of known and repeatable sieve grading and known average least dimension and average greatest dimension of chip.
• seal design undertaken by one experienced person, and reviewed by two independent peer reviewers
• seal constructed by hand by one experienced person; the aggregate arranged as a seal would appear at day one, photographed and circulated to two peer reviewers for comment.
Variables
• treatment type:
– single seal (New Zealand grade 3) was nominated as the ‘control’ treatment for this and all future circular accelerated surfacing tester work)
– two-coat seal (New Zealand grades 3/5)
– racked-in (New Zealand grades 3/5).
• pavement temperature
– 0 °C
– 25 °C
– 45 °C (to be compatible with the dataset obtained for the performance-based bitumen study)
This combination produces a full factorial experimental matrix of 3*3 = 9 conditions, to be repeated three times.
Future work, as proposed, will provide the opportunity to put some science behind the various empirically derived rules of thumb.
If the mechanisms of shear failure in chipseals can be better understood, there is better chance of engineering an appropriate solution or combination of solutions to the growing traffic demands placed on cheap, thin, flexible chipseal surfacings.
Effect of road seal type on resistance to traffic stresses
8
Abstract
This report details research carried out from 2016 to 2017 as the preparatory stage of a larger programme to understand how chipseals may be improved to withstand increases in horizontal shear forces imposed by traffic loadings. The research aimed to develop an understanding of mechanisms and factors that lead to chip loss resulting from surface shear stresses, and to develop a methodology for testing seal performance under realistic but controlled laboratory conditions.
The report commences with a literature review to collate and examine existing data and experience on seal selection and chip loss processes from New Zealand and overseas. Physical mechanisms, site and vehicle factors that contribute to seal damage are also investigated. Finally, an experimental test method and plan is developed to quantitatively compare and evaluate the effect of seal and binder type on overall seal performance in the laboratory, but under realistic loading and temperature conditions. The experimental plan is to be undertaken as the next stage of this project.
1 Introduction
9
1 Introduction
Two-coat and racked-in seals are often selected on the assumption they will perform better under traffic stress conditions that may otherwise lead to chip loss in a simpler and less expensive single-coat seal. The presumed benefits gained by two-coat and racked-in seals are based largely on qualitative assessments, and there is a lack of real data to substantiate the supposed benefits and additional costs.
The research aimed to develop an understanding of mechanisms and factors that lead to chip loss resulting from surface shear stresses, and to develop a methodology for testing seal performance under realistic but controlled laboratory conditions.
This report commences with a literature review to collate and examine existing data and experience on seal selection and chip loss processes from New Zealand and overseas. Physical mechanisms, site and vehicle factors that contribute to seal damage are also investigated. Finally, an experimental test method and plan is developed to quantitively compare and evaluate the effect of seal and binder type on overall seal performance in the laboratory, but under realistic loading and temperature conditions. The experimental plan is to be undertaken as the next stage of this project

Effect of road seal type on resistance to traffic stresses
10
2 Literature review
2.1 Tyre-pavement interaction For many years it has been assumed that for pavement design purposes the ‘standard axle loading’ is approximated by a circular area that is uniformly loaded, with the contact stress at the pavement surface being uniform and equal to the tyre pressure (Austroads 2012). It is then the function of the pavement to disperse axle loads over a larger area, until ultimately the total load can be carried by the in-situ subgrade below the surface.
However, at the actual pavement surface, axle loadings are minutely focused to an area under each rib of the tyre tread, and therefore surfacing seals must be designed to withstand high contact stresses.
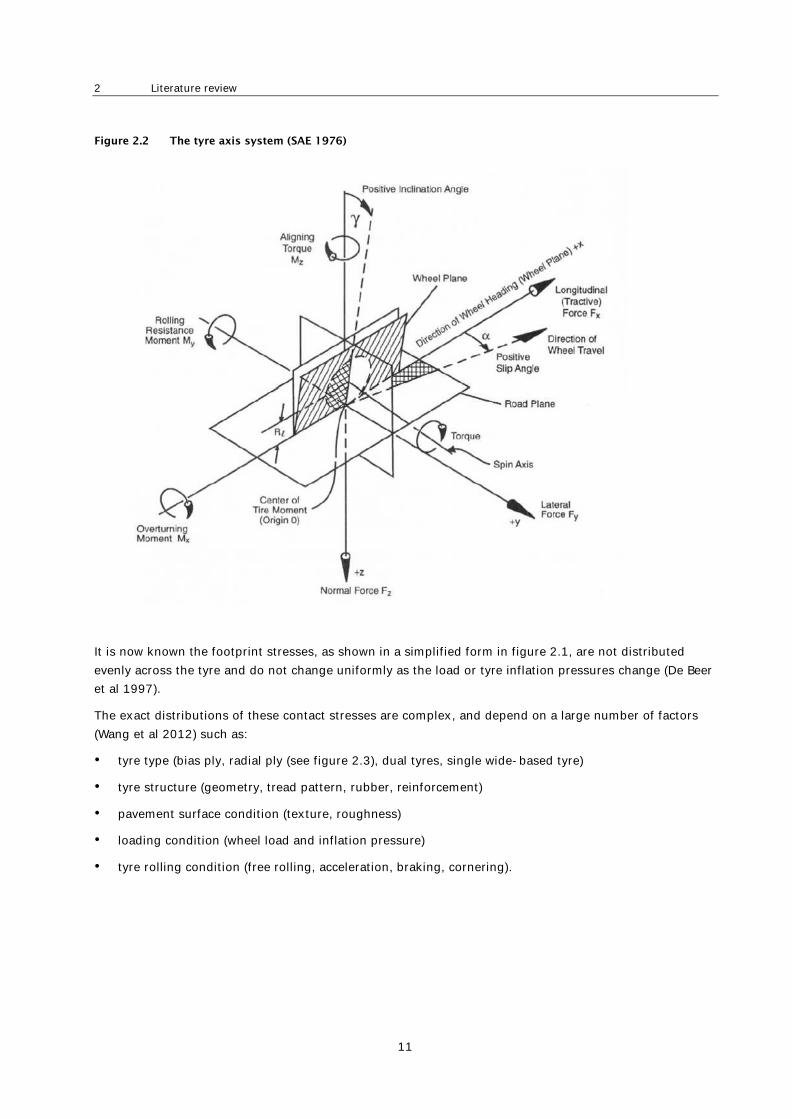
These surface contact stresses occur in three orthogonal directions as demonstrated in figure 2.1. This figure shows the International Tire Society footprint axis system, which is different from the Society of Automotive Engineers (SAE) tyre axis system (figure 2.2). The difference is that footprint behaviour has a fixed orientation in relation to the road surface, while the tyre axis system has a wheel-based orientation (NHTSA 2006).
Figure 2.1 Footprint axis system (after Pottinger 1992)
Note also in figure 2.2 the applied turning moments that are either absorbed or transmitted by the tyre; a proportion of these may also require a horizontal shear resistance contribution from the pavement.
2 Literature review
11
Figure 2.2 The tyre axis system (SAE 1976)
It is now known the footprint stresses, as shown in a simplified form in figure 2.1, are not distributed evenly across the tyre and do not change uniformly as the load or tyre inflation pressures change (De Beer et al 1997).
The exact distributions of these contact stresses are complex, and depend on a large number of factors (Wang et al 2012) such as:
• tyre type (bias ply, radial ply (see figure 2.3), dual tyres, single wide-based tyre)
• tyre structure (geometry, tread pattern, rubber, reinforcement)
• pavement surface condition (texture, roughness)
• loading condition (wheel load and inflation pressure)
• tyre rolling condition (free rolling, acceleration, braking, cornering).

Effect of road seal type on resistance to traffic stresses
12
Figure 2.3 Structural characteristics of bias ply and radial truck tyres (Myers et al 1999)
2.1.1 Vertical stress
A basic view of vertical stress distribution is shown in figure 2.4.
Figure 2.4 One dimensional contact stresses – cross section of tyre with low inflation
pressure under heavy load (Lippman 1986)
Actual tyre-pavement contact stresses can be measured using various experimental devices, for example the Council for Scientific and Industrial Research (CSIR) system shown in figure 2.5.
Figure 2.5 Flat bed stress- in- motion (SIM) device (De Beer et al 2011) (left) and flat bed stress- in- motion
device (De Beer 2012) (right)
During practical experiments it is generally difficult to consider all the variables listed earlier because of the large full-factorial matrix of tests required. Because of this, theoretical models based on finite element analysis are commonly constructed to deal with the different variables (Taramoeroa and de Pont 2008).
2 Literature review
13
With regard to tyre-pavement interaction, the two main types of stress that cause the greatest amounts of damage to pavements are vertical and transverse shear forces.
For pavement design, the damage (defined as vertical deflection) caused by vertical shear forces or vertical loading is the primary concern, while for pavement surfacings, however, it is more important to consider the effect of transverse shear force otherwise known as ‘scuffing’, particularly from heavy vehicle usage.
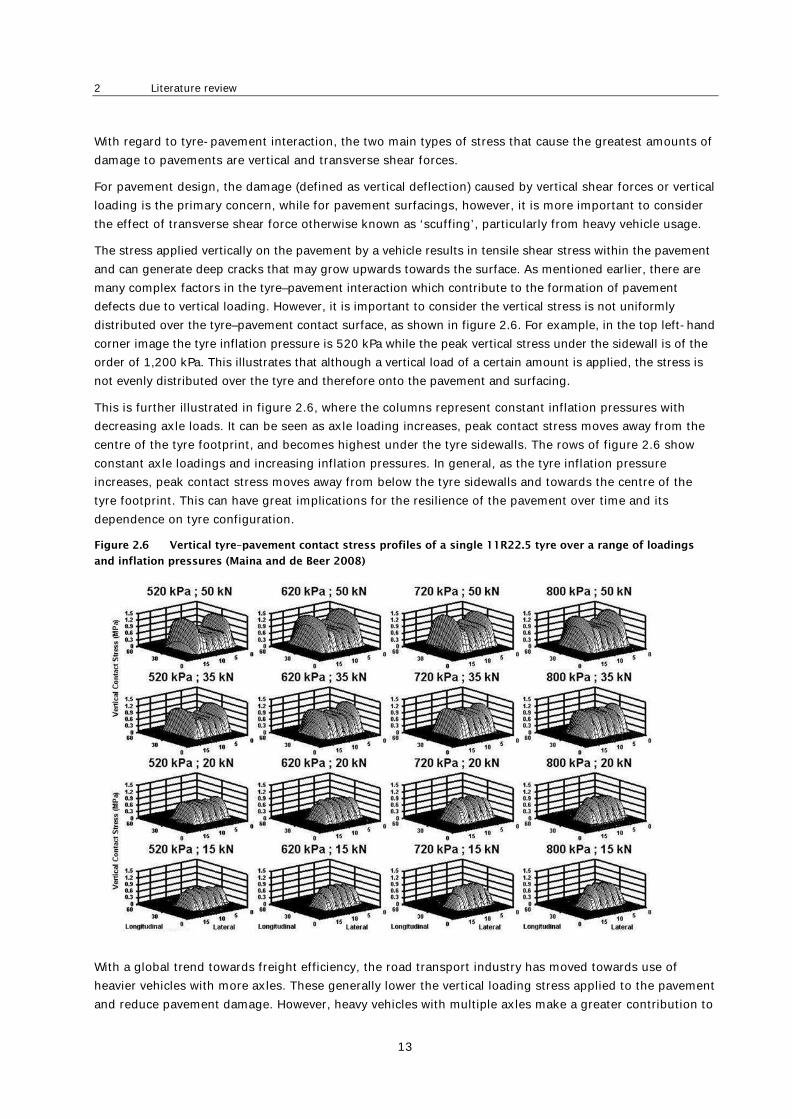
The stress applied vertically on the pavement by a vehicle results in tensile shear stress within the pavement and can generate deep cracks that may grow upwards towards the surface. As mentioned earlier, there are many complex factors in the tyre–pavement interaction which contribute to the formation of pavement defects due to vertical loading. However, it is important to consider the vertical stress is not uniformly distributed over the tyre–pavement contact surface, as shown in figure 2.6. For example, in the top left-hand corner image the tyre inflation pressure is 520 kPa while the peak vertical stress under the sidewall is of the order of 1,200 kPa. This illustrates that although a vertical load of a certain amount is applied, the stress is not evenly distributed over the tyre and therefore onto the pavement and surfacing.
This is further illustrated in figure 2.6, where the columns represent constant inflation pressures with decreasing axle loads. It can be seen as axle loading increases, peak contact stress moves away from the centre of the tyre footprint, and becomes highest under the tyre sidewalls. The rows of figure 2.6 show constant axle loadings and increasing inflation pressures. In general, as the tyre inflation pressure increases, peak contact stress moves away from below the tyre sidewalls and towards the centre of the tyre footprint. This can have great implications for the resilience of the pavement over time and its dependence on tyre configuration.
Figure 2.6 Vertical tyre–pavement contact stress profiles of a single 11R22.5 tyre over a range of loadings
and inflation pressures (Maina and de Beer 2008)
With a global trend towards freight efficiency, the road transport industry has moved towards use of heavier vehicles with more axles. These generally lower the vertical loading stress applied to the pavement and reduce pavement damage. However, heavy vehicles with multiple axles make a greater contribution to

Effect of road seal type on resistance to traffic stresses
14
transverse shear forces on the pavements. Scuffing force is the resulting force that exists when a heavy vehicle with multiple (and individually un-steered) axle groupings makes a tight turn at a low speed. This ultimately results in increased wear at roundabouts and intersections and makes up most of the pavement damage on these surfaces (Taramoeroa and de Pont 2008).
2.1.2 Slip angle
A straight-running free-rolling tyre footprint is shown in figure 2.7. Slip angles are generated when a tyre’s direction of motion is different from its heading direction, as shown in figure 2.8.
Figure 2.7 Glass plate of a footprint shape for a straight free rolling tyre (NHTSA 2006)
As the slip angle increases, the distortion of the footprint increases as shown in figure 2.8.
Figure 2.8 Glass plate of a footprint shape at a positive slip angle (NHTSA 2006)
Hamlat et al (2007) assert that the contact area of a tyre at a positive slip angle (eg figure 2.8) can be divided into two regions, a ‘proximate’ region (nearest; immediately before) positioned at the front, and a region of sliding at the back. The proximate area is in pure shear, while the rear area consists of shear plus sliding, as shown in figure 2.9.

2 Literature review
15
The boundary between the shear and sliding zones depends upon the:
• cornering rate
• tyre characteristics
• axle type (single, tandem or triple)
• axle position (front, rear).
Figure 2.9 Tyre contact area divided into two regions (Hamlat et al 2007)
This proposition is supported by the NHTSA (2006). Typically, for a tyre rolling straight ahead the fore-and-aft component of the shear force grows uniformly from zero at the leading edge of contact, reaching a maximum towards the trailing edge. Under braking, accelerating, camber and cornering loads, the slip patterns are more severe and more complex.
Because the slip angle arises from deformation in the tyre carcass and tread, different tyres may produce different slip angles under otherwise identical conditions.
2.1.3 Transverse shear stress
Vehicle horizontal shear forces are transferred to the pavement surface through tyres, and hence are influenced by specific mechanical properties and actions of tyres. Oblizajek and Veith (1986) reported that rubber shear stresses in the contact zone between the tyre and the road increase substantially at large slip angles. Although the wear of a tyre tread was their main interest, this wear is analogous to pavement wear. They used two experimental approaches to relate the shear induced wear on a tyre’s tread to specific tyre characteristics. They found tyres featuring high band (tread) stiffness and low carcass stiffness generate lower lateral shear stress levels. Furthermore, coupling of tread‐rubber stiffness and band flexural rigidity during the design of the tyre is important in determining the resultant level of shear stresses.
Myers et al (1999) measured tyre contact stresses for bias ply, radial (figure 2.3) and wide base radial truck tyres at various loads and inflation pressures. They found tyre structure had a greater impact on contact stresses than variations in load or inflation pressure, for any given tyre type.
Myers et al (1999); al Quadi and Yoo (2007); Wang and Al Quadi (2009) all link the relevance of transverse tractions (stresses) to the development of pavement surface distresses (surface cracking and near surface rutting).

Effect of road seal type on resistance to traffic stresses
16
Hernandez (2015) undertook experimental work using de Beer’s stress-in-motion device and a coordinate system shown in figure 2.10. This footprint coordinate system is the same as that adopted by the NHTSA (2006), with the X direction being positive in the direction of the tyre’s trajectory velocity.
Figure 2.10 Hernandez (2015) also used the Tire Society footprint axis system
Hernandez’ study was focused on truck tyres only, and compared a conventional dual tyre assembly with a wide base tyre. As the tyres were travelling in a straight line, longitudinal stresses were only applied by the tyre torque during acceleration. He found the longitudinal stresses (X direction) also varied according to the location of the tread’s rib. When the rib was at the edge of the tyre, the stress distribution had three peaks: two negative and one positive. If the rib was not an edge one, the negative peak at the tyre’s end vanished leaving only two peaks: one positive and one negative (figure 2.11).
Figure 2.11 Typical tyre rib variation of contact stresses (Hernandez 2015)
Al-Qadi and Yoo (2007) believe horizontal tangential stresses are the result of the inward pressure of tyres and the resistance to movement by surface contact. Testing a rolling truck tyre in a straight line and presumably with no acceleration applied, they concluded transverse shear stresses can be as high as 52% of the compressive vertical stresses. Similarly Hernandez (2015) also concluded transverse stresses were as high as 40% of the vertical pressure for wide based tyres, and 50% for normal dual tyre assembly.
Speed and temperature also influence the tyre–pavement contact area. Hernandez found longitudinal contact stresses were the most affected, and for a free-rolling tyre when tyre load and tyre inflation pressure were held constant, the influence of temperature was more significant than speed. Under finite element modelling, the contact area increased with temperature and decreased with speed. Also, the transverse contact stresses ranged in magnitude between the longitudinal and the vertical stresses.
2 Literature review
17
Cenek et al (2011) observed that in New Zealand chip loss on curves did not generally occur in the outer wheel path where the peak lateral force is greatest, but rather the inside wheel path (ie the right wheel path for a right-hand curve and the left wheel path for a left-hand curve). This is the opposite wheel path to where the peak lateral force occurs. They attributed this finding to the outside wheels being more highly loaded because of vehicle body roll, but without the wheels slipping.
Recent developments at the University of Illinois-Champaign (Shakiba et al 2016) include a library of software to simulate the complex thermo-viscoelastic–viscoplastic–viscodamage responses of the pavement to mechanical and environmental loads, together with a database of tyre contact areas and stresses obtained from tyre finite element simulations. The database includes tyre interface characteristics with pavements for various applied loads, tyre inflation pressures, vehicle speeds and scenarios of different rolling simulations. The system is known as pavement analysis using nonlinear damage
approach (PANDA), but we are not aware of the level of industry acceptance it has gained.
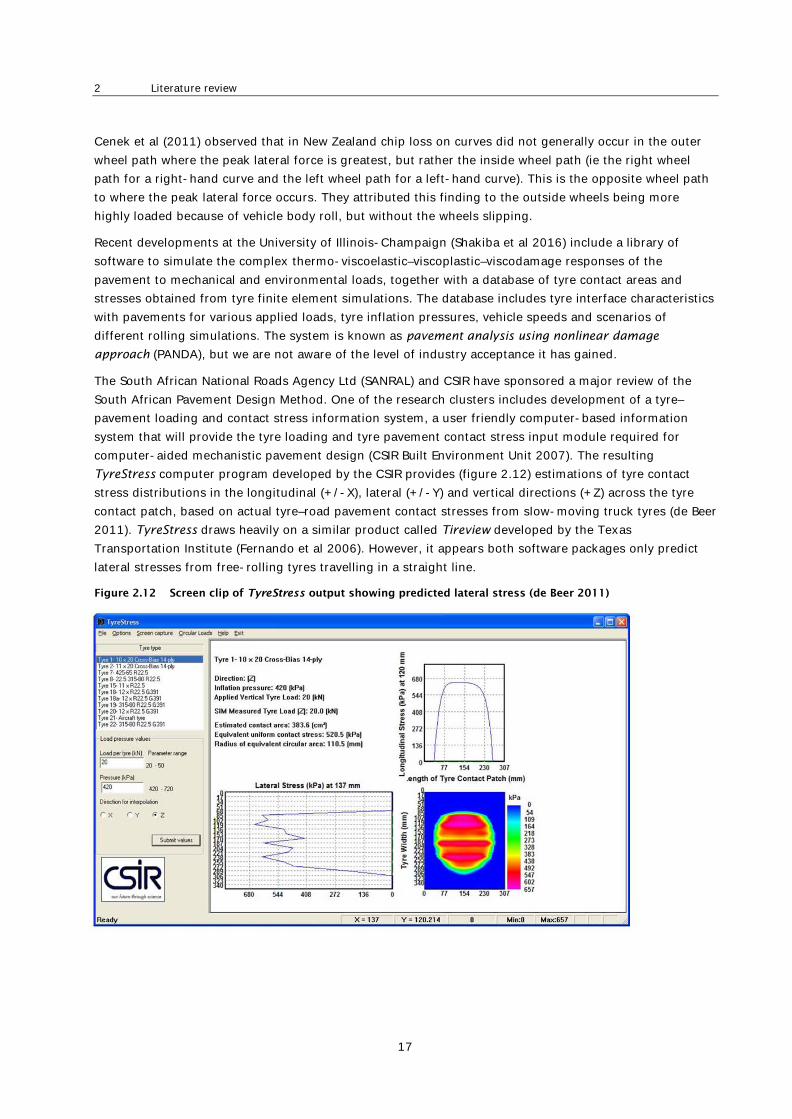
The South African National Roads Agency Ltd (SANRAL) and CSIR have sponsored a major review of the South African Pavement Design Method. One of the research clusters includes development of a tyre–pavement loading and contact stress information system, a user friendly computer-based information system that will provide the tyre loading and tyre pavement contact stress input module required for computer-aided mechanistic pavement design (CSIR Built Environment Unit 2007). The resulting TyreStress computer program developed by the CSIR provides (figure 2.12) estimations of tyre contact stress distributions in the longitudinal (+/-X), lateral (+/-Y) and vertical directions (+Z) across the tyre contact patch, based on actual tyre–road pavement contact stresses from slow-moving truck tyres (de Beer 2011). TyreStress draws heavily on a similar product called Tireview developed by the Texas Transportation Institute (Fernando et al 2006). However, it appears both software packages only predict lateral stresses from free-rolling tyres travelling in a straight line.
Figure 2.12 Screen clip of TyreStress output showing predicted lateral stress (de Beer 2011)

Effect of road seal type on resistance to traffic stresses
18
2.1.4 Coulomb friction
The classical approximation of the force of friction between two solid surfaces in shear is known as Coulomb friction. For a given tyre and horizontal pavement force the magnitude of the cornering or scuffing force increases with increasing slip angle and vertical load, but is limited to a value equal to the vertical load multiplied by the coefficient of friction between the tyre–pavement interface (Taramoeroa and de Pont 2008).
𝑓𝑓𝑦𝑦 ≤ 𝜇𝜇𝑦𝑦𝑦𝑦𝑓𝑓𝑧𝑧 (Equation 2.1)
where
𝑓𝑓𝑦𝑦 = tyre cornering force or pavement scuffing force
𝜇𝜇𝑦𝑦𝑦𝑦 = transverse tyre-pavement static friction coefficient
𝑓𝑓𝑧𝑧 = vertical force
Thus it can be seen the tyre scuffing force is directly proportional to the vertical load, as also validated experimentally by Taramoeroa and de Pont (2008).
2.1.5 Summary of the tyre–pavement interaction
In summary, the aspects of the tyre–pavement interaction that are important considerations when devising an experimental test methodology (when all other factors are held constant) include:
• Increasing axle loading will move the peak vertical stress from the centre of the tyre towards the sidewall (Maina and de Beer 2008).
• Increasing the axle loading will increase the scuffing force (Taramoeroa and du Pont 2008).
• Increasing inflation pressure will move the peak vertical stress from the sidewall towards the centre of the tyre (Maina and de Beer 2008).
• Transverse shear is linked to pavement surface distress (al Quadi and Yoo 2007; Hang and al Quadi 2009, Myers et al 1999).
• For a tyre with +ve slip angle, the magnitude of shear builds up in the leading edge of the contact area, and peaks within the trailing half of the contact area (Hamlat et al 2007; NHTSA 2006).
• Shear stress increases as slip angles increase (Oblizajek and Veith 1986).
• Different tyres produce different slip angles under otherwise identical conditions (NHTSA 2006).
• Shear stresses decrease as tread stiffness increases and carcass stiffness decreases (Oblizajek and Veith 1986).
• Tyre structure and design has a greater impact on contact stress than other variables (Myers et al 1999).
• The longitudinal stress measured at an exterior tread rib is different from that measured at an interior tread rib (Hernandez 2015).
• Under a straight, free-rolling tyre the magnitude of the transverse shear stresses are around 50% of the vertical stresses (Al-Quadi and Yoo 2007; Hernandez 2015).
• The contact area increases with temperature and decreases with speed (Hernandez 2015).
• The transverse contact stresses range in magnitude somewhere between the longitudinal and the vertical stresses (Hernandez 2015).
2 Literature review
19
2.2 Surfacing treatments Different surfacing treatments can resist different amounts of surface shear stress. Different countries may also have differing interpretations of treatments, despite giving them the same name.
These surfacing treatments are defined in section 2.2.1 for New Zealand, section 2.2.2 for Australia and section 2.2.3 for South Africa, before being analysed in more detail in section 2.3. These three countries were chosen because they have an historical reliance on chipseals, and therefore the longest developmental experience. The chipseal treatments adopted in countries such as Ireland, England, France, Iran and the USA are often variations/adaptations of the treatments of these main three countries.
2.2.1 New Zealand
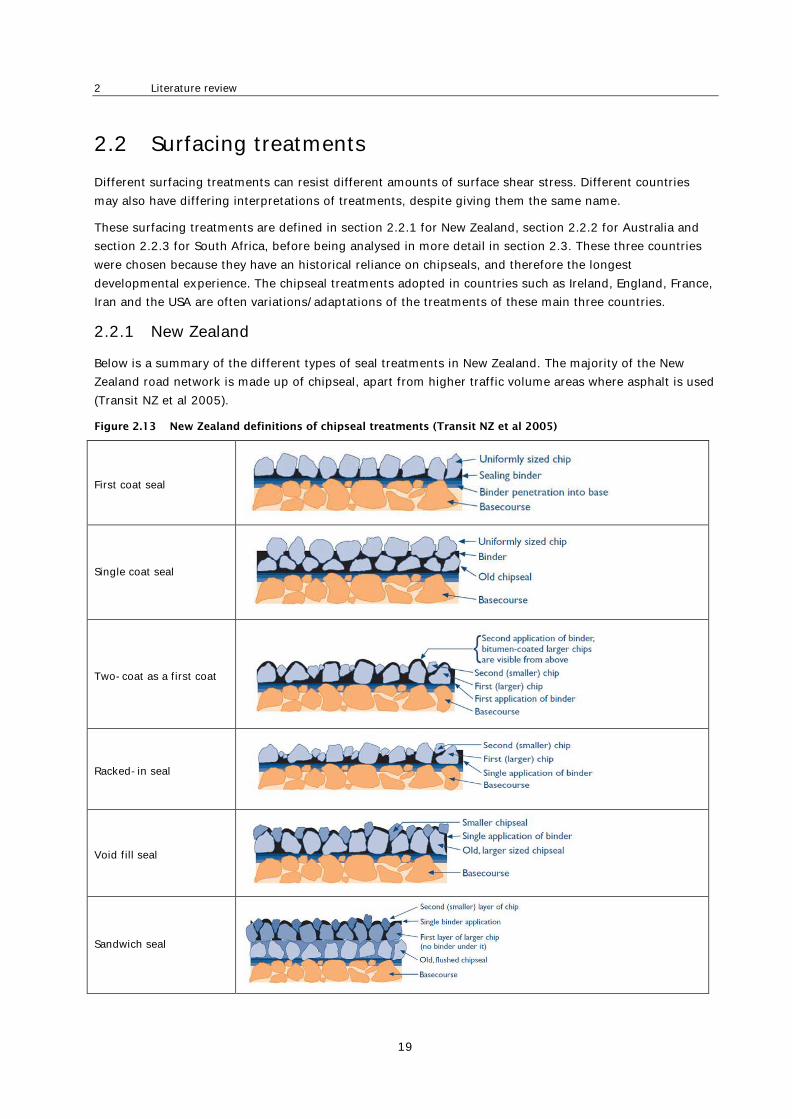
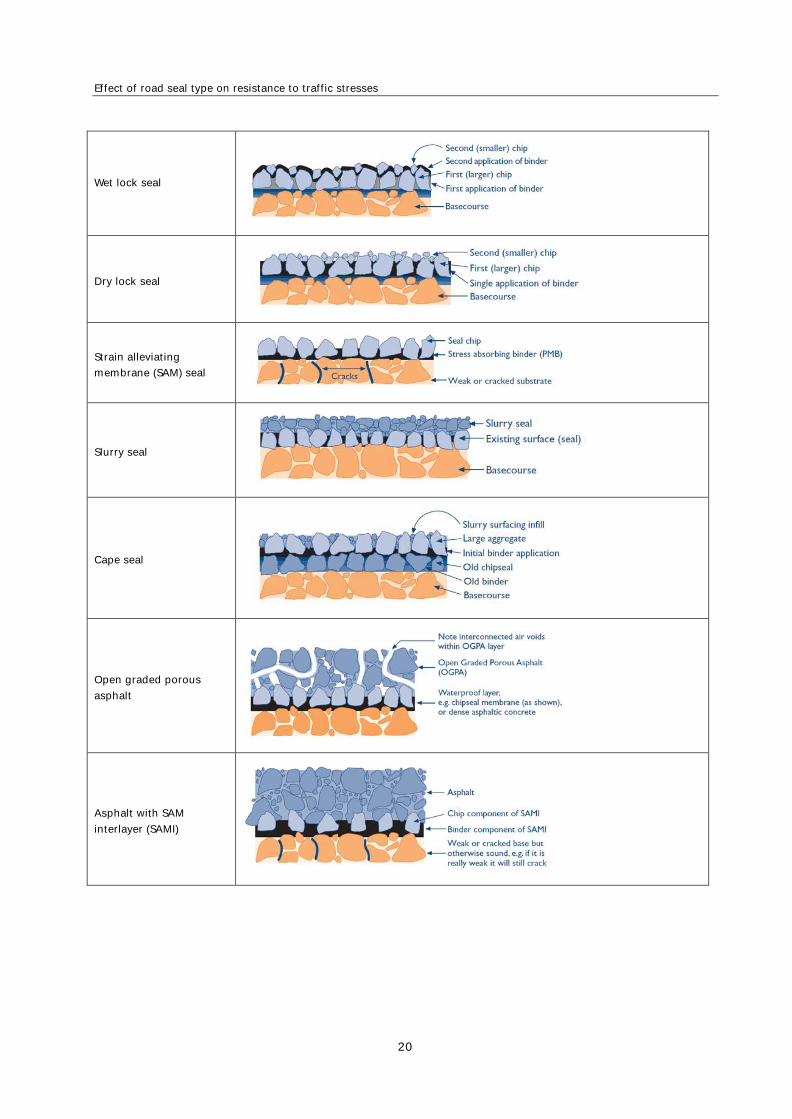
Below is a summary of the different types of seal treatments in New Zealand. The majority of the New Zealand road network is made up of chipseal, apart from higher traffic volume areas where asphalt is used (Transit NZ et al 2005).
Figure 2.13 New Zealand definitions of chipseal treatments (Transit NZ et al 2005)
First coat seal
Single coat seal
Two-coat as a first coat
Racked-in seal
Void fill seal
Sandwich seal
Effect of road seal type on resistance to traffic stresses
20
Wet lock seal
Dry lock seal
Strain alleviating membrane (SAM) seal
Slurry seal
Cape seal
Open graded porous asphalt
Asphalt with SAM interlayer (SAMI)
2 Literature review
21
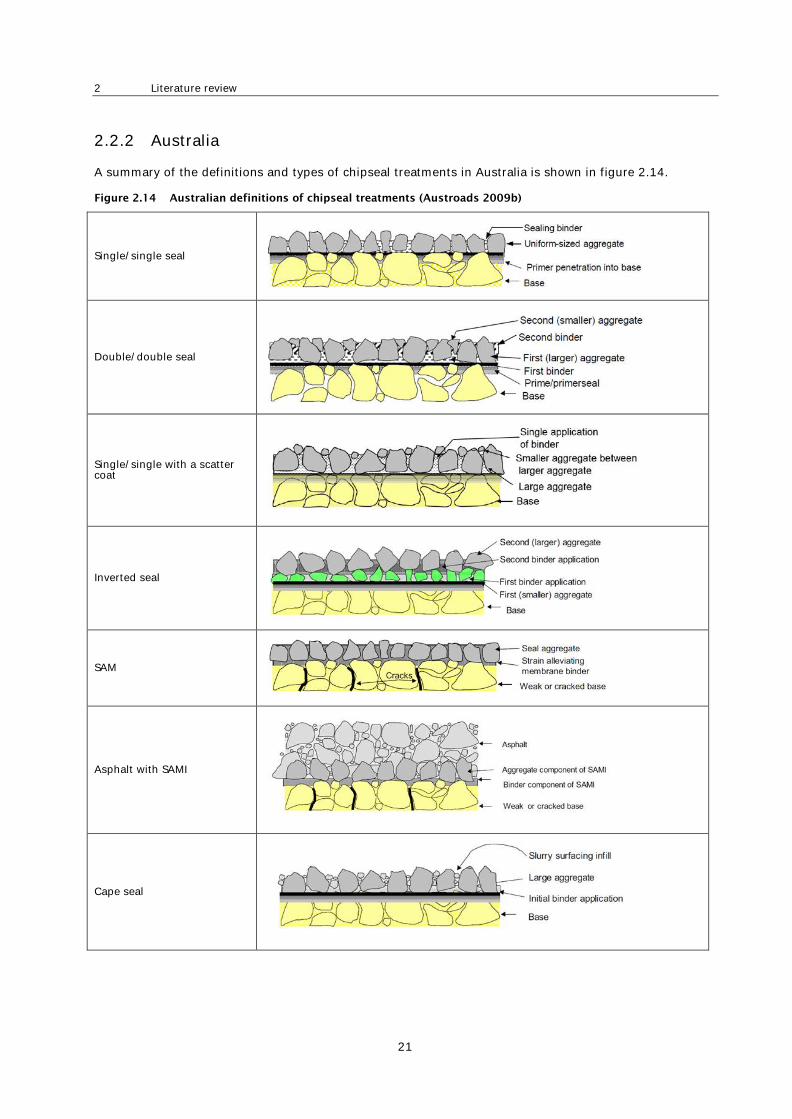
2.2.2 Australia
A summary of the definitions and types of chipseal treatments in Australia is shown in figure 2.14.
Figure 2.14 Australian definitions of chipseal treatments (Austroads 2009b)
Single/single seal
Double/double seal
Single/single with a scatter coat
Inverted seal
SAM
Asphalt with SAMI
Cape seal
Effect of road seal type on resistance to traffic stresses
22
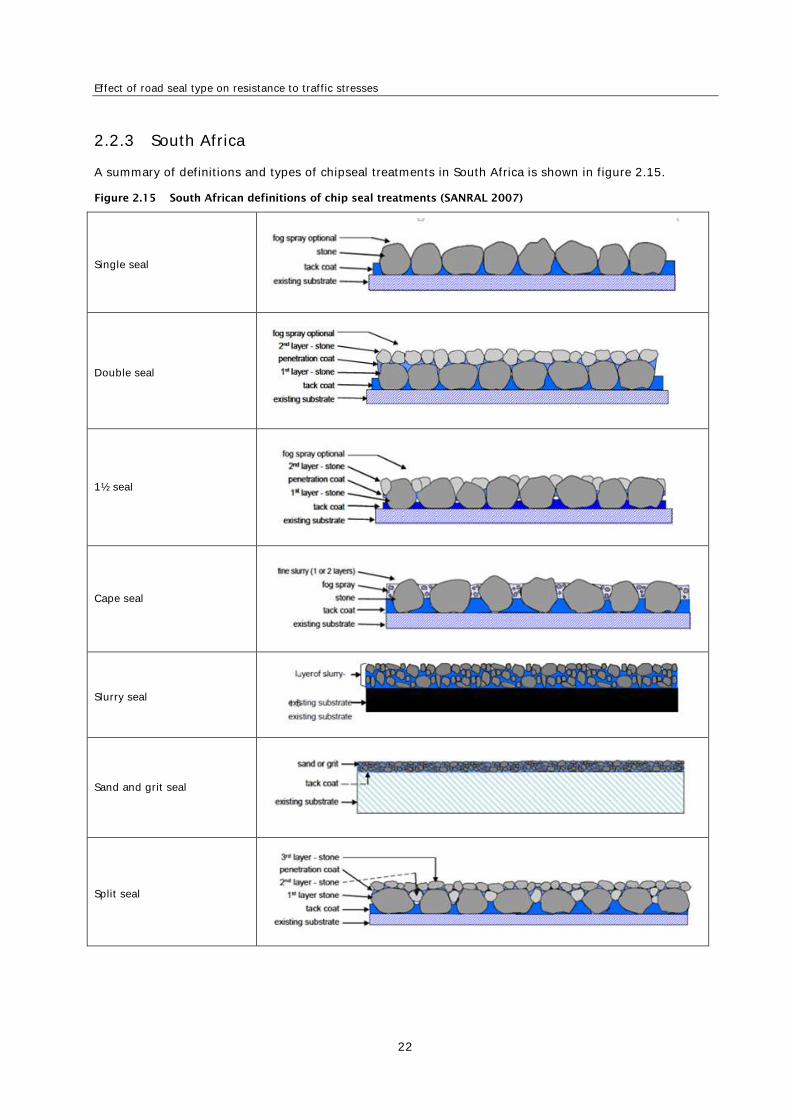
2.2.3 South Africa
A summary of definitions and types of chipseal treatments in South Africa is shown in figure 2.15.
Figure 2.15 South African definitions of chip seal treatments (SANRAL 2007)
Single seal
Double seal
1½ seal
Cape seal
Slurry seal
Sand and grit seal
Split seal

2 Literature review
23
Chocked seal
Inverted double seal
Graded aggregate (Otta) seal
Geotextile seal
2.2.4 Comparison of chip grades/sizes
When comparing chipseal treatments between countries, it must be remembered that not only do the same names describe different treatments in some cases, but also the chip sizes may be different. To enable a comparison, table 2.1 has been derived from information found in National Roads Board (1968), SANRAL (1985), Standards Australia (2009), Transit NZ (2004), Transit NZ et al (2005) and VicRoads (2004).

Effect of road seal type on resistance to traffic stresses
24
Table 2.1 Chipseal grade/size comparison
New Zealand Australia South Africa
Grade
ALD
(mm)
Sieve grading(a)
(mm)
Nominal
size (mm)
ALD (mm) Sieve grading(a)
(mm)
Nominal
size (mm)
ALD (mm) Sieve grading(a)
(mm)
1 11.5 to 14.0 (conversion of 0.45–0.55
inches) (withdrawn)
na 20 Min 10 -19.0 and +13.2 19 na -19.0 and + 16.0
2 9.5 to 12.0 na 16 Min 8 -16.0 and +9.5 16 na -16.0 and +13.2
3 7.5 to 10.0 na 14 Min 7 -13.2 and +9.5 13.2 na -13.2 and +9.5
4 5.5 to 8.0 na 10 Min 5 -9.5 and +6.7 9.5 na -9.5 and +6.7
5 na -9.5 and +6.7
6 na -6.7 and +4.75 7 Min 3.5 -6.75 and +3.35 6.7 na -6.7 and +4.75
na na na 5 Not readily measurable
-4.75 and +2.36 na na na
Notes: na = not applicable/not given (1) –ve means passing that sieve size. +ve means retained on that sieve size
2 Literature review
25
2.3 Surfacings and their resistance to shear forces 2.3.1 Experimental experience
Chipseals have varying and often limited ability to carry heavy loads and shearing stresses generated on steep grades, intersections and sharp curves. In these instances higher shear-resistant surfacings and treatments are progressively recommended and employed.
Austroads (2009b) named three factors that contribute to the development of horizontal stresses in pavement surfacings:
1 Motion of the wheel (braking, accelerating, turning)
2 Wheel configuration (loading, tyre type, inflation pressure)
3 Friction between the pavement surface and the tyre rubber.
Turning actions for a multiple-wheel, multiple-axle assembly will always result in stress-generating slippage when the turning circle is reduced so the capacity of the tyre tread and side wall to accommodate the developed strain is exceeded (Taramoeroa and de Pont 2008).
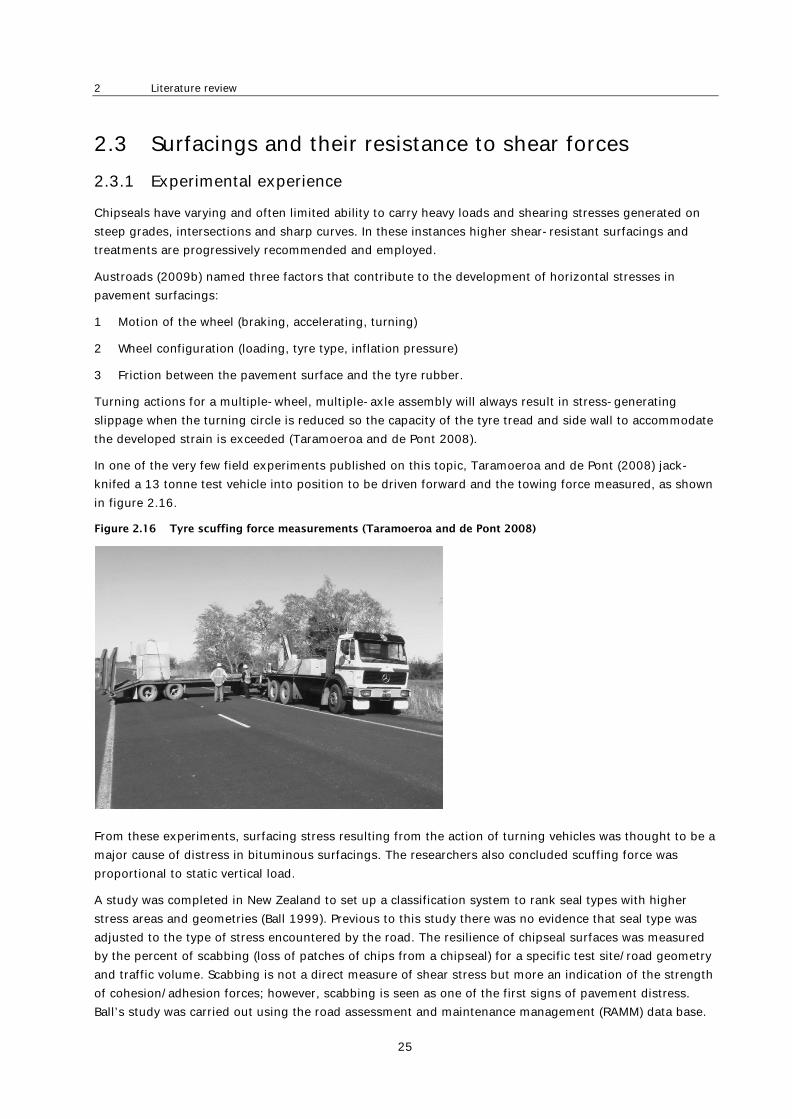
In one of the very few field experiments published on this topic, Taramoeroa and de Pont (2008) jack-knifed a 13 tonne test vehicle into position to be driven forward and the towing force measured, as shown in figure 2.16.
Figure 2.16 Tyre scuffing force measurements (Taramoeroa and de Pont 2008)
From these experiments, surfacing stress resulting from the action of turning vehicles was thought to be a major cause of distress in bituminous surfacings. The researchers also concluded scuffing force was proportional to static vertical load.
A study was completed in New Zealand to set up a classification system to rank seal types with higher stress areas and geometries (Ball 1999). Previous to this study there was no evidence that seal type was adjusted to the type of stress encountered by the road. The resilience of chipseal surfaces was measured by the percent of scabbing (loss of patches of chips from a chipseal) for a specific test site/road geometry and traffic volume. Scabbing is not a direct measure of shear stress but more an indication of the strength of cohesion/adhesion forces; however, scabbing is seen as one of the first signs of pavement distress. Ball’s study was carried out using the road assessment and maintenance management (RAMM) data base.

Effect of road seal type on resistance to traffic stresses
26
It gave the following hierarchy, order of decreasing resistance to scabbing:
• grade 5 single-coat seal
• grade 4 single-coat seal
• grades 3/5 two-coat seal
• grade 2 single-coat seal
• grade 3 single-coat seal.
The binders used for the above ranking were all cut-back bitumen.
In another study, road longevity was investigated in New Zealand using data collected using the sideways coefficient routine investigation machine (SCRIM). Using some of this data, and taking risk factors into account, it was inferred that two-coat seals have a shorter life span than those of the single-coat variant and failed at a 33.3% faster rate than single-coat seals (McCracken 2015). It was also inferred that seal types with smaller chip size fail at a faster rate due to greater chip loss in the early life of the pavement. This conflicts in part with the hierarchy found by Ball (1999), and is currently the topic of ongoing discussion.
A more recent field experiment has been undertaken by Austroads in Australia, but the resulting report (The
relationship between tyre/road horizontal stresses generated by heavy vehicles and the performance of the
pavement surfacing) has not yet been published.
2.3.2 Empirical experience
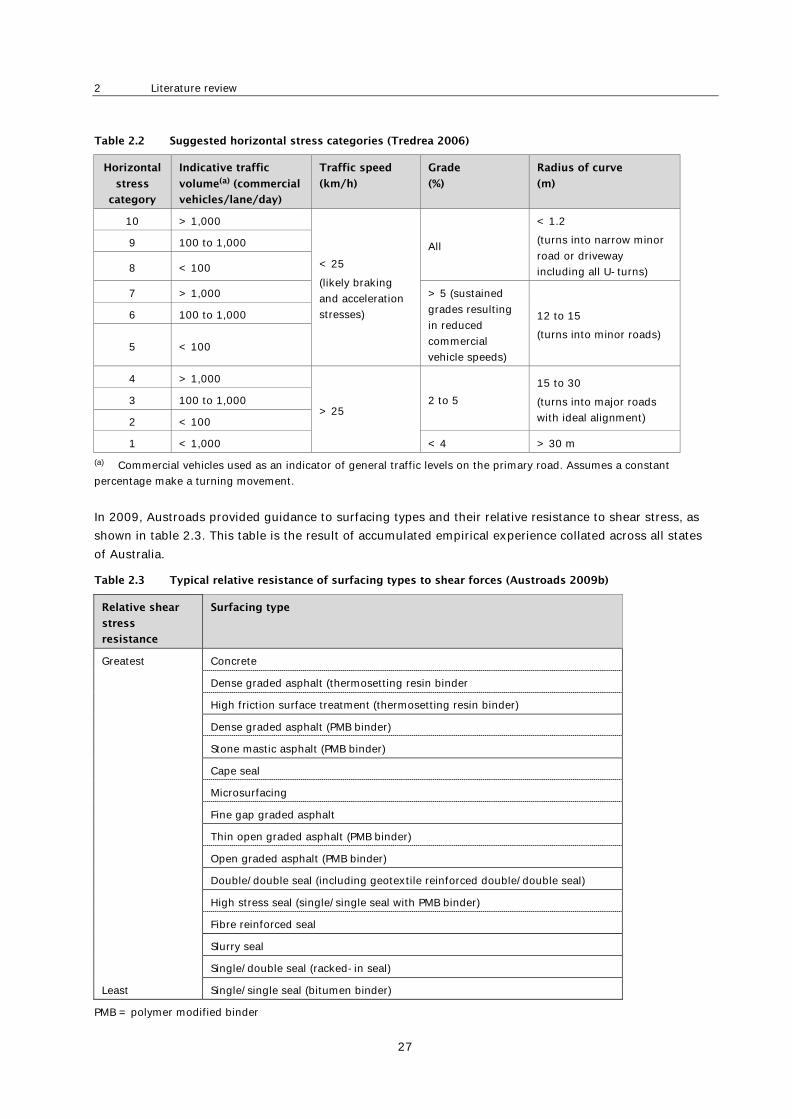
Tredrea (2006) collated information from Australian practitioners relating to their expected performance of surfacings subjected to horizontal stress, and his results are shown in figure 2.17 and table 2.2. These were then republished in Austroads (2011).
Figure 2.17 Surfacings types and their expected relationship to horizontal stress (Tredrea 2006)
2 Literature review
27
Table 2.2 Suggested horizontal stress categories (Tredrea 2006)
Horizontal
stress
category
Indicative traffic
volume(a) (commercial
vehicles/lane/day)
Traffic speed
(km/h)
Grade
(%)
Radius of curve
(m)
10 > 1,000
< 25 (likely braking and acceleration stresses)
All
< 1.2 (turns into narrow minor road or driveway including all U-turns)
9 100 to 1,000
8 < 100
7 > 1,000 > 5 (sustained grades resulting in reduced commercial vehicle speeds)
12 to 15 (turns into minor roads)
6 100 to 1,000
5 < 100
4 > 1,000
> 25 2 to 5
15 to 30 (turns into major roads with ideal alignment)
3 100 to 1,000
2 < 100
1 < 1,000 < 4 > 30 m (a) Commercial vehicles used as an indicator of general traffic levels on the primary road. Assumes a constant percentage make a turning movement.
In 2009, Austroads provided guidance to surfacing types and their relative resistance to shear stress, as shown in table 2.3. This table is the result of accumulated empirical experience collated across all states of Australia.
Table 2.3 Typical relative resistance of surfacing types to shear forces (Austroads 2009b)
Relative shear
stress
resistance
Surfacing type
Greatest Concrete
Dense graded asphalt (thermosetting resin binder
High friction surface treatment (thermosetting resin binder)
Dense graded asphalt (PMB binder)
Stone mastic asphalt (PMB binder)
Cape seal
Microsurfacing
Fine gap graded asphalt
Thin open graded asphalt (PMB binder)
Open graded asphalt (PMB binder)
Double/double seal (including geotextile reinforced double/double seal)
High stress seal (single/single seal with PMB binder)
Fibre reinforced seal
Slurry seal
Single/double seal (racked-in seal)
Least Single/single seal (bitumen binder)
PMB = polymer modified binder
Effect of road seal type on resistance to traffic stresses
28
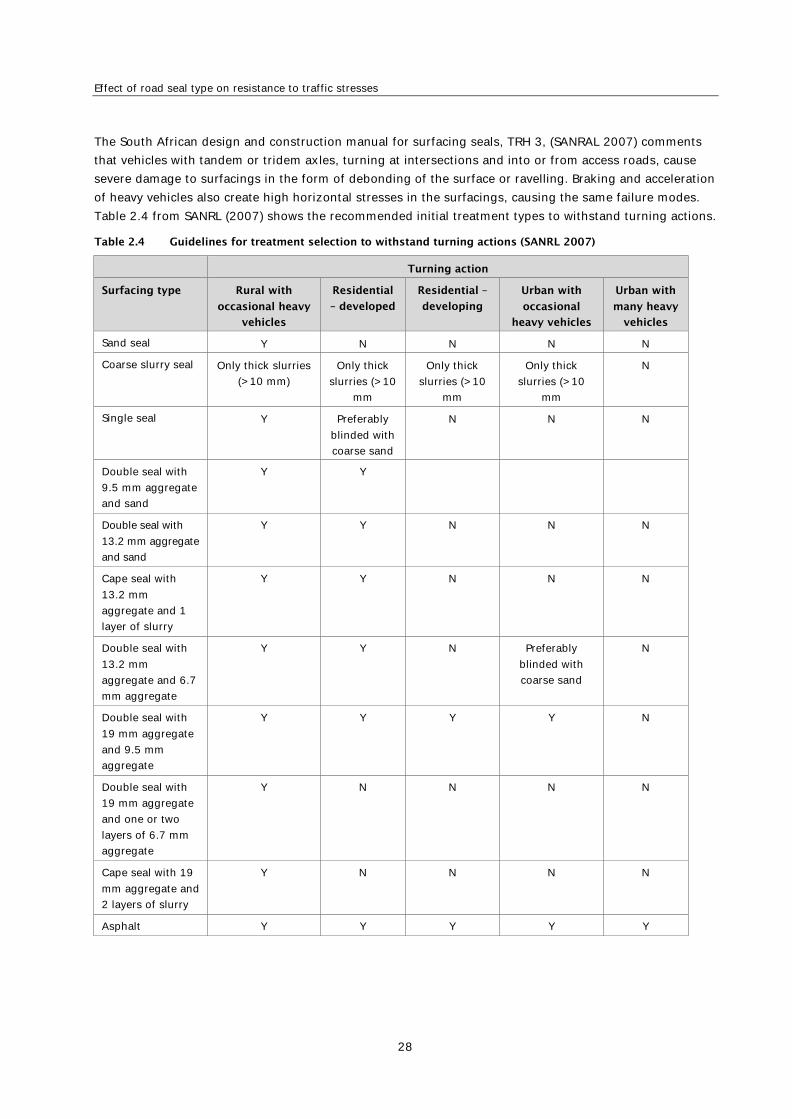
The South African design and construction manual for surfacing seals, TRH 3, (SANRAL 2007) comments that vehicles with tandem or tridem axles, turning at intersections and into or from access roads, cause severe damage to surfacings in the form of debonding of the surface or ravelling. Braking and acceleration of heavy vehicles also create high horizontal stresses in the surfacings, causing the same failure modes. Table 2.4 from SANRL (2007) shows the recommended initial treatment types to withstand turning actions.
Table 2.4 Guidelines for treatment selection to withstand turning actions (SANRL 2007)
Turning action
Surfacing type Rural with
occasional heavy
vehicles
Residential
– developed
Residential –
developing
Urban with
occasional
heavy vehicles
Urban with
many heavy
vehicles
Sand seal Y N N N N
Coarse slurry seal Only thick slurries (>10 mm)
Only thick slurries (>10
mm
Only thick slurries (>10
mm
Only thick slurries (>10
mm
N
Single seal Y Preferably blinded with coarse sand
N N N
Double seal with 9.5 mm aggregate and sand
Y Y
Double seal with 13.2 mm aggregate and sand
Y Y N N N
Cape seal with 13.2 mm aggregate and 1 layer of slurry
Y Y N N N
Double seal with 13.2 mm aggregate and 6.7 mm aggregate
Y Y N Preferably blinded with coarse sand
N
Double seal with 19 mm aggregate and 9.5 mm aggregate
Y Y Y Y N
Double seal with 19 mm aggregate and one or two layers of 6.7 mm aggregate
Y N N N N
Cape seal with 19 mm aggregate and 2 layers of slurry
Y N N N N
Asphalt Y Y Y Y Y

2 Literature review
29
When specifically considering chipseal resurfacing treatments, Austroads (2013) offers guidance as shown in table 2.5.
Table 2.5 Preliminary seal selection guide for high shear stress locations (Austroads 2013)
Design
traffic
(v/l/d)
Equivalent
heavy vehicles
(%)
Small radius curves,
roundabouts,
driveways, turning
lanes, intersections
Grades# >5%
200 <15 D/D S/S
15–26
26–45 D/D HSS1
>45 HSS2
201–750 <15 D/D
15–26
26–45 HSS2
> 45
750–2,000 <15
15–26
26–45
> 45 XSS
2,001–5,000
<15
15–26 HSS2
26–45 No seal suitable
> 45
> 5,000 <15 XSS
15–26
26–45
> 45 XSS^
Where
# Considerably steeper grades or combinations of extreme events may lead to unsatisfactory performance and may require alternative treatments ^ Seal performance may be inadequate under these conditions and may require alternative treatments. S/S: Single/single with C170, C320 or M500/170 binder D/D: Double/double with C170, C320 or M500/170 binder HSS1: Single/single seal with PMB for moderately severe sites (M500/170, S10E, S15E, S35E, S45R or S15RF) and severe sites (S20E, S45R or S15RF) HSS2: Double/double seal with PMB in first or both applications for medium traffic loading (M500/170, S10E, S15E, S35E, S45R or S15RF) and heavy traffic loading (S10E, S15E, S20E, S35E, S45R or S15RF) XSS: Double/double seal with PMB in both applications (S15E, S20E, S45R or S15RF) for high-stress areas. Seal performance may be inadequate under these conditions and may require alternative treatments No seal suitable: asphalt, generally DGA 10 or 14 mm where an XSS sprayed seal cannot be expected to cope.
When specifically considering asphalt resurfacing treatments, Austroads offers guidance as shown in table 2.6
Effect of road seal type on resistance to traffic stresses
30
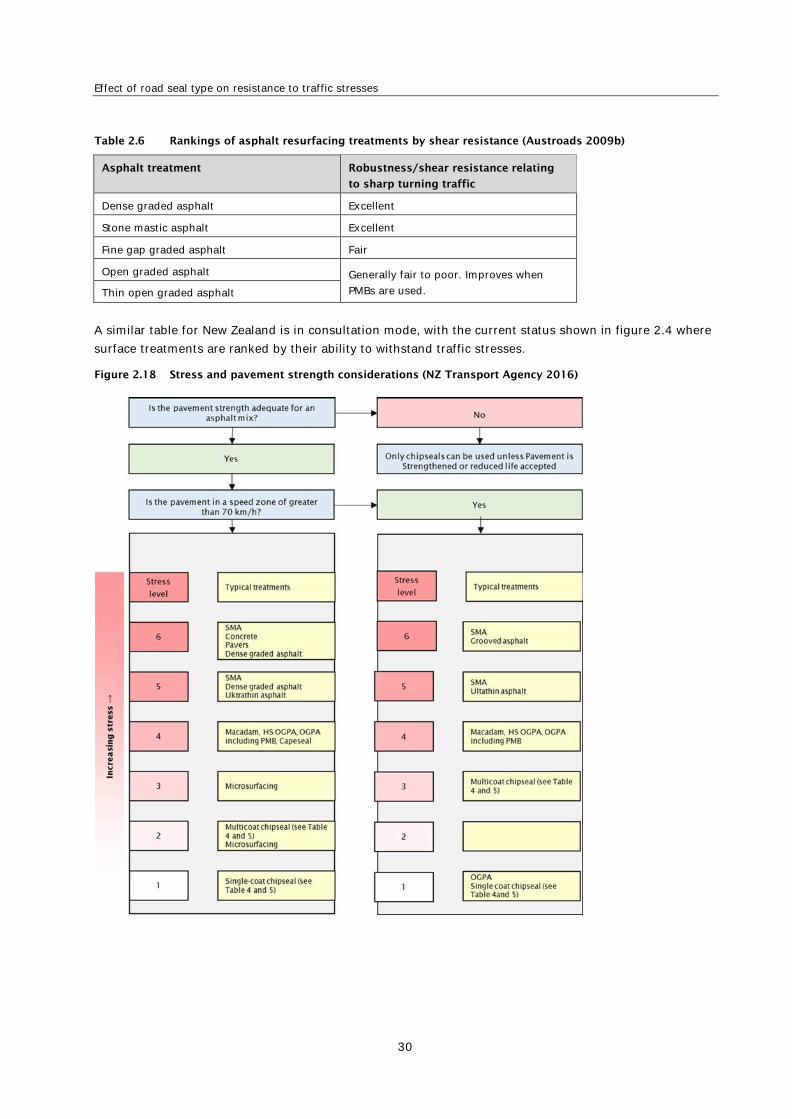
Table 2.6 Rankings of asphalt resurfacing treatments by shear resistance (Austroads 2009b)
Asphalt treatment Robustness/shear resistance relating
to sharp turning traffic
Dense graded asphalt Excellent
Stone mastic asphalt Excellent
Fine gap graded asphalt Fair
Open graded asphalt Generally fair to poor. Improves when PMBs are used. Thin open graded asphalt
A similar table for New Zealand is in consultation mode, with the current status shown in figure 2.4 where surface treatments are ranked by their ability to withstand traffic stresses.
Figure 2.18 Stress and pavement strength considerations (NZ Transport Agency 2016)
2 Literature review
31
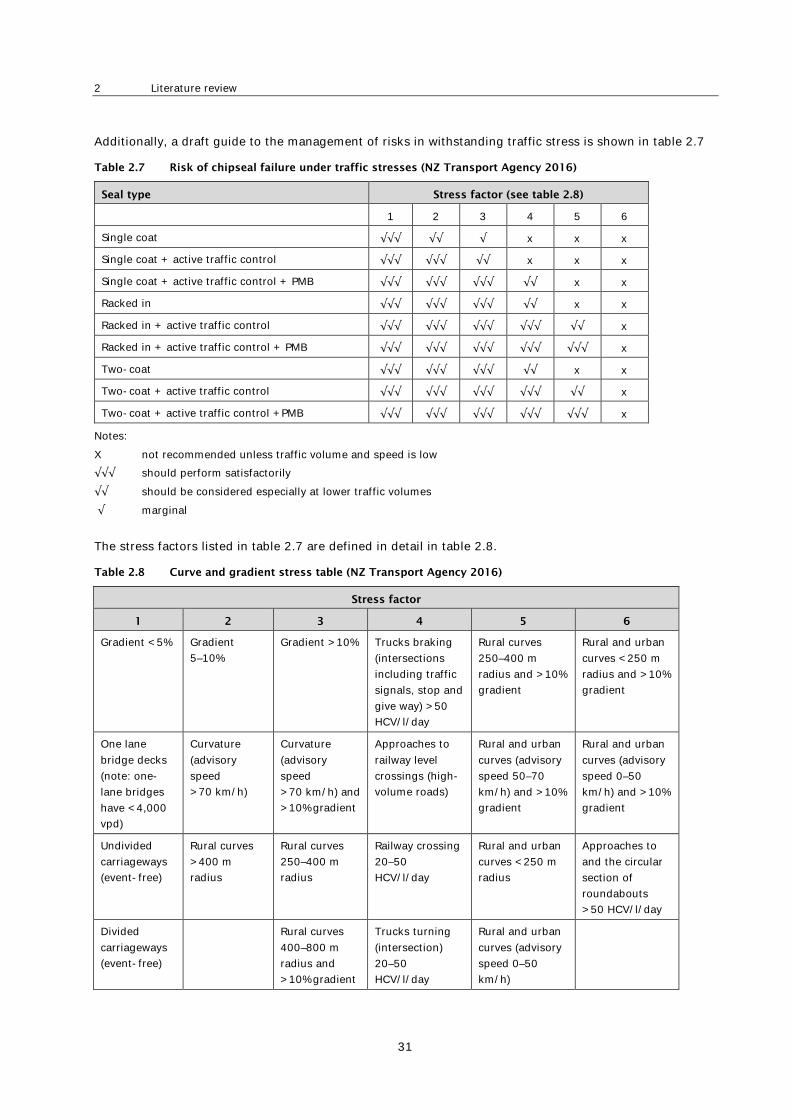
Additionally, a draft guide to the management of risks in withstanding traffic stress is shown in table 2.7
Table 2.7 Risk of chipseal failure under traffic stresses (NZ Transport Agency 2016)
Seal type Stress factor (see table 2.8)
1 2 3 4 5 6
Single coat √√√ √√ √ x x x
Single coat + active traffic control √√√ √√√ √√ x x x
Single coat + active traffic control + PMB √√√ √√√ √√√ √√ x x
Racked in √√√ √√√ √√√ √√ x x
Racked in + active traffic control √√√ √√√ √√√ √√√ √√ x
Racked in + active traffic control + PMB √√√ √√√ √√√ √√√ √√√ x
Two-coat √√√ √√√ √√√ √√ x x
Two-coat + active traffic control √√√ √√√ √√√ √√√ √√ x
Two-coat + active traffic control +PMB √√√ √√√ √√√ √√√ √√√ x
Notes: X not recommended unless traffic volume and speed is low √√√ should perform satisfactorily √√ should be considered especially at lower traffic volumes √ marginal
The stress factors listed in table 2.7 are defined in detail in table 2.8.
Table 2.8 Curve and gradient stress table (NZ Transport Agency 2016)
Stress factor
1 2 3 4 5 6
Gradient <5% Gradient 5–10%
Gradient >10% Trucks braking (intersections including traffic signals, stop and give way) >50 HCV/l/day
Rural curves 250–400 m radius and >10% gradient
Rural and urban curves <250 m radius and >10% gradient
One lane bridge decks (note: one-lane bridges have <4,000 vpd)
Curvature (advisory speed >70 km/h)
Curvature (advisory speed >70 km/h) and >10% gradient
Approaches to railway level crossings (high-volume roads)
Rural and urban curves (advisory speed 50–70 km/h) and >10% gradient
Rural and urban curves (advisory speed 0–50 km/h) and >10% gradient
Undivided carriageways (event-free)
Rural curves >400 m radius
Rural curves 250–400 m radius
Railway crossing 20–50 HCV/l/day
Rural and urban curves <250 m radius
Approaches to and the circular section of roundabouts >50 HCV/l/day
Divided carriageways (event-free)
Rural curves 400–800 m radius and >10% gradient
Trucks turning (intersection) 20–50 HCV/l/day
Rural and urban curves (advisory speed 0–50 km/h)

Effect of road seal type on resistance to traffic stresses
32
Stress factor
1 2 3 4 5 6
Rural and urban curves (advisory speed 50–70 km/h)
Pedestrian Crossing 20–50 HCV/l/day
Approaches to and circular section of roundabouts <50 HCV/l/day
Trucks braking (intersections including traffic signals, stop and give way) <50 HCV/l/day
Trucks braking (pedestrian and railway crossings) >50 HCV/l/day
Approaches to one lane bridges (note: one-lane bridges have <4,000 vpd)
Trucks turning (intersection) >50 HCV/l/day
Approaches to intersections, on ramps with ramp metering
Trucks braking (pedestrian and railway crossings) <20 HCV/l/day
Trucks turning (intersection, commercial driveways) <20 HCV/l/day
Motorway junction area (including on/off ramps)
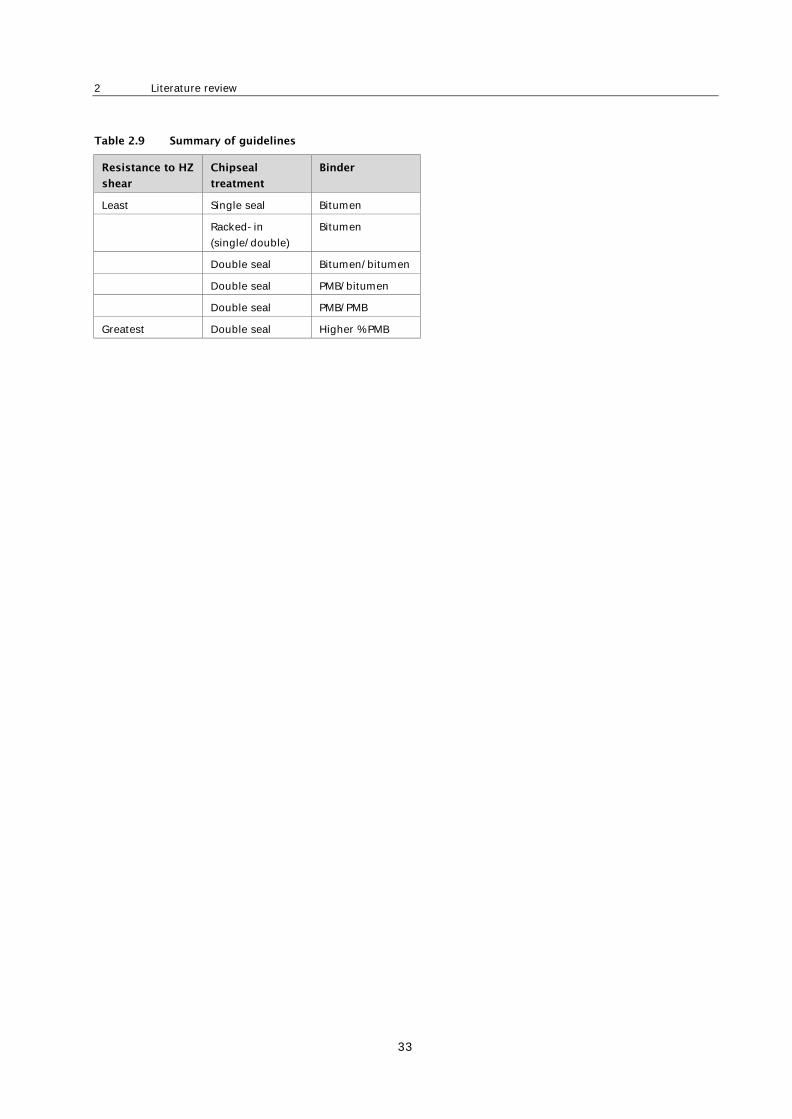
2.3.3 Summary of guidelines for chipseals and their resistance to shear forces
The preceding guidelines from the three traditional chipseal dependent countries (New Zealand, Australia and South Africa) can be roughly combined as described in table 2.9.
2 Literature review
33
Table 2.9 Summary of guidelines
Resistance to HZ
shear
Chipseal
treatment
Binder
Least Single seal Bitumen
Racked-in (single/double)
Bitumen
Double seal Bitumen/bitumen
Double seal PMB/bitumen
Double seal PMB/PMB
Greatest Double seal Higher % PMB
Effect of road seal type on resistance to traffic stresses
34
3 Mechanisms contributing to seal damage
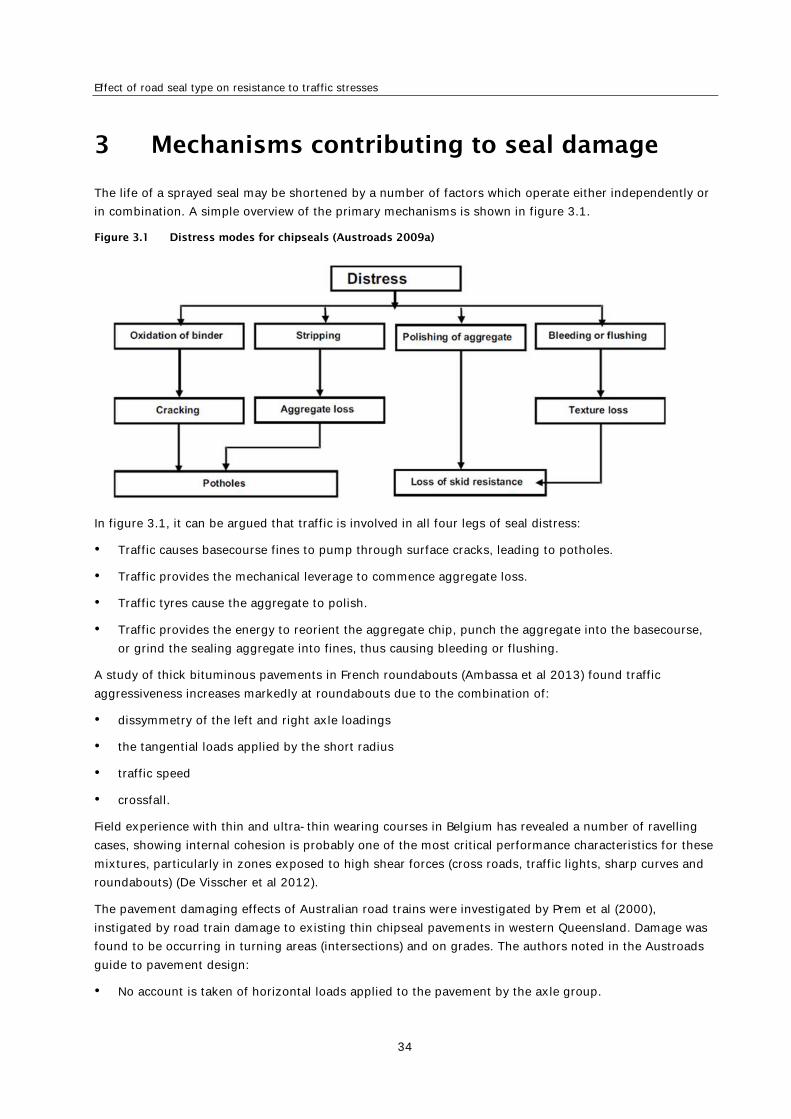
The life of a sprayed seal may be shortened by a number of factors which operate either independently or in combination. A simple overview of the primary mechanisms is shown in figure 3.1.
Figure 3.1 Distress modes for chipseals (Austroads 2009a)
In figure 3.1, it can be argued that traffic is involved in all four legs of seal distress:
• Traffic causes basecourse fines to pump through surface cracks, leading to potholes.
• Traffic provides the mechanical leverage to commence aggregate loss.
• Traffic tyres cause the aggregate to polish.
• Traffic provides the energy to reorient the aggregate chip, punch the aggregate into the basecourse, or grind the sealing aggregate into fines, thus causing bleeding or flushing.
A study of thick bituminous pavements in French roundabouts (Ambassa et al 2013) found traffic aggressiveness increases markedly at roundabouts due to the combination of:
• dissymmetry of the left and right axle loadings
• the tangential loads applied by the short radius
• traffic speed
• crossfall.
Field experience with thin and ultra-thin wearing courses in Belgium has revealed a number of ravelling cases, showing internal cohesion is probably one of the most critical performance characteristics for these mixtures, particularly in zones exposed to high shear forces (cross roads, traffic lights, sharp curves and roundabouts) (De Visscher et al 2012).
The pavement damaging effects of Australian road trains were investigated by Prem et al (2000), instigated by road train damage to existing thin chipseal pavements in western Queensland. Damage was found to be occurring in turning areas (intersections) and on grades. The authors noted in the Austroads guide to pavement design:
• No account is taken of horizontal loads applied to the pavement by the axle group.
3 Mechanisms contributing to seal damage
35
• No account is taken of moments applied to the pavement through the tyre contact patch.
• No estimation of damage to a chipseal is provided.
• Damage caused to both the granular material and the subgrade of a chipsealed granular pavement is combined in a single ‘overall’ estimate of damage.
Because they found no existing models for the performance of chipseals under horizontal loading, the authors adopted their own model, shown as equations 3.1 and 3.2.
𝑁𝑁 ∝ �1𝜇𝜇𝜇𝜇�5
(Equation 3.1)
where
𝑁𝑁 = Number of repetitions of a specific loading before cracking of the seal occurs
𝜇𝜇𝜇𝜇 = Magnitude of the peak horizontal tensile strain generated in the seal by the passage of the load
5 = An exponent value adopted on the grounds that it was between the 7 adopted by Austroads for maximum tensile stress as the critical response, and 4 associated with the 4th power law
Then if assuming the damage caused by a single passage of loading is 1/N, the performance relationship for a single passage is:
𝑐𝑐ℎ𝑖𝑖𝑖𝑖 𝑠𝑠𝑠𝑠𝑠𝑠𝑠𝑠 𝑑𝑑𝑠𝑠𝑑𝑑𝑠𝑠𝑑𝑑𝑠𝑠 ∝ 𝜇𝜇𝜇𝜇5 (Equation 3.2)
where
𝜇𝜇𝜇𝜇 = Magnitude of the peak horizontal tensile strain generated in the seal by the passage of the load
5 = An exponent value adopted on the grounds that it was between the 7 adopted by Austroads for maximum tensile stress as the critical response, and 4 associated with the 4th power law
This is consistent with Sharp and Trevorrow (2011) reporting that contract work of Prem and Potter (1999) had previously estimated:
𝑐𝑐ℎ𝑖𝑖𝑖𝑖 𝑠𝑠𝑠𝑠𝑠𝑠𝑠𝑠 (𝑜𝑜𝑜𝑜 𝑠𝑠𝑠𝑠𝑖𝑖ℎ𝑠𝑠𝑠𝑠𝑎𝑎)𝑑𝑑𝑠𝑠𝑑𝑑𝑠𝑠𝑑𝑑𝑠𝑠 ∝ 𝜇𝜇5 (Equation 3.3)
The exponent value of 5 has since been disputed, with other values suggested being 3.1 (Arnold et al 2005a); 2.0 (Arnold et al 2005b); 1.7 (de Pont et al 2003) and 1 (Austroads 2015; Neaylon 2017). However, the premise of chipseal damage being proportional to peak horizontal tensile strain has not been disputed.
Prem et al (2000) found through their modelling that for a low-speed turn manoeuvre the maximum horizontal force imposed by the tyres on the pavement generally occurred on the front axle of a tri-axle group, under the tyre closest to the inside of the turn. They also found this force depended on the turn radius and on the axle group spread, increasing with axle group spread and increasing with decreasing turn radius.
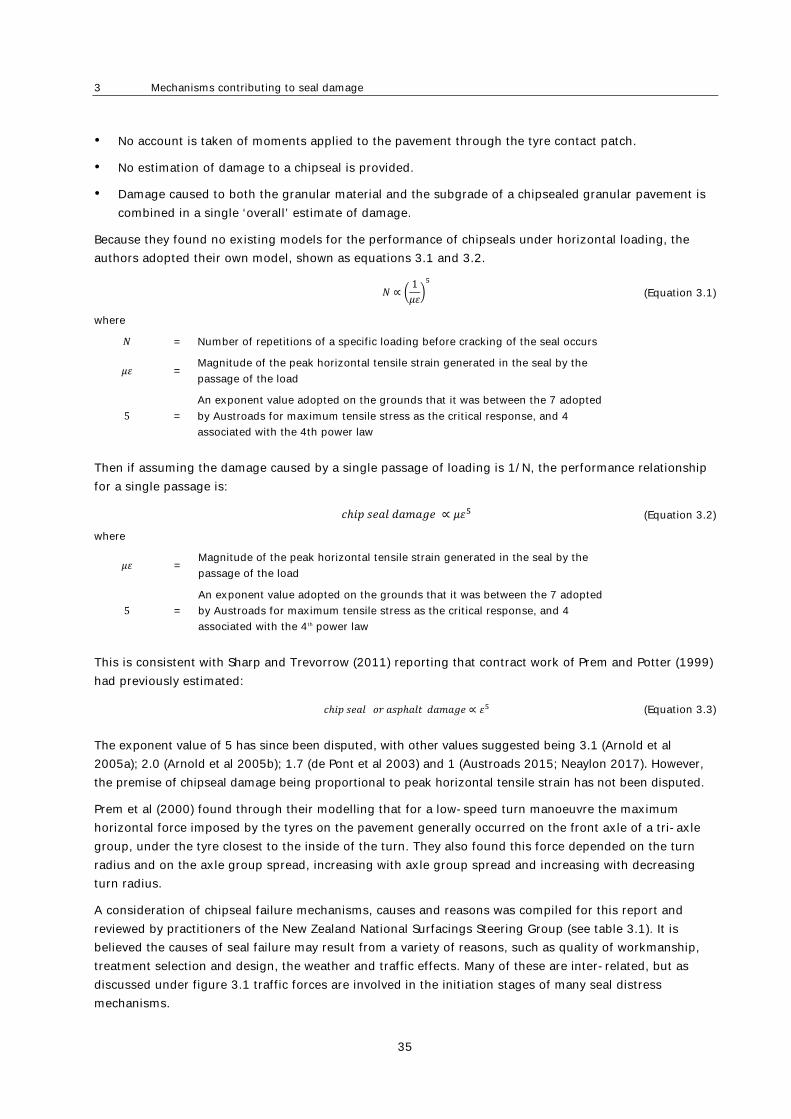
A consideration of chipseal failure mechanisms, causes and reasons was compiled for this report and reviewed by practitioners of the New Zealand National Surfacings Steering Group (see table 3.1). It is believed the causes of seal failure may result from a variety of reasons, such as quality of workmanship, treatment selection and design, the weather and traffic effects. Many of these are inter-related, but as discussed under figure 3.1 traffic forces are involved in the initiation stages of many seal distress mechanisms.

Effect of road seal type on resistance to traffic stresses
36
Table 3.1 Chipseal failure mechanisms
Observed field
failure
Physical mechanism Cause Reason
Immediate chip loss
Poor binder wetting/adhesion to chip
Dusty chip Not adequately washed after crushing
Chip prone to breakdown/self-dusting
Wet chip
Stockpile exposed to weather
Rainfall on fresh work
Absorptive aggregate
High viscosity binder
Cold air and/or pavement temperatures during and after construction
Binder not at sufficient temp at time of spraying
Insufficient cutter
Aggregate spreading delayed
Lack of adhesion agent Insufficient adhesion agent for known problem aggregates
Excessive traffic stresses Poor selection of binder type for the conditions
Traffic event not designed for
Insufficient binder to hold chip
Over chipping
Incorrect seal design
Short term (ie within months) delamination in first coat seals
Poor binder adhesion to base
Wet base course Sealed before pavement dry-back
Dusty base course
Lack of prime coat
Pavement dried back too far
Slurry of fines at the pavement surface
Poor basecourse aggregate mosaic
High viscosity binder
Cold air and/or pavement temperatures during and after construction
Binder not at sufficient temp prior to spraying
Insufficient cutter
Wrong (too hard) binder grade selected

3 Mechanisms contributing to seal damage
37
Observed field
failure
Physical mechanism Cause Reason
Medium term (ie within years) texture loss (flushing), rutting
Embedment in base
Soft base course
Poor basecourse compaction
Slurry of fines at the pavement surface
Poor basecourse aggregate mosaic
Sealed before pavement dry-back
Soft unstable seal Prior reseals too young
Binder/stone ratio causing instability
Excess bitumen Excess spray rates
Incorrect seal design
Underlying issue with seal design method
Seal construction (workmanship)
Moisture in seal layer causing venting and binder migration
Moisture from seal/pavement Water expansion in volume following rise in pavement temperature
Rising groundwater Poor pavement drainage
Chip breakdown and filling voids Weak chip
Chip not complying to specification
Adequate properties not included in the specification
Reduction in skid performance Chip polishing Microtexture wear down
Chip reaching equilibrium for the traffic stress
Incorrect PSV chip for the conditions
Short term (within months) chip rollover/ displacement/ chip loss/ binder tracking
Cohesive failure of binder
Low viscosity binder
High pavement temperatures
Excess cutter
Emulsion slow break and curing
Wrong binder grade selected
Traffic shear stress
Poor surfacing selection
Under-chipping
Insufficient rolling
Over-chipping
Traffic volume not designed for
Traffic horizontal stress over design estimates
Power steering stresses during low speed parking manoeuvres
Effect of road seal type on resistance to traffic stresses
38
Observed field
failure
Physical mechanism Cause Reason
Medium to long term cracking Cohesive failure of binder
High substrate vertical movement (deflection)
Weak substrate
Traffic vertical stress over design estimates
Substrate horizontal movement
Diurnal and seasonal pavement thermal expansion and contraction
Shrinkage in stabilised pavements
High viscosity binder Binder oxidation
Long term (within years) chip loss
Cohesive failure of binder High viscosity binder Binder oxidation

4 Methodology to compare seal strength
39
4 Methodology to compare seal strength
Many examples of the range of different seal treatments available were discussed in chapter 2, and a large number of variables that may contribute to seal damage were discussed in chapter 3.
Most of the variables should be held constant so the effect of changing one particular variable at a time can be measured and understood.
There are risks involved in testing various treatments for surfacing failure on a public road network, because of the inability to control weather and loading variables. Because of this a laboratory simulation of traffic shear forces was used, where all variables could be held constant and only one measured change made at a time. This simulation was undertaken as follows.
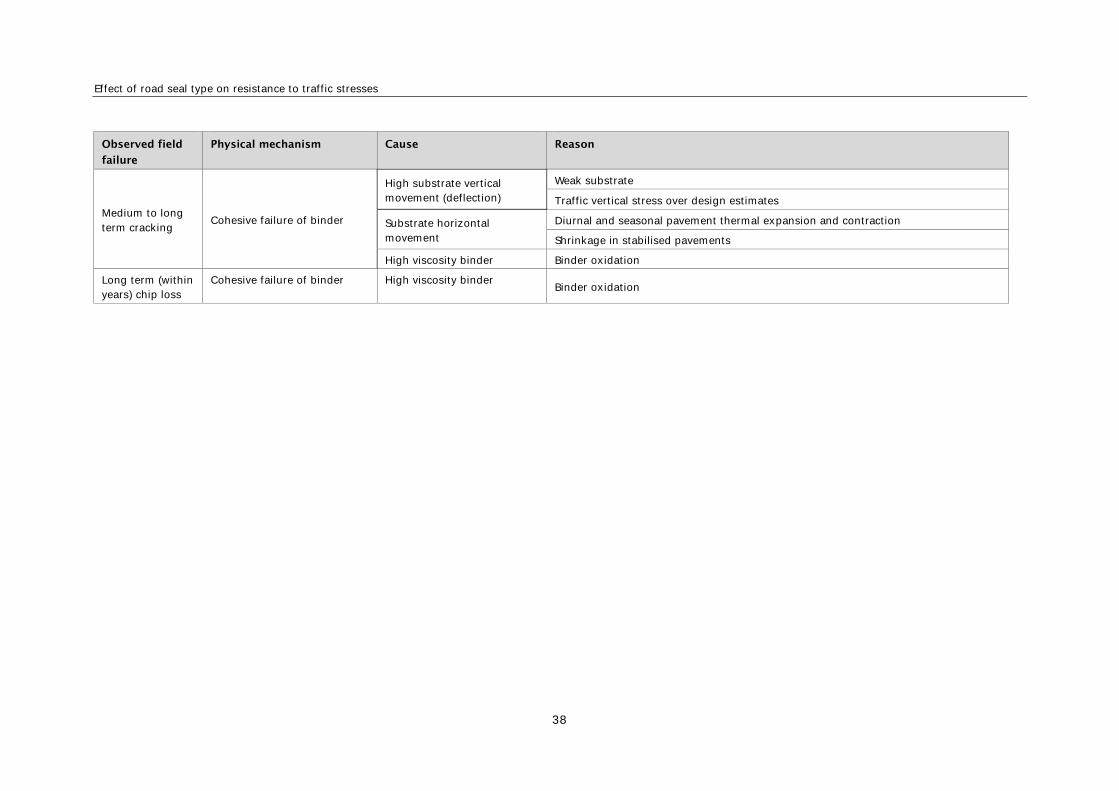
4.1 The circular accelerated surfacing tester (CAST) The Opus circular accelerated surfacing tester (CAST) is a purpose built machine for testing materials generally used in road surfacing. It can be used to test a range of surfacing materials such as surfacing binders, surfacing aggregates and pavement marking materials.
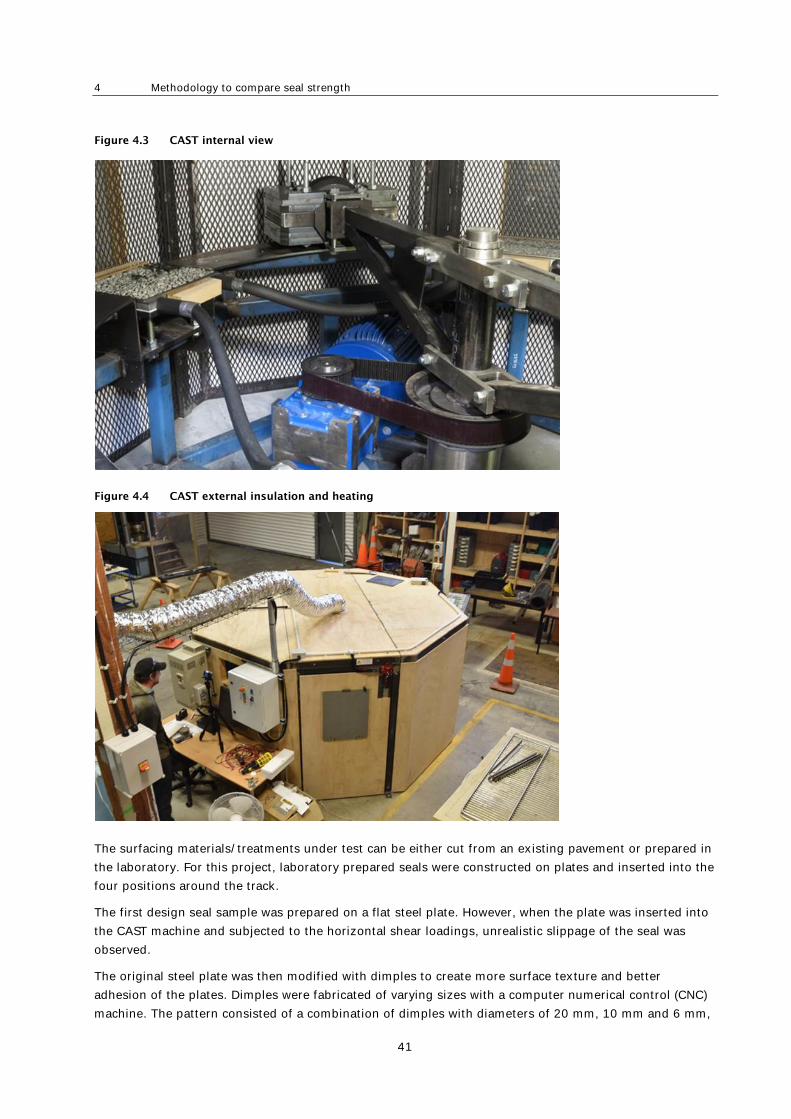
As shown in figures 4.1 and 4.3, a rotating pair of 320 mm diameter pneumatic tyres apply a vertical load of up to 200 kg as they travel around a 7.4 m long circular track at up to 50 km/h. The 1.170 m radius of the rotating arms ensures a high level of scuffing is applied to the test seal surface to support the accelerated nature of the test. Four samples can be inserted into the track for simultaneous testing providing a constant environment for comparative testing.
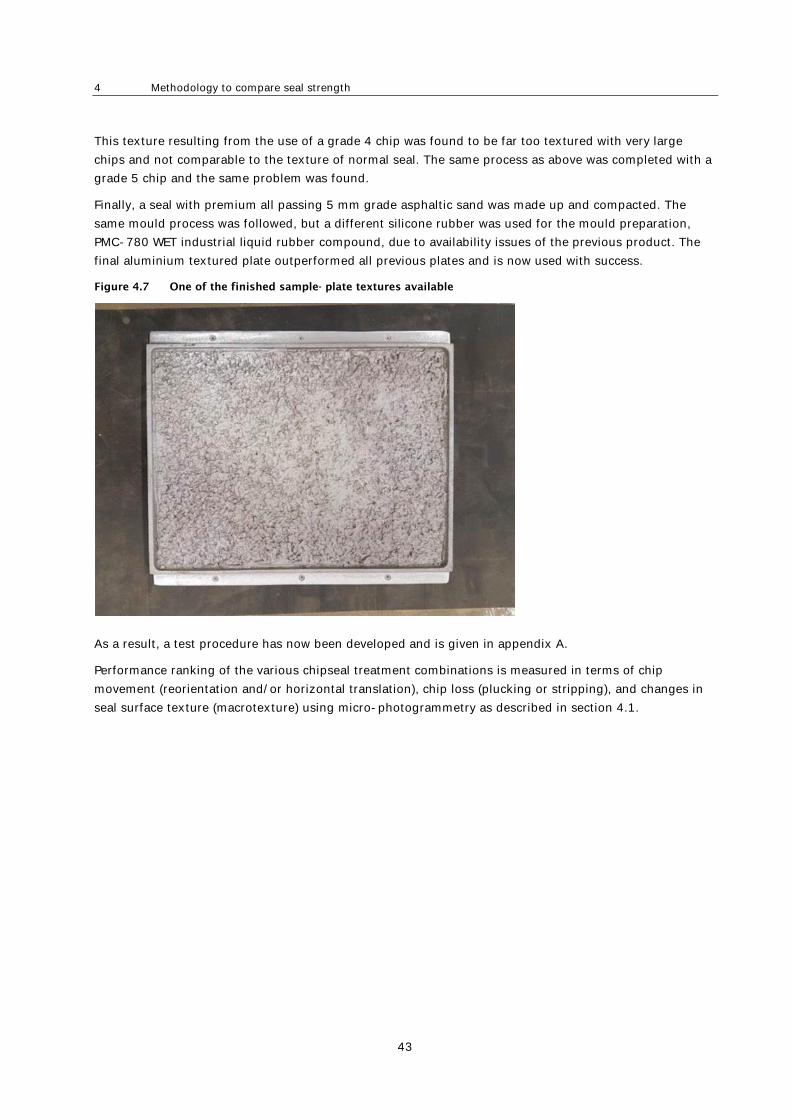
CAST is housed within an insulated enclosure (figure 4.4) allowing testing to be undertaken in a temperature controlled environment. The surface temperature and air temperature can be controlled separately to cover the range of temperatures actually experienced in the field (typically -7 to +55°C).
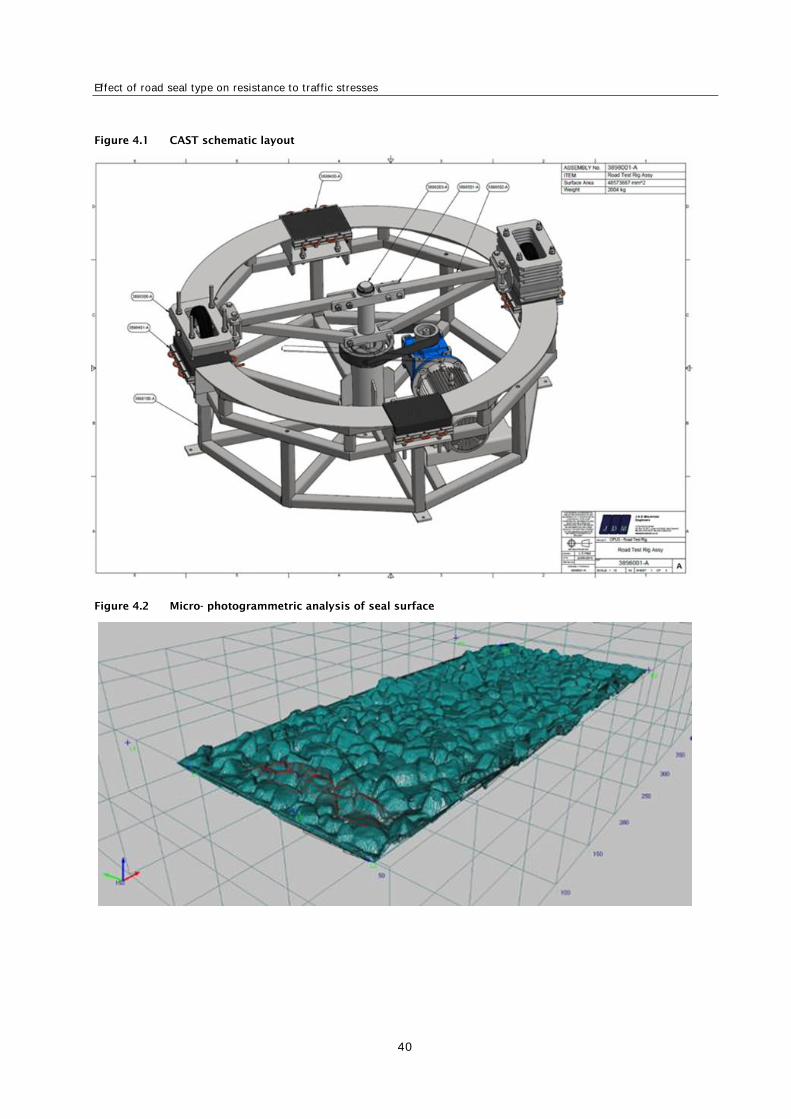
Changes in the surface are measured using stereo photography (micro-photogrammetry) to generate a 3D image that is converted into a dataset of surface points (x, y, z co- ordinates), at up to 0.1 mm resolution (figure 4.2).
Effect of road seal type on resistance to traffic stresses
40
Figure 4.1 CAST schematic layout
Figure 4.2 Micro- photogrammetric analysis of seal surface
4 Methodology to compare seal strength
41
Figure 4.3 CAST internal view
Figure 4.4 CAST external insulation and heating
The surfacing materials/treatments under test can be either cut from an existing pavement or prepared in the laboratory. For this project, laboratory prepared seals were constructed on plates and inserted into the four positions around the track.
The first design seal sample was prepared on a flat steel plate. However, when the plate was inserted into the CAST machine and subjected to the horizontal shear loadings, unrealistic slippage of the seal was observed.
The original steel plate was then modified with dimples to create more surface texture and better adhesion of the plates. Dimples were fabricated of varying sizes with a computer numerical control (CNC) machine. The pattern consisted of a combination of dimples with diameters of 20 mm, 10 mm and 6 mm,

Effect of road seal type on resistance to traffic stresses
42
periodically spaced across the plate, and a depth ranging from 1 mm down to 0.2 mm. This pattern (figure 4.5) was repeated across the A3-sized test plate. However, when the seal was applied on this plate and tested, unrealistic slippage of the seal was still observed.
Figure 4.5 Dimpled pattern repeated across the A3- sized test plate
The next stage involved the attachment of a 1 mm thick mesh with 4.75 mm x 4.75 mm squares to a steel plate. However, the same slippage of the seal was observed as shown in figure 4.6.
Figure 4.6 Representation of the different types of plate texture and the resulting effect on seal surface
texture after CAST testing
The finally accepted method involved replicating the texture of a chipseal in an aluminium plate, which would in theory replicate the texture of an actual chipseal, provide better adhesion and prevent slippage problems when a seal was applied. The suitability of the resulting texture of the following plates was determined by visual inspection and sand circle measurement.
First, a seal with grade 4 chip was made up and compacted. A negative mould of this seal was produced using OOMOO25 tin-cure silicone rubber. A release agent was applied to this negative mould and then a positive mould was made from it. This positive mould was taken to an aluminium foundry where a negative was created using sand. This negative was used to make the final textured aluminium plate.
4 Methodology to compare seal strength
43
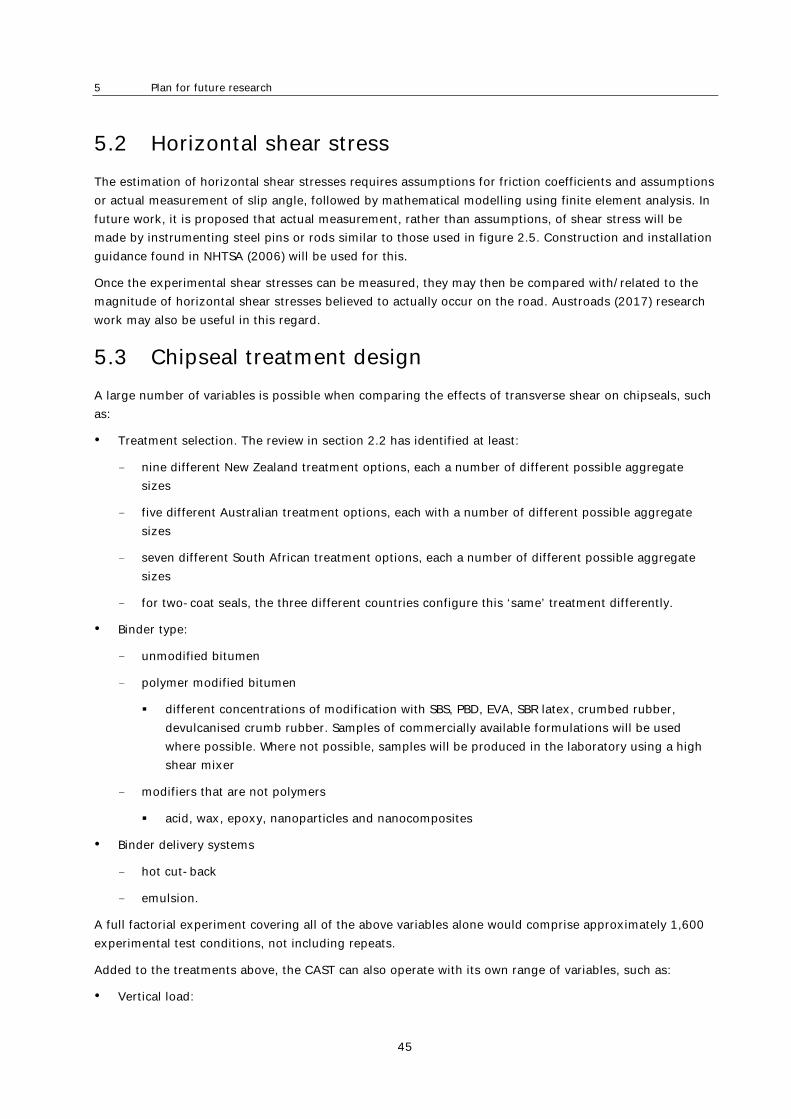
This texture resulting from the use of a grade 4 chip was found to be far too textured with very large chips and not comparable to the texture of normal seal. The same process as above was completed with a grade 5 chip and the same problem was found.
Finally, a seal with premium all passing 5 mm grade asphaltic sand was made up and compacted. The same mould process was followed, but a different silicone rubber was used for the mould preparation, PMC-780 WET industrial liquid rubber compound, due to availability issues of the previous product. The final aluminium textured plate outperformed all previous plates and is now used with success.
Figure 4.7 One of the finished sample- plate textures available
As a result, a test procedure has now been developed and is given in appendix A.
Performance ranking of the various chipseal treatment combinations is measured in terms of chip movement (reorientation and/or horizontal translation), chip loss (plucking or stripping), and changes in seal surface texture (macrotexture) using micro-photogrammetry as described in section 4.1.

Effect of road seal type on resistance to traffic stresses
44
5 Plan for future research
5.1 Experimental definition of failure The trial seals plus a control section will be loaded with a measured number of circular passes. During this process the loading will be periodically halted while stereo pairs of photographs are taken for image analysis. Seal volume changes, relating to chip loss and aggregate reorientation, will be measured. Locations and quantum of plucking or stripping can also be noted. In addition, the maximum horizontal translation of surface aggregate chips will be measured as this will be a measure of the treatment’s resistance to horizontal shear, should the treatment remain otherwise intact. These measurements will also be supplemented by a change in macrotexture (measured as a 3D point cloud and reported as mean profile depth).
The actual mechanism of failure can be expected to vary depending on pavement temperature and seal design type.
The definition of failure may well need to be refined after testing has been completed and actual behaviours of the seals observed.
One distress mechanism that has currently been observed (for a given binder type and pavement temperature) is shown in figures 5.1 and 5.2.
Figure 5.1 Single seal at 0 passes (left- hand image of a stereoscopic pair)
Figure 5.2 The same single seal at 45 ° C and after 100 passes
5 Plan for future research
45
5.2 Horizontal shear stress The estimation of horizontal shear stresses requires assumptions for friction coefficients and assumptions or actual measurement of slip angle, followed by mathematical modelling using finite element analysis. In future work, it is proposed that actual measurement, rather than assumptions, of shear stress will be made by instrumenting steel pins or rods similar to those used in figure 2.5. Construction and installation guidance found in NHTSA (2006) will be used for this.
Once the experimental shear stresses can be measured, they may then be compared with/related to the magnitude of horizontal shear stresses believed to actually occur on the road. Austroads (2017) research work may also be useful in this regard.
5.3 Chipseal treatment design A large number of variables is possible when comparing the effects of transverse shear on chipseals, such as:
• Treatment selection. The review in section 2.2 has identified at least:
– nine different New Zealand treatment options, each a number of different possible aggregate sizes
– five different Australian treatment options, each with a number of different possible aggregate sizes
– seven different South African treatment options, each a number of different possible aggregate sizes
– for two-coat seals, the three different countries configure this ‘same’ treatment differently.
• Binder type:
– unmodified bitumen
– polymer modified bitumen
different concentrations of modification with SBS, PBD, EVA, SBR latex, crumbed rubber, devulcanised crumb rubber. Samples of commercially available formulations will be used where possible. Where not possible, samples will be produced in the laboratory using a high shear mixer
– modifiers that are not polymers
acid, wax, epoxy, nanoparticles and nanocomposites
• Binder delivery systems
– hot cut-back
– emulsion.
A full factorial experiment covering all of the above variables alone would comprise approximately 1,600 experimental test conditions, not including repeats.
Added to the treatments above, the CAST can also operate with its own range of variables, such as:
• Vertical load:
Effect of road seal type on resistance to traffic stresses
46
– increasing load increases the Hz scuffing forces
– increasing load shifts the peak vertical stress more to beneath the sidewalls
• Speed:
– increasing speed decreases the tyre contact area which for a constant load then increases vertical and horizontal stresses
• Temperature:
– decreasing the temperature may increase the brittleness of the binder
– increasing the temperature increases the tyre contact patch area which may decrease shear stresses
• Tyre pressure
– increasing inflation pressure will shift the peak vertical stress towards the centre of the footprint.
• Slip angle
– changing the tyre design/compound would increase or decrease the slip angle
– shear stresses increase as slip angle increases
5.4 Chipseal binder testing Binder testing will be completed using a variety of surfacing types including chipseals and asphalt mixes. Bitumen may be tested unmodified or as a modified binder containing additives such as (but not limited to) polymers, epoxies and rubber.
Testing of binders may investigate such things as:
• adhesion of various aggregate sources to a number of different binders
• cohesion of aggregates across a range of temperatures
• temperature susceptibility of binders both modified and unmodified
• performance change with vary proportions of modification.
The most appropriately textured test plates will be used (see section 4.1) for the construction of the test and control samples. The binder will be applied using a measured system to ensure all samples contain exactly the same amount of binder. Chip application rates will be measured and chip placement photographed so consistency between samples is achieved.
Work is currently underway in New Zealand to develop a chipseal performance-based bitumen specification. The CAST has already been used to validate the proposed specification tests and their proposed limiting values.
It is also intended at a future date to rank the shear resistance performance of various PMBs against un-modified bitumen, while holding the chipseal treatment selection constant (eg with a single seal and again with a two-coat seal).

5 Plan for future research
47
5.5 Plan for stage 2 research 5.5.1 Tyre
The make and specification of the tyre is to remain constant for all comparative testing, as the literature review has highlighted that:
• different tyres produce different slip angles under otherwise identical conditions
• shear stress increases as slip angle increases
• tyre structure and design has a greater impact on contact stresses than other variables (eg shear stress decreases as tread stiffness increases but increases as carcass stiffness increases).
The tyre found to be most durable under CAST conditions thus far is a 13x5.00-6, Deli tyre S 365 09, 4P.R. tubeless, with a max inflation pressure of 40 PSI (275 kPa). This is a non-Kevlar tyre with square-shouldered turf tread pattern.
Tyre inflation pressure is monitored in real time by a blue-tooth valve attachment.
5.5.2 Chipseal treatment design
Stage two of this research project will be to compare the shear resistance of single seals, racked-in seals and two-coat seals. For this testing the following is proposed:
Constants
• Tyre type will be as in appendix A with pressure 250 kPa (36 psi).
• Vertical loading will be the same as in the performance-based bitumen study, which is the maximum load possible for this equipment (194 kg) This will allow a direct comparison to a much wider existing dataset.
• Speed will initially be 25 km/h, but will be empirically adjusted so the time to failure is neither too fast nor too slow. Once a trial programme has determined this, the speed will be held constant for the remainder of the research.
• Binder. A 180/200 pen bitumen with no adhesion agent will be used. Viscosity and rheological properties will be measured and recorded. This grade of bitumen was chosen because it is the most commonly used binder in the New Zealand chipseal network
• Aggregate. A grade 3 and grade 5, washed and dried to constant weight, sourced from a single quarry (Winstone Belmont) and of known ALD and AGD, and repeatable, sieve grading.
• Seal design. All designs to be undertaken by the same experienced person, and reviewed by two independent peer reviewers.
• Seal construction. All seals will be constructed by hand by the same experienced person. The aggregate to be arranged as a seal would appear at day one, ie many stones not yet lying on their AGD and many ‘black windows’ between the stones when viewed from above. This will be photographed and circulated to the two peer reviewers for comment.
Variables
• Treatment type
– single seal (New Zealand grade 3). This will be nominated as the ‘control’ treatment for this and all future CAST work. This grade of chip was chosen because single grade 3s are the most

Effect of road seal type on resistance to traffic stresses
48
common seals on the New Zealand road network. It will form the benchmark for comparison of the ‘tougher’ treatments.
– two-coat seal (New Zealand grades 3/5)
– racked-in (New Zealand grades 3/5).
• Pavement temperature:
– 0 °C
– 25 °C
– 45 °C (to be compatible with the dataset obtained for the performance-based bitumen study).
This combination will produce a full factorial experimental matrix of 3*3 = 9 conditions, to be repeated three times.

6 Conclusions
49
6 Conclusions
There is a wealth of empirical knowledge on the performance ranking of various chipseal and surfacing treatment types available in many published guidelines. These performance guidelines have been based on conditions prevalent at the time. However, there is a small but growing opinion by some that past performance may not be a guarantee of future performance.
The future work as proposed will provide the opportunity to put some science behind the various empirically derived rules of thumb.
If the mechanisms of shear failure in chipseals can be better understood, there is a better chance of engineering an appropriate solution or combination of solutions for the growing traffic demands placed on cheap, thin, flexible chipseal surfacings.

Effect of road seal type on resistance to traffic stresses
50
7 References
Al-Qadi, IL and PJ Yoo (2007) Effect of surface tangential contact stresses on flexible pavement response. Journal of the Association of Asphalt Paving Technologists 76: 663–692.
Ambassa, Z, F Allou, C Petit and R Medjo Eko (2013) Evaluation de l’agressivite du trafic sur des chaussees bitumineuses en carrefour giratoire (Evaluation of traffic aggressiveness on bituminous pavements in roundabouts. Bulletin des laboratoires des ponts et chaussees 280–281: 171–188.
Arnold, G, B Steven, D Alabaster and A Fussell (2005a) Effect on pavement wear of increased mass limits for heavy vehicles – concluding report. Land Transport NZ research report 281. 80pp.
Arnold, G, B Steven, D Alabaster and A Fussell (2005b) Effect on pavement wear of increased mass limits for heavy vehicles – stage 4. Land Transport NZ research report 280. 30pp.
Austroads (2009a) Guide to pavement technology part 4k: seals. AGPT04K-09. Sydney: Austroads.
Austroads (2009b) Guide to pavement technology part 3: pavement surfacings. AGPT03-09. Sydney: Austroads.
Austroads (2011) Historical development of PBS standard for pavement horizontal loading and recent ARRB research. Austroads technical report AP-T175-11. Sydney: Austroads.
Austroads (2012) Guide to pavement technology part 2: pavement structural design. AGPT02-12. Sydney: Austroads.
Austroads (2013) Update of double/double design for Austroads sprayed seal design method. Austroads
technical report AP-T236-13. Sydney: Austroads.
Austroads (2015) Towards incorporating heavy vehicles into sprayed seal design – stage 2. Austroads
technical report AP-T292-15. Sydney: Austroads.
Austroads (2017) Heavy vehicle horizontal stresses and pavement surface performance. Austroads
technical report AP-T325-17. Sydney: Austroads.
Ball, GFA (1999) Surfacing for high stress areas. Transfund NZ research report 126. 22pp.
Cenek, PD, PR Herrington, RJ Henderson, BJH Holland, IR McIver and DK Walton (2011), High-stress corners. NZ Transport Agency research report 466.
CSIR Built Environment Unit (2007) Tyre loading and contact stress information system (CSIS). Revision of the South African pavement design methodology. Inception report for project PB/2006/A-1.
De Beer, M (2011) Tyrestress readme v1.0.0.0, 4 April 2011, SAPDM/A-1 a tyre-pavement contact stress information system. Accessed 18/10/2015. www.sapdm.co.za/document_view/library.php
De Beer, M (2012) Stress-in-motion (SIM) – systems for tyre/road interface contact stresses. Pretoria: CSIR Built Environment. 3pp.
De Beer, M, C Fisher and F J Jooste (1997) Determination of pneumatic tyre/pavement interface contact tresses under moving loads and some effects on pavements with thin asphalt surfacing layers. 8th
International Conference on Asphalt Pavements. Seattle, Washington. pp179–227.
De Beer, M, C Fisher and E Sadzik (2008) Towards quantifying horizontal stresses of free-rolling pneumatic rubber tyres on road surfaces. 27th Southern African Transport Conference (SATC). Pretoria, South Africa. 16pp.

7 References
51
De Beer, M, JW Maina, Y van Rensburg and JM Greben (2012) Toward using tire-road contact stresses in road pavement design and analysis. Tire Science and Technology 40, no.4: 246–271.
de Pont, J, B Steven, D Alabaster and A Fussell (2002) Effect on pavement wear of an increase in mass limits for heavy vehicles – stage 2. Transfund NZ research report 231. 50pp.
De Visscher, J, S Vansteenkiste and A Vanelstraete (2012) Laboratory tests for internal cohesion and ravelling of thin and ultra thin wearing courses. 5th Eurasphalt & Eurobitume Congress. Istanbul, Turkey.
Fernando, EG, D Musani, DW Park and W Liu (2006), Evaluation of effects of tire size and inflation pressure on tire contact stresses and pavement response. Texas Transportation Institute research report 0-
4361-1.
Hamlat, S, F Hammoum, P-Y Hicher and J-P Terrier (2007) Laboratory evaluation of the resistance to tangential forces of road surfacing materials. BLPC report 267.
Hernandez, JA (2015). Development of deformable tire-pavement interaction: Contact stresses and rolling resistance prediction under various driving conditions. PhD thesis, University of Illinois at Urbana-Champaign.
Lippmann, SA (1986) Effects of tire structure and operating conditions on the distribution of stress between the tread and the road. Pp91–109 in STP929 The tire pavement interface. MG Pottiner and TJ Yager (Eds). West Conshohocken: PA.
Maina, J and M De Beer (2008) Improved performance evaluation of road pavements by using measured tyre loading. 2nd CSIR Biennial Conference. Pretoria, South Africa.
McCracken, S (2015) Chip seal surface longevity and risk factors of failure. Report prepared for the NZTA by MWH. 19pp.
Myers, LA, R Roque, BE Ruth and C Drakos (1999) Measurement of contact stresses for different truck tire types to evaluate their influence on near-surface cracking and rutting. Transportation Research Record
No. 1655.
National Highway Traffic Safety Administration (2006) The pneumatic tire. AN Gent and JD Walter (Eds). DOT HS 810 561, Washington, DC: NHTSA.
National Roads Board (1968) Manual of sealing and paving practice. Wellington: Ministry of Works.
National Roads Board (1971) Manual of sealing and paving practice (metric addendum). Prepared by Roading Division Ministry of Works for the Road Research Unit, Wellington, New Zealand.
Neaylon, KL (2017) The effects of heavy vehicle single, tandem and tri-axles on sprayed seal wear in Australia. PhD thesis. Swinburne University of Technology.
NZ Transport Agency (2016) Surfacing selection guide. Draft Vo.3. Wellington: NZ Transport Agency.
Oblizajek, KL and AG Veith (1986) Tire treadwear — a comprehensive evaluation of the factors: Generic type, aspect ratio, tread pattern, and tread composition part iv: Laboratory measurement of mechanical Pottinger, MG (1992) The three-dimensional contact patch stress field of solid and pneumatic tyres. Tire Science and Technology 20: no.1.
Prem, H and D Potter (1999) A comparison of the pavement damaging effects of tri-axle and tandem axle
drive groups. Contract report RC7048 prepared for Queensland Department of Main Roads, ARRB Transport Research, Vermont South, Victoria.

Effect of road seal type on resistance to traffic stresses
52
Prem, H, E Ramsay, DW Potter and J Patane (2000) Pavement damaging effects of road trains. 6th
International Symposium on Heavy Vehicle Weights and Dimensions. Saskatoon, Saskatchewan, Canada.
properties and mechanical actions of tires relating to treadwear. Tire Science and Technology 14, no.4: 264–291.
Shakiba, M, A Gamez, IL Al-Qadi and DN Little (2016) Introducing realistic tire–pavement contact stresses into pavement analysis using nonlinear damage approach (PANDA). International Journal of Pavement
Engineering: 1–12.
Society of Automotive Engineers (SAE) (1976) Vehicle dynamics terminology. SAE J670e. Warrendale, PA: SAE.
South African National Roads Agency Limited (1985) Guidelines for road construction materials. Technical
recommendations for highways TRH14. Pretoria: Committee of State Road Authorities.
South African National Roads Agency Limited (2007) Design and construction of surfacing seals. Technical
recommendations for highways TRH3. Pretoria: Committee of State Road Authorities. 258pp.
Standards Australia (2009) AS 2758.2:2009 Aggregates and rock for engineering purposes part 2:
Aggregate for sprayed bituminous surfacing. Sydney.
Taramoeroa, N and J de Pont (2008) Characterising pavement surface damage caused by tyre scuffing forces. Land Transport NZ research report 374. 66pp.
Transit New Zealand (2004) TNZ M/6: 2004 Specification for sealing chip. Wellington.
Transit New Zealand, Road Controlling Authorities and Roading New Zealand (2005) Chip sealing in New
Zealand. Wellington: NZ Transport Agency. 524pp.
Tredrea, P F (2006) Surfacing performance under the influence of horizontal stresses: A laboratory study. 22nd ARRB Conference, Canberra, Australia.
VicRoads (2004). Bituminous sprayed surfacing manual. VicRoads technical bulletin no 45. Melbourne
Wang, H and IL Al-Qadi (2009) Combined effect of moving wheel loading and three dimensional contact stresses on perpetual pavement responses. Transportation Research Record: Journal of the
Transportation Research Board 2095: 53–61.
Wang, H, IL Al-Qadi and I Stanciulescu (2012) Simulation of tyre–pavement interaction for predicting contact stresses at static and various rolling conditions. International Journal of Pavement Engineering
13, no.4: 310–321.

Appendix A: Summary of styles used in the research reports
53
Appendix A: Test procedure
A1 Test tyres The first trial tyres were pneumatic Deli Tire 4.10/3.50 x 6 with a loading range of 191 kg at 36P.S.I (2.5 Bar).
The current tyre is a 13x5.00-6 Deli Tire S365 Turf 4PR. This is a non-kevlar tubeless tyre with square-shouldered turf tread pattern and max inflation pressure 40 PSI.
A2 Sand-cast aluminium plates The sample plates used for thin surface testing are fabricated using sand-cast aluminium. These plates contain a textured top surface which provides some degree of ‘key-in’ for the thin surface samples. This is to stop the chip from quickly shearing on top of a flat steel plate and resemble some of the mechanical interlock that occurs in successive surface layers on the road.
A pattern of the sample plate was cut by 3D CNC mill. Using silicone moulding rubber a silicone pattern was taken of a grade 5 chip seal sample prepared in the laboratory. The silicone pattern was then laid into the plate pattern and sand cast.
The patterns can be used repeatedly and when a different texture is required a new silicone pattern of the relevant texture can be prepared, laid into the plate pattern and new plates cast.

Effect of road seal type on resistance to traffic stresses
54
Sand-cast aluminium grade 5 chip texture
A3 Project information A3.1 CAST setup
The following CAST setup details will be required before testing commences:
• record of a maintenance inspection of the CAST machine and the date of this inspection
• tyre pressure set and recorded (KPa)
• tyre tread depth measured and recorded (mm)
• wheel load set and recorded (kg).
A3.2 Test method
To ensure minor variations between materials are accurately measured and reported, all testing will be completed and recorded in accordance with the test method developed for each specific material.
The test method will:
• define the number of test and control samples required for the testing

Appendix A: Summary of styles used in the research reports
55
• provide a unique identifier for each test and control sample
• determine the placement of test and control samples within the track
• specify the temperature for the samples and for the enclosure for each phase of the testing
• specify any pre-testing measurements to be taken
• specify the number of tyre passes or duration of time for each phase of the testing
• specify the type of measurements to be made following the completion of each phase of the testing
• specify the type of measurements to be made at the completion of the testing
• specify the number and duration of testing phases
• document the photographic record required of test and control samples to be taken before testing starts, at set intervals throughout the testing and upon completion of the testing. (This may include pairs of photographs required for the determination of change from the testing.)
A3.3 Analysis by photo-grammetry
Photogrammetry is a technique where, typically, a pair of images of the test plate is taken at the point of interest. The images are called a ‘stereo pair’, which enables the creation of a three-dimensional volume representing the test surface. This is done via a software package, Topcon Imagemaster, in which camera properties, reference points and other information on the images are fed into the software.
In principle, the purpose of the image analysis is to compare the texture of the test plates at various stages of testing against the ‘zero’ (original) position as well as against other test plates. The capacity of testing four plates simultaneously enables checks for test method consistency if the four test plates are prepared identically, or enables comparisons between variables (eg binder type, seal design, seal age, texture).
The information generated from the image analysis technique is:
• surface area (high surface area often equates to rough surface)
• upper and lower volume/the volume above and below a chosen reference plane (this often provides an indication of the further embedment and/or chip loss)
• mean profile depth via a dataset of relative texture heights (highs and lows of the surface).
A3.4 Reporting
To ensure the results of all CAST testing is consistent, clear and available, reporting will be completed using the standard Opus report format with an electronic copy of all reports stored on the network drive under the project name and number.