research report access to opportunity through equitable
TRANSCRIPT

RE S E A R C H RE P O R T
Access to Opportunity through Equitable Transportation Lessons from Four Metropolitan Regions
Christina Stacy Yipeng Su Eleanor Noble Alena Stern
Kristin Blagg Macy Rainer Richard Ezike
October 2020
R E S E A R C H T O A C T I O N L A B

A B O U T T H E U R BA N I N S T I T U TE The nonprofit Urban Institute is a leading research organization dedicated to developing evidence-based insights that improve people’s lives and strengthen communities. For 50 years, Urban has been the trusted source for rigorous analysis of complex social and economic issues; strategic advice to policymakers, philanthropists, and practitioners; and new, promising ideas that expand opportunities for all. Our work inspires effective decisions that advance fairness and enhance the well-being of people and places.
Copyright © October 2020. Urban Institute. Permission is granted for reproduction of this file, with attribution to the Urban Institute. Cover photo by Dusan Petkovic/Shutterstock.

Contents Acknowledgments v
Access to Opportunity through Equitable Transportation 1 Historic and Current Drivers of Inequitable Transportation 3
Legacy of Exclusion 3 Gentrification, the Suburbanization of Poverty, and Spatial Mismatch 4 Legacy Cities and Population Decline 5 Insufficient Funding 6 Environment and Climate 6 Emerging Mobility Technologies 7 Transportation as a Solution 8
Case Studies of Four Metropolitan Regions 9 Seattle 10 Lansing 12 Baltimore 14 Nashville 15
Key Challenges across Metro Regions 16 Metro Regions Lack a Shared Definition of Transportation Equity 17 Fragmented Systems and Overlapping Jurisdictions Impede Transportation Equity 19 A Lack of Housing and Land Use Coordination Can Exacerbate Disparities 19 Insufficient Funding Impedes Equitable and Innovative Transportation Solutions 21
Opportunities across Regions 22 Decisions through Deep and Meaningful Community Engagement 22 Creating Partnerships 23 Accurate and Timely Equity Metrics 25
Metrics to Help Guide Equitable Transportation Decisions 26 Spatial Mismatch 26 Access to Jobs via Public Transit for First Day and Night Shift Workers 32
How Do We Move toward a More Inclusive Transportation Network? 37
Appendix A. Methodology 39 Interview Protocol Development 39 Identifying Interviewees 39 Conducting Interviews 39 Analysis 40 Convening 40

I V C O N T E N T S
Appendix B. Supplemental Tables and Figures 41
Notes 46
References 47
About the Authors 51
Statement of Independence 52

A C K N O W L E D G M E N T S V
Acknowledgments This brief was funded by the Mastercard Impact Fund, in collaboration with the Mastercard Center for
Inclusive Growth. Thank you in particular to Daniel Barker and Ali Schmidt-Fellner who served as
thought partners throughout this process. We are grateful to them and to all our funders, who make it
possible for Urban to advance its mission.
The views expressed are those of the authors and should not be attributed to the Urban Institute,
its trustees, or its funders. Funders do not determine research findings or the insights and
recommendations of Urban experts. Further information on the Urban Institute’s funding principles is
available at urban.org/fundingprinciples.
We are very grateful to the community and city leaders from the Lansing, Michigan; Seattle,
Washington; Baltimore, Maryland; and Nashville, Tennessee, metropolitan regions who provided input
into this research through interviews, a convening, and review of the report.

Access to Opportunity through Equitable Transportation Transportation is key to accessing such opportunities as employment, education, and
health care. But not everyone has equal access to high-quality, reliable, and safe
transportation. For example, wealth differences between people of color and non-
Hispanic whites make it easier for white residents to purchase a car, giving them
increased access to jobs and subsequent higher employment rates (Gautier and Zenou
2010). Public transit that is inaccessible for the elderly and people with disabilities can
leave transit-dependent residents stranded. And unreliable transit, particularly at off-
peak work hours, means that people who work irregular schedules often have no safe or
affordable way to get to work (Giuliano and Narayan 2005; Rast 2004; Sanchez, Shen,
and Peng 2004). Improved access to high-quality, reliable, and accessible transportation
could help connect people to resources, jobs, and services. These connections could help
address disparities in the distribution of opportunities by race and income (Dawkins,
Jeon, and Pendall 2015; Gautier and Zenou 2010; Pendall et al. 2014).
However, leaders making decisions about expanding or cutting transportation services often lack
clear definitions and measures of equity with which to make these choices (Manaugh, Badama, and El-
Geneidy 2015). Generally, social equity goals and objectives are not translated into clearly specified
objectives, and plans often lack appropriate measures for meaningfully assessing their achievement
(Manaugh, Badama, and El-Geneidy 2015). Because of this, metropolitan planning organizations often
focus more on the local environment (and congestion reduction) than on social equity in their planning.
Pedestrian and bicycle equity impacts also often go overlooked, resulting in an inequitable distribution
of active transportation costs and benefits (Lee, Sener, and Jones 2017). A lack of clear definitions and
metrics also makes it difficult for communities to hold leaders accountable to equitable outcomes.
In this report, we examine transportation equity and inclusion in different types of metropolitan
regions and explore how these regions might track and improve transportation equity over time. We
draw on case studies of four Metropolitan Statistical Areas (MSAs) facing different barriers to providing
equitable transportation: the Seattle, Washington, MSA, a West Coast region that faces exponential
growth and housing affordability issues; the Lansing, Michigan, MSA, a smaller Midwestern metro with a
state capital and university; the Baltimore, Maryland, MSA, an East Coast metro with fiscal challenges

2 A C C E S S T O O P P O R T U N I T Y T H R O U G H E Q U I T A B L E T R A N S P O R T A T I O N
and a declining population; and the Nashville, Tennessee, MSA, a sprawling southern metro with
population growth but low population density in many areas. We look holistically at transportation—
including cars, public transportation, walking, biking, and new modes like e-scooters—to develop an
understanding of equity that can apply across diverse metros with different transportation options. For
the remainder of the report, we use “transportation” to include all these different modes.
We found that although these regions face very different barriers to providing equitable
transportation, they share common challenges:
Metropolitan regions lack a shared definition of transportation equity. This creates competing
priorities between transportation leaders, planners, politicians, and advocates.
Fragmented systems and overlapping jurisdictions impede regional transportation equity
decisionmaking and implementation.
A lack of coordination with local land use, zoning, and housing agencies can unintentionally
exacerbate disparities through displacement, gentrification, or inadequate transit access in
certain neighborhoods.
Insufficient funding and a lack of dedicated funding from non-transportation related sources,
can make it difficult for agencies to plan for the future and discourage innovative and equitable
transit systems.
We also identified opportunities that all metro regions could take to further transportation equity:
Transportation decisions should be made through deep and meaningful community
engagement with low-income and other historically excluded residents.
Regional leaders should partner with employers, new mobility services, and educational
institutions to fill transportation gaps.
Regions need better data to track transportation equity and tools to help them prioritize equity
when making transportation decisions.
In this report, we first review the historic and current drivers of inequitable transportation, and
then describe how transportation equity plays out in our four case-study metropolitan regions. We also
identify key takeaways for building more equitable transportations. To demonstrate the importance of
shared measures of transportation equity, we then highlight some proposed equity metrics for our case
study regions and show how decisions can be made around these metrics.

A C C E S S T O O P P O R T U N I T Y T H R O U G H E Q U I T A B L E T R A N S P O R T A T I O N 3
BOX 1
What Is Transportation Equity?
For this report, we use the definition of transportation equity below that we created in collaboration
with community representatives from our four case-study metropolitan regions. We suggest that each
region come up with its own definition of transportation equity that matches its unique barriers and
community needs.
Transportation equity means that transportation decisions are made with deep and meaningful community input that leads to transportation networks and land use structures that support health and well-being, environmental sustainability, and equitable access to resources and opportunities.
Historic and Current Drivers of Inequitable Transportation
Historic segregation and exclusion by race and income, combined with a car-centric culture and funding
structures, function as systemic barriers to providing equitable transportation. Unique challenges
stemming from a metropolitan area’s socioeconomic characteristics also shape transportation needs.
Legacy of Exclusion
The contemporary transportation landscape in the US was shaped by the rise of automobile ownership
and the federal funding and mass construction of interstate highways across the country beginning in
the 1950s (Weber 2012). While white households were able to move to the suburbs and drive to the
city, racially discriminative lending practices, such as redlining and racially restrictive covenants, and
income disparities restricted home purchase choices for many African Americans (Turner and Skidmore
1999; Woods 2012). Highway construction and parking lots in downtown areas destroyed and
displaced many African American neighborhoods, resulting in the crowding and clustering of
communities of color (Karas 2015). These residential patterns defined by race and income are still
prevalent today (Hendey 2017; Kijakazi et al. 2016; Theodos et al. 2019).
Car-centric culture and planning dominate funding decisions and transportation systems today,
making it challenging to fund multimodal and equitable transit systems. In 2015, about 17 percent of the
$32.2 billion federal expenditure went into railroads and highways, compared with 0.4 percent for

4 A C C E S S T O O P P O R T U N I T Y T H R O U G H E Q U I T A B L E T R A N S P O R T A T I O N
transit. For state and local governments, 69 percent of the total $297.3 billion expenditure went into
highways, compared with 22 percent that went into transit (Bureau of Transportation Statistics 2018).
As a result, the automobile is still the dominant mode of transportation in trips and miles traveled,
leading to negative externalities such as pollution, congestion, and the exacerbation of health, income,
and racial disparities (Parry, Walls, and Harrington 2007; Rachele et al. 2017; Zimmerman and
Anderson 2019).
Gentrification, the Suburbanization of Poverty, and Spatial Mismatch
Since the early 2000s, some US cities have experienced an influx of younger, higher-income, and, in
many cases, whiter residents who have increasingly chosen to live closer to downtown business districts
(Baum-Snow and Hartley 2017; Couture and Handbury 2019; Edlund, Machado, and Sviatschi 2015;
Richardson, Mitchell, and Franco 2019). This economic and demographic shift has led to gentrification
of many neighborhoods, and subsequent displacement of low-income, Black, immigrant, and Latino
families (Richardson, Mitchell, and Franco 2019). Although gentrification may boost economic activity
in some neighborhoods, it may also pressure incumbent residents, especially low-income renters, to
move elsewhere in search of affordable housing (Brummet and Reed 2018).
In some cities, increased density in the urban core by higher-income residents has led to the
displacement of lower-income residents into the suburbs. While increased density near the urban core
can create the population base needed for sustainable transit, the suburbanization of poverty has
created challenges for providing equitable transportation. Growth of poverty in the nation’s suburbs,
which accounted for nearly half the total national increase in the poor population between 2000 and
2015 (Kneebone and Berube 2013), increased commute times for lower-income residents and created
pressure on transportation agencies to expand services to less dense areas. These suburban areas are
rarely served by frequent and reliable transit besides to downtown areas, leaving residents
disconnected from many suburban job centers.
This spatial mismatch between where jobs are located and where job seekers live has caused high
unemployment rates and longer spells of joblessness among lower-paid workers (Andersson, Klaesson,
and Larsson 2014; Brueckner and Zenou 2003). Black residents, women, and older workers are more
sensitive to job accessibility than other subpopulations (Andersson et al. 2018). Though increased
investments in transportation could help reduce commute times for these workers, new transit
investments can, absent proper anti-displacement efforts, lead to an increase in housing prices and a
lack of affordable rental units for low-income renters, who are more likely to be people of color (Martin

A C C E S S T O O P P O R T U N I T Y T H R O U G H E Q U I T A B L E T R A N S P O R T A T I O N 5
and Beck 2018; NLIHC 2019). Transportation investments, and potential subsequent gentrification,
may displace and increase inequitable outcomes for communities who could have benefited the most
from transit access (Rayle 2015; Revington 2015).
Equitable and quality transportation systems can help address spatial mismatch and increase
upward economic mobility. According to Raj Chetty’s Equality of Opportunity project, shorter commute
times are a significant predictor of upward economic mobility (Chetty et al. 2014). Reduced commute
times and costs could decrease the unemployment rate among disadvantaged communities and
increase equity in employment and income.
Legacy Cities and Population Decline
In legacy cities, a loss of the manufacturing industry and decades of population decline and suburban
flight have led to the opposite problem: disinvestment in the urban core and the concentration of
higher-income residents in the suburbs (Mallach 2012). Some cities have been able to harness assets to
explore new economic opportunities, but the uneven distribution of resident socioeconomic
characteristics, declining property values, and the physical environment in the urban core are still
impeding revitalization in many places (Mallach and Brachman 2013). As a result, the central city—
which often bears the burden of funding transit—lacks the tax base to support a robust and equitable
transportation infrastructure.
Research has shown that generic regional growth policies and industry cluster-based economic
development strategy do not address urban poverty without strategies targeted at specific economic
outcomes and areas (Lynch and Kamins 2012). Many residents left in the urban core of such cities
experience poverty and the loss of jobs. Absent adequate multimodal transportation choices that
connect these residents to jobs and services, revitalization will likely concentrate in certain areas of the
city while other parts remain in distress (Mallach and Brachman 2013).
In legacy cities, competition for limited resources constrains planners’ ability to pursue additional
transportation options (Ganning 2014). This constraint is compounded as decreasing population density
limits the efficiency of public transportation (Schwanen and Mokhtarian 2005). Legacy cities are faced
with difficult decisions that pit concerns about gentrification and displacement against efforts to
improve transportation access for low-income households (Tighe and Ganning 2015).

6 A C C E S S T O O P P O R T U N I T Y T H R O U G H E Q U I T A B L E T R A N S P O R T A T I O N
Insufficient Funding
Insufficient funding for transit also creates challenges for providing equitable transportation. Although
most metropolitan regions have their own public transit systems, the vast majority of these systems
operate with a deficit. Of the more than 2,192 mass transit systems in the United States, only 4 percent
had fare revenue that exceeded operating expenses in 2018.1 Transit agencies with limited resources
must therefore choose between providing transportation in less dense areas with more transit-
dependent riders and in denser areas where most ridership take place.2 When transit agencies have to
scale back services, maintaining the more lucrative services for routes with higher ridership often leaves
the transit-dependent riders with even fewer choices.3
The imbalance between capital and operating costs and revenues is not just a challenge for public
transit systems. The Federal Highway Trust Fund, which funds roads and rail construction across the
country and mostly relies on federal excise tax on gasoline and diesel fuel, has had difficulty keeping up
with its obligations and is projected to have shortfalls by the end of 2021 (GAO 2019). Motor fuel taxes
are also the primary way state and local governments pay their share for transportation projects. To
keep up with inflation and costs, many states have proposed increasing their gas taxes. But total vehicle
miles traveled and gasoline consumption has slowed since 2008, compared with 1990–2008 trends
(Irwin 2019), resulting in less revenue from these politically unpopular taxes. Similarly, decisions about
transportation investments that balance need and use could exacerbate inequities in accessing different
modes of transportation across regions.
Environment and Climate
Transportation is also inextricably linked with the environment and climate. In 2018, the transportation
sector accounted for 28 percent of the total greenhouse gas emissions in the US (EPA 2020).4 In
addition, passenger vehicles are a source of major air pollutants, including carbon monoxide, nitrogen
oxides, particulate matter, and sulfur dioxide (EPA 2017). These pollutants can damage immune systems
and cause respiratory and other health problems, especially in urban areas that have higher
concentrations of emissions.
Pollution-imposed health risks disproportionally affect communities of color and lower-income
populations. African Americans and Latinos disproportionately bear the burden from atmospheric fine -
particulate-matter pollutions. Non-Hispanic whites experience 17 percent less air pollution than they
create by their consumption, yet African Americans and Latinos experience 56 percent and 63 percent
more pollution than they create (Tessum et al. 2019). This disparity can be partly explained by

A C C E S S T O O P P O R T U N I T Y T H R O U G H E Q U I T A B L E T R A N S P O R T A T I O N 7
communities of color, people born outside the US, and people who speak a language other than English
at home living closer to highways and industrial facilities (Boehmer et al. 2013).
Decarbonization of the transportation sector—by changing individual behavior and developing
more efficient transportation modes—would mitigate these disproportionate negative environmental
impacts and improve air quality overall. Evidence-based strategies for accomplishing this goal include
introducing carbon taxes (Marron and Toder 2014), mandating higher standards for energy efficiency of
vehicles (Siskos, Capros, and De Vita 2015), subsidizing electric vehicles and clean energy (Holland et al.
2016), promoting and investing in public transit and nonmotorized transit options, and increasing urban
density (Younger et al. 2008).
Emerging Mobility Technologies
New technologies such as ride hailing, bike sharing, and electric scooters have expanded transportation
options for many US residents. However, these new mobility options may not always increase equity
(Greene et al. 2019). Recent research has shown that passengers with Black-sounding names face
longer wait times for shared rides than passengers with non-Hispanic white-sounding names (Ge et al.
2016). A study in Washington, DC, found that drivers are more likely to cancel rides for riders whose
profiles indicate they are people of color or support for LGBT rights.5
For bike sharing and other nonmotorized mobility choices, the equitable distribution of
infrastructure and services is also a challenge. Research on seven bike share systems in the US shows an
inequitable distribution of physical access to stations by social and economic characteristics (Su and
Wang 2019; Ursaki and Aultman-Hall 2015).6 Most ride-sharing or ride-hailing mobility services require
a smartphone to install the application, and many require a bank account or at minimum a prepaid card.
This digital divide could also exacerbate inequities in access for lower-income people, users without
bank accounts, and others who do not have smartphones (Shaheen and Cohen 2018).
Although ride-hailing services provide additional choice for populations and communities with
limited public transportation options, the research is mixed on whether these services increase or
reduce the use of public transit and traffic congestion. One study found that ride hailing actually
increased public transit ridership by 5 percent on average after two years (Hall, Palsson, and Price
2018), but another found that ride-hailing contributed to growing traffic congestion (Erhardt et al.
2019). A survey of ride-hailing passengers in Boston found that more than two in five passengers would
have otherwise taken transit, biked, or walked (Gehrke, Felix, and Reardon 2019). These additional car
trips can create more pollution than the transportation choices they displace.7 Ride-hailing, ride sharing,

8 A C C E S S T O O P P O R T U N I T Y T H R O U G H E Q U I T A B L E T R A N S P O R T A T I O N
or carpooling, which can put multiple passengers in the same ride, appears to reduce congestion and be
more environmentally friendly (Li, Hong, and Zhang 2016). Nevertheless, ride-hailing is a small fraction
of the services provided by major transportation network companies; and, under the most optimistic
shared ride adoption, the services on net generate more traffic (Schaller 2018).
A recent report by the Urban Institute on new mobility technology and equity in cities highlighted
that while many cities and transit agencies are using requests for proposals and permits to try to
regulate and incentivize equitable practices, many transportation agencies have not directly addressed
the role of new mobility in equitable transit provision in recent transportation plans (Fedorowicz et al.
2020). Box 2 lists key next steps and considerations for addressing equity in new mobility technologies.
BOX 2
New Mobility Technologies and Equity
Cities are using the new mobility space to lean into process improvements and incorporate equity into
their transportation systems. Cities must identify equity goals in advance, identify equity gaps in
existing systems, and position new technology to bridge those gaps. Research reveals several
mechanisms medium-size cities are using to take these steps:
Flexible agreements such as requests for proposals, permits, and pilots allow cities to test and
embed equity mandates into new mobility operations.
Intermediary data companies can help medium-size cities increase data capacity, navigate data
privacy laws, and manage relationships with new mobility companies.
Collaboration across jurisdictions and sectors is key to building out a transportation
infrastructure that is critical for new mobility use.
Cities can hardwire equity considerations into their operations by recalibrating internal
structures and integrating equity guidance in their strategic plans.
Source: Martha Fedorowicz, Emily Bramhall, Mark Treskon, and Richard Ezike, New Mobility and Equity: Insights for Medium Size
Cities (Washington, DC: Urban Institute, 2020).
Transportation as a Solution
Transportation is key to addressing and reducing disparities in income, health, and well-being.
Metropolitan planning organizations (MPOs) and others have definitions and measures of equity, but
reviews have found their efforts particularly lacking (Golub and Martens 2014; Manaugh, Badami, and
El-Geneidy 2015; Martens, Golub, and Robinson 2012). While previous research has identified the need

A C C E S S T O O P P O R T U N I T Y T H R O U G H E Q U I T A B L E T R A N S P O R T A T I O N 9
for equitable transportation and the common barriers faced across cities, it has focused less on the
unique barriers different types of metropolitan regions face. Two regions may face inequitable access to
transportation for different reasons. For instance, the transportation equity challenges in a dense
downtown area may differ from those in a rural suburb. Prior research also lacks information on the
exact measures and tools that would help leaders make equity a core part of transportation decisions.
Case Studies of Four Metropolitan Regions
To better understand how different types of regions understand and measure transportation equity and
the barriers they face to providing equitable transportation, we studied four representative places: the
Seattle-Tacoma-Bellevue, Washington, MSA; the Baltimore-Columbia-Towson, Maryland, MSA; the
Lansing-East Lansing, Michigan, MSA; and the Nashville-Davidson-Murfreesboro-Franklin, Tennessee,
MSA.
To select these four regions, we used five criteria: population, unemployment rate, sprawl, racial
segregation, and census-defined statistical region (table 1). These criteria helped us select a diverse
group of areas with different contexts for addressing access to opportunity through transportation. We
prioritized including at least one sprawling metro, one smaller city that has rural areas, one high-cost
city, and one large legacy city. We also wanted one MSA from each Census-defined statistical region of
the country (Northeast, South, Midwest, and West).
TABLE 1
Case Study Metro Areas
MSA Population Unemployment rate Sprawl
Racial segregation
Census region
Seattle-Tacoma-Bellevue, WA Large Low Fairly dense
Low West
Baltimore-Columbia-Towson, MD
Large High Fairly dense
High Northeast
Lansing-East Lansing, MI Small High Middle High Midwest
Nashville-Davidson-Murfreesboro-Franklin, TN
Large Low Sprawling Low South
Source: Author’s calculations from 2013–2017 American Community Survey data and Reid Ewing and Shima Hamidi, Measuring
Sprawl 2014 (Washington, DC: Smart Growth America, 2014).
Notes: Population = people ages 16 years or older, above or below 500,000; unemployment rate = unemployment rate compared
with average of all MSAs; Sprawl = based on designations by Smart Growth America’s sprawl ranking; Racial segregation =
author’s calculation of MSA Black-white dissimilarity index; Region = based on four census-defined regions.

1 0 A C C E S S T O O P P O R T U N I T Y T H R O U G H E Q U I T A B L E T R A N S P O R T A T I O N
We interviewed key transportation leaders and decisionmakers from each case study metro region,
including government officials, transit authorities, planners, and community organizers or advocates.
We also held a convening with representatives from these regions to discuss differences and similarities
across the regions. For a full description of the methodology, see appendix A.
Though these regions face very different barriers to providing equitable transportation, they also
face some common challenges. Below, we briefly describe the key themes for each region.
Seattle
The Seattle-Tacoma-Bellevue Metropolitan Statistical Area includes the three most populous counties
in Washington State: King, Snohomish, and Pierce (figure 1). The region has seen a surge in its high-
income population and is facing challenges from increased income disparities, gentrification, and a lack
of housing affordability near transit-rich areas.
The Seattle metro region has one of the largest public transit systems in the country. Its four major
public transportation agencies—King County Metro, Sound Transit, Pierce Transit, and Community
Transit—offer commuter buses, rail, regional express buses, water taxi, and paratransit services within
and across counties. In 2019, total annual ridership exceeded 180 million.
The Seattle metro region also has several programs and frameworks for transportation equity. The
King County Metro Mobility Framework, developed by King County Metro (Metro) and the Metro
Transportation Equity Cabinet, helps guide Metro’s strategic plan to provide equitable and sustainable
transportation. And, the Seattle DOT has transportation equity programs that address affordability and
broader transportation equity goals. Major programs include Low-Income Transit Access, the Youth
ORCA (One Regional Card for All) contactless smart card system for public transit in the Puget Sound
region, the vehicle license rebate programs and community conversation, and the ambassador program.
These programs aim to help the transportation system serve both historically excluded communities,
such as low-income communities and people of color, and the unmet transportation needs of people
with disabilities and limited-English-speaking communities.

A C C E S S T O O P P O R T U N I T Y T H R O U G H E Q U I T A B L E T R A N S P O R T A T I O N 1 1
FIGURE 1
Seattle Metro Region Major Public Transit Lines
URBAN INSTITUTE
Sources: US Census Bureau 2018 TIGER/Line Shapefiles; transit lines from King County Metro, Community Transit, Pierce
Transit accessed via Transitland (https://transit.land/feed-registry/).
Note: Displayed transit lines are from public transit agencies that publish General Transit Feed Specification feeds.
Our housing market in the past eight or so years has shot up. In the city, transit actually
reaches a lot of people, but with gentrification and displacement a lot of people in the rest of
the county don’t have nearly as good transit service.—Katie Wilson, campaign coordinator at
Transit Riders Union in Seattle

1 2 A C C E S S T O O P P O R T U N I T Y T H R O U G H E Q U I T A B L E T R A N S P O R T A T I O N
Yet the region still faces many challenges coordinating among several transit systems, providing
and promoting safe pedestrian and bike routes, and continuing to serve underserved communities while
weathering budget cuts. Washington State’s passage of Initiative 976 cut vehicle license fees to a flat
rate of $30 in most cases and barred local communities from passing their own vehicle fees. These cuts
are projected to cause a loss of $1.9 billion in state revenue and $2.3 billion in local government revenue
over six years (Washington State Office of Financial Management 2019),8 which would lead to funding
and service cuts in state and local transportation programs.9
Lansing
The Lansing-East Lansing Metropolitan Statistical Area is a three-county region in central Michigan
(figure 2). It includes the City of Lansing, which houses the state capital, and East Lansing, which includes
Michigan State University. It is the third-largest MSA in the state.
The Capital Area Transportation Authority (CATA) offers bus routes and paratransit throughout
the urban and rural areas of the metro region. CATA also provides special bus service for MSU and
other education institutions such as Lansing Community College and Coolly Law School. Total annual
ridership exceeds 11 million. Lansing was also the first city in Michigan to pass a Complete Street
Ordinance and the first to adopt a nonmotorized plan for the city. Yet a car-centric culture dominates
because of the automotive industry in the state and the lower density of the region compared with the
other metropolitan regions we study in this report. More than 90 percent of households in 2018 own at
least one car, according to census data.
Lansing is more affordable to live in that the other case-study metro regions, so it is less concerned
about gentrification and displacement. However, the region faces similar challenges as the other
regions with coordinating transit investment and service decisions across jurisdictions.
Different cities have different issues, and Lansing may be different than other cities. Lansing
is proud to be the most affordable city in the nation. As such, we focus on growth, and this is
boosting all parts of our city while not creating displacement or gentrification.
—Andy Schor, mayor of Lansing

A C C E S S T O O P P O R T U N I T Y T H R O U G H E Q U I T A B L E T R A N S P O R T A T I O N 1 3
FIGURE 2
Lansing Metro Region Major Public Transit Lines
URBAN INSTITUTE
Sources: US Census Bureau 2018 TIGER/Line Shapefiles; transit lines from Capital Area Transportation Authority, accessed via
Transitland (https://transit.land/feed-registry/).
Note: Displayed transit lines are from public transit agencies that publish General Transit Feed Specification feeds.
1 4 A C C E S S T O O P P O R T U N I T Y T H R O U G H E Q U I T A B L E T R A N S P O R T A T I O N
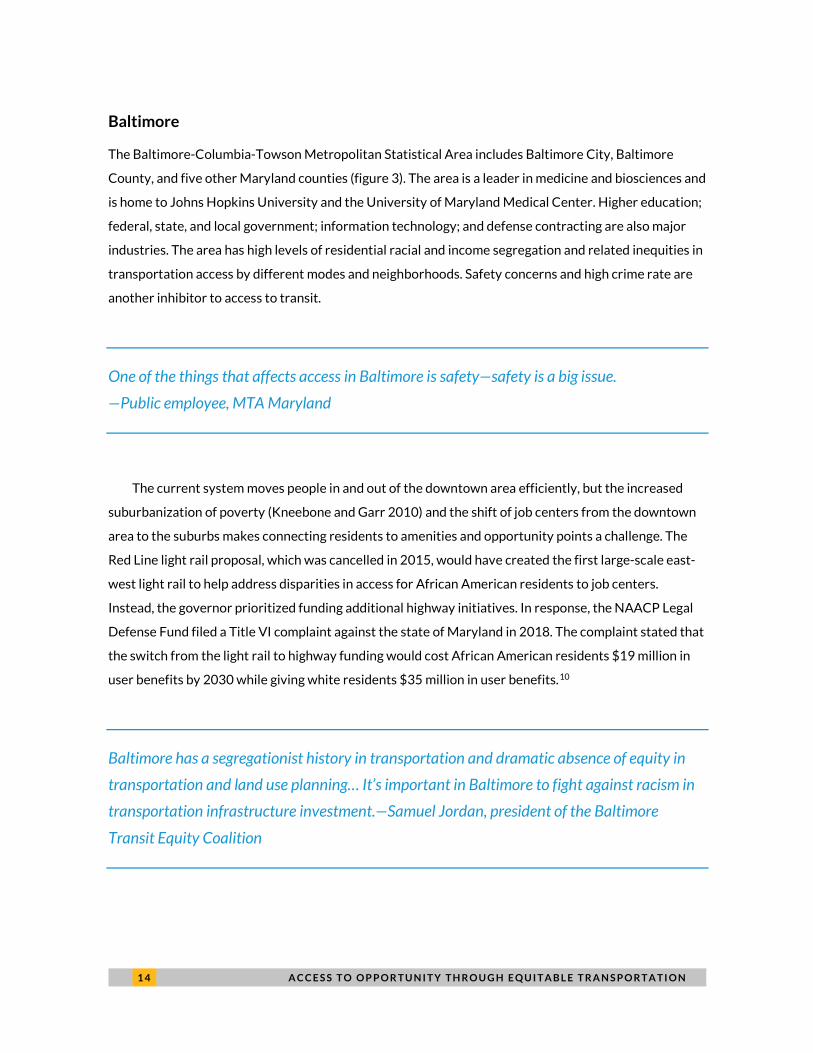
Baltimore
The Baltimore-Columbia-Towson Metropolitan Statistical Area includes Baltimore City, Baltimore
County, and five other Maryland counties (figure 3). The area is a leader in medicine and biosciences and
is home to Johns Hopkins University and the University of Maryland Medical Center. Higher education;
federal, state, and local government; information technology; and defense contracting are also major
industries. The area has high levels of residential racial and income segregation and related inequities in
transportation access by different modes and neighborhoods. Safety concerns and high crime rate are
another inhibitor to access to transit.
One of the things that affects access in Baltimore is safety—safety is a big issue.
—Public employee, MTA Maryland
The current system moves people in and out of the downtown area efficiently, but the increased
suburbanization of poverty (Kneebone and Garr 2010) and the shift of job centers from the downtown
area to the suburbs makes connecting residents to amenities and opportunity points a challenge. The
Red Line light rail proposal, which was cancelled in 2015, would have created the first large-scale east-
west light rail to help address disparities in access for African American residents to job centers.
Instead, the governor prioritized funding additional highway initiatives. In response, the NAACP Legal
Defense Fund filed a Title VI complaint against the state of Maryland in 2018. The complaint stated that
the switch from the light rail to highway funding would cost African American residents $19 million in
user benefits by 2030 while giving white residents $35 million in user benefits.10
Baltimore has a segregationist history in transportation and dramatic absence of equity in
transportation and land use planning… It’s important in Baltimore to fight against racism in
transportation infrastructure investment.—Samuel Jordan, president of the Baltimore
Transit Equity Coalition

A C C E S S T O O P P O R T U N I T Y T H R O U G H E Q U I T A B L E T R A N S P O R T A T I O N 1 5
FIGURE 3
Baltimore Metro Region Public Transit Lines
URBAN INSTITUTE
Sources: US Census Bureau 2018 TIGER/Line Shapefiles; transit lines from Baltimore MTA, City of Baltimore Department of
Transportation, Charm City Circulator, Harbor Connector accessed via Transitland (https://transit.land/feed-registry/).
Note: Displayed transit lines are from public transit agencies that publish General Transit Feed Specification feeds.
Nashville
The Nashville-Davidson-Murfreesboro-Franklin Metropolitan Statistical Area (MSA) makes up a large
portion of central Tennessee, encompassing 13 counties, including the principal cities of Nashville,
Murfreesboro, and Franklin (figure 4). The MSA is home to about two million residents. Rapid
population growth in the region has brought increased traffic congestion to the area (Greater Nashville
Regional Council 2019), prompting calls for new investment in public transportation.
A car-centric culture and the belief that public transportation is unsafe and low-quality also makes
it challenging to raise funding for investments in transit. Interviewees stated that many residents do not
see themselves benefiting from the system.

1 6 A C C E S S T O O P P O R T U N I T Y T H R O U G H E Q U I T A B L E T R A N S P O R T A T I O N
FIGURE 4
Nashville Metro Region Major Public Transit Lines
URBAN INSTITUTE
Sources: US Census Bureau 2018 TIGER/Line Shapefiles; transit lines from Nashville MTA, WeGo Public Transit, RTA, Franklin
Transit Authority, Clarksville Transit System accessed via Transitland (https://transit.land/feed-registry/).
Note: Displayed transit lines are from public transit agencies that publish General Transit Feed Specification feeds.
Our region is growing so fast... It’s a car culture so there’s a reluctance to pay more in taxes
even though we are one of the lowest taxed areas, for our population, in the country.
—Transportation advocate, Nashville
Key Challenges across Metro Regions
In our more than 20 interviews with stakeholders across the four case-study metro regions, the
conversations focused on identifying barriers to equitable access to opportunity. We heard that
because the transportation sector is fast paced, innovative, and solutions oriented, leaders often

A C C E S S T O O P P O R T U N I T Y T H R O U G H E Q U I T A B L E T R A N S P O R T A T I O N 1 7
overlook the complex and interconnected nature of barriers to equitable service provision.
Respondents told us that while many decisionmakers in their regions are aware of the connections
between transportation and access to opportunity, equity is not always at the forefront of planning and
decisionmaking. When equity is incorporated into planning or policy, a shared understanding of equity
goals can lead to increased collaboration among transportation stakeholder groups.
Metro Regions Lack a Shared Definition of Transportation Equity
All stakeholders said inequitable access to opportunity was a key concern, but they prioritized different
areas. Stakeholder groups identified varying needs faced by individuals, communities, and organizations
within the same metro region (table 2; see also box 3).
TABLE 2
Most Frequently Cited Barriers to Ensuring Equitable Access to Transportation
Top challenges cited within the case study regions varied by stakeholder group
Government officials and MPOs Planners Advocates and nonprofits Political and geographic
fragmentation Lack of political will by others
to prioritize transportation Dominant car-centric
infrastructure
Lack of coordination with housing and land use agencies
Increased commute times for low-wage workers
Legacy of racist planning practices without meaningful community engagement
Lack of dedicated funding Car-centric infrastructure and
culture Not prioritizing access
disparities in race, income, gender, and ability
Structural racism
Each region has multiple barriers to creating an equitable transportation system. Further,
transportation decisions frequently happen at many different political scales. From MPO regional
transportation plans to neighborhood-level engagement, varied understandings of the importance of
equity—or what it takes to create an equitable transit system—can produce competing agendas. Shared,
large-scale equity goals are key to supporting leaders making difficult decisions across groups.
In regions like Nashville with a strong history of car-centric transportation planning and policy,
creating shared goals about investing in public transit is difficult. When politicians and citizens defeated
a proposed measure to increase taxation for public transit expansion in 2018 advocates realized they
needed to build a stronger and larger coalition with explicit shared priorities. For future bills to pass,
advocates, politicians, and planners needed to be able to articulate why funding public transportation is
a top equity issue.

1 8 A C C E S S T O O P P O R T U N I T Y T H R O U G H E Q U I T A B L E T R A N S P O R T A T I O N
BOX 3
Defining Transportation Equity
The community and city leaders we consulted agreed that definitions of equity should be metro specific
to guide the creation of accurate transportation metrics that address varied regional needs. This should
be done in collaboration with the communities most disadvantaged by segregation and a lack of transit,
such as low-income residents, people of color, and people with varying accessibility needs such as those
in wheelchairs or those with visual impairments.
Though transportation equity definitions will vary, leaders across all four metro regions emphasized
five common challenges:
Equity across modes: It is important that every citizen can access a mode of transportation that
fits their needs and that the costs (both in time and money) are equitable across modes.
Significantly higher travel times for people without access to a car and transportation costs that
are prohibitive for low-income populations indicate inequitable transportation systems.
Quality transportation infrastructure and experience across mode: It does not matter if
networks provide many options for riders if all the options are low-quality. Important
dimensions of quality include reliability (whether transit comes at its scheduled time), safety,
time of day available for different transit options (particularly for third-shift workers), cost
(both in time and money), and number of transfers needed.
Acknowledging varied need across the region: Options are important, but recognizing
constraints can help transportation decisionmakers create realistic, flexible, and equitable
solutions that work for residents across the region. For example, large-scale public transit
infrastructure expansion is not feasible for very low-density or rural areas. People living in high-
density urban areas should recognize that access to public transit will be prioritized over
accommodating individual car-use.
Disparities in residents’ health outcomes: The lack of quality transportation infrastructure in
low-income and majority–people of color neighborhoods can prevent active transportation
modes like biking and walking and increase collision rates.a Inadequate transportation access to
quality jobs can also impact resident income and subsequent health outcomes (Lynch and
Kaplan 1997).
Environmental sustainability: MPOs and transit authorities should incorporate long-term
emission and waste reduction as equity goals. Transportation is the largest carbon emitter in
the US, and the neighborhoods where low-income households and people of color live are
disproportionately exposed to the subsequent air pollution (Clark, Millet, and Marshall 2017).
a “Equity: Relationship to Public Health,” US Department of Transportation, accessed September 23, 2020,
https://www.transportation.gov/mission/health/equity.
A C C E S S T O O P P O R T U N I T Y T H R O U G H E Q U I T A B L E T R A N S P O R T A T I O N 1 9
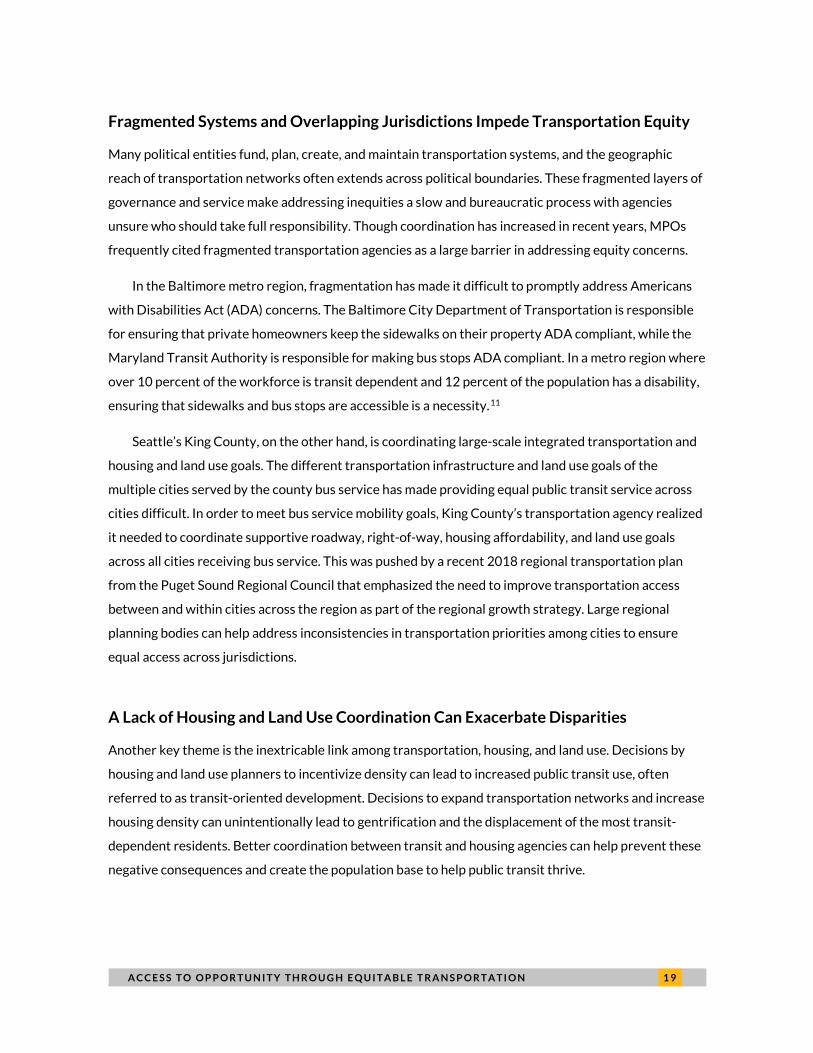
Fragmented Systems and Overlapping Jurisdictions Impede Transportation Equity
Many political entities fund, plan, create, and maintain transportation systems, and the geographic
reach of transportation networks often extends across political boundaries. These fragmented layers of
governance and service make addressing inequities a slow and bureaucratic process with agencies
unsure who should take full responsibility. Though coordination has increased in recent years, MPOs
frequently cited fragmented transportation agencies as a large barrier in addressing equity concerns.
In the Baltimore metro region, fragmentation has made it difficult to promptly address Americans
with Disabilities Act (ADA) concerns. The Baltimore City Department of Transportation is responsible
for ensuring that private homeowners keep the sidewalks on their property ADA compliant, while the
Maryland Transit Authority is responsible for making bus stops ADA compliant. In a metro region where
over 10 percent of the workforce is transit dependent and 12 percent of the population has a disability,
ensuring that sidewalks and bus stops are accessible is a necessity.11
Seattle’s King County, on the other hand, is coordinating large-scale integrated transportation and
housing and land use goals. The different transportation infrastructure and land use goals of the
multiple cities served by the county bus service has made providing equal public transit service across
cities difficult. In order to meet bus service mobility goals, King County’s transportation agency realized
it needed to coordinate supportive roadway, right-of-way, housing affordability, and land use goals
across all cities receiving bus service. This was pushed by a recent 2018 regional transportation plan
from the Puget Sound Regional Council that emphasized the need to improve transportation access
between and within cities across the region as part of the regional growth strategy. Large regional
planning bodies can help address inconsistencies in transportation priorities among cities to ensure
equal access across jurisdictions.
A Lack of Housing and Land Use Coordination Can Exacerbate Disparities
Another key theme is the inextricable link among transportation, housing, and land use. Decisions by
housing and land use planners to incentivize density can lead to increased public transit use, often
referred to as transit-oriented development. Decisions to expand transportation networks and increase
housing density can unintentionally lead to gentrification and the displacement of the most transit-
dependent residents. Better coordination between transit and housing agencies can help prevent these
negative consequences and create the population base to help public transit thrive.

2 0 A C C E S S T O O P P O R T U N I T Y T H R O U G H E Q U I T A B L E T R A N S P O R T A T I O N
We heard that transportation agencies in metro regions with gentrifying neighborhoods face
difficulties planning for increased access to opportunities. In these cases, the suburbanization of
poverty has left the most transit-dependent residents in areas without active transportation
infrastructure and sufficient public transit access. However, in other cities, transit dependent residents
live in the urban core, while higher income residents reside in the suburbs. In these types of regions,
some transit agencies have faced organized racist backlash when attempting to expand public
transportation to increase access to amenities in white suburban neighborhoods. These agencies
emphasized the importance of access to disaggregated and timely data showing population shifts,
coordinating with housing agencies to create appropriate anti-displacement policies, and countering
misinformed stigma with large-scale regional planning goals and data.
A lot of suburban areas electorally don’t support transit service.
—Anna Zivarts, community organizer in Seattle
The transportation needs of residents in rural areas have often been overlooked. We heard that
these residents are often forced to solely rely on car-ownership to access necessities. While expanding
public transit service to extremely low-density residential areas is not a viable model for transit
agencies attempting to serve rural communities, there are promising new models. New first- and last-
mile alternatives like Lansing’s on-demand rural service shuttles that connects rural residents to other
transit lines, as well as subsidized private partnerships with ride-hailing companies, are expanding the
reach of transit networks.
We also heard that a lack of available funding for transportation projects across housing and land
use agencies have stymied holistic planning efforts. For example, Baltimore County surrounds the city
of Baltimore, but the county government does not receive any transportation funding. This has led to a
lack of incentive for transportation planning, which often becomes low priority for the county
government, making coordinated housing, land use, and transportation decisionmaking difficult. This
has also made partnerships and planning difficult when decisionmakers try to increase transportation
access to new housing developments.
MPOs and large-scale decisionmakers also stated that commonly used metrics in decisionmaking
overlook the interconnectedness of housing and transportation. For instance, regional planning

A C C E S S T O O P P O R T U N I T Y T H R O U G H E Q U I T A B L E T R A N S P O R T A T I O N 2 1
documents often prioritize income and housing burden metrics when looking at resident disparities and
priority areas. These metrics overlook the additional cost burdens of car ownership, long commutes,
and high transit fares. Ignoring these transit costs can obscure the additional cost burdens of spatial
mismatch.
To some communities, particularly those who have been historically victimized by the
transportation planning and decisionmaking process, the transportation system can be
viewed as a weapon pointed directly at them.—Anthony Foxx, former US secretary of
transportation
Insufficient Funding Impedes Equitable and Innovative Transportation Solutions
A lack of dedicated funding for transportation was one of the most frequently mentioned barriers by all
stakeholders. Federal grants to state and local governments have declined drastically since 2007, and
without dedicated funding sources, transit projects are at the whim of fluctuating government budgets
and annual appropriations. This lack of stable funding makes long-term shifts difficult and incentivizes
approaching changes project by project rather than addressing network gaps.
All the metro regions also stated that uncertainty around transportation budgets was a top concern:
The motor vehicle excise tax in Seattle, also known as car tabs, has recently been contested in
the State Supreme Court. This could result in Seattle’s public transit system losing billions of
dollars.
State legislation across regions often caps taxation rates and does not provide dedicated
funding sources, meaning additional strains on transit systems are not met with proportional
increases in funding or new funding streams. This often correlates with how “car-centric” a
metro region is (i.e., Nashville has a harder time taxing for public transit than Seattle)
In Michigan, the governor’s proposed gas tax was rejected by both parties in the state house.
This would have drastically increased dedicated funding for Lansing’s transportation agency.
Maryland has a dedicated gas tax, but the Maryland Transit Authority has faced large public
budget cuts that have left the system with extensive capital and accessibility needs and a $2
billion funding shortfall

2 2 A C C E S S T O O P P O R T U N I T Y T H R O U G H E Q U I T A B L E T R A N S P O R T A T I O N
Opportunities across Regions
While leaders from our four case-study regions noted different barriers to providing equitable
transportation, key opportunities across the regions also emerged. The rapidly changing transportation
landscape has led to many new opportunities for innovative, forward-thinking solutions.
Representatives from the case-study regions believe that transportation leaders are more willing than
ever to implement equitable and data-driven decisions in collaboration with communities. To do so,
stakeholders emphasized the need for community engagement, innovative partnerships, and timely
equity-focused data to guide decisionmaking.
Decisions through Deep and Meaningful Community Engagement
As described above, transportation planning has historically overlooked communities of color,
immigrants, and poor households. Policymakers often request feedback on new proposals rather than
engaging with community members to understand their concerns and co-create solutions.
Lessons learned are door knocking, going to community meetings, going to neighbors instead
of expecting them to come to you.—Colleen Synk, transit advocate and operations
coordinator at Safe Routes to School in Lansing, Michigan
We also heard that while citizens are consulted about transportation decisions more frequently
than they have been, the frequently overlooked communities still often lack decisionmaking power. In
Nashville, Baltimore, and Seattle, this led advocates, community organizations, and nonprofits to create
their own planning, report development, and engagement to articulate their communities’ needs. For
example, Nashville’s Envision Nolensville Pike Collaborative convened community leaders and
surveyed residents to understand the street-level transportation possibilities for creating a safe and
economically thriving commercial corridor in a majority–Kurdish and Latino neighborhood. In
Baltimore, the Transportation Alliance created its own transportation report card to emphasize often-
overlooked economic disparities, lack of mode choice, and health outcomes. These community-led data
collections and analyses have pushed some transportation agencies to recognize the importance of
engaging directly with historically underrepresented residents and riders.

A C C E S S T O O P P O R T U N I T Y T H R O U G H E Q U I T A B L E T R A N S P O R T A T I O N 2 3
Stakeholders in the case-study metro regions mentioned transportation leadership positions
needed socioeconomic and racial diversity for innovative and equitable decisionmaking. MPOs,
planners, and politicians stated that the makeup of their organizations does not reflect the
socioeconomic and racial demographics of the users they are serving. Some metro regions have
prioritized creating career pipelines and opportunities for upward job mobility as a long-term goal.
Others have focused on short-term efforts, such as ensuring that boards or committees with
decisionmaking power include members with diverse lived experiences, community representatives,
and people with varied transportation needs. This is a first step in building long-lasting community
partnerships.
Creating Partnerships
If I were a mayor right now, I would bring my transportation director in and say, “How can we
bring public and private options together?”—Anthony Foxx, former US secretary of
transportation
While all our case-study regions mentioned the need for funding to create an inclusive network, many
are filling transportation gaps through innovative partnerships. Coordination with educational
institutions, employers, and emerging micromobility and ride hailing companies have made transit
systems increasingly interconnected across geographic boundaries, multimodal, and better equipped to
create quick and flexible solutions to transit needs.
For metro regions with rural areas, suburban neighborhoods, small towns, disconnected
employment destinations, or historically under-connected neighborhoods, transit agencies have found
success partnering with employers or subsidizing private first mile/last mile trips. In the beginning of
2020, the City of Baltimore created a six-month pilot partnership with Lyft that provides up to eight
rides a month for residents living in areas classified as food deserts. For a flat rate of $2.50, residents are
able to hail a private ride to grocery stores. This program has yet to be evaluated and continued funding
is not guaranteed, but it has laid the groundwork for future partnerships to address a lack of
transportation access for transit-dependent riders in various other scenarios. Though there are equity
concerns about the future of ride-hailing and micromobility solutions (as discussed in box 4), this

2 4 A C C E S S T O O P P O R T U N I T Y T H R O U G H E Q U I T A B L E T R A N S P O R T A T I O N
program was quickly implemented to meet a specific resident need—unlike many public transit pilot
programs, which often take years of planning.
Lansing successfully expanded its regional transit network by partnering with a long-standing
educational institution. In 2018, Michigan State University gave integral support to Lansing’s transit
authority in an agreement that provided free service to all students, staff, and faculty on campus; the
agreement also subsidized student public transportation travel throughout the region. Unlike many
metro regions where private university transportation systems compete with public transit, the high
level of student ridership has continuously supported Lansing’s strong bus network.
BOX 4
The Role of Emerging Technology, Ride-Hailing, and Micromobility
Private-sector innovations in transportation technology, mode, and availability are an emerging
priority, according to many city leaders and advocates. As private ride-hailing services and
micromobility modes (like e-scooters and e-bikes) become more prevalent in transportation landscapes
across the country, questions around regulation and access have made some city leaders skeptical of
their ability to increase equitable transit access. Common concerns include the following:
the ability of unbanked riders to access the services
ADA sidewalk compliance when scooters block walking paths
missing standard safety regulations
the lack of large-scale equity goals and priorities in the tech industry
Many transit authorities, however, are intrigued and excited to partner with new private
technology firms for various reasons:
New micromobility modes can disincentivize car use and replace short car trips.
Ride-hailing can provide a flexible alternative to shortfalls in first- and last-mile public transit
service provision.
Baltimore’s MPO, on the other hand, faced difficulties when large-scale employers used commuter
shuttles and parking subsidies, which unintentionally disincentivized public transit use. Private
employers were frustrated with the quality of Baltimore’s public transit service, but the MPO seemed
open to future partnerships that addressed the mismatch in service provision and access to jobs.
Increasing access to real-time, disaggregated commuter data would help transit authorities partner,

A C C E S S T O O P P O R T U N I T Y T H R O U G H E Q U I T A B L E T R A N S P O R T A T I O N 2 5
rather than compete, with employers and use the subsequent high ridership levels to support their
strong bus networks.
While many of these partnerships with transit agencies produced innovative new transportation
equity approaches, large systemic changes require strong transportation equity leaders and
collaborations across federal, state, and local governments, the private sector, public transit agencies,
institutions, nonprofits, and grassroots organizers. The Transit Alliance of Middle Tennessee, a
nonprofit in Nashville, has attempted to educate and convene local community leaders to advance
regional transit funding. The alliance has engaged local elected officials, the Nashville Area chamber of
commerce, Vanderbilt University, businesses, faith groups, and private funders around a shared
understanding of the necessity of high-quality and equitable transportation. Yet, the alliance was unable
to convince the county to increase mass transit funding in the Let’s Move Nashville plan or to remove
tax caps at the state level. Local housing and tenant’s rights groups also opposed the Let’s Move
Nashville plan, stating that it did not center equity for low-income Nashville residents and could result
in gentrification. Assessing the landscape of potential coalition partners and strategies is greatly
dependent on funding sources, local and state political climates, and the most pressing transportation
needs. Similar to the priorities laid out in our stakeholder definition of transportation equity, these
coalitions should also center the voices of historically excluded groups, incorporate housing and land
use into their advocacy platform, and prioritize equity.
Accurate and Timely Equity Metrics
Transportation leaders emphasized that equitable decisions should use data that incorporate a metro
region’s specific needs and questions. We heard from all metro regions that quality equity data are most
needed when quick and difficult service provision decisions have to be made. When transit agencies in
our case-study regions faced large public transit budget cuts, keeping routes with high ridership was
often prioritized over ensuring that the network served all neighborhoods and rider groups fairly. In
these cases, new data on disparate impacts of route or service cuts by rider group or geography would
have helped transit agencies incorporate equity into these difficult decisions.
Transit authority leaders also noted that equity metrics should focus on equity in internal processes
as well as on equitable transportation access for residents. When Seattle’s regional transit authority
decided to collect data on equitable processes, it was surprised by what it found. After creating an
internally focused equity dashboard, the transit authority realized that it lost nearly 300 employees
yearly. This put a strain on their HR department’s ability to hire a large and diverse staff and called in

2 6 A C C E S S T O O P P O R T U N I T Y T H R O U G H E Q U I T A B L E T R A N S P O R T A T I O N
question the agency’s working conditions and pathways for upward mobility. Internal equity–focused
data helped create actionable priorities for increasing staff diversity at every level.
Leaders stated that equity is often not at the forefront of decisionmaking; when it is, there is a lack
of data to support arguments that challenge the status quo. We heard that metro regions needed
quality data to fill the following knowledge gaps:
how transportation needs and access to opportunity varies within a metro region
the impact of population shifts and housing shifts on transportation access
how access varies by mode of transportation
Metrics to Help Guide Equitable Transportation Decisions
To help make equity a core part of all transportation decisions, we create a set of metrics so our case-
study regions can identify inequities by neighborhood and better target transportation and other
investments.
To create these measures, we generate a matrix of transportation times from every block group to
every other block group in each metro region. We then overlay opportunity points—such as jobs,
schools, libraries, and hospitals—to calculate a competition-adjusted measure of job accessibility, and
from that a measure of spatial mismatch between low-wage workers. In this report, we highlight
disparities in access to jobs.
Spatial Mismatch
To identify neighborhoods in need of transportation investments, we first use a gravity model building
off Shen (2001) to calculate job accessibility for low-wage workers in each block group, divided by the
number of other low-wage job seekers competing for each job that is accessible to that block group (see
the methods appendix for the details of this model). We calculate the number of job opportunities
within a 30-minute commute using a weighted combination of the traffic-adjusted drive time (for the
share of people in the block group who commute via car) and the public transit time (for the share of
people in the block group who commute via public transit).

A C C E S S T O O P P O R T U N I T Y T H R O U G H E Q U I T A B L E T R A N S P O R T A T I O N 2 7
Using this job accessibility measure, we create a measure of spatial mismatch between low-wage
workers and jobs to identify neighborhoods in need of transportation and other investments. To do so,
we standardize the job accessibility measure, subtract it from 1 so a higher value signifies worse access,
and multiply it by a standardized measure of the low-wage labor force.
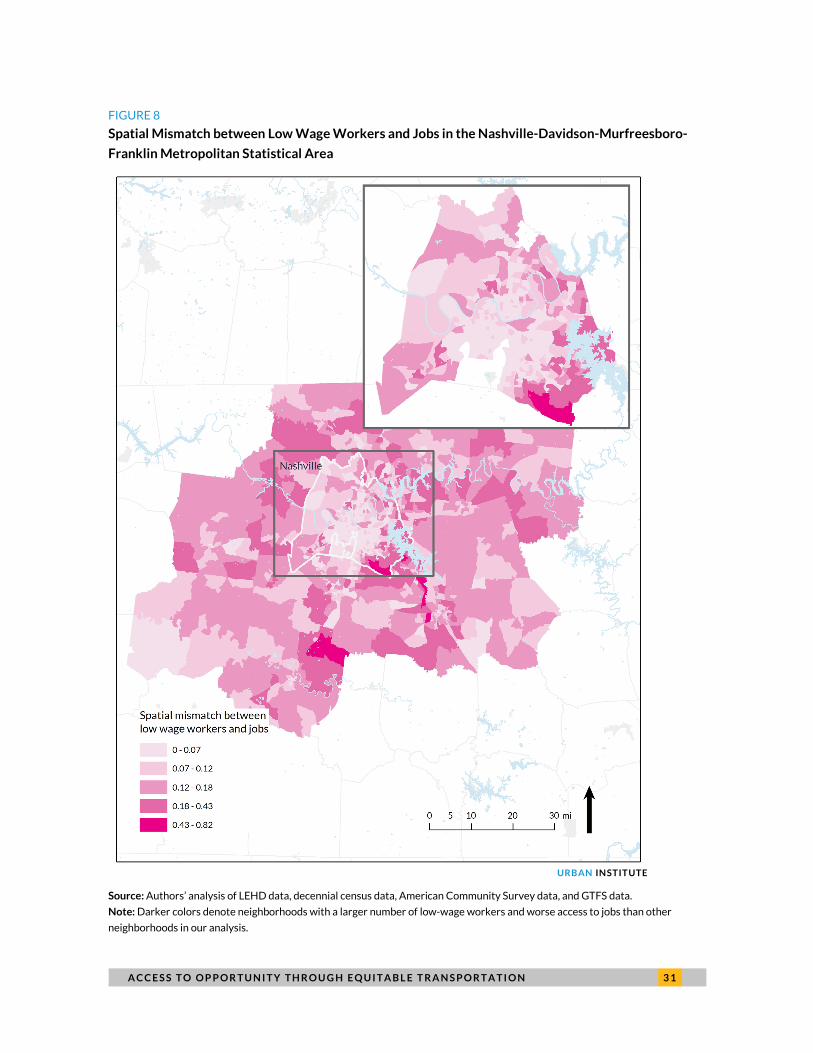
Figures 5 through 8 show spatial mismatch in our four MSAs, where darker colors represent higher
levels of mismatch for low-wage job seekers, meaning that those neighborhoods have higher numbers
of low-wage workers and worse access to jobs than other neighborhoods in our analysis.
In Seattle and Nashville, cities with high population growth, spatial mismatch for low-wage workers
is most prevalent in the suburbs. These types of high-growth cities have seen an influx of relatively high-
income earners (Baum-Snow and Hartley 2019) that has led to a residential and employment
resurgence (Couture and Handbury 2019) and the gentrification of many historically low-income
neighborhoods in the central city (Edlund, Machado, and Sviatschi 2019). This has pushed incumbent
residents, especially low-income renters, to move elsewhere in search of affordable housing (Brummet
and Reed 2019), increasing typical commute times for low-income workers.
In legacy cities, such as Baltimore and Lansing, a loss of the manufacturing industry and decades of
population decline and suburban flight have led to the opposite problem: disinvestment in the urban
core and the concentration of higher-income residents in the suburbs (Mallach 2012). This economic
segregation, plus declining property values and construction obstacles, have impeded revitalization in
these cities (Mallach and Brachman 2013). As a result, the central city—which often bears the burden of
funding transit—lacks the tax base to support an equitable transportation infrastructure.
In these cities, we see similar rates of job accessibility in the central city as in the suburbs, as
opposed to in Nashville and Seattle where we observe much higher rates of job access in the central
cities. We also see higher numbers of low wage workers in the suburbs than in the cities. Because of
these two factors, the suburbs still have higher rates of mismatch than the urban core. Figures B.1
through B.4 in appendix B shows job accessibility for low wage workers and the number of workers in
the low wage labor force, the two inputs into our spatial mismatch measures, zoomed in to the central
cities of the four case study regions.

2 8 A C C E S S T O O P P O R T U N I T Y T H R O U G H E Q U I T A B L E T R A N S P O R T A T I O N
FIGURE 5
Spatial Mismatch between Low-Wage Workers and Jobs in the Seattle-Tacoma-Bellevue
Metropolitan Statistical Area
URBAN INSTITUTE
Source: Authors’ analysis of LEHD data, decennial census data, American Community Survey data, and GTFS data.
Note: Darker colors denote neighborhoods with a larger number of low-wage workers and worse access to jobs than other
neighborhoods in our analysis.

A C C E S S T O O P P O R T U N I T Y T H R O U G H E Q U I T A B L E T R A N S P O R T A T I O N 2 9
FIGURE 6
Spatial Mismatch between Low-Wage Workers and Jobs in the Lansing-East Lansing Metropolitan
Statistical Area
URBAN INSTITUTE
Source: Authors’ analysis of LEHD data, decennial census data, American Community Survey data, and GTFS data.
Note: Darker colors denote neighborhoods with a larger number of low-wage workers and worse access to jobs than other
neighborhoods in our analysis.
3 0 A C C E S S T O O P P O R T U N I T Y T H R O U G H E Q U I T A B L E T R A N S P O R T A T I O N
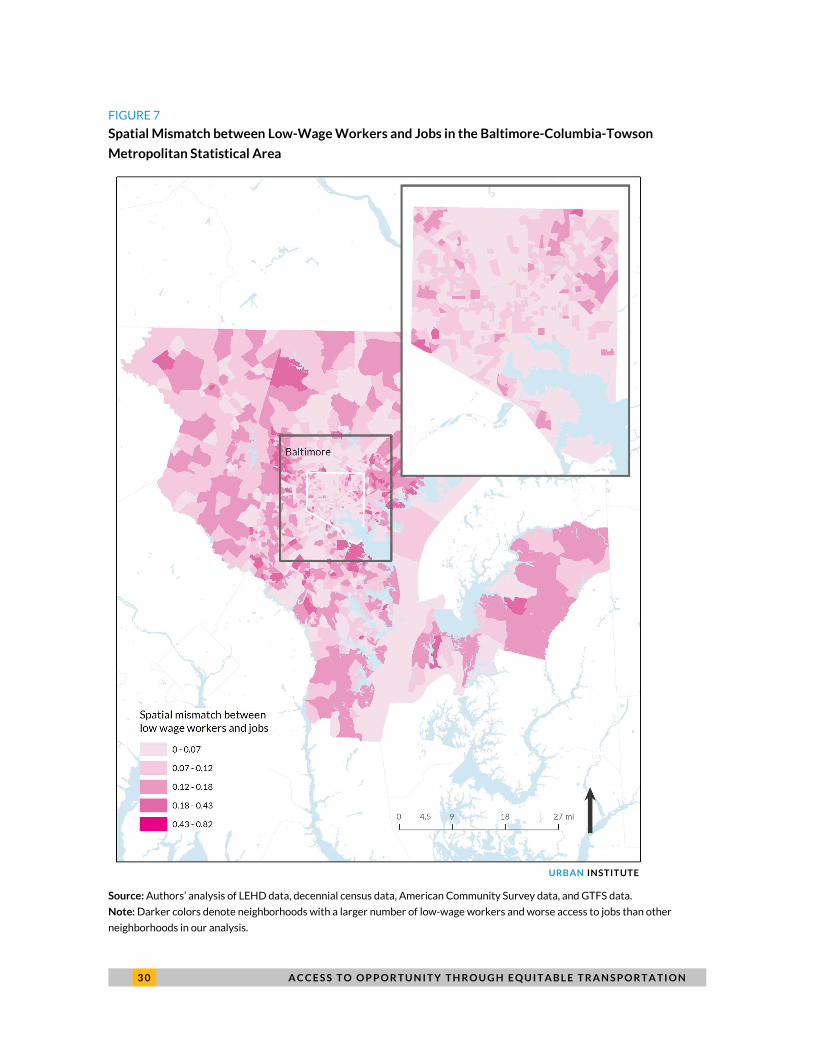
FIGURE 7
Spatial Mismatch between Low-Wage Workers and Jobs in the Baltimore-Columbia-Towson
Metropolitan Statistical Area
URBAN INSTITUTE
Source: Authors’ analysis of LEHD data, decennial census data, American Community Survey data, and GTFS data.
Note: Darker colors denote neighborhoods with a larger number of low-wage workers and worse access to jobs than other
neighborhoods in our analysis.
A C C E S S T O O P P O R T U N I T Y T H R O U G H E Q U I T A B L E T R A N S P O R T A T I O N 3 1
FIGURE 8
Spatial Mismatch between Low Wage Workers and Jobs in the Nashville-Davidson-Murfreesboro-
Franklin Metropolitan Statistical Area
URBAN INSTITUTE
Source: Authors’ analysis of LEHD data, decennial census data, American Community Survey data, and GTFS data.
Note: Darker colors denote neighborhoods with a larger number of low-wage workers and worse access to jobs than other
neighborhoods in our analysis.

3 2 A C C E S S T O O P P O R T U N I T Y T H R O U G H E Q U I T A B L E T R A N S P O R T A T I O N
Though average mismatch rates are lower in the central city than in the suburbs in Baltimore,
significant disparities within the city exist. These patterns follow those of the “black butterfly“,12 or the
shape of segregated black communities in Baltimore that take the shape of a butterfly across the
eastern and western part of the city. These patterns mirror many of the capital flow patterns still seen in
the city,13 which could be partly to blame for the high rates of mismatch in these neighborhoods.
Aggregate measures can conceal these neighborhood-level disparities, illustrating the importance of
localized data for decision-making.
Equitable and high quality transportation systems can help address these spatial disparities and
increase residents’ upward economic mobility, since shorter commute times are a significant predictor
of upward economic mobility (Chetty et al. 2014). But transportation planners must also consider that
investments in transportation can sometimes cause increases in housing prices and gentrification (Rayle
2015), which can displace low-income communities (Revington 2015). As such, leaders should enact
land use and housing policies in tandem with transportation investments that ensure that residents are
able to remain in place after new or enhanced train lines and bus stops are put in.
Housing and land use planners can use the job accessibility measures (figures B.1 through B.4 in
appendix B) to identify areas with high job accessibility to locate new affordable housing developments.
They can use the spatial mismatch measures to identify areas with low job accessibility and a high
number of low wage workers to target transportation and economic development investments to
connect people to jobs.
Access to Jobs via Public Transit for Day and Night Shift Workers
Since many Americans rely on public transit to get to work or other services, and since average
commute times for late-shift workers who take public transit (who are disproportionately low-income
people of color) are twice as long as those for workers with car access (APTA 2019), we also created
metrics of access to jobs via public transit for both day and night shift workers. Figures 9 through 12
show access to jobs via public transit at peak commuting time and the middle of the night for our four
case study metros, zoomed in to the central city.

A C C E S S T O O P P O R T U N I T Y T H R O U G H E Q U I T A B L E T R A N S P O R T A T I O N 3 3
FIGURE 9
Access to Jobs via Public Transit at Peak and Late-Shift Hours in Seattle
URBAN INSTITUTE
Source: Authors’ analysis of LEHD data, decennial census data, American Community Survey data, and GTFS data.
Note: Darker colors denote neighborhoods with greater access to jobs via public transit than other neighborhoods in our analysis.

3 4 A C C E S S T O O P P O R T U N I T Y T H R O U G H E Q U I T A B L E T R A N S P O R T A T I O N
FIGURE 10
Access to Jobs via Public Transit at Peak and Late-Shift Hours in Lansing and East Lansing
URBAN INSTITUTE
Source: Authors’ analysis of LEHD data, decennial census data, American Community Survey data, and GTFS data.
Note: Darker colors denote neighborhoods with greater access to jobs via public transit than other neighborhoods in our analysis.

A C C E S S T O O P P O R T U N I T Y T H R O U G H E Q U I T A B L E T R A N S P O R T A T I O N 3 5
FIGURE 11
Access to Jobs via Public Transit at Peak and Late-Shift Hours in Baltimore
URBAN INSTITUTE
Source: Authors’ analysis of LEHD data, decennial census data, American Community Survey data, and GTFS data.
Note: Darker colors denote neighborhoods with greater access to jobs via public transit than other neighborhoods in our analysis.

3 6 A C C E S S T O O P P O R T U N I T Y T H R O U G H E Q U I T A B L E T R A N S P O R T A T I O N
FIGURE 12
Access to Jobs via Public Transit at Peak and Late-Shift Hours in Nashville
URBAN INSTITUTE
Source: Authors’ analysis of LEHD data, decennial census data, American Community Survey data, and GTFS data.
Note: Darker colors denote neighborhoods with greater access to jobs via public transit than other neighborhoods in our analysis.
For workers in Lansing and Nashville, car-centric cultures have helped limit job accessibility. Even
though the Capital Area Transportation Authority (CATA) in Lansing offers bus routes and paratransit
throughout the urban and rural areas of the metro region and the city was the first to adopt a non-
motorized plan,14 suburban low-wage workers without a car still lack access to jobs concentrated in the
central city. In Nashville, rapid population growth has increase traffic congestion, but a local belief that
public transportation is unsafe has made new investments challenging.
Transit-dependent workers in Seattle and Baltimore have relatively high access to jobs via public
transit. The Seattle region has one of the largest public transit systems in the country and therefore has
relatively high access to jobs for low wage workers via transit both during the day and at night, but
region-specific challenges still pose issues for low-wage workers. In Seattle, a surge in its high-income
population has created a lack of housing affordability near transit-rich areas, and in Baltimore,
residential racial and income segregation makes connecting residents to amenities and opportunity
points a challenge.
Some municipalities are considering new mobility technologies like ride sharing for flexible
transportation services to serve low-income, transit dependent late-shift workers (Fedorowicz et al.

A C C E S S T O O P P O R T U N I T Y T H R O U G H E Q U I T A B L E T R A N S P O R T A T I O N 3 7
2020). Others have expanded existing routes to serve late night and early morning workers, like King
County and Seattle who partnered to create the “Night Owl bus service.” Although each region’s
individual characteristics will define what improvements are needed, more services like these can
ensure that late shift workers have a safe, reliable way to get to work.
Increasing access to public transit is also important for people with disabilities, who are often
transit dependent. Adults with disabilities are twice as likely to have inadequate transportation as
adults without disabilities, and transportation challenges cause over half a million people with
disabilities to never leave their homes.15
Across our four metro regions, very few transit agencies reported any information on wheelchair
accessibility, and planners in each region reported that paratransit users felt restricted by the
prescheduled pickups and wait times. More data is needed on the accessibility of transit systems
because without it, local stakeholders will struggle to identify where investments are most needed.
How Do We Move toward a More Inclusive Transportation Network?
Metro regions across the country face pressing challenges in ensuring equitable access to opportunity
for all citizens. Transportation can play a key role in addressing access disparities. However, metro
regions face very different barriers to ensuring transportation equity. To create and implement
solutions that increase opportunity, leaders need to understand the varying needs of individuals,
neighborhoods, networks, and regions.
Additionally, although equity is increasingly part of transportation discussions, it is often undefined
and understood differently among stakeholder groups. This can result in competing community
priorities and unintentionally exacerbate disparities.
Although our case study regions face different needs and barriers, we found that transportation
leaders and decisionmakers faced the common challenges of understanding what transportation
equity means, giving weight to the voices of historically excluded and underserved groups, addressing
the interconnectedness of housing and transportation, and lacking adequate funding and data.
Based on these findings, we identified six steps that cities can take to achieve equitable
transportation goals:

3 8 A C C E S S T O O P P O R T U N I T Y T H R O U G H E Q U I T A B L E T R A N S P O R T A T I O N
1. Metro regions need to define transportation equity in partnership with historically excluded
residents.
2. Transportation departments need dedicated funding sources to allow for equitable and
innovative transportation decisions.
3. Transportation decisions need to include meaningful community engagement with low-
income and other historically excluded residents.
4. Local land use, zoning, and housing agencies must coordinate to ensure that transportation
investments increase equity rather than exacerbate disparities.
5. Land use planning (particularly relating to housing) must keep equity as a guiding principle to
make equitable transportation feasible.
6. Cities should collect better data to track transportation equity and work with partners to
create tools to help them make transportation decisions with equity as a key consideration.
While our study can help us understand the common barriers to providing transportation equity
faced by four archetypical metro regions, as well overarching opportunities for increasing
transportation equity, there are limitations. By prioritizing a deep dive into four places, we may have
lacked the capacity or scope to identify challenges faced by other metro regions. By focusing on barriers
to transportation equity, we also do not fully cover the innovative efforts by transportation leaders to
address inequity. From activists in Nashville organizing for increased citywide funding to planners in
Baltimore putting the needs of riders with disabilities first in the planning process, many changemakers
are addressing the most pressing transportation challenges head on.
While this research offers a starting point and framework for improving transportation equity that
can help cities increase equity in access to opportunity, cities could further benefit from better data and
a toolkit of policy solutions to help them achieve increased equity. Too often, transportation decisions
are made quickly and with limited resources, resulting in disparate access impacts. Readily available and
relevant data that account for varied needs within metro regions can help push decisionmakers to put
equity first.

A P P E N D I X A 3 9
Appendix A. Methodology
Interview Protocol Development
We created an interview protocol based on the following research questions:
What are the unique challenges and barriers metropolitan regions face in providing equitable
transportation to its residents?
How are decisions made about transportation system planning?
What’s the most useful way to measure transportation equity to support decision making?
Identifying Interviewees
To fully capture the diverse voices and perspectives in the transportation space across our four selected
metropolitan regions, we used a purposive sampling strategy that prioritized interviews with four key
stakeholder groups: government officials, city planners, advocates, and other transit-related groups
such as transit workers or riders. To identify and reach out to those stakeholder groups, we conducted a
basic online scan of relevant organizations and employees in each metro region. We reached out to
interviewees through multiple channels including email, phone, Twitter, LinkedIn, and Facebook.
We also used snowball sampling by following up with additional regional transportation
stakeholders suggested by interviewees.
We offered a $100 Amazon gift card compensation for each advocate and nonprofit worker that
participated in the interviews. We gave out nine gift cards in total.
Conducting Interviews
The interviews were confidential, and at the beginning of each interview, we asked for the person’s
permission to record the interview for note-taking purpose. The interviews took about 30–60 minutes
depending on how much people want to share.
Recordings were then transcribed by Landmark Associates for analysis.

4 0 A P P E N D I X A
Analysis
We conducted 20 interviews. Transcripts were then coded and analyzed in Nvivo, based on the
interview protocol. Nodes and subnodes were adjusted based on the major themes across all
interviews.
Key themes were then summarized to help understand the project’s three research questions.
TABLE A.1
Interviews by Region and Type
Region Total Government Planner Advocate Transit
worker/other
Baltimore 5 3 0 2 0
Nashville 5 0 1 4 0
Seattle 5 1 1 2 1
Lansing 4 1 1 1 1
DC/MISC 1 0 0 1 0
Convening
For additional input and insights, we invited at least one interviewee from each region to our convening
in February, along with additional stakeholders that were not interviewed. We plan to incorporate
suggestions and key takeaways from the convening to the report.

A P P E N D I X B 4 1
Appendix B. Supplemental Tables and Figures TABLE B.1
Case Study Metropolitan Region Demographics
Baltimore, MD Lansing, MI Nashville, TN Seattle, WA MSA City MSA City MSA City MSA City
2018 population 2,802,789 620,961 481,893 115,222 1,932,099 654,187 3,939,363 688,245 Poverty rate (%) 10.10 22.40 14.50 27.10 11.60 17.20 8.70 12.50 MSA unemploy-ment rate (Dec. 2019) (%) 2.90 3.30 3.5 3.6 2.40 2.60 2.70 3.30 Median house-hold income ($) 80,469 46,641 59,494 38,642 34,879 52,858 87,910 79,565
Demographic information (%) White 56.00 27.60 76.00 55.10 72.00 55.60 62.00 65.30 Black 28.80 62.30 9 21 15.00 27.70 6 7 Hispanic or Latino (any race) 6 5 7.00 12.20 7.00 10.40 10.00 6.50 American Indian/ Alaska Native 0.20 0.20 0.00 0.30 0.00 0.30 1.00 0.50 Asian 5.60 2.60 5.00 3.70 3.00 3.60 14.00 14.40 Native Hawaiian and other Pacific Islander 0 0 0.00 0.00 0.00 0.10 1.00 0.40 Other 0.40 0.30 0.00 0.20 0.00 2.20 0.00 0.30 Two or more races (excluding Hispanic/Latino) 3.00 2.10 3.00 7.50 2.00 2.20 6.00 5.80

4 2 A P P E N D I X B
FIGURE B.1
Job Accessibility and the Low-Wage Labor Force in Seattle
Source: Authors’ analysis of LEHD data, decennial census data, American Community Survey data, and GTFS data.
Note: Darker colors denote neighborhoods with a larger number of low-wage workers (left map) and better access to jobs (right
map) than other neighborhoods in our analysis.
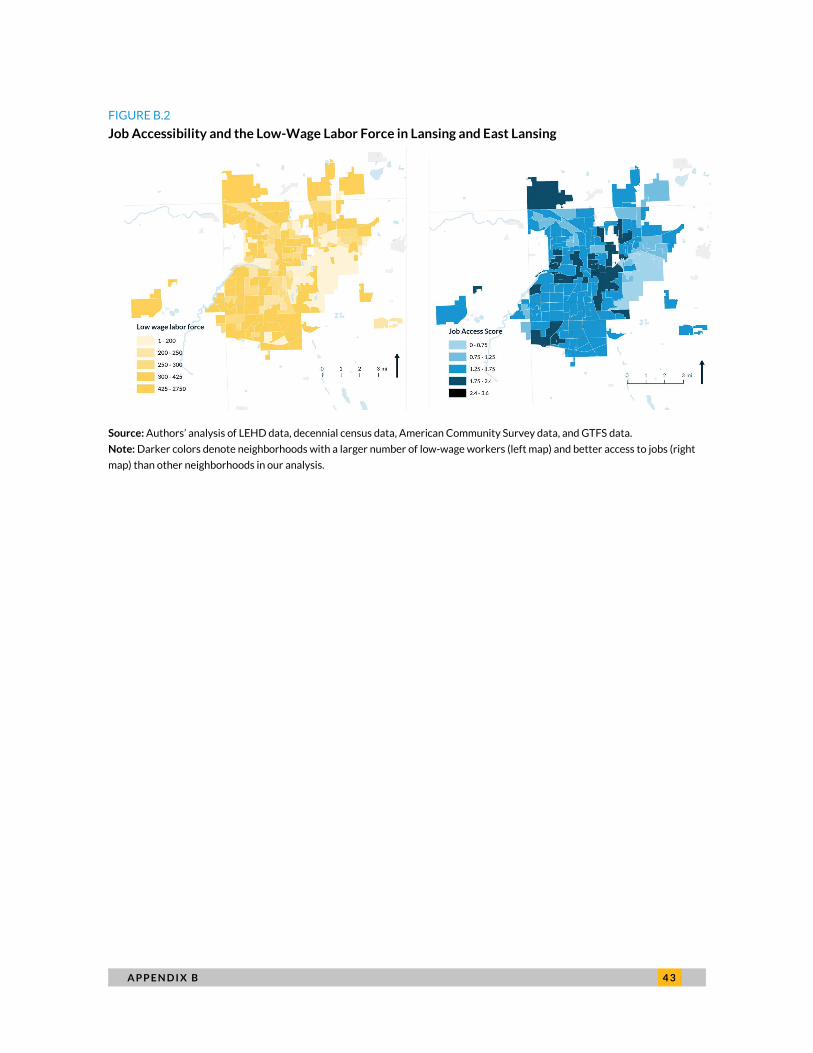
A P P E N D I X B 4 3
FIGURE B.2
Job Accessibility and the Low-Wage Labor Force in Lansing and East Lansing
Source: Authors’ analysis of LEHD data, decennial census data, American Community Survey data, and GTFS data.
Note: Darker colors denote neighborhoods with a larger number of low-wage workers (left map) and better access to jobs (right
map) than other neighborhoods in our analysis.

4 4 A P P E N D I X B
FIGURE B.3
Job Accessibility and the Low-Wage Labor Force in Baltimore
Source: Authors’ analysis of LEHD data, decennial census data, American Community Survey data, and GTFS data.
Note: Darker colors denote neighborhoods with a larger number of low-wage workers (left map) and better access to jobs (right
map) than other neighborhoods in our analysis.
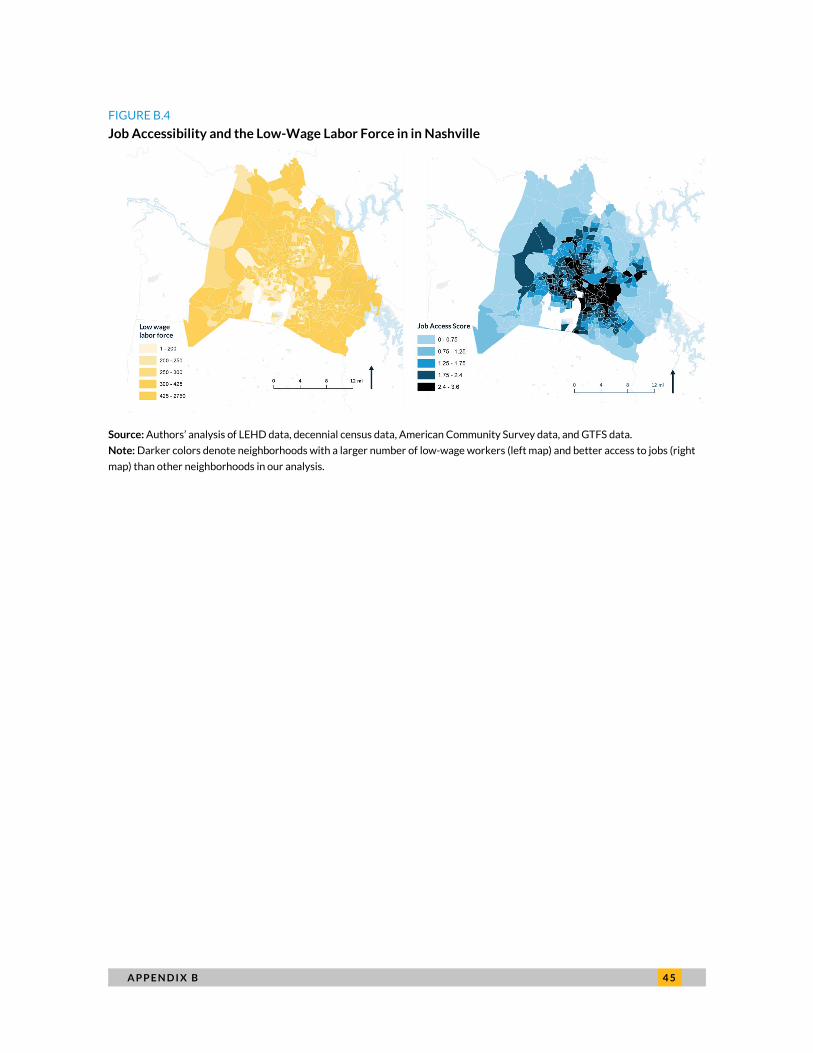
A P P E N D I X B 4 5
FIGURE B.4
Job Accessibility and the Low-Wage Labor Force in in Nashville
Source: Authors’ analysis of LEHD data, decennial census data, American Community Survey data, and GTFS data.
Note: Darker colors denote neighborhoods with a larger number of low-wage workers (left map) and better access to jobs (right
map) than other neighborhoods in our analysis.

4 6 N O T E S
Notes1 Authors’ calculation based on 2018 fare revenue data and operating expenses data from “The National Transit
Database (NTD),” Federal Transit Administration, https://www.transit.dot.gov/ntd/ntd-data.
2 “Recommendation: Make Transit More Competitive,” Chicago Metropolitan Agency for Planning, accessed May 18, 2020, https://www.cmap.illinois.gov/2050/mobility/transit.
3 Juan Pablo Garnham, “To Fight Huge Drop in Bus Riders, North Texas Transit Agency Faces Hard Choices about Who Gets Service,” Texas Tribune, February 25, 2020, https://www.texastribune.org/2020/02/25/dallas-bus-ridership-plummeting-so-dart-wants-redraw-bus-routes-2020/.
4 The rise in global temperature from climate change is likely to reach 1.5 degrees Celsius (2.7 degrees Fahrenheit) between 2030 and 2052 if greenhouse gas (GHG) emissions continue to increase at the current rate (IPCC 2018). Light-duty vehicles, including passenger cars and small trucks, are the largest source of transportation emissions, with 59 percent of GHG emissions; rail and other modes make up 6 percent. In addition, GHG emissions in the transportation sector increased more in absolute terms than any other sector between 1990 and 2017 (EPA 2017).
5 Jorge Mejia and Chris Parker, “The Persistence of Driver Bias on Ride-Sharing Platforms,” LSE Business Review (blog), London School of Economics and Political Science, July 31, 2018, https://blogs.lse.ac.uk/businessreview/2018/07/31/the-persistence-of-driver-bias-on-ride-sharing-platforms/.
6 See also Yipeng Su and Robin Wang, “Three Ways Bikeshare Can Counteract, Not Reinforce, DC's Disparities,” Urban Wire (blog), Urban Institute, February 11, 2019, https://www.urban.org/urban-wire/three-ways-bikeshare-can-counteract-not-reinforce-dcs-disparities.
7 Don Anair, “Electrifying Ride-Hailing: Part 1 – Six Reasons Why Uber and Lyft Must Go Electric”, Union of Concerned Scientists blog, January 17, 2020, https://blog.ucsusa.org/don-anair/electrifying-ride-hailing-part-1-six-reasons-why-uber-and-lyft-must-go-electric.
8 “Fiscal Impact Statement for Initiative 976,” Washington State Office of Financial Management, undated document, retrieved from https://ofm.wa.gov/sites/default/files/public/budget/ballot/2019/ FiscalImpactStatementInitiative976-093019.pdf.
9 King County Executive Dow Constantine, “I-976 Impacts to Seattle and King County: If No Replacement Funds, Major Cuts to Metro Service,” news release, November 6, 2019, https://kingcounty.gov/elected/executive/constantine/news/release/2019/November/06-976-metro.aspx.
10 A summary of the Red Line case and the full complaint are available on the NAACP Legal Defense and Education Fund’s website, https://www.naacpldf.org/case-issue/baltimore-red-line/.
11 ACS five-year 2013–18 data.
12 Lawrence Brown, “Two Baltimores: The White L versus the Black Butterfly,” Baltimore City Paper, June 28, 2016, https://www.citypaper.com/bcpnews-two-baltimores-the-white-l-vs-the-black-butterfly-20160628-htmlstory.html.
13 Brett Theodos, Eric Hangen, and Brady Meixell, “‘The Black Butterfly’: Racial Segregation and Investment Patterns in Baltimore,” Urban Institute, February 5, 2019, https://apps.urban.org/features/baltimore-investment-flows/.
14 “Non-Motorized Plan,” City of Lansing, Michigan, accessed September 24, 2020, https://www.lansingmi.gov/2045/Non-Motorized-Plan.
15 “Equity in Transportation for People with Disabilities,” Leadership Conference Education Fund, undated document, http://www.civilrightsdocs.info/pdf/transportation/final-transportation-equity-disability.pdf.

R E F E R E N C E S 4 7
References Andersson, Fredrik, John C. Haltiwanger, Mark J. Kutzbach, Henry O. Pollakowski, and Daniel H. Weinberg. 2018.
“Job Displacement and the Duration of Joblessness: The Role of Spatial Mismatch.” Review of Economics and Statistics 100 (2): 203–18.
Andersson, Martin, Johan Klaesson, and Johan P. Larsson. 2014. “The Sources of the Urban Wage Premium by Worker Skills: Spatial Sorting or Agglomeration Economies?” Papers in Regional Science 93 (4): 727–47.
APTA (American Public Transportation Association). 2019. Supporting Late-Shift Workers: Their Transportation Needs and the Economy. Washington, DC: APTA.
Baum-Snow, Nathaniel, and Daniel Hartley. 2017. “Accounting for Central Neighborhood Change, 1980-2010.” Chicago: Federal Reserve Bank of Chicago.
Boehmer, Tegan, Stephanie L. Foster, Jeffrey R. Henry, Efomo L. Woghiren-Akinnifesi, and Fuyuen Y. Yip. 2013. “Residential Proximity to Major Highways, 2010.” Atlanta: Centers for Disease Control and Prevention.
Brueckner, Jan K., and Yves Zenou. 2003. “Space and Unemployment: The Labor-Market Effects of Spatial Mismatch.” Journal of Labor Economics 21 (1): 242–62.
Brummet, Quentin, and Davin Reed. 2018. “The Effects of Gentrification on Original Neighborhood Residents: Evidence from Longitudinal Census Microdata.” Technical report. Chicago: NORC at the University of Chicago.
Chetty, Raj, Nathaniel Hendren, Patrick Kline, and Emmanuel Saez. 2014. “Where Is the Land of Opportunity? The Geography of Intergenerational Mobility in the United States.” Quarterly Journal of Economics 129 (4): 1553–1623.
Clark, Lara P., Dylan B. Millet, and Julian D. Marshall. 2017. “Changes in Transportation-Related Air Pollution Exposures by Race-Ethnicity and Socioeconomic Status: Outdoor Nitrogen Dioxide in the United States in 2000 and 2010.” Environmental Health Perspectives 125 (9): 097012-1–10.
Couture, Victor, and Jessie Handbury. 2019. “Urban Revival in America, 2000 to 2010.” Working Paper 24084. Cambridge, MA: National Bureau of Economic Research.
Dawkins, Casey, Jae Sik Jeon, and Rolf Pendall. 2015. “Transportation Access, Rental Vouchers, and Neighborhood Satisfaction: Evidence from the Moving to Opportunity Experiment.” Housing Policy Debate 25 (3): 497–530.
Edlund, Lena, Cecilia Machado, and Maria Micaela Sviatschi. 2015. “Gentrification and the Rising Returns to Skill.” Working Paper 21729. Cambridge, MA: National Bureau of Economic Research.
EPA (Environmental Protection Agency). 2017. “Profile of Version 1 of the 2014 National Emission Inventory.” Washington, DC: EPA.
———. 2020. Inventory of U.S. Greenhouse Gas Emissions and Sinks 1990–2018. Report 430-R-20-002. Washington, DC: EPA.
Erhardt, Gregory D., Sneha Roy, Drew Cooper, Bhargava San, Mei Chen, and Joe Castiglione. 2019. “Do Transportation Network Companies Decrease or Increase Congestion?” Science Advances 5 (5): eaau2670.
Fedorowicz, Martha, Emily Bramhall, Mark Treskon, and Richard Ezike. 2020. New Mobility and Equity: Insights for Medium Size Cities. Washington, DC: Urban Institute.
Ganning, Joanna. 2014. “Accessibility-Based Transportation Planning: Literature and Applications for Shrinking Cities.” NITC-SS-736. Portland, OR: Portland University, Transportation Research and Education Center.
GAO (Government Accountability Office). 2019. “Funding the Nation's Surface Transportation System.” Washington, DC: GAO.

4 8 R E F E R E N C E S
Gautier, Pieter A., and Yves Zenou. 2010. “Car Ownership and the Labor Market of Ethnic Minorities.” Journal of Urban Economics 67 (3): 392–403.
Ge, Yanbo, Christopher R. Knittel, Don MacKenzie, and Stephen Zoepf. 2016. “Racial and Gender Discrimination in Transportation Network Companies.” Working Paper 22776. Cambridge, MA: National Bureau of Economic Research.
Gehrke, Steven R., Alison Felix, and Timothy G. Reardon. 2019. “Substitution of Ride-Hailing Services for More Sustainable Travel Options in the Greater Boston Region.” Transportation Research Record 2673 (1): 438–46.
Giuliano, Genevieve, and Dhiraj Narayan. 2005. “A Comparison of Work and Nonwork Travel: The US and Great Britain.” In Barriers to Sustainable Transport: Institutions, Regulation, and Sustainability, edited by Piet Rietveld and Roger R. Stough, 111–29. Abingdon, ENG: Spon Press.
Golub, Aaron, and Karel Martens. 2014. “Using Principles of Justice to Assess the Modal Equity of Regional Transportation Plans.” Journal of Transport Geography 41:10–20.
Greater Nashville Regional Council. 2019. Middle Tennessee Connected – A Unified Plan for Transportation Improvements adopted by Mayors and Transportation Officials. Nashville, TN: Greater Nashville Regional Council.
Greene, Solomon, Graham MacDonald, Olivia Arena, Tanaya Srini, Ruth Gourevitch, Richard Ezike, and Alena Stern. 2019. Technology and Equity in Cities. Washington, DC: Urban Institute.
Hall, Jonathan D., Craig Palsson, and Joseph Price. 2018. “Is Uber a Substitute or Complement for Public Transit?“ Journal of Urban Economics 108:36–50.
Hendey, Leah. 2017. “Racial Inequities in the Washington, DC, Region: 2011–15.” Washington, DC: Urban Institute.
Holland, Stephen P., Erin T. Mansur, Nicholas Z. Muller, and Andrew J. Yates. 2016. “Are There Environmental Benefits from Driving Electric Vehicles? The Importance of Local Factors.” American Economic Review 106 (12): 3700–29.
Irwin, Scott. 2019. “Implications of Recent Trends in US Gasoline Consumption for Ethanol.” farmdoc daily 9 (66).
Karas, David. 2015. “Highway to Inequity: The Disparate Impact of the Interstate Highway System on Poor and Minority Communities in American Cities.” New Visions for Public Affairs 7:9–21.
Kijakazi, Kilolo, Rachel Marie Brooks Atkins, Mark Paul, Anne E. Price, Darrick Hamilton, and William A. Darity, Jr. 2016. The Color of Wealth in the Nation’s Capital. Washington, DC: Urban Institute.
Kneebone, Elizabeth, and Alan Berube. 2013. Confronting Suburban Poverty in America. Washington, DC: Brookings Institution Press.
Kneebone, Elizabeth, and Emily Garr. 2010. The Suburbanization of Poverty. Washington, DC: Brookings Institution Press.
Lee, Richard, Ipek N. Sener, and S. Nathan Jones, 2017. “Understanding the Role of Equity in Active Transportation Planning in the United States.” Transport Reviews (Taylor & Francis) 37 (2): 211–26.
Li, Ziru, Yili Hong, and Zhongju Zhang. 2016. “An Empirical Analysis of On-Demand Ride Sharing and Traffic Congestion.” Proc. International Conference on Information Systems.
Lynch, John W., and George A. Kaplan. 1997. “Understanding How Inequality in the Distribution of Income Affects Health.” Journal of Health Psychology 2 (3): 297–314.
Lynch, Teresa, and Adam Kamins. 2012. “Creating Equity: Does Regionalism Have an Answer for Urban Poverty? Can It?” Boston: Institute for a Competitive Inner City.
Mallach, Alan. 2012. “Depopulation, Market Collapse and Property Abandonment: Surplus Land and Buildings in Legacy Cities.” In Rebuilding America’s Legacy Cities: New Directions for the Industrial Heartland, edited by Alan Mallach, 85–110. New York: The American Assembly, Columbia University.

R E F E R E N C E S 4 9
Mallach, Alan, and Lavea Brachman. 2013. Regenerating America’s Legacy Cities. Cambridge, MA: Lincoln Institute of Land Policy.
Manaugh, Kevin, Madhav G. Badami, and Ahmed M. El-Geneidy. 2015. “Integrating Social Equity into Urban Transportation Planning: A Critical Evaluation of Equity Objectives and Measures in Transportation Plans in North America.” Transport Policy 37:167–76.
Marron, Donald B., and Eric J. Toder. 2014. “Tax Policy Issues in Designing a Carbon Tax.” American Economic Review 104 (5): 563–68.
Martens, Karel, Aaron Golub, and Glenn Robinson. 2012. “A Justice-Theoretic Approach to the Distribution of Transportation Benefits: Implications for Transportation Planning Practice in the United States.” Transportation Research Part A: Policy and Practice 46 (4): 684–95.
Martin, Isaac William, and Kevin Beck. 2018. “Gentrification, Property Tax Limitation, and Displacement.” Urban Affairs Review 54 (1): 33–73.
NLIHC (National Low Income Housing Coalition). 2020. Out of Reach 2020: The High Cost of Housing. Washington, DC: NLIHC.
Parry, Ian W. H., Margaret Walls, and Winston Harrington. 2007. “Automobile Externalities and Policies.” Journal of Economic Literature 45 (2): 373–99.
Pendall, Rolf, Christopher Hayes, Arthur (Taz) George, Zach McDade. 2014. “Opportunity Zones: Maximizing Return on Public Investment.” Washington, DC: Urban Institute.
Rachele, Jerome N., et al. 2017. “Neighborhood Socioeconomic and Transport Disadvantage: The Potential to Reduce Social Inequities in Health through Transport.” Journal of Transport & Health 7:256–63.
Rast, Joel. 2004. “Transportation Equity and Access to Jobs in Metropolitan Milwaukee.” Milwaukee: University of Wisconsin–Milwaukee, Center for Economic Development.
Rayle, Lisa. 2015. “Investigating the Connection between Transit-Oriented Development and Displacement: Four Hypotheses.” Housing Policy Debate 25 (3): 531–48.
Revington, Nick. 2015. “Gentrification, Transit, and Land Use: Moving beyond Neoclassical Theory.” Geography Compass 9 (3): 152–63.
Richardson, Jason, Bruce Mitchell, and Juan Franco. 2019. Shifting Neighborhoods: Gentrification and Cultural Displacement in American Cities. National Community Reinvestment Coalition.
Sanchez, Thomas W., Qing Shen, and Zhong-Ren Peng. 2004. “Transit Mobility, Jobs Access, and Low-Income Labour Participation in US Metropolitan Areas.” Urban Studies 41 (7): 1313–31.
Schaller, Bruce. 2018. “The New Automobility: Lyft, Uber and the Future of American Cities” New York: Schaller Consulting.
Schwanen, Tim, and Patricia L. Mokhtarian. 2005. “What if You Live in the Wrong Neighborhood? The Impact of Residential Neighborhood Type Dissonance on Distance Traveled.” Transportation Research Part D: Transport and Environment 10 (2): 127–51.
Shaheen, Susan, and Adam Cohen. 2018. “Smartphone Applications and Data Impacting Transportation.” Berkeley: University of California at Berkeley, Institute of Transportation Studies. https://doi.org/10.7922/G2DN4361
Shen, Qing. 2001. “A Spatial Analysis of Job Openings and Access in a U.S. Metropolitan Area.” Journal of the American Planning Association 67 (1): 53–68. https://doi.org/10.1080/01944360108976355
Siskos, Pelopidas, Pantelis Capros, and Alessia De Vita. 2015. “CO2 and Energy Efficiency Car Standards in the EU in the Context of a Decarbonisation Strategy: A Model-Based Policy Assessment.” Energy Policy 84:22–34.

5 0 R E F E R E N C E S
Tessum, Christopher W., Joshua S. Apte, Andrew L. Goodkind, Nicholas Z. Muller, Kimberley A. Mullins, David A. Paolella, Stephen Polasky, Nathaniel P. Springer, Sumil K. Thakrar, Julian D. Marshall, and Jason D. Hill. 2019. “Inequity in Consumption of Goods and Services Adds to Racial–Ethnic Disparities in Air Pollution Exposure.” Proceedings of the National Academy of Sciences 116 (13): 6001–06.
Theodos, Brett, Eric Hangen, Brady Meixell, and Prasanna Rajasekaran. 2019. “Neighborhood Disparities in Investment Flows in Chicago.” Washington, DC: Urban Institute.
Tighe, J. Rosie, and Joanna P. Ganning. 2015. “The Divergent City: Unequal and Uneven Development in St. Louis.” Urban Geography 36 (5): 654–73.
Turner, Margery Austin, and Felicity Skidmore, eds. 1999. Mortgage Lending Discrimination: A Review of Existing Evidence. Washington, DC: Urban Institute.
Ursaki, Julia, and Lisa Aultman-Hall. 2015. Quantifying the Equity of Bikeshare Access in US Cities. Report 15-011. Burlington: University of Vermont, Transportation Research Center.
Bureau of Transportation Statistics. 2018. Transportation Statistics Annual Report 2018 (Preliminary). Washington, DC: US Department of Transportation, Bureau of Transportation Statistics.
Weber, Joe. 2012. “The Evolving Interstate Highway System and the Changing Geography of the United States.” Journal of Transport Geography 25:70–86.
Woods, Louis Lee. 2012. “The Federal Home Loan Bank Board, redlining, and the national proliferation of racial lending discrimination, 1921–1950.” Journal of Urban History 38 (6): 1036–59.
Younger, Margalit, Heather R. Morrow-Almeida, Stephen M. Vindigni, and Andrew L. Dannenberg. 2008. “The Built Environment, Climate Change, and Health: Opportunities for Co-benefits.” American Journal of Preventive Medicine 35 (5): 517–26.
Zimmerman, Frederick J., and Nathaniel W. Anderson. 2019. “Trends in Health Equity in the United States by Race/Ethnicity, Sex, and Income, 1993-2017.” JAMA network open 2.6 (2019): e196386-e196386.

A B O U T T H E A U T H O R S 5 1
About the Authors
Christina Stacy is a senior research associate in the Metropolitan Housing and Communities Policy
Center at the Urban Institute, where she specializes in urban economics and inclusion. Stacy’s work
focuses on the intersection of economics and urban spaces and how housing, local economies, health,
and crime interact.
Yipeng Su is a research analyst in the Metropolitan Housing and Communities Policy Center. Her
research interests include affordable housing, economic development and the intersection between
urban planning and technology.
Eleanor Noble is a research assistant in the Metropolitan Housing and Communities Policy Center. Her
research interests include housing affordability, evictions, and public transportation access.
Kristin Blagg is a senior research associate in the Center on Education Data and Policy at the Urban
Institute. Her research focuses on K–12 and postsecondary education.
Alena Stern is a data science fellow at the Urban Institute studying policy solutions to advance equity
and inclusion in cities.
Macy Rainer is a research assistant in the Center on Education Data and Policy, where she focuses on
topics in K–12 and higher education.
Richard Ezike is a senior policy associate in the Research to Action Lab at the Urban Institute, where
she specializes in technology inclusion and new mobility. Ezike’s work focuses on transportation equity
and analysis of how cities are incorporating services equitably and inclusively.

ST A T E M E N T O F I N D E P E N D E N C E
The Urban Institute strives to meet the highest standards of integrity and quality in its research and analyses and in the evidence-based policy recommendations offered by its researchers and experts. We believe that operating consistent with the values of independence, rigor, and transparency is essential to maintaining those standards. As an organization, the Urban Institute does not take positions on issues, but it does empower and support its experts in sharing their own evidence-based views and policy recommendations that have been shaped by scholarship. Funders do not determine our research findings or the insights and recommendations of our experts. Urban scholars and experts are expected to be objective and follow the evidence wherever it may lead.

500 L’Enfant Plaza SW
Washington, DC 20024
www.urban.org