research report an fmri examination of visual ...ubhc.rutgers.edu/dsr/papers/documents/silverstein...
TRANSCRIPT

Journal of Integrative Neuroscience, Vol. 8, No. 2 (2009) 175–202c© Imperial College Press
Research Report
AN fMRI EXAMINATION OF VISUAL INTEGRATIONIN SCHIZOPHRENIA
STEVEN M. SILVERSTEIN∗,†,¶, SARAH BERTEN∗,†, BRIAN ESSEX†,ILONA KOVACS‡, TERESA SUSMARAS§ and DEBORAH M. LITTLE†,§
∗University of Medicine and Dentistry of New Jersey — UniversityBehavioral HealthCare and Department of Psychiatry
Robert Wood Johnson Medical School†Department of Psychiatry, University of Illinois at Chicago
‡Department of Cognitive ScienceBudapest University of Technology and Economics
§Departments of Neurology and RehabilitationAnatomy and Cell Biology, Ophthalmology and Visual Sciences
and Psychology, University of Illinois at Chicago¶[email protected]
Received 23 February 2009Accepted 2 April 2009
Behavioral and electrophysiological studies of schizophrenia have consistently demon-strated impairments in the integration of visual features into unified perceptual repre-sentations. Specific brain regions involved in this dysfunction, however, remain to beclarified. This study used functional Magnetic Resonance Imaging (fMRI) to examinethe relative involvement of visual cortex areas (involved in form perception) and pari-etal and frontal regions (involved in attention), in the visual integration impairment inschizophrenia. Fourteen patients with schizophrenia and 14 healthy controls were com-pared on behavioral performance and data acquired via fMRI while completing a contourintegration task that had previously been used to identify a visual integration deficit inschizophrenia. The schizophrenia patients demonstrated poorer visual integration thancontrols. Analyses of peak signal change indicated that while the groups were equivalentin area V1, the schizophrenia group demonstrated reduced signal in areas V2–V4, whichare the earliest regions sensitive to global configurations of stimuli. Moreover, whereasthe control group demonstrated greater recruitment of prefrontal and parietal areas dur-ing perception of integrated forms compared to random stimuli, the schizophrenia groupdemonstrated greater recruitment of frontal regions during perception of random stimuli.The two groups differed on brain regions involved in form perception even when they werematched on accuracy levels. The visual integration disturbance in schizophrenia involvesboth deficient basic visual processes (beginning as early as occipital region V2), as well asreduced feedback from visual attention regions that normally serves to amplify relevantvisual representations relative to irrelevant information.
Keywords: Schizophrenia; fMRI; perception; cognition; vision; occipital lobe.
¶Corresponding author.
175

176 Silverstein et al.
1. Introduction
A consistent finding in the literature on cognitive-perceptual impairments inschizophrenia is that of a reduced ability to integrate stimulus elements into coher-ent visual representations. While patients with schizophrenia do appear to be ableto process continuous contour, whether real [7] or illusory [19, 61, 62], visual bindinghas been shown to be deficient when noncontiguous elements need to be integratedinto a perceptual whole [e.g., 11, 48, 58, 59]. Over the past 30 years, at least 30studies have demonstrated such reductions in visual feature integration abilities inschizophrenia [69]. Moreover, in 10 of these studies [14, 22, 43, 46, 48–50, 58, 65,72], the reduced ability to integrate information, and subsequent reduced influenceof visual context, led to superior performance, compared to controls, in makingdecisions about individual features. Therefore, evidence for impairments in visualintegration has been convincingly demonstrated independent of a generalized deficit[6, 28, 29, 55]. These impairments also cannot be accounted for by medication, asthey have been demonstrated in unmedicated patients [20]. This extensive experi-mental literature is consistent with earlier clinical descriptions and first-hand patientaccounts of fragmented perception in schizophrenia [4, 64, 68]. The importance ofvisual integration disturbances in schizophrenia is reflected in the inclusion of thiscognitive domain as a core construct in the recent NIMH-sponsored Cognitive Neu-roscience Treatment Research to Improve Cognition in Schizophrenia (CNTRICS)initiative [3, 5, 23].
In contrast to the wealth of behavioral studies of visual integration dysfunctionin schizophrenia, there have been relatively few studies of its underlying neurophys-iology. Electrophysiological studies of nonpatients have generally identified that thelateral occipital cortex (LOC) plays a role in visual binding, as part of a network alsoinvolving the prefrontal cortex [52, 53]. Electrophysiological studies of schizophrenia[11, 12, 18] identified both ventral and dorsal stream abnormalities associated withreduced P1 amplitude when patients viewed fragmented pictures. A recent studyfound reduced N150 amplitude to global fragmented targets in a global–local taskin schizophrenia [26], and the source of that waveform has been localized to V3/V3awithin the LOC [10, 26, 70]. Functional magnetic resonance imaging (fMRI) studiesof visual integration in nonpatients have localized regions subserving intact integra-tion, including both earlier visual areas (e.g., V2), and higher visual areas involvedin shape processing (e.g., V3, V4, the LOC and posterior fusiform regions) [1, 2, 30,38, 42, 52]. Foxe et al. [19] found intact illusory contour processing in schizophrenia,and identified excessive frontal lobe activity during contour processing, which wasinterpreted as a compensation for impaired ventral stream processing. To date, how-ever, fMRI has not been used to examine integration of spatially separated elementsinto unified perceptual wholes in schizophrenia.
Therefore, in this study, we examined integration of visual features into formsusing a psychophysically rigorous contour integration task [31–37, 44, 57, 59] that haspreviously demonstrated sensitivity to both integration deficits and top–down effects

Visual Integration in Schizophrenia 177
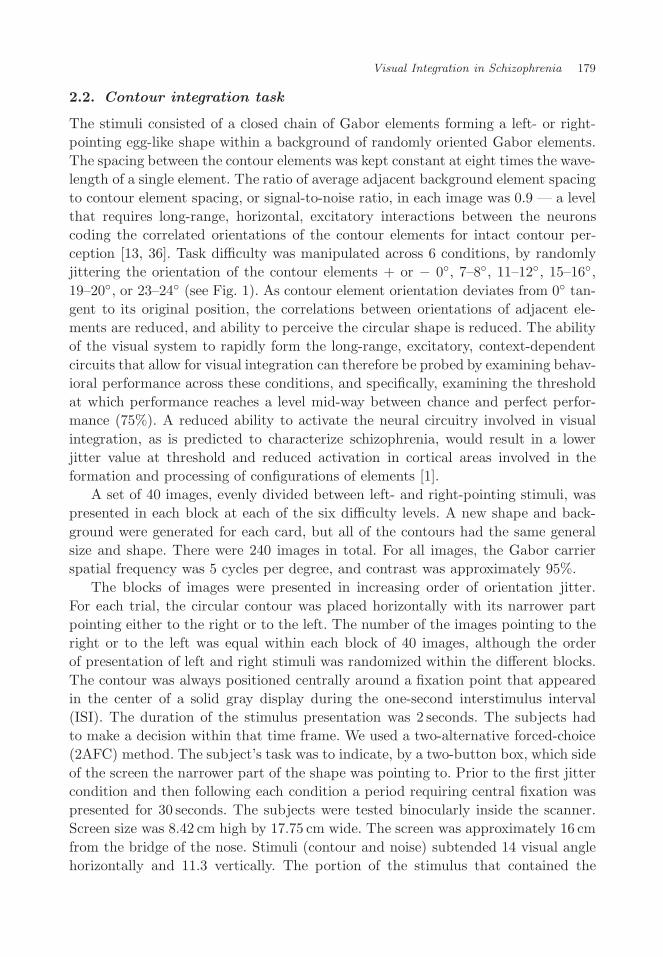
Fig. 1. Samples of images from the 2 alternative forced choice (2AFC) contour integration task.Top left: 0◦ jitter, top right: 7–8◦ jitter, center left: 11–12◦ jitter, center right: 15–16◦ jitter, bottomleft: 19–20◦ jitter, bottom right: 23–24◦ jitter. These panels show only the region of the displaycontaining the contour. The actual stimuli contain approximately 75% additional space that containsonly noise elements.
on these in schizophrenia [37, 57, 59]. The task involves the detection of a roughlycircular shape whose contour is comprised of unconnected elements embedded withina background of similar, but randomly placed elements (see Fig. 1). Each elementis an example of a Gabor signal — a Gaussian-modulated, sinusoidal luminancedistribution that reflects the center-surrounded properties of orientation-selectivespatial frequency (feature) detectors in primary visual cortex (V1). Perception ofthe circular contour in this task requires the linking of individual Gabor elementsinto an emergent circular shape [36], which requires context-sensitive interactionsamong neurons in V1 that code the orientation-correlated contour elements [13, 15].This is thought to involve feedback from higher visual areas, such as V2, V3, andV4, where visual form information is initially processed [54]. The embedded contourcannot be detected simply by analysis of individual Gabor elements, or by neuronswith large receptive fields corresponding to the size of the contour [8, 24].
The purpose of this study was to use fMRI to investigate abnormal visual inte-gration in schizophrenia, and in particular, to clarify the contributions of activationchanges in primary visual cortex, in higher visual areas, and outside of the occipi-tal lobe. Our hypothesis was that the schizophrenia group would demonstrate both

178 Silverstein et al.
poorer behavioral performance (accuracy and reaction time) on the task comparedto controls, and differences in activation of brain regions associated with visual pro-cessing of stimulus configurations. Specifically, if the schizophrenia-related visualintegration impairment is not secondary to more basic impairments, this would bereflected in abnormal levels of activation in visual cortex regions sensitive to stim-ulus grouping (e.g., V2–V4), but not in abnormally high or low levels of activityin area V1, where basic feature processing occurs. In addition, we predicted thatlevels of prefrontal and parietal activation would be reduced compared to controls,demonstrating reduced top–down feedback to, or attentional enhancement of stim-ulus configurations — even in conditions where patients achieved adequate contourintegration.
2. Methods
2.1. Subjects
The sample consisted of 14 outpatients with schizophrenia (9 men) and 14 healthycontrol subjects (5 men). Patient diagnosis was based on the Structured ClinicalInterview for DSM-IV Diagnosis-Patient Version (SCID) [16] which was conductedby the first author or a research assistant who had previously achieved a level ofreliability with the first author across SCID items of κ > 0.75. Inclusion criteria forthe patient group were a diagnosis of schizophrenia, age 18–55, and an ability tosuccessfully complete a practice version of the task prior to the scanning session.Exclusion criteria included active substance abuse or dependence, a current mooddisorder, a history of a neurological disorder or head injury with loss of conscious-ness lasting more than 10 minutes, or documented intellectual impairment. Controlsubjects were not screened for personal or familial psychopathology. However, con-trols were screened for present or past neurological and substance abuse conditionsduring a pre-scan interview.
The groups were matched on age and parental education levels. All subjectscompleted a practice version of the task, and were familiarized with the scanningenvironment (using a mock scanner) the day before the fMRI session. At that ses-sion, all patient subjects were also interviewed using the SCID and the Positive andNegative Syndrome Scale (PANSS) [27, 39]. No potential subjects failed the screen-ing version of the contour integration task. Medication level was assessed for patientsusing published conversion formulas [73] to generate chlorpromazine equivalent dailydoses for second-generation antipsychotic medications. All subjects provided writteninformed consent. Subjects were asked to refrain from alcohol for 24 hours prior toall fMRI sessions and abstain from smoking and caffeine for 12 hours prior to thescan. Each subject was then questioned for the use of these substances prior to thescan. One of the patients and two of the controls reported use of caffeine within6 hours of the MRI scan. Additionally, three patients reported use of nicotine within6 hours of the MRI.
Visual Integration in Schizophrenia 179
2.2. Contour integration task
The stimuli consisted of a closed chain of Gabor elements forming a left- or right-pointing egg-like shape within a background of randomly oriented Gabor elements.The spacing between the contour elements was kept constant at eight times the wave-length of a single element. The ratio of average adjacent background element spacingto contour element spacing, or signal-to-noise ratio, in each image was 0.9 — a levelthat requires long-range, horizontal, excitatory interactions between the neuronscoding the correlated orientations of the contour elements for intact contour per-ception [13, 36]. Task difficulty was manipulated across 6 conditions, by randomlyjittering the orientation of the contour elements + or − 0◦, 7–8◦, 11–12◦, 15–16◦,19–20◦, or 23–24◦ (see Fig. 1). As contour element orientation deviates from 0◦ tan-gent to its original position, the correlations between orientations of adjacent ele-ments are reduced, and ability to perceive the circular shape is reduced. The abilityof the visual system to rapidly form the long-range, excitatory, context-dependentcircuits that allow for visual integration can therefore be probed by examining behav-ioral performance across these conditions, and specifically, examining the thresholdat which performance reaches a level mid-way between chance and perfect perfor-mance (75%). A reduced ability to activate the neural circuitry involved in visualintegration, as is predicted to characterize schizophrenia, would result in a lowerjitter value at threshold and reduced activation in cortical areas involved in theformation and processing of configurations of elements [1].
A set of 40 images, evenly divided between left- and right-pointing stimuli, waspresented in each block at each of the six difficulty levels. A new shape and back-ground were generated for each card, but all of the contours had the same generalsize and shape. There were 240 images in total. For all images, the Gabor carrierspatial frequency was 5 cycles per degree, and contrast was approximately 95%.
The blocks of images were presented in increasing order of orientation jitter.For each trial, the circular contour was placed horizontally with its narrower partpointing either to the right or to the left. The number of the images pointing to theright or to the left was equal within each block of 40 images, although the orderof presentation of left and right stimuli was randomized within the different blocks.The contour was always positioned centrally around a fixation point that appearedin the center of a solid gray display during the one-second interstimulus interval(ISI). The duration of the stimulus presentation was 2 seconds. The subjects hadto make a decision within that time frame. We used a two-alternative forced-choice(2AFC) method. The subject’s task was to indicate, by a two-button box, which sideof the screen the narrower part of the shape was pointing to. Prior to the first jittercondition and then following each condition a period requiring central fixation waspresented for 30 seconds. The subjects were tested binocularly inside the scanner.Screen size was 8.42 cm high by 17.75 cm wide. The screen was approximately 16 cmfrom the bridge of the nose. Stimuli (contour and noise) subtended 14 visual anglehorizontally and 11.3 vertically. The portion of the stimulus that contained the

180 Silverstein et al.
contour subtended 5.9 horizontally and 4.68 vertically at its center (with a graduallydecreasing visual angle approaching the point).
The stimuli were displayed in white/gray/black (see Fig. 1) (56 cd/m2) on a graybackground (22 cd/m2). The program to administer the task and record data wereimplemented in Flash and synchronized with image acquisition. Because stimuliwere blocked by condition, and to keep the session as brief as possible, a blockdesign, rather than an event-related design, was used. Although the latter may bemore sensitive to the nature of single-trial data, its typical requirement for longerintertrial intervals also raises the risk of confounding effects of reductions in sustainedattention, which is an issue in schizophrenia. Also, as this was the initial fMRI studyof contour integration in schizophrenia, we wanted to use the same version of thetask, with the same timing parameters that had been used in our earlier behavioralstudy demonstrating sensitivity of this task [37].
2.3. Brain imaging
All images were acquired using a 3.0-Tesla whole body scanner (Signa VHi, GeneralElectric Medical Systems, Waukesha, WI) performing serial gradient echo, echo-planar imaging (epiRT, plane = axial, TR = 3000 ms, TE = 30.7 ms, flip angle =90◦, matrix = 64 × 64, FOV = 20 cm2, voxel size = 3.125 × 3.125 × 5 mm, slicethickness = 4mm, gap = 1 mm, NEX = 1, bandwidth = 62 kHz) for all imageacquisition. The duration of the acquisition was 15.5 minutes during which 28 sliceswere acquired per volume with a total of 310 brain volumes. The functional paradigmwas then followed by acquisition of a high resolution 3D inversion recovery fastspoiled gradient recalled echo sequence (SPGR, plane = axial, TR = 9 ms, TE =2.0 ms, flip angle = 25◦, NEX = 1, bandwidth = 15.6 kHz, acquisition matrix =256×256, FOV = 22×16.5 cm2, slice thickness/gap = 1.5/0 mm/mm, slices = 124).
The contour integration task was presented in the scanner and coordinated withbehavioral measurements by a custom designed MRI synchronization control system.All scan sessions were conducted between 9 AM and 12 noon. Prior to each sessionof data collection, quality assurance protocols were conducted to examine scannerquality in terms of signal stability, level of ghosting, and signal-to-noise ratio. Qualityassurance on the projection equipment and visor used for stimulus display wereconducted at the beginning of each week to ensure stability of stimulus contrastacross the study. No differences in either quality assurance protocol were notedacross the study duration.
2.4. Image preprocessing and analysis
fMRI analysis was conducted using Statistical Parametric Mapping (SPM2) [71].Data from each individual subject were initially corrected for head motion andnone exceeded 3 mm of in-plane motion. The functional data were then coregisteredwith the corresponding anatomical images which were then spatially normalizedto the Montreal Neurological Institute (MNI) template. The normalized functional

Visual Integration in Schizophrenia 181
data were smoothed with a 6 mm Gaussian smoothing kernel which was approxi-mately two times the original voxel dimensions. The preprocessed functional datafor each individual were then analyzed with a general linear model using 6 experi-mental regressors corresponding to each degree of jitter (0◦, 7◦, 11◦, 15◦, 19◦, 23◦).The onset times of these regressors were convolved with the hemodynamic responsefunction (HDF). Random effects analyses directly comparing the two subject groupswere then conducted on the activation maps for the 28 subjects so that a group acti-vation map could be extracted to identify significant effects across regions for eachappropriate statistical contrast. To correct for multiple comparisons on the imagedata, a false discovery rate (FDR), q, of 0.05 was applied to all contrasts [21]. Theapplication of an FDR controls the proportion of false positives only among thosevoxels that exceed the statistical threshold and therefore reduces the likelihood ofType I errors [17]. A cluster threshold requiring a suprathreshold volume of 15 mm3
was applied after the FDR to further reduce the likelihood of Type 1 errors [17].Analysis of functional data was accomplished in two phases. First, voxel-wise
comparisons were made between all jitter conditions and between the control andpatient groups. These comparisons were used to identify the networks that wereactivated, and to examine any gross changes between conditions and between groupsin clusters of activation. However, as one primary hypothesis involves the modulationof signal in the visual cortical regions, we also carried out a directed region of interestanalysis on the individual subject data to extract peak signal changes for eachsubject. As differentiation between primary, secondary, and tertiary visual corticalregions is not clearly defined by anatomical markers, the Wake Forest UniversityPick Atlas Tool was used [40]. Within these regions of interest, peak signal changefor each subject was extracted for those voxels which were significantly activated onthe group maps. In other words, a cluster was defined as the voxels which exceedthe statistical threshold on the random effects analysis for each group of subjects.This cluster was then used as a mask and applied to the smoothed, normalized datafrom each subject. Peak values (beta weights) and average signal change (from thenormalized, smoothed, time course) were extracted from each voxel identified bythe mask from each subject. Visual inspection of the region of interest relative tothe SPGR was carried out on each individual subject to ensure that the bordersof primary and secondary visual cortices occurred along the calcarine fissure to thecuneus and lingual gyrus [9] and that tertiary visual cortex was defined from theborders of V1/V2 to the middle occipital gyrus [9].
3. Results
3.1. Demographic data
The patient and control groups did not differ significantly in age [schizophrenia =32.62 (8.92), control = 30.07 (6.47), t(25)= 0.85, p > 0.40], education level [schizo-phrenia = 14.27 (3.30), control = 15.43 (3.46), t(25) = −0.89, p > 0.38], maternal

182 Silverstein et al.
education [schizophrenia = 13.36 (2.90), control = 13.21 (2.00), t(25)= 0.26, p > 0.79],or paternal education [schizophrenia = 13.54 (2.60), control = 14.86 (2.45), t(25)=−1.36, p > 0.18]. There was a trend towards a group difference on gender composition[χ2(1)= 3.59, p = 0.06].
3.2. Clinical variables
Thirteen of the 14 patient subjects were taking antipsychotic medication. Forthese patients, the mean daily dose (in CPZ equivalents) was 353.85 mg (SD = 193,minimum = 100, maximum = 700). Mean symptom ratings on the five PANSS fac-tors were as follows: Positive = 2.92 (mild), Negative =2.63 (minimal to mild),Cognitive = 2.08 (minimal), Excitement = 2.04 (minimal), and Depression = 2.65(minimal to mild).
3.3. Performance
Overall, both groups of subjects showed reduced accuracy [controls: F (5, 65)= 69.14,p < 0.001; patients: F (5, 60)= 39.56, p < 0.0001] and increased latency [controls:F (5, 65)= 43.95, p < 0.001; patients: F (5, 60)= 3.59, p = 0.001] as the degree of jit-ter increased. However, as can be seen in Fig. 2A, there was no interaction betweendegree of jitter and group membership in accuracy of response [F (5, 125)= 1.083,p > 0.37] although controls performed significantly better than patients overall [con-trol mean = 73.4%, SEM= 1.9; patient mean =67.0%, SEM= 2.0; F (1, 25)= 5.378,p < 0.05]. Although the patients did not differ from controls on the easiest or mostdifficult conditions (where ceiling and floor effects, respectively, are expected) [0◦:t(26)= 0.92, p > 0.37; 7◦: t(26)= 1.32, p > 0.20; 23◦: t(26)= 0.16, p > 0.88], theydemonstrated a consistent level of relatively reduced accuracy in the more discrim-inating, intermediate jitter conditions [11◦: t(26)= 2.53, p < 0.05; 15◦: t(26)= 2.22,p < 0.05; 19◦: t(26)= 2.16, p < 0.05].
As is seen in Fig. 2B, there was a group × condition interaction for response laten-cies [F (5, 125)= 5.19, p < 0.001]. Both groups showed an overall increase in latencyas degree of jitter increased, with a differential increase for controls [F (5, 65)= 43.95,p < 0.001] relative to patients [F (5, 60)= 3.59, p = 0.01]. As jitter increased and accu-racy was reduced, the controls showed a systematic increase in reaction time (RT).Although the patients also showed reduced accuracy with increased jitter, they didnot show a corresponding systematic increase in latency. There was a trend for con-trols to show increased latency relative to patients on the 3 largest degree of jitterconditions (15◦, 19◦, 23◦), however, the only significant difference was observed inthe 19◦ jitter condition [t(26)= 1.71, p = 0.05].
Effects of subject gender were examined on task performance (accuracy andresponse latency) for each group of subjects independently as well as across bothgroups (2-way ANOVA with gender and subject group as between-subjects factors).None of the results were statistically significant. For example, for the sample as

Visual Integration in Schizophrenia 183
Fig. 2. Accuracy (top, A) and reaction time (bottom panel, B) are presented for patients (whitecircles) and controls (black circles) for each degree of jitter (x-axis). Threshold refers to the pointmidway between perfect and chance-level performance, and is the point of most reliable discrimi-nation between individuals and groups.
a whole, the between-subjects analyses involving gender produced the followingresults: 0◦ condition: F (1, 26)= 0.009, p = 0.93; 7◦ condition: F (1, 26)= 0.122, p =0.73; 11◦ condition: F (1, 26)= 0.18, p = 0.68; 15◦ condition: F (1, 26)= 0.66, p = 0.42;19◦ condition: F (1, 26)= 0.001, p =0.99; 23◦ condition: F (1, 26)= 0.24, p = 0.628.Although we are underpowered to detect a difference on behavioral performance ifone does exist, the high p-values suggest that the lack of significant findings mayrepresent a true nondifference between males and females on this specific task.
3.4. Baseline networks
Activation maps for data collected during the 0◦ condition (i.e., 0◦ compared tocentral fixation) are presented in Fig. 3 (detailed coordinates of peak activation fromeach region are presented in Table 1). Relative to periods of central fixation, bothcontrols (Fig. 3A) and patients (Fig. 3B) showed a widespread network of activationduring the forced choice task that included the left and right frontal eye fields (middlefrontal gyri), left and right superior and inferior parietal lobules, superior, middle,

184 Silverstein et al.
Fig. 3. Activation maps for the 0◦ jitter condition relative to central fixation for controls (A),patients (B). Regions that were differentially greater in controls relative to patients (C) and patientsgreater than controls (D) are also presented. Significant voxels are presented corrected for multiplecomparisons with a p-valueFDR < 0.05.
and inferior temporal gyri, visual cortices (primary, secondary, tertiary) and regionswithin the cerebellum. The random effects analyses comparing patients to controlsare presented in Figs. 3C and 3D. Controls showed differentially greater activationthan patients bilaterially in regions identified as dorsolateral prefrontal cortex, rightventrolateral prefrontal cortex, left and right frontal eye fields, left and right superiorparietal lobules, V3, and in right V1 (Fig. 3C). Additionally, in this contrast a clusterof activation was also identified in the anterior cingulate. Examination of the timecourse in the anterior cingulate confirmed that this activation was not the resultof increased activity in the controls but instead of decreased signal in the patients.In comparison, patients showed increased activity in right superior temporal gyrus,head of the left caudate nucleus, and left middle temporal gyrus (Fig. 3D).
As a further test of potential gender effects, we examined the effects of genderon activation maps within each jitter condition relative to fixation. Even when weremoved the correction for multiple comparisons and set the p-value to 0.05, therewere no significant clusters of activation between the gender groups. We also re-ranthis analysis without a cluster threshold and without a correction for multiple com-parisons. At this threshold, significant voxels were identified within V2 on the right,

Visual Integration in Schizophrenia 185
Table
1.
Magnit
ude
of
pea
kact
ivity
(maxim
um
z-s
tati
stic
)and
coord
inate
sin
MN
Isp
ace
for
each
signifi
cant
clust
erof
act
ivati
on.
Corr
espondin
gB
rodm
ann
are
as
(BA
)are
also
incl
uded
.Pea
kva
lues
are
pre
sente
dfo
rbase
line
net
work
sfo
rco
ntr
ols
(A),
patien
ts(B
)and
for
contr
ast
sw
her
eco
ntr
ols
show
edgre
ate
ract
ivation
than
patien
ts(C
)and
conver
sely
,re
gio
ns
with
gre
ate
ract
ivity
inpati
ents
than
inco
ntr
ols
(D).
BA
are
as
rele
vant
tovis
ualpro
cess
ing
are
17
(V1),
18
(V2/V
3),
19
(V4)
and
20
(IT
).∗D
enote
san
inability
todiff
eren
tiate
left
from
right.
Thes
enum
ber
sare
iden
tica
lbec
ause
ofth
isdiffi
culty.
∼D
enote
sno
signifi
cant
clust
ers
inth
eid
enti
fied
regio
n.
(A)
Contr
ols
0(B
)Patien
ts0
BA
MN
IC
oord
inate
sk
Max.
MN
IC
oord
inate
sk
Max.
xy
zZ
xy
zZ
Dors
ola
tera
lP
refr
onta
lC
ort
exR
ight
46
−42
42
22
156
4.1
∼∼
∼∼
∼Lef
t46
36
52
20
261
4.8
6∼
∼∼
∼∼
Orb
itofr
onta
lC
ort
exR
ight
11/12
−26
42
−14
81
5.2
1∼
∼∼
∼∼
Lef
t11/12
16
42
−18
62
6.8
7∼
∼∼
∼∼
Supple
men
tary
Moto
rA
rea
(SM
A)
∼6
−610
56
36
4.2
5−2
852
41
5.7
6
Fro
nta
lE
ye
Fie
lds
(FE
F)
Rig
ht
8−3
311
55
48
4.6
5−4
213
51
53
5.5
8Lef
t8
28
862
65
3.8
738
763
70
5.8
8
Super
ior
Pariet
alLobule
Rig
ht
7−2
4−7
058
2354
4.2
1−3
1−5
966
1957
9.4
8Lef
t7
21
−60
71
3126
5.6
918
−61
80
1672
8.0
4
Infe
rior
Pariet
alLobule
Rig
ht
40
−42
−41
48
856
4.2
8−4
7−4
343
702
8.8
3Lef
t40
67
−26
51
1168
4.9
850
−38
50
576
10.2
9
Thala
mus
Rig
ht
∼−2
4−1
813
156∗
5.2
1−2
0−2
111
46
8.3
1Lef
t∼
16
−22
8156∗
6.1
818
−26
635
3.9
7
Super
ior
Tem
pora
lG
yru
sR
ight
22
−52
−26
14
36
4.2
2−4
9−1
316
60
9.9
7Lef
t22
48
−20
20
82
3.8
747
−16
21
56
5.3
2
Mid
dle
Tem
pora
lG
yru
sR
ight
21
-56
−52
267
6.7
2-5
0−4
64
195
8.9
7Lef
t21
60
−44
158
8.1
259
−39
646
6.3
2
Infe
rior
Tem
pora
lG
yru
sR
ight
20
−47
−60
−18
119
5.2
9−5
6−6
4−8
98
4.0
2Lef
t20
38
−56
−8387
6.1
250
−38
−13
67
8.4
5

186 Silverstein et al.
Table
1.
(Continued
)
(A)
Contr
ols
0(B
)Patien
ts0
BA
MN
IC
oord
inate
sk
Max.
MN
IC
oord
inate
sk
Max.
xy
zZ
xy
zZ
VisualC
ort
exR
ight
17/18/19
−16
−88
12
2111∗
6.2
6−2
1−7
610
3526∗
5.8
6Lef
t17/18/19
22
−80
16
2111∗
8.7
230
−68
12
3526∗
5.0
9
Cer
ebel
lum
Rig
ht
∼−1
7−7
0−5
686
5.6
7−2
3−8
0−4
9102
6.4
5Lef
t∼
21
−78
−50
123
6.1
128
−68
−47
111
6.4
2
(C)
Contr
ols
>Patien
ts0
(D)
Patien
ts>
Contr
ols
0D
ors
ola
tera
lP
refr
onta
lC
ort
exR
ight
46
−37
46
51
42
5.9
8∼
∼∼
∼∼
Lef
t46
34
44
55
51
7.6
5∼
∼∼
∼∼
Fro
nta
lE
ye
Fie
lds
(FE
F)
Rig
ht
8−5
19
49
31
5.8
8∼
∼∼
∼∼
Lef
t8
46
851
36
8.0
3∼
∼∼
∼∼
Super
ior
Pariet
alLobule
Rig
ht
7−1
6−6
656
51
6.0
1∼
∼∼
∼∼
Lef
t7
25
−57
55
113
3.1
4∼
∼∼
∼∼
Caudate
(hea
d)
Rig
ht
24
∼∼
∼∼
∼−1
29
10
36
4.7
7
Super
ior
Tem
pora
lG
yru
sR
ight
22
∼∼
∼∼
∼−4
3−1
818
31
3.1
2
Mid
dle
Tem
pora
lG
yru
sLef
t21
∼∼
∼∼
∼58
−38
651
7.3
8
VisualC
ort
exR
ight
17/18/19
−36
−61
16
23
4.9
∼∼
∼∼
∼

Visual Integration in Schizophrenia 187
and within the anterior cingulate for controls, with women showing greater activationthan men. When examined in the other direction (men > women) significant voxelswere identified within the horn of the lateral ventricles. Overall, however, it appearsthat there are no meaningful gender differences on this task, and none of these reachstatistical significance when the data are corrected for multiple comparisons.
3.5. Networks subserving object recognition
To examine the networks implicated in recognition of coherent objects and the deci-sion making which follows, we contrasted activation during the 0◦ jitter conditionrelative to the (least organized) 23◦ jitter condition in controls and in patients.Because performance was near 90% in the 0◦ condition and at chance in the 23◦ con-dition for both controls and patients, contrasts between these conditions representrecognition of a coherent object relative to an unorganized stimulus field. Resultingactivation maps are presented in Fig. 4, and detailed coordinates of peak activationfrom each region are presented in Table 2. In controls, there was greater activity inthe 0◦ condition relative to the 23◦ condition involving regions in prefrontal cortex
Fig. 4. Activation maps demonstrating activity during 0◦ jitter compared to a condition in whichcontours were not visible (i.e., 23◦ jitter), in controls (A) and in patients (C) and activationmaps depicting greater activation in the 23◦ jitter condition relative to 0◦ in controls (B) andin patients (D). Replication of these findings with contrasts between the 0◦ and 19◦ conditions ispresented in the bottom panel. Significant voxels are presented corrected for multiple comparisonswith a p-valueFDR < 0.05.

188 Silverstein et al.
Table
2.
Magnit
ude
of
pea
kact
ivity
(maxim
um
z-s
tati
stic
),co
ord
inate
sin
MN
Isp
ace
,and
corr
espondin
gB
rodm
ann
are
as
(BA
)fo
rea
chsignifi
cant
clust
erof
act
ivati
on
for
contr
ast
sbet
wee
nex
trem
ejitt
erco
ndit
ions
for
contr
ols
(A:0◦
>23◦
and
B:23◦
>0◦ )
and
pati
ents
(C:0◦
>23◦
and
D:23◦
>0◦ )
.∼
Den
ote
sno
signifi
cant
clust
ers
inth
eid
enti
fied
regio
n.
(A)
Contr
ols
0>
23
(B)
Pati
ents
0>
23
BA
MN
IC
oord
inate
sk
Max.
MN
IC
oord
inate
sk
Max.
xy
zZ
xy
zZ
Pre
fronta
lC
ort
ex(P
FC
)R
ight
∼−3
240
−2150
5.3
56
72
049
6.5
7Lef
t∼
30
54
12
96
3.9
9∼
∼∼
∼∼
Ante
rior
Cin
gula
te∼
24
12
30
23
48
8.7
5∼
∼∼
∼∼
Fro
nta
lE
ye
Fie
lds
(FE
F)
Rig
ht
8−3
19
59
60
9.1
6∼
∼∼
∼∼
Lef
t8
33
957
30
5.6
1∼
∼∼
∼∼
Caudate
Rig
ht
24
−12
816
27
5.4
1∼
∼∼
∼∼
Lef
t24
10
418
44
4.7
5∼
∼∼
∼∼
Thala
mus
Rig
ht
∼−1
4−3
24
46
7.9
7∼
∼∼
∼∼
Lef
t∼
6−3
04
35
6.6
8∼
∼∼
∼∼
Super
ior
Tem
pora
lG
yru
sR
ight
22
−51
−26
14
45
16.1
3∼
∼∼
∼∼
Lef
t22
50
−21
16
44
11.2
5∼
∼∼
∼∼
Mid
dle
Tem
pora
lG
yru
sR
ight
21
−49
−50
431
5.2
7∼
∼∼
∼∼
Lef
t21
56
−49
150
5.8
1∼
∼∼
∼∼
Infe
rior
Tem
pora
lG
yru
sR
ight
20
−46
−60
−17
57
3.8
7∼
∼∼
∼∼
Lef
t20
42
−49
−436
2.6
1∼
∼∼
∼∼
VisualC
ort
exR
ight
17/18/19
−26
−81
438
8.1
1∼
∼∼
∼∼
Lef
t17/18/19
21
−72
837
11.0
4∼
∼∼
∼∼
Fusi
form
Gyru
sR
ight
37
−32
−46
−14
39
10.4
6−2
4−4
6−1
820
3.8
1Lef
t37
52
−72
836
7.0
728
−64
−26
48
9.2
0
Para
hip
poca
mpalG
yru
sR
ight
34
∼∼
∼∼
∼−2
6−3
62
41
3.1
7Lef
t34
∼∼
∼∼
∼14
−36
824
16.2
9

Visual Integration in Schizophrenia 189
Table
2.
(Continued
)
(C)
Contr
ols
23
>0
(D)
Patien
ts23
>0
BA
MN
IC
oord
inate
sk
Max.
MN
IC
oord
inate
sk
Max.
xy
zZ
xy
zZ
Orb
itofr
onta
lC
ort
exR
ight
11/12
∼∼
∼∼
∼20
48
−637
12.6
6Lef
t11/12
∼∼
∼∼
∼−1
242
−643
8.3
4
Pre
fronta
lC
ort
exR
ight
∼∼
∼∼
∼∼
−30
26
12
32
3.8
3Lef
t∼
∼∼
∼∼
∼26
26
10
46
4.7
2
Mid
dle
Tem
pora
lG
yru
sR
ight
21
∼∼
∼∼
∼−5
1−3
13
35
4.8
1Lef
t21
∼∼
∼∼
∼52
−46
435
10.7
3
VisualC
ort
exR
ight
17/18/19
−23
−77
192
6.8
2−2
3−7
211
28
9.8
1Lef
t17/18/19
23
−68
269
5.8
928
−70
11
27
10.8
3

190 Silverstein et al.
(bilaterally), anterior cingulate, frontal eye fields, superior, middle, and inferior tem-poral gyri, posterior cingulate, V2/V3 and fusiform gyri. In contrast, only regionsin visual cortex were more active in the 23◦ condition relative to the 0◦ condition incontrols. In patients, two regions identified as left and right parahippocampal gyriand another region identified as right fusiform gyrus were differentially greater inthe 0◦ condition relative to 23◦. When the 0◦ condition was subtracted from the 23◦
condition in patients, a network which included left orbitofrontal cortex, left andright caudate (head), left and right medial prefrontal cortex, left middle temporalgyrus, and bilateral primary visual cortex was identified.
As a check on the reliability of the results from the 0◦ vs. 23◦ condition con-trast, we also compared the groups on the 0◦ vs. 19◦ contrast, and this revealed asimilar pattern of results (see Fig. 4). The controls showed greater activity in the0◦ condition in prefrontal regions, the anterior cingulate, superior and inferior pari-etal lobules, and in the superior, middle, and inferior temporal regions. In contrast,patients showed only small clusters of significant activity in the thalamus, superiortemporal gyri, and parahippocamal gyri in the 0◦ condition when contrasted withthe 19◦ condition. For controls, there was increased activity during the 19◦ condi-tion (compared to the 0◦ condition) primarily in the head of the caudate and visualregions. Similar to contrasts between the 23◦ and 0◦ conditions, patients showedincreased activity in the 19◦ (relative to 0◦) condition across a widespread of net-work including prefrontal, inferior frontal, superior, middle, and inferior temporalregions, visual cortices, and regions in the fusiform gyri.
3.6. Signal modulation in visual cortices
One primary hypothesis in the current investigation is that the signal in visualcortex regions that are maximally sensitive to basic shape features may differ inpatients relative to controls. To examine this directly we extracted peak inten-sities from regions associated with visual processing and object integration [V1,V2/V3, V4, inferotemporal cortex (IT)] in each condition (see Fig. 5). Compar-isons between peak activation within each hemisphere and degree of activation
Fig. 5. Regions of interest for extraction of the peak signal change within V1 (green), V2/V3(red), V4 (blue), and inferotemporal cortex (IT) (yellow). Peak signal intensity for controls (blackcircles) and patients (white circles) for areas involved in visual processing.

Visual Integration in Schizophrenia 191
(cluster size) were conducted. None of these comparisons reached statistical signifi-cance (p > 0.05) although the comparison between hemispheres for peak activationin V2/V3 trended to show an increase in peak activity with right greater than leftfor controls [F (1, 26)= 2.96, p = 0.071]. As such, all further comparisons collapsedacross cerebral hemispheres. In primary visual cortex (V1) there was a main effectof condition [F (5, 130)= 5.80, p < 0.001]. There was no main effect of subject group[control, patient; F (1, 26)= 0.33, p > 0.57] or interaction between group and degreeof jitter [F (5, 130)= 0.38, p > 0.86]. In V2/V3, signal change also increased as degreeof jitter increased [F (5, 130)= 6.98, p < 0.001]. However, there was a main effect ofsubject group such that controls showed higher peak signal changes than patientsdid [F (1, 26)= 5.68, p = 0.025]. The degree of increased signal change in controls rel-ative to patients was consistent across all conditions of jitter, as revealed by a lack ofgroup × condition interaction [F (5, 130)= 0.38, p > 0.86]. Similar effects were foundfor V4 with main effects of subject group [F (1, 26)= 4.89, p < 0.05] and condition[F (5, 130)= 5.09, p < 0.001] but no group × condition interaction [F (5, 130)= 1.08,p > 0.72]. There were no significant effects of peak signal change for subject groupor condition for IT within the inferior temporal lobe.
3.7. Networks matched on accuracy
To ensure that the above results were not confounded by correlates of poor perfor-mance in the patient group, a final set of analysis compared the groups across threecontrasts where, on each one, they were matched on performance (see Fig. 2): (1)patients at 7◦, controls at 11◦; (2) patients at 11◦, controls at 15◦; and (3) patientsat 15◦, controls at 19◦ (see Fig. 6).
As can be seen, 6A–C controls showed greater activation (even when matchedon behavior) in the head of the caudate (Figs. 6B, 6C), both inferior and superiorparietal lobules (Figs. 6A–C), left and right putamen (Figs. 6A, B), right dorsolateralprefrontal cortex (Figs. 6A, C), and regions in V2/V3. In contrast, patients showed
Fig. 6. Contrasts between controls and patients when matched for accuracy (A: 11◦ in controlsand 7◦ in patients; B: 15◦ in controls and 11◦ in patients; C: 19◦ in controls and 15◦ in patients).Greater activity for controls (top) and greater activity for patients (bottom) is presented. Significantvoxels are presented corrected for multiple comparisons with a p-valueFDR < 0.05.

192 Silverstein et al.
greater activation in the anterior cingulate, left dorsolateral prefrontal cortex (butmore medially than the regions of greater activity in controls), fusiform gyri, superiortemporal gyri, middle temporal gyri, and V5. Peak activation within each region andcorresponding coordinates are presented in Table 3.
3.8. Relationships between behavioral data,
medication, and symptoms
For correlational analyses, indices of visual integration were constructed from thebehavioral data by examining the differences between performance at the 0 jit-ter condition and performance in other conditions. Relationships between theseperformance-based contrast values and medication dose (in CPZ equivalents) wereexamined by correlating these values with CPZ equivalent for each subject withschizophrenia (reliable medication data could not be obtained for two patients).The r values for these correlations were: 0.03 (7◦), −0.08 (11◦), 0.15 (15◦), 0.11(19◦), and 0.20 (23◦), consistently indicating an independence of visual integrationand medication level. Correlations between symptom levels and these performanceindices were not significant.
4. Discussion
There were two major findings from the fMRI data. First, while in all cases exceptone controls and patients were equivalent in their signal change in area V1, signalstrength was consistently relatively reduced in patients in higher visual cortex areas(e.g., V2, V3, V4). Because V1 is most sensitive to individual features (as opposed toemergent holistic features), whereas areas V2–V4 are maximally sensitive to globalstimulus organization, these data suggest that the performance deficits reflect atrue weakening of visual integration processes, and are not secondary to impairedsensory registration or feature integration. This hypothesis is consistent with fMRIdata from healthy subjects, and from monkey studies, demonstrating that activationin V1 is generally not increased during perception of contours, and that even whenV1 activity is found [1], signals are typically strongest in higher tier areas such asV3 and V4, and in more anterior visual areas [42, 45]. These data are also consistentwith ERP findings of reduced N150 during a global–local task in schizophrenia [26],data localizing the N150 source to visual areas V3/V3a [10, 26, 70], and findings ofreduced occipital lobe gamma oscillations during a visual processing task, even whenbehavioral performance is equivalent to that of controls [63]. It is noteworthy thatcontrols demonstrated more activation in areas V2 and V3 even when matched topatients on accuracy level, and that patients demonstrated reduced activation evenin the 0◦ and 23◦ jitter conditions. The 0◦ condition result suggests that even whenthe contour stimulus was maximally structured, allowing for highly accurate contourperception, patients nevertheless were characterized by a weaker neural signal whencoding the stimulus. As stimulus structure was weakened by introducing orientation

Visual Integration in Schizophrenia 193
Table
3.
Magnit
ude
of
pea
kact
ivity
(maxim
um
z-s
tati
stic
),co
ord
inate
sin
MN
Isp
ace
,and
corr
espondin
gB
rodm
ann
are
as
(BA
)fo
rea
chsignifi
cant
clust
erof
act
ivati
on
for
contr
ast
sbet
wee
nco
ntr
ols
and
pati
ents
matc
hed
on
beh
avio
ralper
form
ance
.∗
Den
ote
san
inability
todiff
eren
tiate
left
from
right.
Thes
enum
ber
sare
iden
tica
lbec
ause
ofth
isdiffi
culty.
∼D
enote
sno
signifi
cant
clust
ers
inth
eid
enti
fied
regio
n.
Contr
ols
11
>Patien
ts7
Pati
ents
7>
Contr
ols
11
BA
MN
IC
oord
inate
sk
Max.
MN
IC
oord
inate
sk
Max.
xy
zZ
xy
zZ
Dors
ola
tera
lP
refr
onta
lC
ort
exR
ight
46
−49
29
27
49
5.8
3−3
838
16
235
3.5
0Lef
t46
30
51
837
6.0
132
60
14
40
5.4
1
Pre
fronta
lC
ort
exR
ight
∼−3
034
44
33
5.3
3−6
58
16
105
4.2
9Lef
t∼
22
44
20
83
3.4
26
54
40
60
3.6
0
Ante
rior
Cin
gula
teR
ight
32
−16
30
10
78
4.2
7∼
∼∼
∼∼
Lef
t32
18
28
983
3.0
95
31
11
195
6.4
5
Super
ior
Pariet
alLobule
Rig
ht
7−3
4−7
832
305
3.0
5∼
∼∼
∼∼
Lef
t7
24
−72
32
662
6.5
2∼
∼∼
∼∼
Infe
rior
Pariet
alLobule
Rig
ht
40
−39
−26
41
333
9.5
6∼
∼∼
∼∼
Lef
t40
51
−29
45
82
3.8
1∼
∼∼
∼∼
Puta
men
Lef
t∼
22
412
110
5.6
3∼
∼∼
∼∼
Fusi
form
Gyru
sR
ight
37
∼∼
∼∼
∼−3
8−4
6−2
0102
5.7
6Lef
t37
∼∼
∼∼
∼38
−56
4230
4.5
0
Mid
dle
Tem
pora
lG
yru
sR
ight
19
∼∼
∼∼
∼−5
9−4
22
80
3.0
5Lef
t19
∼∼
∼∼
∼52
−50
547
3.0
9
VisualC
ort
ex(V
1,V
2,V
3)
Rig
ht
17/18/19
−19
−73
273
5.1
7∼
∼∼
∼∼
Lef
t17/18/19
23
−90
10
58
6.4
8∼
∼∼
∼∼

194 Silverstein et al.
Table
3.
(Continued
)
Contr
ols
15
>Patien
ts11
Patien
ts11
>C
ontr
ols
15
BA
MN
IC
oord
inate
sk
Max.
MN
IC
oord
inate
sk
Max.
xy
zZ
xy
zZ
Dors
ola
tera
lP
refr
onta
lC
ort
exR
ight
46
∼∼
∼∼
∼−3
150
442
4.8
2Lef
t46
∼∼
∼∼
∼30
37
−2102
7.2
9
Pre
fronta
lC
ort
exR
ight
∼−1
851
20
48
6.1
5∼
∼∼
∼∼
Lef
t∼
25
44
837
3.9
2∼
∼∼
∼∼
Caudate
Rig
ht
24
−20
20
637
4.2
6∼
∼∼
∼∼
Lef
t24
13
615
68
5.1
8∼
∼∼
∼∼
Super
ior
Pariet
alLobule
Rig
ht
7−4
1−7
635
153
8.1
6−4
6−6
649
118
4.8
2Lef
t7
38
−65
29
99
6.2
839
−61
35
67
9.7
2
Infe
rior
Pariet
alLobule
Rig
ht
40
−52
−38
37
60
6.6
9−5
1−3
536
49
3.8
2Lef
t40
49
−35
41
67
5.7
242
−51
38
218
7.7
6
Puta
men
Lef
t∼
26
−5−2
34
3.0
9∼
∼∼
∼∼
Fusi
form
Gyru
sR
ight
37
−41
−38
−11
110
4.2
9∼
∼∼
∼∼
Lef
t37
40
−32
−17
64
4.2
6∼
∼∼
∼∼
Mid
dle
Tem
pora
lG
yru
sR
ight
19
−56
−55
−2215
5.4
1∼
∼∼
∼∼
Lef
t19
47
−47
−5107
3.8
9∼
∼∼
∼∼

Visual Integration in Schizophrenia 195
Table
3.
(Continued
)
Contr
ols
19
>Patien
ts15
Patien
ts15
>C
ontr
ols
19
BA
MN
IC
oord
inate
sk
Max.
MN
IC
oord
inate
sk
Max.
xy
zZ
xy
zZ
Dors
ola
tera
lP
refr
onta
lC
ort
exR
ight
46
−14
64
830
4.1
5∼
∼∼
∼∼
Ven
trola
tera
lP
refr
onta
lC
ort
exLef
t∼
10
64
134
6.1
8∼
∼∼
∼∼
Caudate
Rig
ht
24
−12
10
668
5.7
0∼
∼∼
∼∼
Lef
t24
22
22
−251
3.8
1∼
∼∼
∼∼
Super
ior
Pariet
alLobule
Rig
ht
7−4
0−6
841
64
3.5
9−3
4−7
829
62
4.2
9Lef
t7
39
−70
36
39
4.5
924
−72
27
68
3.0
8
Infe
rior
Pariet
alLobule
Rig
ht
40
−42
−32
32
46
3.2
5−3
9−2
643
82
7.2
5Lef
t40
47
−34
45
59
3.7
951
−29
45
55
6.1
9
Post
erio
rC
ingula
teR
ight
32
∼∼
∼∼
∼5
−54
0125∗
5.8
9Lef
t32
∼∼
∼∼
∼3
−46
7125∗
4.5
5
Mid
dle
Tem
pora
lG
yru
sR
ight
19
−46
−55
−756
4.2
6−4
8−5
61
41
3.9
2Lef
t19
48
−46
381
3.9
9∼
∼∼
∼∼
VisualC
ort
ex(V
1,V
2,V
3)
Rig
ht
17/18/19
∼∼
∼∼
∼−1
0−7
81
61
4.8
9

196 Silverstein et al.
uncertainty, however, continued weakening of the neural coding occurred, and wasassociated with impaired behavioral performance.
Second, the overall network of brain activity during task performance was morewidely distributed in controls, and involved greater recruitment of frontal and pari-etal areas in the control of visual attention. It is likely that activation in these moreanterior areas reflected both feedforward processing of the contours from posteriorareas, and the generation of feedback from frontal and parietal to visual areas tostrengthen the salience of the overall contour representation relative to backgroundnoise [41].
In the control group, reaction time increased as a function of contour elementorientation jitter (i.e., as the stimuli became more difficult to integrate). This wasassociated with an increase in visual cortex activation, presumably reflecting pro-longed visual analysis, but not activation in other cortical regions. In contrast, theschizophrenia group demonstrated an attenuated pattern of increasing RTs as afunction of orientation jitter. Moreover, they demonstrated increased activation pri-marily in anterior regions, with less visual cortex activation increase in the conditionwhere contours were least visible. This pattern of results suggests that the nor-mal linkage between the requirement for prolonged visual analysis, increased visualcortex activity, and delayed response preparation is disrupted in schizophrenia. Itappears as if, in schizophrenia, enhanced demands for visual analysis led to a morediffuse pattern of brain activity, one that does not support the prolonged mainte-nance of visual processing required for successful performance, or allow for a delay inbehavioral responding until adequate visual analysis is completed. Specific evidencein support of this hypothesis is that the largest differences between patients andcontrols in RT were in the three most difficult conditions.
Visual integration performance was not related to either medication dose or tosymptoms. Although the issue of relating performance to medication was not a focusof this study (given consistent evidence of a nonrelationship in past studies [69]),it should be noted that this study was underpowered to detect these relationshipswith correlational analyses. The same issue of power holds for analysis of symptom-performance relationships. However, as patients in this study were all clinically sta-ble and were experiencing relatively low levels of symptoms (e.g., mean PANSSsymptom scores were within the minimal-mild range for all 5 factors), the studydid not include a symptomatically heterogeneous enough group of patients to detectthese relationships. In general, cognition-symptom relationships are observed morereliably in more symptomatically heterogeneous samples [60], and specifically, visualintegration deficits have been linked to clinical disorganization when symptomaticsamples are studied [25, 28, 47, 51, 59, 65–67, 69]. The finding of behavioral and neu-rophysiological evidence for visual integration in a relatively asymptomatic sample,however, suggests that the contour integration task is a sensitive and psychophys-ically rigorous measure of visual integration, and also that integration dysfunctionmay be present even in relatively remitted patients — although the impairment can

Visual Integration in Schizophrenia 197
be expected to be reduced compared to more acutely or chronically symptomaticpatients.
A potential limitation of this study is that the stimulus presentation used a blockdesign in which the difficulty level increased with each successive block. This poten-tially confounds the observed results with a nonspecific order effect. The design waschosen based on prior data that schizophrenia patients and controls demonstratedperformance differences using this version of the task, and that this version is botha reliable and valid measure of visual integration [37]. Still, a direct comparisonbetween random versus blocked presentation of stimuli could be informative. In aprior behavioral study by our group using a contour detection task (as opposed to the2AFC version used in this study), both healthy controls and schizophrenia patientsdemonstrated superior performance when stimuli were presented in increasing orderof difficulty, compared to when they were presented in a random order [57]. Thissuggests that while activation differences might exist between the two conditions,group differences might be similar across the two conditions. However, it is alsopossible that while both groups might perform better and have increased activationin the blocked condition, the group difference might be of a different magnitude inthe random condition, which would be informative regarding top–down effects oncontour processing.
Another limitation of the study involves a potential confound between contourintegration and attentional processes involved in visual search in the more difficultconditions. This is especially relevant to the contrasts comparing the 23◦ and 19◦
jitter conditions to the 0◦ condition, where inability to perceive a contour may haveled to attentional, or other unknown processes being used by subjects in what weassumed to be a control condition. This can be addressed to some extent in futurestudies by using passive viewing conditions where no response is required. On theother hand, we consider it unlikely that the greater activation in post-V1 areas in thecontrols, in the 0◦ vs. 19◦ and 0◦ vs. 23◦ contrasts, reflected such a confound because:(1) controls demonstrated these effects even when matched to patients on highlevels of accuracy, in contrasts in which data from more difficult conditions were notincluded; (2) in between-group contrasts comparing the groups on peak activationin each jitter condition alone, controls demonstrated greater activation in V2/V3and V4; and (3) our results from controls are strikingly similar to the nonclinicalhuman and monkey data observed by Altmann et al. [1], using tasks which did notrequire a subject response, and from analyses that did not contrast either easieror more difficult conditions. Overall, this suggests that the group differences inthe between-condition contrasts comparing contour-visible and contour-not-visibleconditions reflect true schizophrenia-related visual cortex processing abnormalities,as opposed to confounds related to either their poor motivation or increased effortexerted in the two most difficult conditions.
Although there was a trend towards a group difference in male:female ratio,it is unlikely that our findings are an artifact of this sex difference. First, males

198 Silverstein et al.
and females did not differ significantly in task performance, either within groups oroverall. Second, an ERP study [26] using a global–local task found that a relativeimpairment in identifying global forms was limited to female schizophrenia patients,whereas most subjects in our patient group were male. Third, in a re-analysis of anearlier study using a contour detection version of the contour integration task [57](N = 87), we found no main effect of gender (p = 0.66) or diagnosis vs. gendereffect (p = 0.7).
In summary, the results of this study extend past behavioral findings of visualintegration impairment in schizophrenia, by linking these accuracy and reactiontime disturbances to specific brain regions. The data highlight both the importanceof regional occipital lobe (V2–V4) activity in the visual integration impairmentin schizophrenia, as well as the changes in processing outside of the visual cortexthat can affect perception and task performance. Because it is known that visualintegration impairments are most pronounced in patients with prominent disor-ganized symptoms [25, 28, 47, 51, 56, 59, 65–67, 69], that symptomatic patientsimprove their visual integration task performance with treatment [67], and thatdegree of task score change covaries with change in disorganized symptoms [67], itis possible that repeated fMRI investigation of visual integration in patients mov-ing from the acute to stabilization phases of illness may reveal brain mechanismsinvolved in the normalization of perceptual, and perhaps other cognitive integrativefunctions.
Acknowledgments
This research was funded by a NARSAD Independent Investigator Award to StevenSilverstein, and by Hungarian Science Foundation OTKA NF grant 60806 to IlonaKovacs. We also thank Sarah Carson for her assistance in formatting the paper.None of the authors have a conflict or potential conflict of interest regarding anyproducts or procedures used in this research.
References
[1] Altmann CF, Bulthoff HH, Kourtzi Z, Perceptual organization of local elements intoglobal shapes in the human visual cortex, Curr Bio 13:342–349, 2003.
[2] Altmann CF, Deubelius A, Kourtzi Z, Shape saliency modulates contextual processingin the human lateral occipital complex, J Cogn Neurosci 16:794–804, 2004.
[3] Butler PD, Silverstein SM, Dakin S, Perception in schizophrenia: Recommenda-tions from the Cognitive Neuroscience Treatment Research to Improve Cognition inSchizophrenia (CNTRICS) conference, Biol Psychiatry 64:40–47, 2008.
[4] Carr V, Wale J, Schizophrenia: An information processing model, Aust N Z J Psychi-atry 20:136–155, 1986.
[5] Carter CS, Barch DM, Cognitive neuroscience-based approaches to measuring andimproving treatment effects on cognition in schizophrenia: The CNTRICS initiative,Schizophr Bull 33:1131–1137, 2007.

Visual Integration in Schizophrenia 199
[6] Chapman LJ, Chapman JP, The measurement of differential deficit, J Psychiatr Res14:303–311, 1978.
[7] Chey J, Holzman PS, Perceptual organization in schizophrenia: Utilization of theGestalt principles, J Abnorm Psychol 106:530–538, 1997.
[8] Dakin SC, Hess RF, Spatial-frequency tuning of visual contour integration, J Opt SocAm, A Opt Image Sci Vis 15:1486–1499, 1998.
[9] De Yoe EA, Carman GJ, Bandettini P, Glickman S, Wieser J, Cox R, Mapping stri-ate and extrastriate visual areas in human cerebral cortex, Proc Natl Acad Sci USA93:2382–2386, 1996.
[10] Di Russo F, Martinez A, Sereno MI, Pitzalis S, Hillyard SA, Cortical sources of theearly components of the visual evoked potential, Hum Brain Mapp 15:95–111, 2001.
[11] Doniger GM, Foxe JJ, Murray MM, Higgins BA, Javitt DC, Impaired visual objectrecognition and dorsal/ventral stream interaction in schizophrenia, Arch Gen Psychi-atry 59:1011–1020, 2002.
[12] Doniger GM, Silipo G, Rabinowicz EF, Snodgrass JG, Javitt DC, Impaired sensoryprocessing as a basis for object-recognition deficits in schizophrenia, Am J Psychiatry158:1818–1826, 2001.
[13] Eckhorn R, Neural mechanisms of visual feature binding investigated with microelec-trodes and models, Vis Cogn 6:231–265, 1999.
[14] Ferman TJ, Primeau M, Delis D, Jampala CV, Global–local processing in schizophre-nia: Hemispheric asymmetry and symptom-specific interference, J Int NeuropsycholSoc 5:442–451, 1999.
[15] Field DJ, Hayes A, Contour integration and the lateral connections of V1 neurons,in Chalupa LM, Werner JS (eds.), The Visual Neurosciences, Cambridge: MIT Press,pp. 1069–1079, 2004.
[16] First MB, Spitzer RL, Gibbon M, Williams JBW, Structured Clinical Interview forDSM-IV Axis I Disorders-Patient Edition (SCID-I/P Version 2.0), New York StatePsychiatric Institute, New York City, 1995.
[17] Forman SD, Cohen JD, Fitzgerald M, Eddy WF, Mintun MA, Noll DC, Improvedassessment of significant activation in functional magnetic resonance imaging (fMRI):Use of a cluster-size threshold, Magn Reson Med 33:636–647, 1995.
[18] Foxe JJ, Doniger GM, Javitt DC, Early visual processing deficits in schizophre-nia: Impaired P1 generation revealed by high-density electrical mapping, Neuroreport12:3815–3820, 2001.
[19] Foxe JJ, Murray MM, Javitt DC, Filling-in in schizophrenia: A high-density electricalmapping and source-analysis investigation of illusory contour processing, Cereb Cortex15:1914–1927, 2005.
[20] Frith CD, Stevens M, Johnstone EC, Owens DG, Integration of schematic faces andother complex objects in schizophrenia, J Nerv Ment Dis 171:34–39, 1983.
[21] Genovese CR, Lazar NL, Nichols T, Thresholding of statistical maps in functionalneuroimaging using the false discovery rate, NeuroImage 15:870–878, 2002.
[22] Goodarzi MA, Wykes T, Hemsley DR, Cerebral laterization of global–local processingin people with schizotypy, Schizophr Res 45:115–121, 2000.
[23] Green MF, Butler PD, Chen Y, Geyer MA, Silverstein S, Wynn JK, Yoon JH, Zemon V,Perception measurement in clinical trials of schizophrenia: Promising paradigms fromCNTRICS, Schizophr Bull 35:163–181, 2009.

200 Silverstein et al.
[24] Hess RF, Field DJ, Integration of contours: New insights, Trends Cogn Sci 3:480–486,1999.
[25] Izawa R, Yamamoto S, Spatio-temporal disintegration of visual perception inschizophrenia as revealed by a novel cognitive task, the searchlight task, SchizophrRes 53:67–74, 2002.
[26] Johnson SC, Lowery N, Kohler C, Turetsky BI, global–local visual processing inschizophrenia: Evidence for an early visual processing deficit, Biol Psychiatry 58:937–946, 2005.
[27] Kay SR, Opler LA, Fiszbein A, The positive and negative syndrome scale forschizophrenia, Schizophr Bull 13:261–276, 1987.
[28] Knight RA, Silverstein SM, The role of cognitive psychology in guiding research oncognitive deficits in schizophrenia, in Lenzenweger ML, Dworkin RH (eds.), Origins andDevelopment of Schizophrenia: Advances in Experimental Psychopathology, WashingtonDC: APA Press, pp. 247–295, 1998.
[29] Knight RA, Silverstein SM, A process oriented strategy for averting confounds resultingfrom general performance deficiencies in schizophrenia, J Abnorm Psychol 110:15–40,2001.
[30] Kourtzi Z, Tolias AS, Altmann CF, Augath M, Logothetis NK, Integration of localfeatures into global shapes: Monkey and human fMRI studies, Neuron 37:333–346,2003.
[31] Kovacs I, Gestalten of today: Early processing of visual contours and surfaces, BehavBrain Res 82:1–11, 1996.
[32] Kovacs I, Feher A, Julesz B, Medial-point description of shape: A representation foraction coding and its psychophysical correlates, Vision Res 38:2323–2333, 1998.
[33] Kovacs I, Julesz B, A closed curve is much more than an incomplete one: Effect ofclosure in figure-ground segmentation, Proc Natl Acad Sci USA 90:7495–7497, 1993.
[34] Kovacs I, Julesz B, Perceptual sensitivity maps within globally defined visual shapes,Nature 370:644–646, 1994.
[35] Kovacs I, Kozma P, Feher A, Benedek G, Late maturation of visual spatial integrationin humans, Proc Natl Acad Sci USA 96:12204–12209, 1999.
[36] Kovacs I, Polat U, Pennefather PM, Chandna A, Norcia AM, A new test of contourintegration deficits in patients with a history of disrupted binocular experience duringvisual development, Vision Res 40:1775–1783, 2000.
[37] Kozma-Wiebe P, Silverstein S, Feher A, Kovacs I, Uhlhaas PJ, Wilkniss S, Developmentof a world-wide web based contour integration test: Reliability and validity, ComputHum Behav 22:971–980, 2006.
[38] Lerner Y, Hendler T, Malach R, Object-completion effects in the human lateral occip-ital complex, Cerebral Cortex 12:163–177, 2002.
[39] Lindenmayer JP, Bernstein-Hyman R, Grochowski S, A new five factor model ofschizophrenia, Psychiatr Q 65:299–322, 1994.
[40] Maldjian JA, Laurienti PJ, Kraft RA, Burdette JH, An automated method for neu-roanatomic and cytoarchitectonic atlas-based interrogation of fMRI data sets, Neu-roImage 19:1233–1239, 2003.
[41] Maunsell JHR, Cook EP, The role of attention in visual processing, Philos Trans RSoc Lond B Biol Sci 357:1063–1072, 2002.

Visual Integration in Schizophrenia 201
[42] Mendola JD, Dale AM, Fischl B, Liu AK, Tootell RB, The representation of illusory andreal contours in human cortical visual areas revealed by functional magnetic resonanceimaging, J Neurosci 19:8560–8572, 1999.
[43] Parnas J, Vianin P, Saebye D, Jansson L, Volmer-Larson A, Bovet P, Visual bind-ing abilities in the initial and advanced stages of schizophrenia, Acta Psychiatr Scand103:171–180, 2001.
[44] Pennefather PM, Chandna A, Kovacs I, Polat U, Norcia AM, Contour detectionthreshold: Repeatability and learning with “contour cards”, Spat Vis 12:257–266,1999.
[45] Peterhans E, Von der Heydt R, Mechanisms of contour perception in monkey visualcortex. I. Contours bridging gaps, J Neurosci 9:1749–1763, 1989.
[46] Peters ER, Nunn JA, Pickering AD, Hemsley DR, Perceptual organization deficits inpsychotic patients, Psychiatr Res 2:125–135, 2002.
[47] Phillips WA, Silverstein SM, Impaired cognitive coordination in schizophrenia: Con-vergence of neurobiological and psychological perspectives, Behav Brain Sci 26:65–138,2003.
[48] Place EJ, Gilmore GC, Perceptual organization in schizophrenia, J Abnorm Psychol89:409–418, 1980.
[49] Rabinowicz EF, Opler LA, Owen DR, Knight RA, The dot enumeration percep-tual organization task (depot): Evidence for a short-term visual memory deficit inschizophrenia, J Abnorm Psychol 13:555–576, 1987.
[50] Rawlings D, Claridge G, Schizotypy and hemispheric function-III, Pers Individ Diff5:657–663, 1984.
[51] Schenkel LS, Spaulding WD, Silverstein SM, Poor premorbid social functioning andtheory of mind deficit in schizophrenia: Evidence of reduced context processing?J Psychiatr Res 39:499–508, 2005.
[52] Sehatpour P, Molholm S, Javitt DC, Foxe JJ, Spatiotemporal dynamics of humanobject recognition processing: An integrated high-density electrical mapping and func-tional imaging study of “closure” processes, Neuroimage 29:605–618, 2006.
[53] Sehatpour P, Molholm S, Schwartz TH, Mahoney JR, Mehta AD, Javitt DC, StantonPK, Foxe JJ, A human intracranial study of long-range oscillatory coherence across afrontal-occipital-hippocampal brain network during visual object processing, Proc NatlAcad Sci USA 105:4399–4404, 2008.
[54] Shapley R, Rubin N, Ringach D, Visual segmentation and illusory contours, inChalupa LM, Werner JS (eds.), The Visual Neurosciences, Cambridge: MIT Press,pp. 1119–1128, 2004.
[55] Silverstein SM, Measuring specific, rather than generalized, cognitive deficits and maxi-mizing between-group effect size in studies of cognition and cognitive change, SchizophrBull 34:645–655, 2008.
[56] Silverstein SM, Bakshi S, Chapman RM, Nowlis G, Perceptual organization of config-ural and nonconfigural visual patterns in schizophrenia: Effects of repeated exposure,Cogn Neuropsychiatry 3:209–223, 1998.
[57] Silverstein SM, Hatashita Wong MH, Schenkel LS, Kovacs I, Feher A, Smith TE,Reduced top-down influences in contour detection in schizophrenia, Cogn Neuropsychi-atry 11:112–132, 2006.

202 Silverstein et al.
[58] Silverstein SM, Knight RA, Schwarzkopf SB, West LL, Osborn LM, Kamin D, Stimulusconfiguration and context effects in perceptual organization in schizophrenia, J AbnormPsychol 104:410–420, 1996.
[59] Silverstein SM, Kovacs I, Corry R, Valone C, Perceptual organization, the disorga-nization syndrome, and context processing in chronic schizophrenia, Schizophr Res43:11–20, 2000.
[60] Silverstein SM, Wallace CJ, Schenkel LS, The micro-module learning tests: Work sam-ple assessments of responsiveness to skills training, Schizophr Bull 31:73–83, 2005.
[61] Spencer KM, Nestor PG, Niznikiewicz MA, Salisbury DF, Shenton ME, McCarley RW,Abnormal neural synchrony in schizophrenia, J Neurosci 23:7407–7411, 2003.
[62] Spencer KM, Nestor PG, Perlmutter R, Niznikiewicz MA, Klump MC, Frumin M,Neural synchrony indexes disordered perception and cognition in schizophrenia, ProcNatl Acad Sci USA 101:17288–17293, 2004.
[63] Spencer KM, Niznikiewicz MA, Shenton ME, McCarley RW, Sensory-evoked gammaoscillations in chronic schizophrenia, Biol Psychiatry 63:744–747, 2008.
[64] Uhlhaas PJ, Mishara AL, Perceptual anomalies in schizophrenia: Integrating phe-nomenology and cognitive neuroscience, Schizophr Bull 33:142–156, 2007.
[65] Uhlhaas PJ, Phillips WA, Mitchell G, Silverstein SM, Perceptual grouping in disorga-nized schizophrenia, Psychiatr Res 145:105–117, 2006.
[66] Uhlhaas PJ, Phillips WA, Schenkel LS, Silverstein SM, Theory of mind and perceptualcontext-processing in schizophrenia, Cogn Neuropsychiatry 11:416–436, 2006.
[67] Uhlhaas PJ, Phillips WA, Silverstein SM, The course and clinical correlates of dys-functions in visual perceptual organization in schizophrenia during the remission ofpsychotic symptoms, Schizophr Res 75:183–192, 2005.
[68] Uhlhaas PJ, Silverstein SM, The continuing relevance of gestalt psychology for anunderstanding of schizophrenia, Gestalt Theory 4:256–270, 2003.
[69] Uhlhaas PJ, Silverstein SM, Perceptual organization in schizophrenia spectrum disor-ders: A review of empirical research and associated theories, Psychol Bull 131:618–632,2005.
[70] Vanni S, Warnking J, Dojat M, Delon-Martin C, Bullier J, Segebarth C, Sequence ofpattern onset responses in the human visual areas: An fMRI constrained VEP sourceanalysis, Neuroimage 21:801–817, 2004.
[71] Wellcome Department of Imaging Neuroscience, Statistical Parametric Mapping, Ver-sion 2 (SPM2). London, UK, 2002.
[72] Wells DS, Leventhal D, Perceptual grouping in schizophrenia: A replication of Placeand Gilmore, J Abnorm Psychol 93:231–234, 1984.
[73] Woods SW, Chlorpromazine equivalent doses for the newer atypical antipsychotics,J Clin Psychiatry 64:663–667, 2003.