research report for measuring emissions from spray polyurethane … · research report for...
TRANSCRIPT
This work is protected by copyright. This paper and all data and information contained in it, are owned and protected by the ACC
through its Center for the Polyurethanes Industry. Users are granted a nonexclusive royalty-free license to reproduce and distribute
this paper, subject to the following limitations: (1) the work must be reproduced in its entirety, without alterations; and (2) copies
of the work may not be sold.
Copyright © 2012 Polyurethanes Technical Conference, American Chemistry Council.
1
Research Report for Measuring Emissions from Spray Polyurethane Foam (SPF) Insulation John R. Sebroski
Bayer MaterialScience LLC
100 Bayer Road
Pittsburgh, PA 15205
Phone: 412-777-3420, Email: [email protected]
September 4, 2012
ABSTRACT
This report discusses the status of ongoing analytical method development and research activities to support the
development of ASTM standard practices and test methods to measure potential chemical emissions from spray polyurethane
foam (SPF) insulation designed for on-site application in buildings. The consensus standards are being developed to evaluate SPF
products to establish re-occupancy times for trade workers and residents as well as to assess indoor air quality after installation.
Three generic foam formulations including closed-cell, open-cell and a low pressure kit formulation were used to evaluate the test
protocols. An analytical method was developed with thermal desorption and GC/MS to measure volatile organic compounds
(VOCs), e.g., blowing agents, in addition to semi-volatile organic compounds (SVOCs), e.g., flame retardants and amine catalysts.
Sample preparation procedures were developed to test SPF samples in micro-scale chambers to accelerate testing. A holding time
study was then conducted with the micro chambers to estimate the maximum time after spraying that SPF samples can be stored in
sealed Mylar bags without significant loss of compounds of interest. Semi-volatile organic compounds such as methylenediphenyl
diisocyanate (MDI), selected amine catalysts and flame retardant were evaluated for potential losses in the conventional small-
scale and micro-scale test chambers due to potential wall effects. The conclusions from this research may be used as the basis to
develop several ASTM standards on Committee D22 on Air Quality through Subcommittee D22.05 on Indoor Air.
ACKNOWLEDGMENTS
The research was conducted by the Bayer MaterialScience LLC, Environmental Analytics laboratory, located in Pittsburgh, PA.
The project was done with the support of various groups and individuals, which are recognized below-
Environmental Analytics
Tom Frampton
Karen Mattson
Jason Miller
Luann Bidka-Rieck
John Sebroski
Carl Thompson
Machine Shop / Fabrication
Michael Bellaire
Spray Foam Applicator
William Pate
Technical Operations
Ronald Zibert
This work is protected by copyright. This paper and all data and information contained in it, are owned and protected by the ACC
through its Center for the Polyurethanes Industry. Users are granted a nonexclusive royalty-free license to reproduce and distribute
this paper, subject to the following limitations: (1) the work must be reproduced in its entirety, without alterations; and (2) copies
of the work may not be sold.
Copyright © 2012 Polyurethanes Technical Conference, American Chemistry Council.
2
Product Safety
Scott Ecoff
Brian Karlovich
Jim Chapman
Product Development
Jim Lambach
Vendor / Analytical Support
Paul Morris, Markes International
Caroline Widdowson, Markes International
Materials for Generic Formulations
Todd Wishneski, BASF
This work is protected by copyright. This paper and all data and information contained in it, are owned and protected by the ACC
through its Center for the Polyurethanes Industry. Users are granted a nonexclusive royalty-free license to reproduce and distribute
this paper, subject to the following limitations: (1) the work must be reproduced in its entirety, without alterations; and (2) copies
of the work may not be sold.
Copyright © 2012 Polyurethanes Technical Conference, American Chemistry Council.
3
TABLE OF CONTENTS
Abstract, Page 1
Acknowledgments, Pages 1-2
Introduction, Page 4
Apparatus and Instrumentation, Pages 4-5
Description of Generic Foam Formulations and Compounds of Interest, Pages 5-6
Evaluation of Thermal Desorption GC/MS for Measuring Potential SPF Emissions, Pages 7-18
Micro-Chamber Testing Parameters and Preparation, Pages 19-22
SPF Insulation Holding Time and Packaging Evaluation, Pages 23-38
Evaluation of Wall Effects of Semi-Volatile Compounds in Test Chambers, Pages 39-50
Summary of Recommendations for Future Work, Page 51
Referenced Documents, Page 52
This work is protected by copyright. This paper and all data and information contained in it, are owned and protected by the ACC
through its Center for the Polyurethanes Industry. Users are granted a nonexclusive royalty-free license to reproduce and distribute
this paper, subject to the following limitations: (1) the work must be reproduced in its entirety, without alterations; and (2) copies
of the work may not be sold.
Copyright © 2012 Polyurethanes Technical Conference, American Chemistry Council.
4
INTRODUCTION
This study was conducted under the direction of the CPI SPF Emissions Workgroup to support the development of
ASTM standard(s) at Subcommittee D22.05 on Indoor Air, Work Item WK30960. Specifically, the data will be used towards the
development of practices and procedures for measuring the potential air emissions of volatile organic compounds (VOCs)
including aldehydes and organic blowing agents, diisocyanates (usually methylene diphenyl diisocyanate or MDI), oligomeric
isocyanates, flame retardants and amine catalysts from spray polyurethane foam (SPF) insulation products. SPF insulation is
usually applied on-site within the building envelop by trained technicians using specialized equipment; therefore, there is a need to
establish allowable re-entry times for building occupants following SPF insulation applications. There is also a need to provide
assurance to consumers and building occupants regarding potential longer-term inhalation exposures to potential emissions.
Building products are routinely tested for their emissions of VOCs of concern. For insulation products such as batts and
loose-fill insulation, representative samples typically are collected from their manufacturing locations and are laboratory tested for
VOC emissions in small-scale environmental chambers at standardized indoor conditions following ASTM Guide D 5116. SPF
insulation products are different in that they are formed in place at the building site by chemical reaction rather than produced in a
factory setting. SPF insulation application procedures vary among products and the final products potentially are influenced by
spray equipment parameters as well as environmental factors at the time of application. These characteristics present special
challenges for the creation, collection, and testing of SPF insulation product samples.
A new analytical technique was evaluated and optimized to analyze potential SPF emissions using thermal desorption-gas
chromatography/mass spectrometry (TD-GC/MS). Procedures were developed for the creation, collection, and handling of test
samples representative of both closed-cell and open-cell SPF insulation products and for the preparation of test specimens for
environmental chamber testing. The holding time for SPF specimens was evaluated to determine if samples can be preserved and
stored in sealed air tight bags to allow time for shipment to the laboratory. SPF samples produced in this manner were tested for
their potential emissions using specialized micro-scale environmental test chambers to minimize potential wall effects of semi-
volatile organic compounds (amine catalysts, flame retardant, and MDI). The wall effects were then examined by fortifying the
chambers with the compounds of interest and measuring recovery in both micro-scale chambers and conventional small-scale test
chambers for comparison.
APPARATUS AND INSTRUMENTATION
Instrumentation
Markes International TD-100 Thermal Desorber connected to Agilent 7890A Gas Chromatrography (GC) and 5975C Inert XL
Mass Selective Detector (MSD)
Agilent 6890 GC and 5973N MSD
Agilent 1100 Series Liquid Chromatography (LC) / MSD and Diode Array Detector
Waters 2695 Alliance LC with Fluorescence Detector
Agilent 6890 GC with Nitrogen Phosphorus Detector (NPD)
Environmental Test Chambers
Markes International M-CTE250 Micro-Chamber/Thermal Extractor, 114-mL capacity
PTFE Lined, Acrylic, Small-Scale Chamber, 37.8-L capacity (approximate)
Stainless Steel Small-Scale Chamber (Grade 304), 37.8-L capacity (approximate)
Sampling Pumps and Flow Controllers
Markes International TC-20 Tube Conditioner
This work is protected by copyright. This paper and all data and information contained in it, are owned and protected by the ACC
through its Center for the Polyurethanes Industry. Users are granted a nonexclusive royalty-free license to reproduce and distribute
this paper, subject to the following limitations: (1) the work must be reproduced in its entirety, without alterations; and (2) copies
of the work may not be sold.
Copyright © 2012 Polyurethanes Technical Conference, American Chemistry Council.
5
Markes International Calibration Solution Loading Rig (CSLR™)
Supelco ATIS™ Adsorbent Tube Injector System
BIOS Defender 510 Volumetric Primary Flow Standard, Calibrator
SKC Universal Sampling Pump, Model 224-PCXR4
Sorbent Tubes and Media for Sample Collection
Markes International Thermal Desorption Tubes:
Stainless Steel, Tenax TA 35/60
Stainless Steel, 1cm Quartz Wool, Tenax TA 35/60, Carbopack X 40/60
SKC Xad-2 Sorbent Tubes, Cat. No. 226-30-06
SKC Treated (DNPH) Silica Gel, Cat. No. 226-119
13mm Glass-Fiber Filter with 1-(2-pyridyl)piperazine (PP) & diethyl phthalate in cassette housing
90mm Glass-Fiber Filter with 1-(2-pyridyl)piperazine (PP)
Spraying Equipment and Generic Samples
Graco H-XP2 with T2 2:1 Transfer Pumps
A-Side Open-Cell and Closed Cell Generic SPF- Elastospray 800A Iso. 54476251
B-Side Closed Cell Generic SPF- FE 1039624-1B Resin 10955583
B-Side Open-Cell Generic SPF- US B Resin Material 53852123, Lot 7224.563.1
Low Pressure 2 Component Kit SPF Formulation, Handi-Foam
Sample Collection Equipment
Clean cardboard sheets, double wall construction, cut into 30.5 x 30.5-cm pieces
Aluminum foil, heavy-gauge roll, approximately 0.024-mm thick
Electric knife to scarf and cut SPF samples
Circular foam coring tool- constructed of steel to cut SPF insulation samples to fit tightly into micro-scale chambers
Mylar bags with aluminum foil layer, light resistant, composite layer approximately 0.127-mm thick. The following sized bags
were used-
For closed-cell SPF and the kit formulation, a bag with a zipper seal with dimensions of approximately 46 x 71 cm
For open-cell SPF, a bag size of approximately 51 x 76 cm (zipper seal not available in this size of bag).
Packaging tape, clear, approximately 5-cm wide
This work is protected by copyright. This paper and all data and information contained in it, are owned and protected by the ACC
through its Center for the Polyurethanes Industry. Users are granted a nonexclusive royalty-free license to reproduce and distribute
this paper, subject to the following limitations: (1) the work must be reproduced in its entirety, without alterations; and (2) copies
of the work may not be sold.
Copyright © 2012 Polyurethanes Technical Conference, American Chemistry Council.
6
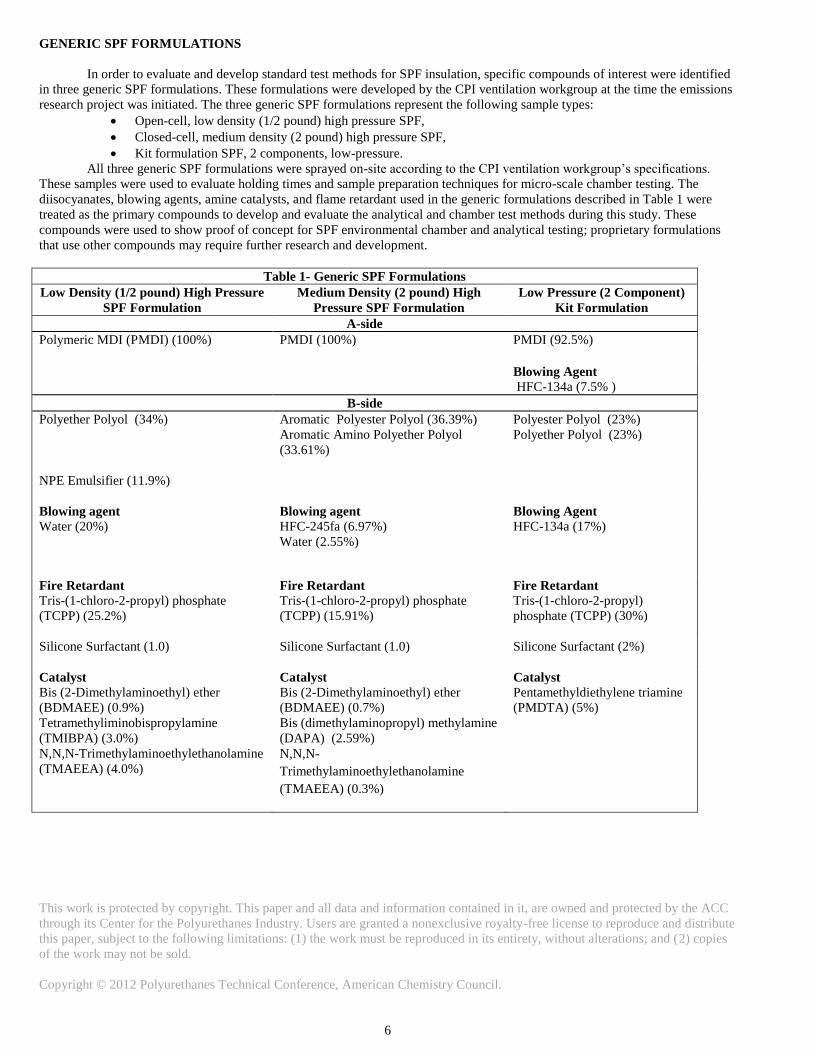
GENERIC SPF FORMULATIONS
In order to evaluate and develop standard test methods for SPF insulation, specific compounds of interest were identified
in three generic SPF formulations. These formulations were developed by the CPI ventilation workgroup at the time the emissions
research project was initiated. The three generic SPF formulations represent the following sample types:
Open-cell, low density (1/2 pound) high pressure SPF,
Closed-cell, medium density (2 pound) high pressure SPF,
Kit formulation SPF, 2 components, low-pressure.
All three generic SPF formulations were sprayed on-site according to the CPI ventilation workgroup’s specifications.
These samples were used to evaluate holding times and sample preparation techniques for micro-scale chamber testing. The
diisocyanates, blowing agents, amine catalysts, and flame retardant used in the generic formulations described in Table 1 were
treated as the primary compounds to develop and evaluate the analytical and chamber test methods during this study. These
compounds were used to show proof of concept for SPF environmental chamber and analytical testing; proprietary formulations
that use other compounds may require further research and development.
Table 1- Generic SPF Formulations
Low Density (1/2 pound) High Pressure
SPF Formulation
Medium Density (2 pound) High
Pressure SPF Formulation
Low Pressure (2 Component)
Kit Formulation
A-side
Polymeric MDI (PMDI) (100%) PMDI (100%) PMDI (92.5%)
Blowing Agent
HFC-134a (7.5% )
B-side
Polyether Polyol (34%) Aromatic Polyester Polyol (36.39%)
Aromatic Amino Polyether Polyol
(33.61%)
Polyester Polyol (23%)
Polyether Polyol (23%)
NPE Emulsifier (11.9%)
Blowing agent
Water (20%) Blowing agent
HFC-245fa (6.97%)
Water (2.55%)
Blowing Agent
HFC-134a (17%)
Fire Retardant
Tris-(1-chloro-2-propyl) phosphate
(TCPP) (25.2%)
Fire Retardant
Tris-(1-chloro-2-propyl) phosphate
(TCPP) (15.91%)
Fire Retardant
Tris-(1-chloro-2-propyl)
phosphate (TCPP) (30%)
Silicone Surfactant (1.0) Silicone Surfactant (1.0) Silicone Surfactant (2%)
Catalyst
Bis (2-Dimethylaminoethyl) ether
(BDMAEE) (0.9%)
Tetramethyliminobispropylamine
(TMIBPA) (3.0%)
N,N,N-Trimethylaminoethylethanolamine
(TMAEEA) (4.0%)
Catalyst
Bis (2-Dimethylaminoethyl) ether
(BDMAEE) (0.7%)
Bis (dimethylaminopropyl) methylamine
(DAPA) (2.59%)
N,N,N-
Trimethylaminoethylethanolamine
(TMAEEA) (0.3%)
Catalyst
Pentamethyldiethylene triamine
(PMDTA) (5%)
This work is protected by copyright. This paper and all data and information contained in it, are owned and protected by the ACC
through its Center for the Polyurethanes Industry. Users are granted a nonexclusive royalty-free license to reproduce and distribute
this paper, subject to the following limitations: (1) the work must be reproduced in its entirety, without alterations; and (2) copies
of the work may not be sold.
Copyright © 2012 Polyurethanes Technical Conference, American Chemistry Council.
7
EVALUATION OF THERMAL DESORPTION GC/MS FOR MEASURING POTENTIAL SPF EMISSIONS
Objective
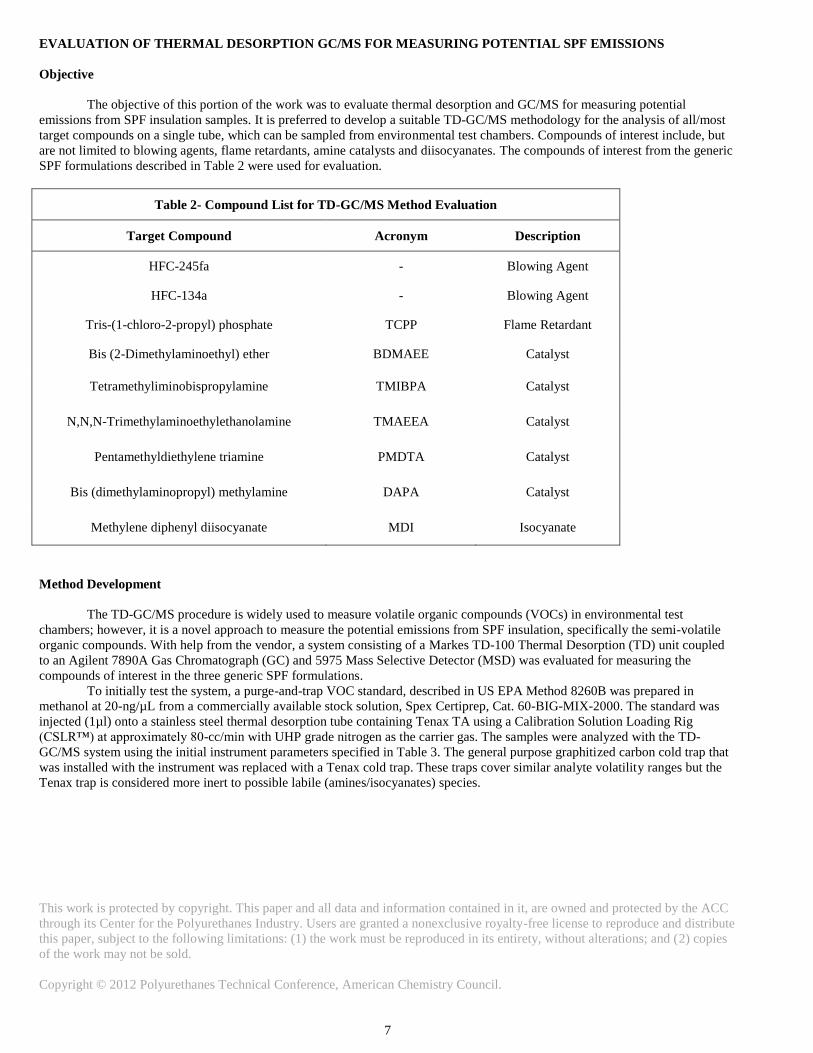
The objective of this portion of the work was to evaluate thermal desorption and GC/MS for measuring potential
emissions from SPF insulation samples. It is preferred to develop a suitable TD-GC/MS methodology for the analysis of all/most
target compounds on a single tube, which can be sampled from environmental test chambers. Compounds of interest include, but
are not limited to blowing agents, flame retardants, amine catalysts and diisocyanates. The compounds of interest from the generic
SPF formulations described in Table 2 were used for evaluation.
Table 2- Compound List for TD-GC/MS Method Evaluation
Target Compound Acronym Description
HFC-245fa - Blowing Agent
HFC-134a - Blowing Agent
Tris-(1-chloro-2-propyl) phosphate TCPP Flame Retardant
Bis (2-Dimethylaminoethyl) ether BDMAEE Catalyst
Tetramethyliminobispropylamine TMIBPA Catalyst
N,N,N-Trimethylaminoethylethanolamine TMAEEA Catalyst
Pentamethyldiethylene triamine PMDTA Catalyst
Bis (dimethylaminopropyl) methylamine DAPA Catalyst
Methylene diphenyl diisocyanate MDI Isocyanate
Method Development
The TD-GC/MS procedure is widely used to measure volatile organic compounds (VOCs) in environmental test
chambers; however, it is a novel approach to measure the potential emissions from SPF insulation, specifically the semi-volatile
organic compounds. With help from the vendor, a system consisting of a Markes TD-100 Thermal Desorption (TD) unit coupled
to an Agilent 7890A Gas Chromatograph (GC) and 5975 Mass Selective Detector (MSD) was evaluated for measuring the
compounds of interest in the three generic SPF formulations.
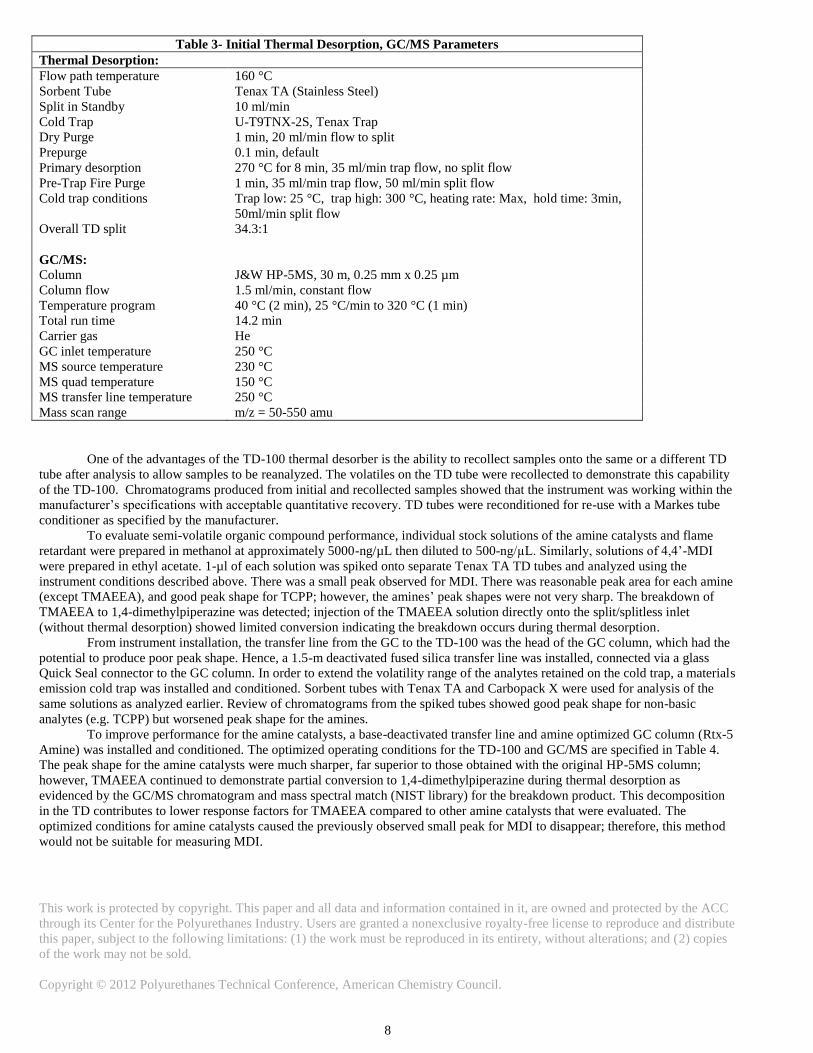
To initially test the system, a purge-and-trap VOC standard, described in US EPA Method 8260B was prepared in
methanol at 20-ng/µL from a commercially available stock solution, Spex Certiprep, Cat. 60-BIG-MIX-2000. The standard was
injected (1µl) onto a stainless steel thermal desorption tube containing Tenax TA using a Calibration Solution Loading Rig
(CSLR™) at approximately 80-cc/min with UHP grade nitrogen as the carrier gas. The samples were analyzed with the TD-
GC/MS system using the initial instrument parameters specified in Table 3. The general purpose graphitized carbon cold trap that
was installed with the instrument was replaced with a Tenax cold trap. These traps cover similar analyte volatility ranges but the
Tenax trap is considered more inert to possible labile (amines/isocyanates) species.
This work is protected by copyright. This paper and all data and information contained in it, are owned and protected by the ACC
through its Center for the Polyurethanes Industry. Users are granted a nonexclusive royalty-free license to reproduce and distribute
this paper, subject to the following limitations: (1) the work must be reproduced in its entirety, without alterations; and (2) copies
of the work may not be sold.
Copyright © 2012 Polyurethanes Technical Conference, American Chemistry Council.
8
Table 3- Initial Thermal Desorption, GC/MS Parameters
Thermal Desorption:
Flow path temperature 160 °C
Sorbent Tube Tenax TA (Stainless Steel)
Split in Standby 10 ml/min
Cold Trap U-T9TNX-2S, Tenax Trap
Dry Purge 1 min, 20 ml/min flow to split
Prepurge 0.1 min, default
Primary desorption 270 °C for 8 min, 35 ml/min trap flow, no split flow
Pre-Trap Fire Purge 1 min, 35 ml/min trap flow, 50 ml/min split flow
Cold trap conditions Trap low: 25 °C, trap high: 300 °C, heating rate: Max, hold time: 3min,
50ml/min split flow
Overall TD split 34.3:1
GC/MS:
Column J&W HP-5MS, 30 m, 0.25 mm x 0.25 µm
Column flow 1.5 ml/min, constant flow
Temperature program 40 °C (2 min), 25 °C/min to 320 °C (1 min)
Total run time 14.2 min
Carrier gas He
GC inlet temperature 250 °C
MS source temperature 230 °C
MS quad temperature 150 °C
MS transfer line temperature 250 °C
Mass scan range m/z = 50-550 amu
One of the advantages of the TD-100 thermal desorber is the ability to recollect samples onto the same or a different TD
tube after analysis to allow samples to be reanalyzed. The volatiles on the TD tube were recollected to demonstrate this capability
of the TD-100. Chromatograms produced from initial and recollected samples showed that the instrument was working within the
manufacturer’s specifications with acceptable quantitative recovery. TD tubes were reconditioned for re-use with a Markes tube
conditioner as specified by the manufacturer.
To evaluate semi-volatile organic compound performance, individual stock solutions of the amine catalysts and flame
retardant were prepared in methanol at approximately 5000-ng/µL then diluted to 500-ng/µL. Similarly, solutions of 4,4’-MDI
were prepared in ethyl acetate. 1-µl of each solution was spiked onto separate Tenax TA TD tubes and analyzed using the
instrument conditions described above. There was a small peak observed for MDI. There was reasonable peak area for each amine
(except TMAEEA), and good peak shape for TCPP; however, the amines’ peak shapes were not very sharp. The breakdown of
TMAEEA to 1,4-dimethylpiperazine was detected; injection of the TMAEEA solution directly onto the split/splitless inlet
(without thermal desorption) showed limited conversion indicating the breakdown occurs during thermal desorption.
From instrument installation, the transfer line from the GC to the TD-100 was the head of the GC column, which had the
potential to produce poor peak shape. Hence, a 1.5-m deactivated fused silica transfer line was installed, connected via a glass
Quick Seal connector to the GC column. In order to extend the volatility range of the analytes retained on the cold trap, a materials
emission cold trap was installed and conditioned. Sorbent tubes with Tenax TA and Carbopack X were used for analysis of the
same solutions as analyzed earlier. Review of chromatograms from the spiked tubes showed good peak shape for non-basic
analytes (e.g. TCPP) but worsened peak shape for the amines.
To improve performance for the amine catalysts, a base-deactivated transfer line and amine optimized GC column (Rtx-5
Amine) was installed and conditioned. The optimized operating conditions for the TD-100 and GC/MS are specified in Table 4.
The peak shape for the amine catalysts were much sharper, far superior to those obtained with the original HP-5MS column;
however, TMAEEA continued to demonstrate partial conversion to 1,4-dimethylpiperazine during thermal desorption as
evidenced by the GC/MS chromatogram and mass spectral match (NIST library) for the breakdown product. This decomposition
in the TD contributes to lower response factors for TMAEEA compared to other amine catalysts that were evaluated. The
optimized conditions for amine catalysts caused the previously observed small peak for MDI to disappear; therefore, this method
would not be suitable for measuring MDI.
This work is protected by copyright. This paper and all data and information contained in it, are owned and protected by the ACC
through its Center for the Polyurethanes Industry. Users are granted a nonexclusive royalty-free license to reproduce and distribute
this paper, subject to the following limitations: (1) the work must be reproduced in its entirety, without alterations; and (2) copies
of the work may not be sold.
Copyright © 2012 Polyurethanes Technical Conference, American Chemistry Council.
9
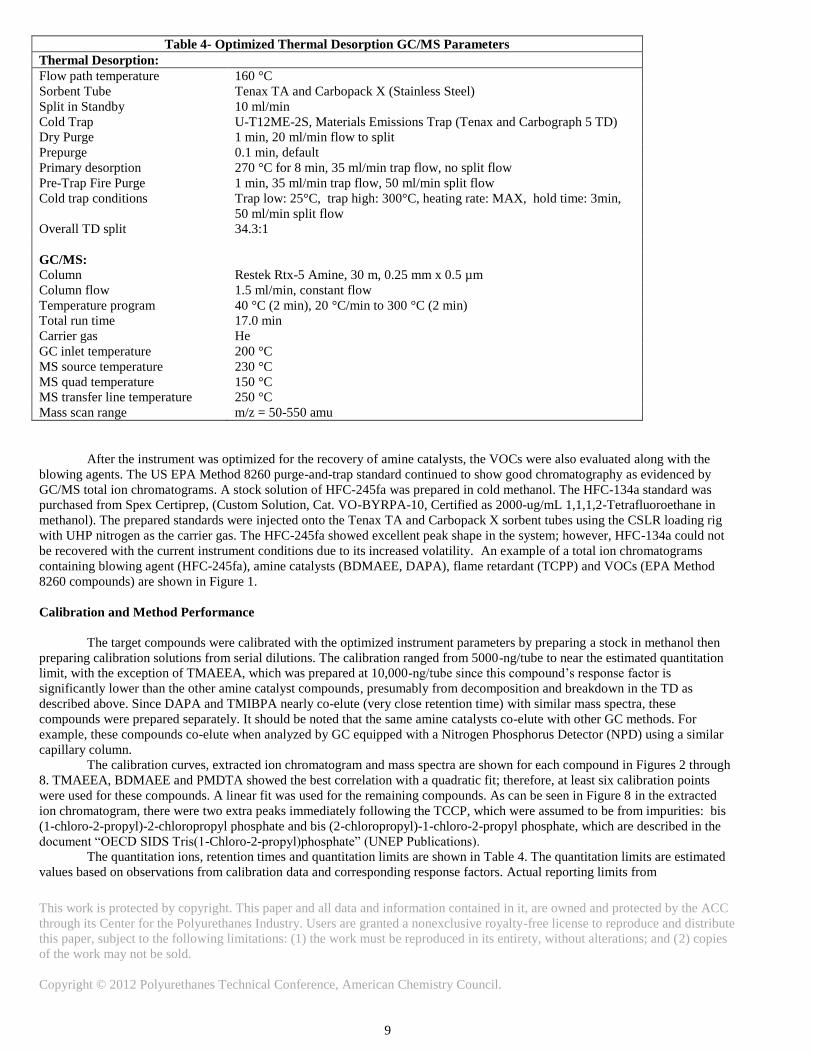
Table 4- Optimized Thermal Desorption GC/MS Parameters
Thermal Desorption:
Flow path temperature 160 °C
Sorbent Tube Tenax TA and Carbopack X (Stainless Steel)
Split in Standby 10 ml/min
Cold Trap U-T12ME-2S, Materials Emissions Trap (Tenax and Carbograph 5 TD)
Dry Purge 1 min, 20 ml/min flow to split
Prepurge 0.1 min, default
Primary desorption 270 °C for 8 min, 35 ml/min trap flow, no split flow
Pre-Trap Fire Purge 1 min, 35 ml/min trap flow, 50 ml/min split flow
Cold trap conditions Trap low: 25°C, trap high: 300°C, heating rate: MAX, hold time: 3min,
50 ml/min split flow
Overall TD split 34.3:1
GC/MS:
Column Restek Rtx-5 Amine, 30 m, 0.25 mm x 0.5 µm
Column flow 1.5 ml/min, constant flow
Temperature program 40 °C (2 min), 20 °C/min to 300 °C (2 min)
Total run time 17.0 min
Carrier gas He
GC inlet temperature 200 °C
MS source temperature 230 °C
MS quad temperature 150 °C
MS transfer line temperature 250 °C
Mass scan range m/z = 50-550 amu
After the instrument was optimized for the recovery of amine catalysts, the VOCs were also evaluated along with the
blowing agents. The US EPA Method 8260 purge-and-trap standard continued to show good chromatography as evidenced by
GC/MS total ion chromatograms. A stock solution of HFC-245fa was prepared in cold methanol. The HFC-134a standard was
purchased from Spex Certiprep, (Custom Solution, Cat. VO-BYRPA-10, Certified as 2000-ug/mL 1,1,1,2-Tetrafluoroethane in
methanol). The prepared standards were injected onto the Tenax TA and Carbopack X sorbent tubes using the CSLR loading rig
with UHP nitrogen as the carrier gas. The HFC-245fa showed excellent peak shape in the system; however, HFC-134a could not
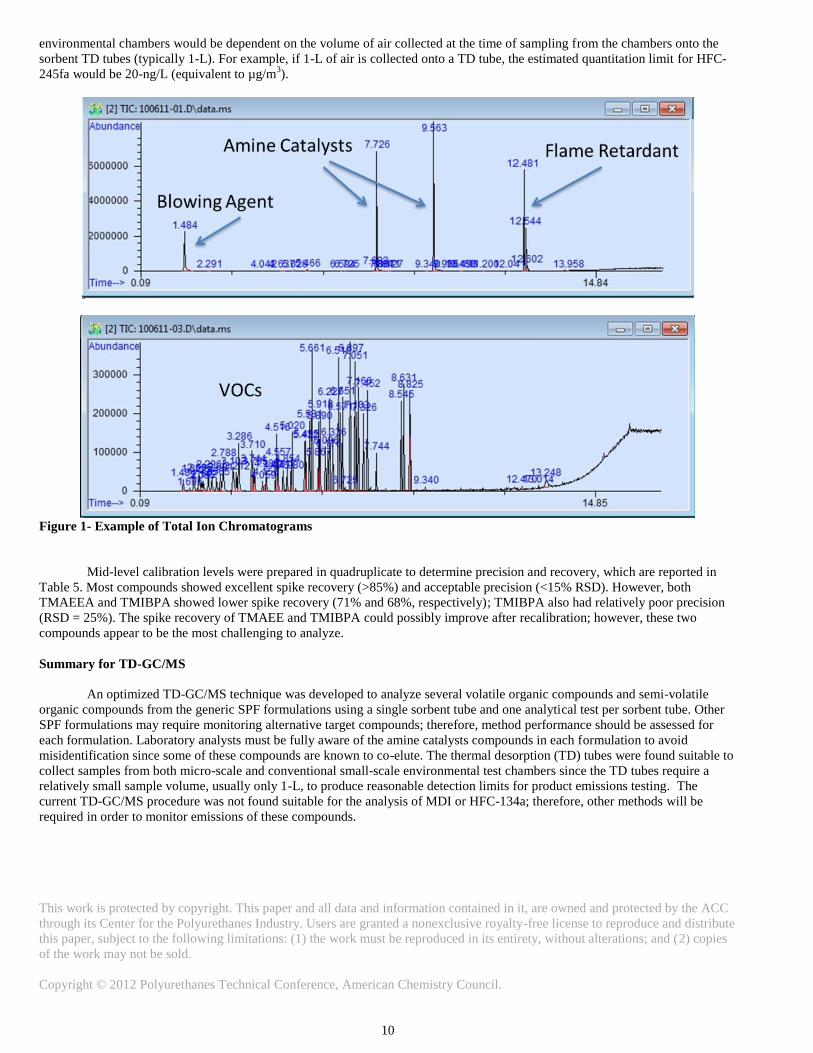
be recovered with the current instrument conditions due to its increased volatility. An example of a total ion chromatograms
containing blowing agent (HFC-245fa), amine catalysts (BDMAEE, DAPA), flame retardant (TCPP) and VOCs (EPA Method
8260 compounds) are shown in Figure 1.
Calibration and Method Performance
The target compounds were calibrated with the optimized instrument parameters by preparing a stock in methanol then
preparing calibration solutions from serial dilutions. The calibration ranged from 5000-ng/tube to near the estimated quantitation
limit, with the exception of TMAEEA, which was prepared at 10,000-ng/tube since this compound’s response factor is
significantly lower than the other amine catalyst compounds, presumably from decomposition and breakdown in the TD as
described above. Since DAPA and TMIBPA nearly co-elute (very close retention time) with similar mass spectra, these
compounds were prepared separately. It should be noted that the same amine catalysts co-elute with other GC methods. For
example, these compounds co-elute when analyzed by GC equipped with a Nitrogen Phosphorus Detector (NPD) using a similar
capillary column.
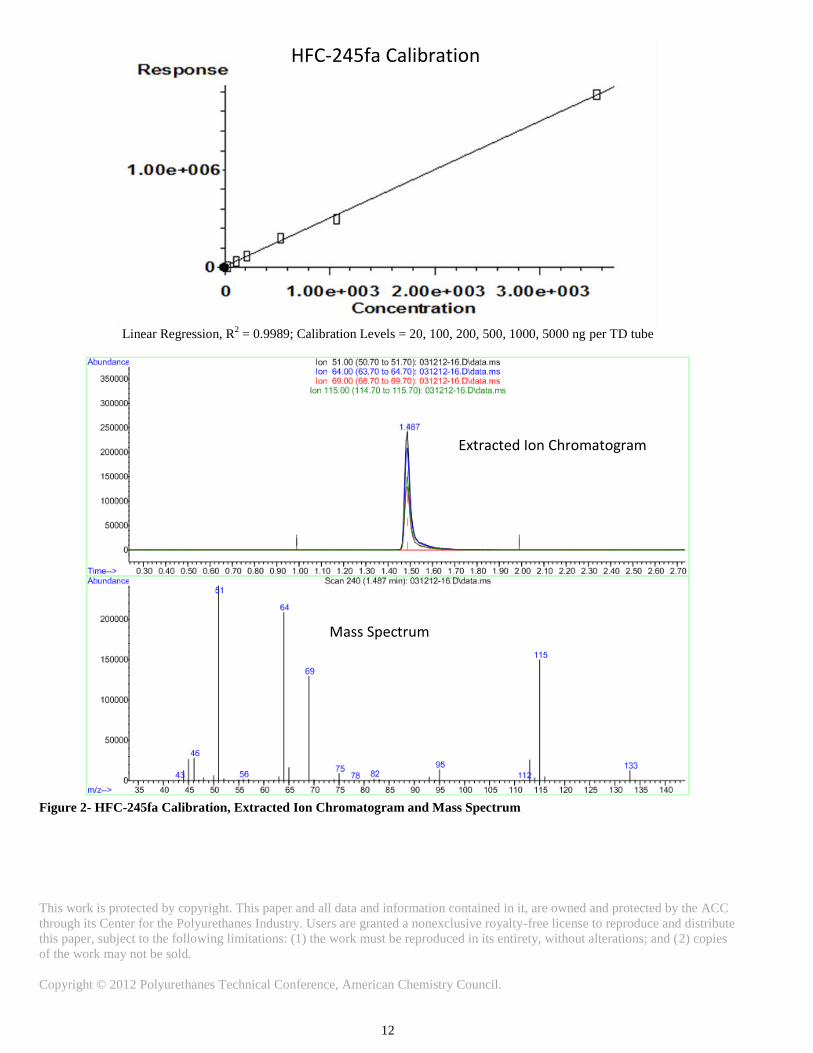
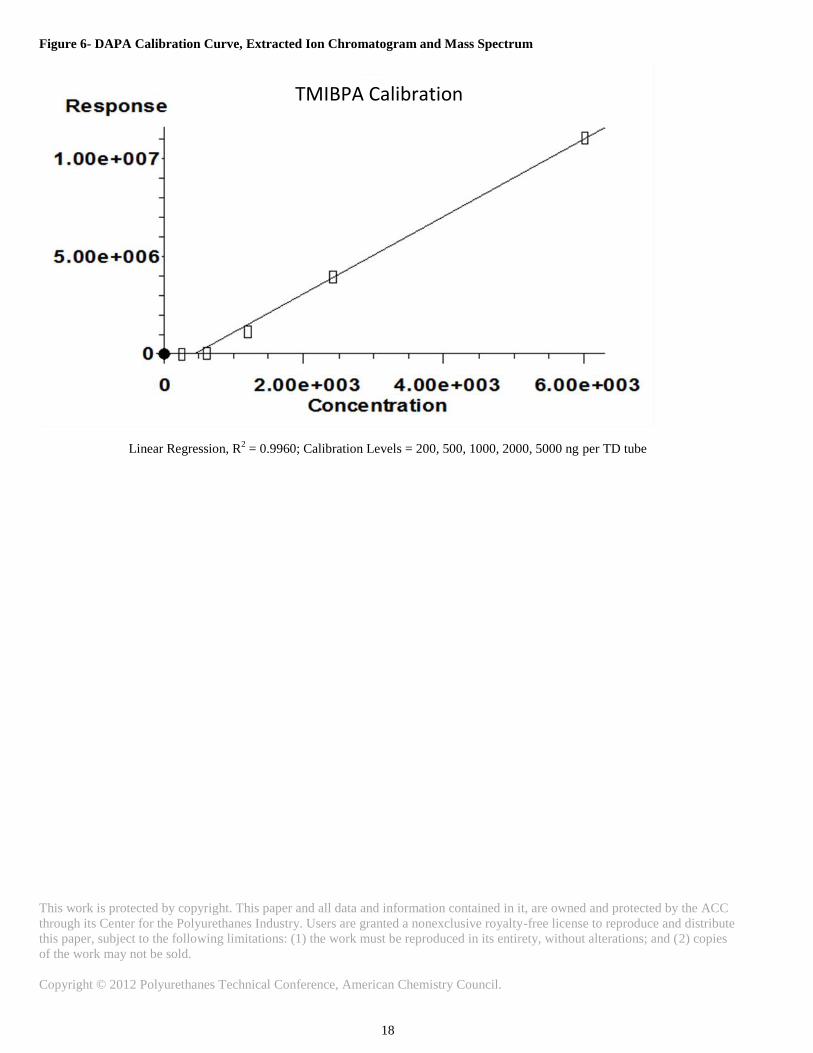
The calibration curves, extracted ion chromatogram and mass spectra are shown for each compound in Figures 2 through
8. TMAEEA, BDMAEE and PMDTA showed the best correlation with a quadratic fit; therefore, at least six calibration points
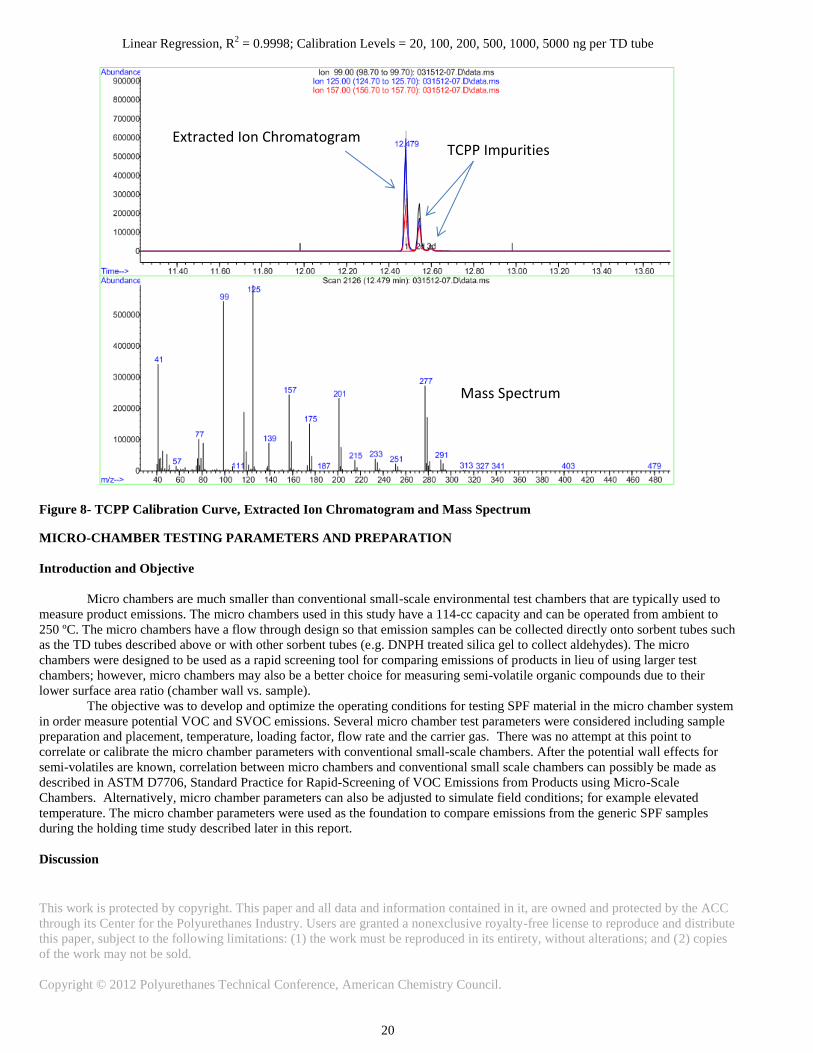
were used for these compounds. A linear fit was used for the remaining compounds. As can be seen in Figure 8 in the extracted
ion chromatogram, there were two extra peaks immediately following the TCCP, which were assumed to be from impurities: bis
(1-chloro-2-propyl)-2-chloropropyl phosphate and bis (2-chloropropyl)-1-chloro-2-propyl phosphate, which are described in the
document “OECD SIDS Tris(1-Chloro-2-propyl)phosphate” (UNEP Publications).
The quantitation ions, retention times and quantitation limits are shown in Table 4. The quantitation limits are estimated
values based on observations from calibration data and corresponding response factors. Actual reporting limits from
This work is protected by copyright. This paper and all data and information contained in it, are owned and protected by the ACC
through its Center for the Polyurethanes Industry. Users are granted a nonexclusive royalty-free license to reproduce and distribute
this paper, subject to the following limitations: (1) the work must be reproduced in its entirety, without alterations; and (2) copies
of the work may not be sold.
Copyright © 2012 Polyurethanes Technical Conference, American Chemistry Council.
10
environmental chambers would be dependent on the volume of air collected at the time of sampling from the chambers onto the
sorbent TD tubes (typically 1-L). For example, if 1-L of air is collected onto a TD tube, the estimated quantitation limit for HFC-
245fa would be 20-ng/L (equivalent to µg/m3).
Figure 1- Example of Total Ion Chromatograms
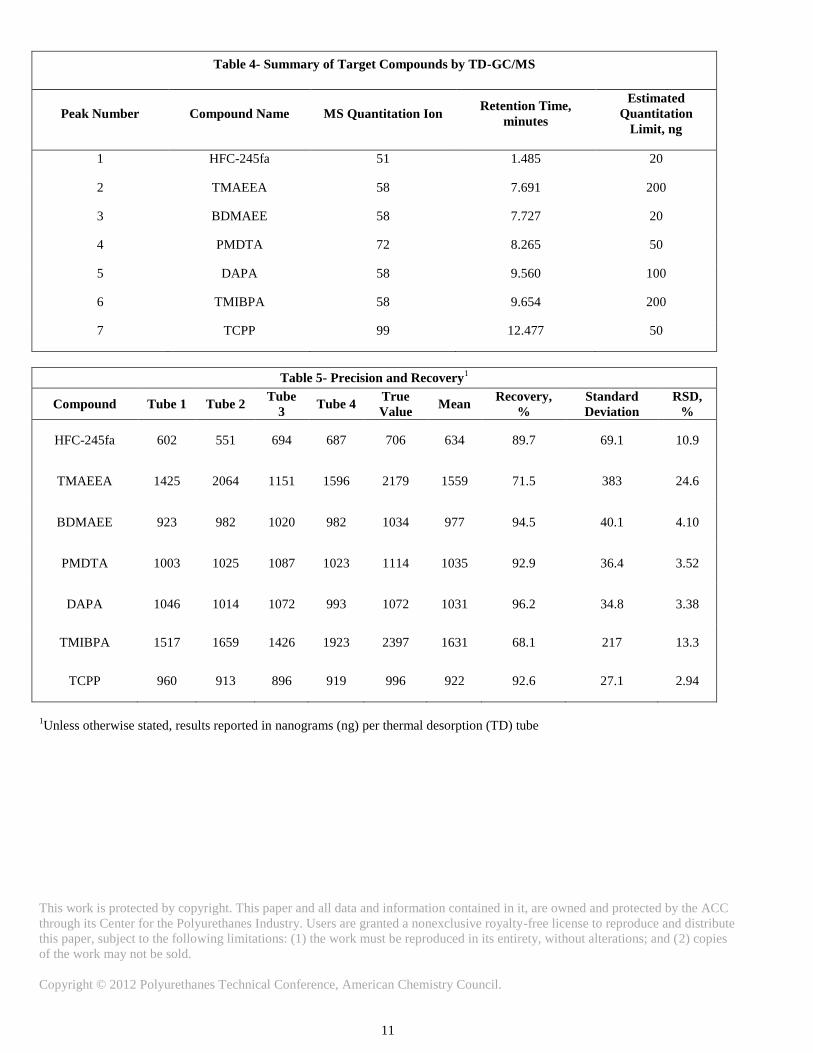
Mid-level calibration levels were prepared in quadruplicate to determine precision and recovery, which are reported in
Table 5. Most compounds showed excellent spike recovery (>85%) and acceptable precision (<15% RSD). However, both
TMAEEA and TMIBPA showed lower spike recovery (71% and 68%, respectively); TMIBPA also had relatively poor precision
(RSD = 25%). The spike recovery of TMAEE and TMIBPA could possibly improve after recalibration; however, these two
compounds appear to be the most challenging to analyze.
Summary for TD-GC/MS
An optimized TD-GC/MS technique was developed to analyze several volatile organic compounds and semi-volatile
organic compounds from the generic SPF formulations using a single sorbent tube and one analytical test per sorbent tube. Other
SPF formulations may require monitoring alternative target compounds; therefore, method performance should be assessed for
each formulation. Laboratory analysts must be fully aware of the amine catalysts compounds in each formulation to avoid
misidentification since some of these compounds are known to co-elute. The thermal desorption (TD) tubes were found suitable to
collect samples from both micro-scale and conventional small-scale environmental test chambers since the TD tubes require a
relatively small sample volume, usually only 1-L, to produce reasonable detection limits for product emissions testing. The
current TD-GC/MS procedure was not found suitable for the analysis of MDI or HFC-134a; therefore, other methods will be
required in order to monitor emissions of these compounds.
This work is protected by copyright. This paper and all data and information contained in it, are owned and protected by the ACC
through its Center for the Polyurethanes Industry. Users are granted a nonexclusive royalty-free license to reproduce and distribute
this paper, subject to the following limitations: (1) the work must be reproduced in its entirety, without alterations; and (2) copies
of the work may not be sold.
Copyright © 2012 Polyurethanes Technical Conference, American Chemistry Council.
11
Table 4- Summary of Target Compounds by TD-GC/MS
Peak Number Compound Name MS Quantitation Ion Retention Time,
minutes
Estimated
Quantitation
Limit, ng
1 HFC-245fa 51 1.485 20
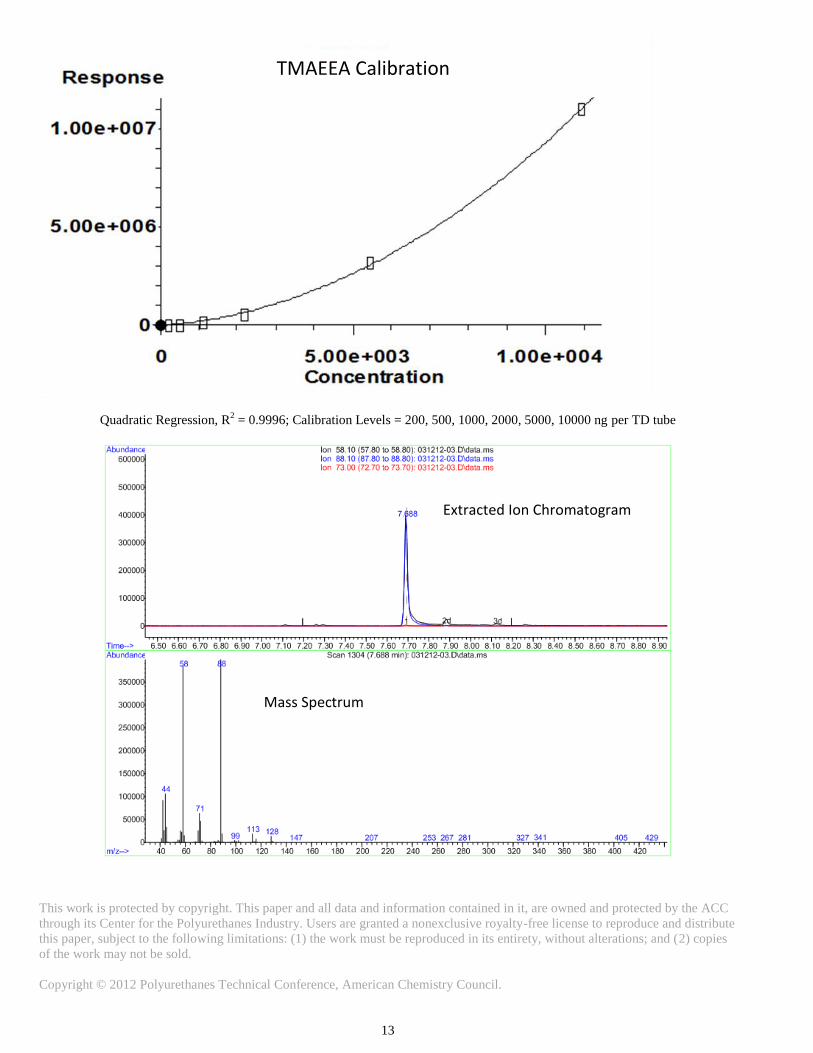
2 TMAEEA 58 7.691 200
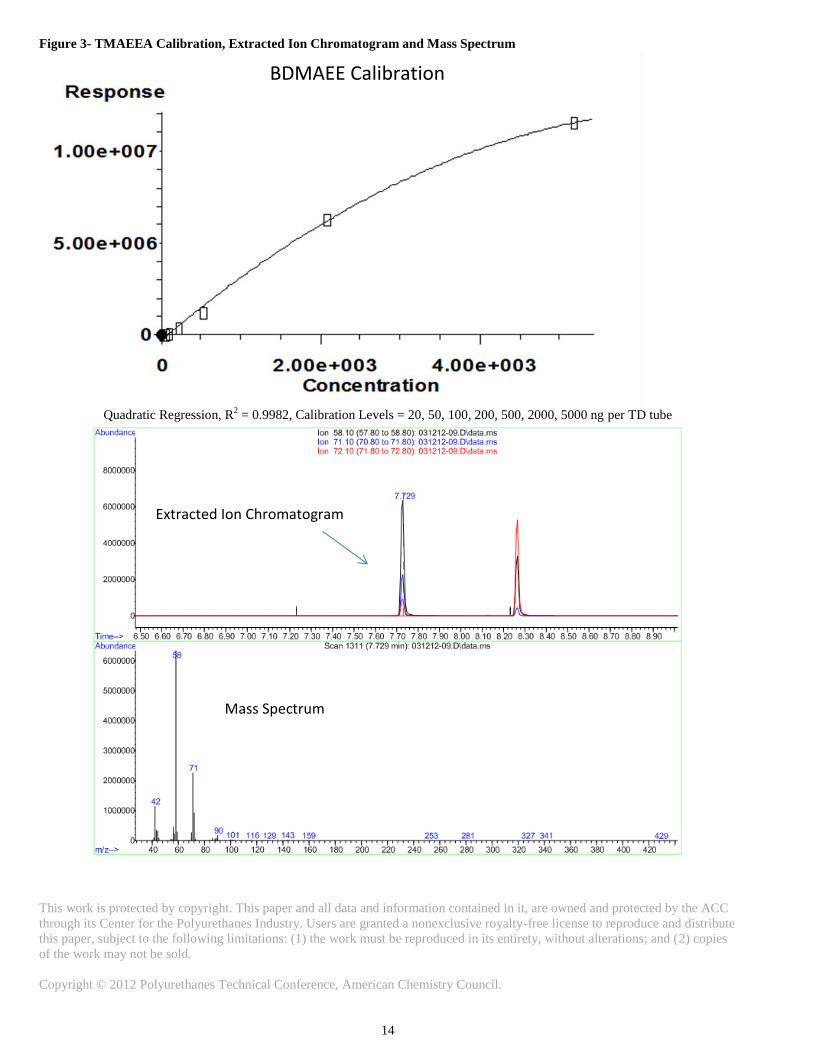
3 BDMAEE 58 7.727 20
4 PMDTA 72 8.265 50
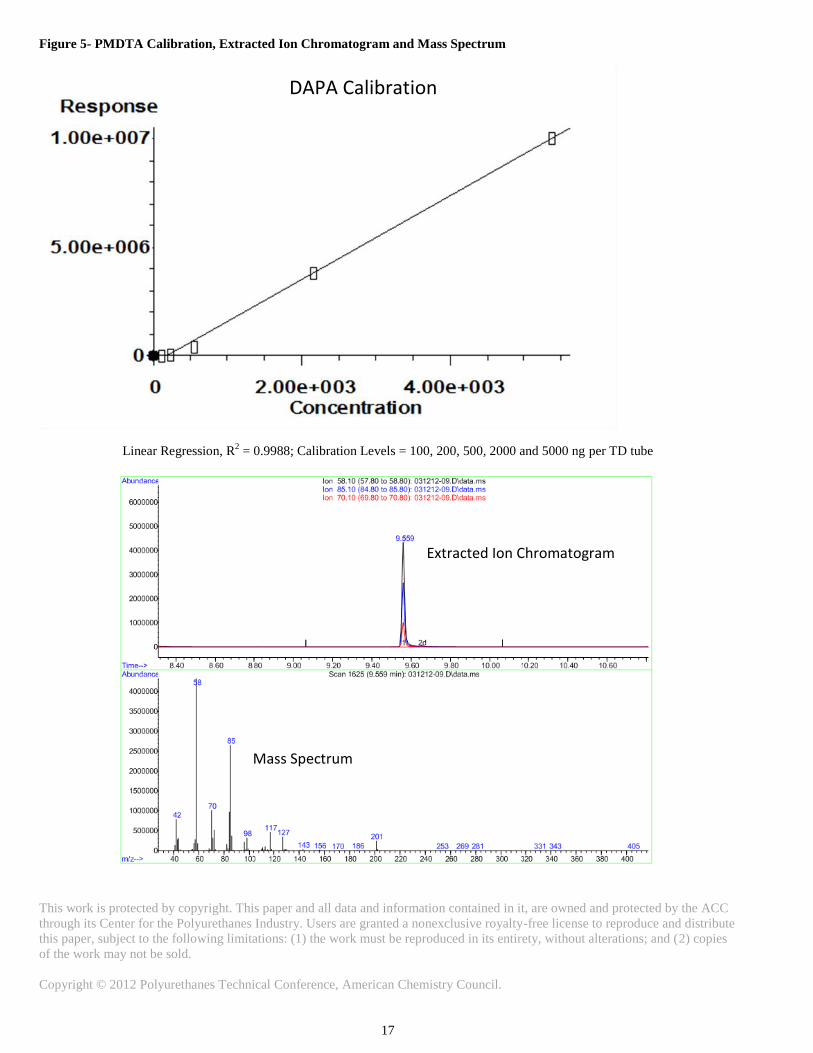
5 DAPA 58 9.560 100
6 TMIBPA 58 9.654 200
7 TCPP 99 12.477 50
Table 5- Precision and Recovery1
Compound Tube 1 Tube 2 Tube
3 Tube 4
True
Value Mean
Recovery,
%
Standard
Deviation
RSD,
%
HFC-245fa 602 551 694 687 706 634 89.7 69.1 10.9
TMAEEA 1425 2064 1151 1596 2179 1559 71.5 383 24.6
BDMAEE 923 982 1020 982 1034 977 94.5 40.1 4.10
PMDTA 1003 1025 1087 1023 1114 1035 92.9 36.4 3.52
DAPA 1046 1014 1072 993 1072 1031 96.2 34.8 3.38
TMIBPA 1517 1659 1426 1923 2397 1631 68.1 217 13.3
TCPP 960 913 896 919 996 922 92.6 27.1 2.94
1Unless otherwise stated, results reported in nanograms (ng) per thermal desorption (TD) tube
This work is protected by copyright. This paper and all data and information contained in it, are owned and protected by the ACC
through its Center for the Polyurethanes Industry. Users are granted a nonexclusive royalty-free license to reproduce and distribute
this paper, subject to the following limitations: (1) the work must be reproduced in its entirety, without alterations; and (2) copies
of the work may not be sold.
Copyright © 2012 Polyurethanes Technical Conference, American Chemistry Council.
12
Linear Regression, R
2 = 0.9989; Calibration Levels = 20, 100, 200, 500, 1000, 5000 ng per TD tube
Figure 2- HFC-245fa Calibration, Extracted Ion Chromatogram and Mass Spectrum
Extracted Ion Chromatogram
Mass Spectrum
HFC-245fa Calibration
This work is protected by copyright. This paper and all data and information contained in it, are owned and protected by the ACC
through its Center for the Polyurethanes Industry. Users are granted a nonexclusive royalty-free license to reproduce and distribute
this paper, subject to the following limitations: (1) the work must be reproduced in its entirety, without alterations; and (2) copies
of the work may not be sold.
Copyright © 2012 Polyurethanes Technical Conference, American Chemistry Council.
13
Quadratic Regression, R2 = 0.9996; Calibration Levels = 200, 500, 1000, 2000, 5000, 10000 ng per TD tube
Extracted Ion Chromatogram
Mass Spectrum
TMAEEA Calibration
This work is protected by copyright. This paper and all data and information contained in it, are owned and protected by the ACC
through its Center for the Polyurethanes Industry. Users are granted a nonexclusive royalty-free license to reproduce and distribute
this paper, subject to the following limitations: (1) the work must be reproduced in its entirety, without alterations; and (2) copies
of the work may not be sold.
Copyright © 2012 Polyurethanes Technical Conference, American Chemistry Council.
14
Figure 3- TMAEEA Calibration, Extracted Ion Chromatogram and Mass Spectrum
Quadratic Regression, R
2 = 0.9982, Calibration Levels = 20, 50, 100, 200, 500, 2000, 5000 ng per TD tube
Extracted Ion Chromatogram
Mass Spectrum
BDMAEE Calibration
This work is protected by copyright. This paper and all data and information contained in it, are owned and protected by the ACC
through its Center for the Polyurethanes Industry. Users are granted a nonexclusive royalty-free license to reproduce and distribute
this paper, subject to the following limitations: (1) the work must be reproduced in its entirety, without alterations; and (2) copies
of the work may not be sold.
Copyright © 2012 Polyurethanes Technical Conference, American Chemistry Council.
15
Figure 4- BDMAEE Calibration, Extracted Ion Chromatogram and Mass Spectrum

This work is protected by copyright. This paper and all data and information contained in it, are owned and protected by the ACC
through its Center for the Polyurethanes Industry. Users are granted a nonexclusive royalty-free license to reproduce and distribute
this paper, subject to the following limitations: (1) the work must be reproduced in its entirety, without alterations; and (2) copies
of the work may not be sold.
Copyright © 2012 Polyurethanes Technical Conference, American Chemistry Council.
16
Quadratic Regression, R2 = 0.9982, Calibration Levels = 50, 100, 200, 500, 2000, 5000 ng per TD tube
Extracted Ion Chromatogram
Mass Spectrum
PMDTA Calibration
This work is protected by copyright. This paper and all data and information contained in it, are owned and protected by the ACC
through its Center for the Polyurethanes Industry. Users are granted a nonexclusive royalty-free license to reproduce and distribute
this paper, subject to the following limitations: (1) the work must be reproduced in its entirety, without alterations; and (2) copies
of the work may not be sold.
Copyright © 2012 Polyurethanes Technical Conference, American Chemistry Council.
17
Figure 5- PMDTA Calibration, Extracted Ion Chromatogram and Mass Spectrum
Linear Regression, R2 = 0.9988; Calibration Levels = 100, 200, 500, 2000 and 5000 ng per TD tube
Extracted Ion Chromatogram
Mass Spectrum
DAPA Calibration
This work is protected by copyright. This paper and all data and information contained in it, are owned and protected by the ACC
through its Center for the Polyurethanes Industry. Users are granted a nonexclusive royalty-free license to reproduce and distribute
this paper, subject to the following limitations: (1) the work must be reproduced in its entirety, without alterations; and (2) copies
of the work may not be sold.
Copyright © 2012 Polyurethanes Technical Conference, American Chemistry Council.
18
Figure 6- DAPA Calibration Curve, Extracted Ion Chromatogram and Mass Spectrum
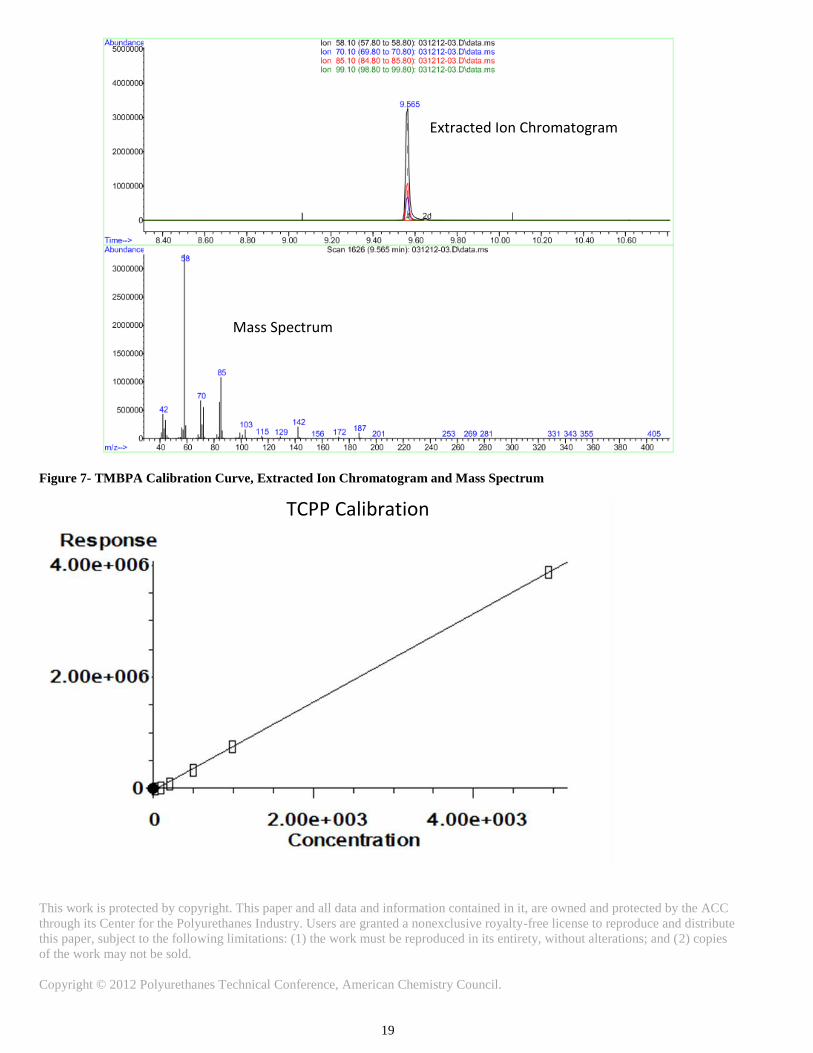
Linear Regression, R2 = 0.9960; Calibration Levels = 200, 500, 1000, 2000, 5000 ng per TD tube
TMIBPA Calibration
This work is protected by copyright. This paper and all data and information contained in it, are owned and protected by the ACC
through its Center for the Polyurethanes Industry. Users are granted a nonexclusive royalty-free license to reproduce and distribute
this paper, subject to the following limitations: (1) the work must be reproduced in its entirety, without alterations; and (2) copies
of the work may not be sold.
Copyright © 2012 Polyurethanes Technical Conference, American Chemistry Council.
19
Figure 7- TMBPA Calibration Curve, Extracted Ion Chromatogram and Mass Spectrum
Extracted Ion Chromatogram
Mass Spectrum
TCPP Calibration
This work is protected by copyright. This paper and all data and information contained in it, are owned and protected by the ACC
through its Center for the Polyurethanes Industry. Users are granted a nonexclusive royalty-free license to reproduce and distribute
this paper, subject to the following limitations: (1) the work must be reproduced in its entirety, without alterations; and (2) copies
of the work may not be sold.
Copyright © 2012 Polyurethanes Technical Conference, American Chemistry Council.
20
Linear Regression, R2 = 0.9998; Calibration Levels = 20, 100, 200, 500, 1000, 5000 ng per TD tube
Figure 8- TCPP Calibration Curve, Extracted Ion Chromatogram and Mass Spectrum
MICRO-CHAMBER TESTING PARAMETERS AND PREPARATION
Introduction and Objective
Micro chambers are much smaller than conventional small-scale environmental test chambers that are typically used to
measure product emissions. The micro chambers used in this study have a 114-cc capacity and can be operated from ambient to
250 ºC. The micro chambers have a flow through design so that emission samples can be collected directly onto sorbent tubes such
as the TD tubes described above or with other sorbent tubes (e.g. DNPH treated silica gel to collect aldehydes). The micro
chambers were designed to be used as a rapid screening tool for comparing emissions of products in lieu of using larger test
chambers; however, micro chambers may also be a better choice for measuring semi-volatile organic compounds due to their
lower surface area ratio (chamber wall vs. sample).
The objective was to develop and optimize the operating conditions for testing SPF material in the micro chamber system
in order measure potential VOC and SVOC emissions. Several micro chamber test parameters were considered including sample
preparation and placement, temperature, loading factor, flow rate and the carrier gas. There was no attempt at this point to
correlate or calibrate the micro chamber parameters with conventional small-scale chambers. After the potential wall effects for
semi-volatiles are known, correlation between micro chambers and conventional small scale chambers can possibly be made as
described in ASTM D7706, Standard Practice for Rapid-Screening of VOC Emissions from Products using Micro-Scale
Chambers. Alternatively, micro chamber parameters can also be adjusted to simulate field conditions; for example elevated
temperature. The micro chamber parameters were used as the foundation to compare emissions from the generic SPF samples
during the holding time study described later in this report.
Discussion
Extracted Ion Chromatogram
Mass Spectrum
TCPP Impurities
This work is protected by copyright. This paper and all data and information contained in it, are owned and protected by the ACC
through its Center for the Polyurethanes Industry. Users are granted a nonexclusive royalty-free license to reproduce and distribute
this paper, subject to the following limitations: (1) the work must be reproduced in its entirety, without alterations; and (2) copies
of the work may not be sold.
Copyright © 2012 Polyurethanes Technical Conference, American Chemistry Council.
21
Emphasis was placed on the sample placement in the micro chamber. SPF material tested with conventional small scale
chambers have been placed tightly into a rectangular metal box type holder with only one side of the SPF material exposed during
the chamber testing to simulate actual field conditions when sprayed into a wall cavity. Micro-scale sample holders were
considered, but any additional material placed in the chamber would likely contribute to potential wall effects for semi-volatile
compounds. In order to minimize wall effects and maximize the surface area of the sample compared to the chamber walls, the
sample was placed directly into the micro chamber using the chamber as the sample holder.
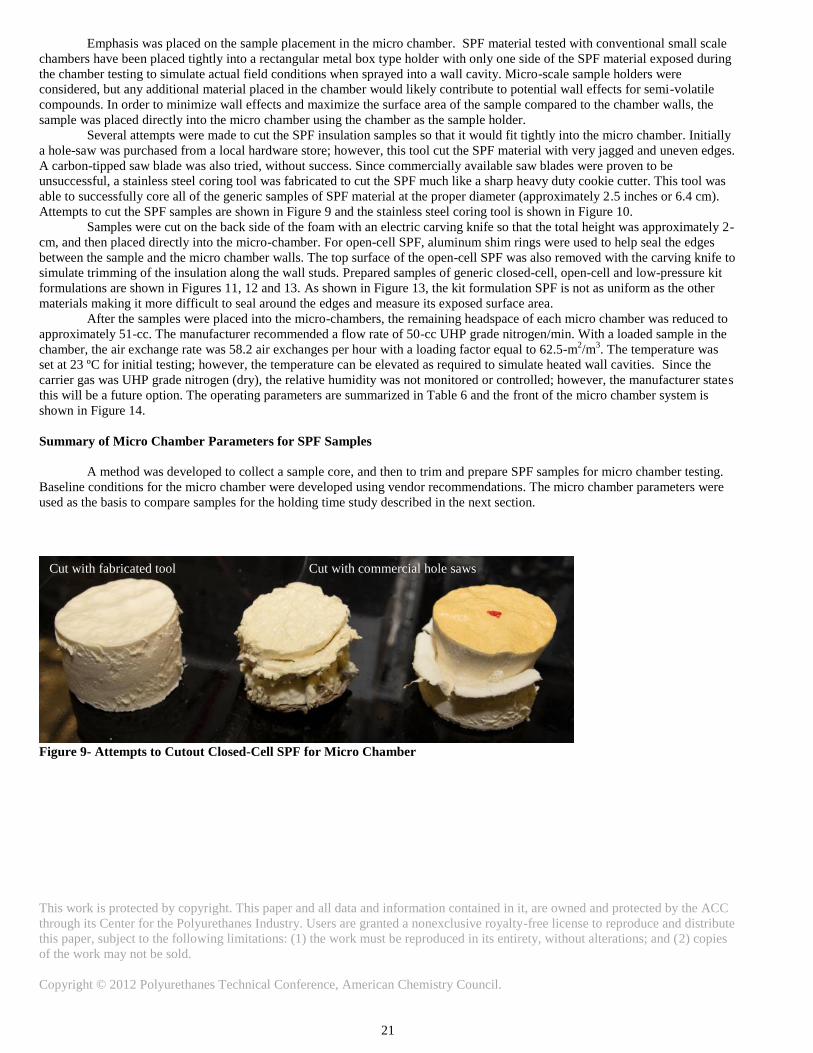
Several attempts were made to cut the SPF insulation samples so that it would fit tightly into the micro chamber. Initially
a hole-saw was purchased from a local hardware store; however, this tool cut the SPF material with very jagged and uneven edges.
A carbon-tipped saw blade was also tried, without success. Since commercially available saw blades were proven to be
unsuccessful, a stainless steel coring tool was fabricated to cut the SPF much like a sharp heavy duty cookie cutter. This tool was
able to successfully core all of the generic samples of SPF material at the proper diameter (approximately 2.5 inches or 6.4 cm).
Attempts to cut the SPF samples are shown in Figure 9 and the stainless steel coring tool is shown in Figure 10.
Samples were cut on the back side of the foam with an electric carving knife so that the total height was approximately 2-
cm, and then placed directly into the micro-chamber. For open-cell SPF, aluminum shim rings were used to help seal the edges
between the sample and the micro chamber walls. The top surface of the open-cell SPF was also removed with the carving knife to
simulate trimming of the insulation along the wall studs. Prepared samples of generic closed-cell, open-cell and low-pressure kit
formulations are shown in Figures 11, 12 and 13. As shown in Figure 13, the kit formulation SPF is not as uniform as the other
materials making it more difficult to seal around the edges and measure its exposed surface area.
After the samples were placed into the micro-chambers, the remaining headspace of each micro chamber was reduced to
approximately 51-cc. The manufacturer recommended a flow rate of 50-cc UHP grade nitrogen/min. With a loaded sample in the
chamber, the air exchange rate was 58.2 air exchanges per hour with a loading factor equal to 62.5-m2/m
3. The temperature was
set at 23 ºC for initial testing; however, the temperature can be elevated as required to simulate heated wall cavities. Since the
carrier gas was UHP grade nitrogen (dry), the relative humidity was not monitored or controlled; however, the manufacturer states
this will be a future option. The operating parameters are summarized in Table 6 and the front of the micro chamber system is
shown in Figure 14.
Summary of Micro Chamber Parameters for SPF Samples
A method was developed to collect a sample core, and then to trim and prepare SPF samples for micro chamber testing.
Baseline conditions for the micro chamber were developed using vendor recommendations. The micro chamber parameters were
used as the basis to compare samples for the holding time study described in the next section.
Figure 9- Attempts to Cutout Closed-Cell SPF for Micro Chamber
Cut with fabricated tool Cut with commercial hole saws
This work is protected by copyright. This paper and all data and information contained in it, are owned and protected by the ACC
through its Center for the Polyurethanes Industry. Users are granted a nonexclusive royalty-free license to reproduce and distribute
this paper, subject to the following limitations: (1) the work must be reproduced in its entirety, without alterations; and (2) copies
of the work may not be sold.
Copyright © 2012 Polyurethanes Technical Conference, American Chemistry Council.
22
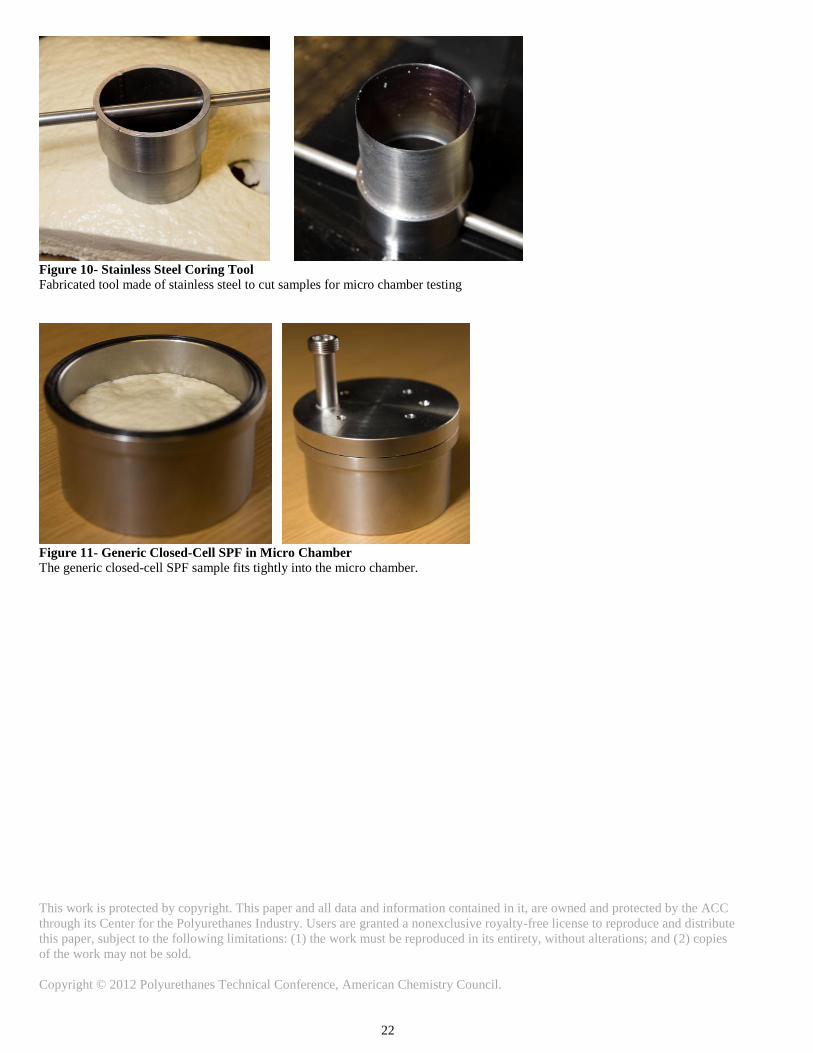
Figure 10- Stainless Steel Coring Tool
Fabricated tool made of stainless steel to cut samples for micro chamber testing
Figure 11- Generic Closed-Cell SPF in Micro Chamber
The generic closed-cell SPF sample fits tightly into the micro chamber.
This work is protected by copyright. This paper and all data and information contained in it, are owned and protected by the ACC
through its Center for the Polyurethanes Industry. Users are granted a nonexclusive royalty-free license to reproduce and distribute
this paper, subject to the following limitations: (1) the work must be reproduced in its entirety, without alterations; and (2) copies
of the work may not be sold.
Copyright © 2012 Polyurethanes Technical Conference, American Chemistry Council.
23
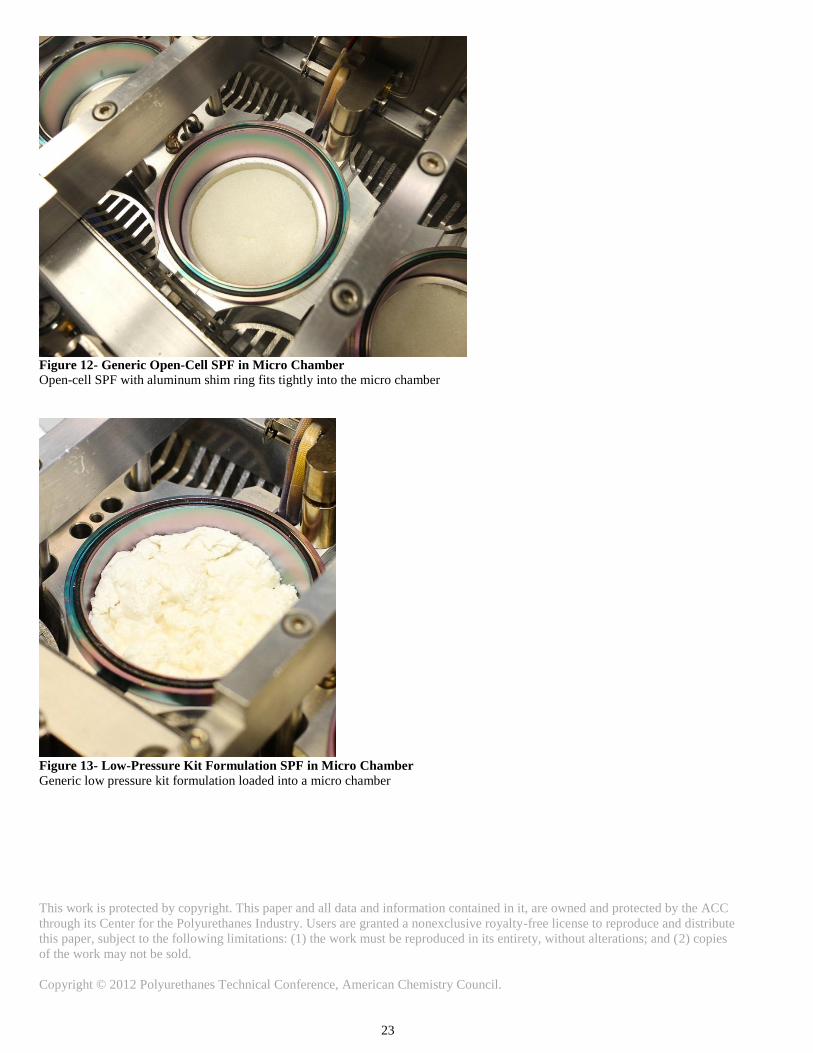
Figure 12- Generic Open-Cell SPF in Micro Chamber
Open-cell SPF with aluminum shim ring fits tightly into the micro chamber
Figure 13- Low-Pressure Kit Formulation SPF in Micro Chamber
Generic low pressure kit formulation loaded into a micro chamber

This work is protected by copyright. This paper and all data and information contained in it, are owned and protected by the ACC
through its Center for the Polyurethanes Industry. Users are granted a nonexclusive royalty-free license to reproduce and distribute
this paper, subject to the following limitations: (1) the work must be reproduced in its entirety, without alterations; and (2) copies
of the work may not be sold.
Copyright © 2012 Polyurethanes Technical Conference, American Chemistry Council.
24
Table 6- Micro Chamber Test Conditions for SPF Testing
Parameter Value
Sample Diameter, m 0.064
Volume, m3
5.15E-05
Air Change Rate, h-1
(N) 58.2
Loading, m2
/m3
(L) 62.5
Specific Air Flow Rate (N/L) 0.931
Initial Temperature 23 ºC
Figure 14- Micro-Chamber Flow / Temperature Control
This work is protected by copyright. This paper and all data and information contained in it, are owned and protected by the ACC
through its Center for the Polyurethanes Industry. Users are granted a nonexclusive royalty-free license to reproduce and distribute
this paper, subject to the following limitations: (1) the work must be reproduced in its entirety, without alterations; and (2) copies
of the work may not be sold.
Copyright © 2012 Polyurethanes Technical Conference, American Chemistry Council.
25
SPF SAMPLE HOLDING TIME AND PACKAGING EVALUATION
Objectives and Introduction
The purpose of this research was to determine an appropriate holding time for samples of SPF that are submitted for
emissions testing. In order to establish re-occupancy times for SPF products, an adequate holding time will be necessary to prepare
and ship samples to laboratories prior to analysis. The holding time(s) from this study may be incorporated into the ASTM
standard(s) currently under development. The generic formulations were each sprayed, collected and prepared five times to
evaluate the holding times using the micro chamber conditions described in the previous section.
The prepared SPF samples were stored in Mylar bags then placed into micro-chambers at the following times after
sample collection: ≤2 hours, 24 hours, 48 hours, 72 hours and 216 hours (9 days). Air samples were collected periodically for
volatile organic compounds (VOCs) and aldehydes using thermal desorption GC/MS and DNPH LC/MS techniques (similar to
ASTM D5197), respectively. MDI emissions were sampled using filter media with a derivative followed by LC analysis (Bayer
MaterialScience Method 1.7.7, which is based on OSHA Method 47).
The experiment was repeated using all three generic SPF sample types to evaluate the holding time. The generic closed-
cell SPF samples were analyzed in triplicate; the open-cell and kit formulation samples were tested in duplicate. The maximum
holding time was evaluated based on the point in time at which the loss of target compound emissions were not significantly
different from the emissions which were identified in the samples with the earliest holding time (≤2 hours).
Spraying and Packaging Closed-Cell SPF Samples
The closed-cell generic SPF formulation was sprayed in a controlled spray booth on five pieces of 12x12 inch double walled
cardboard sheets wrapped in clean aluminum foil as the substrate so that the foam thickness was in the range of 4 to 5-cm using 1
lift. Upon spraying the closed-cell SPF onto the substrate, the foil layer released from the cardboard, which caused a slight
mushroom shape to the samples. Therefore, the remaining formulations were sprayed directly to cardboard without the aluminum
foil. After spraying, the samples were allowed to cure in the spray booth for 1-hour at 23 ºC prior to placing the samples into
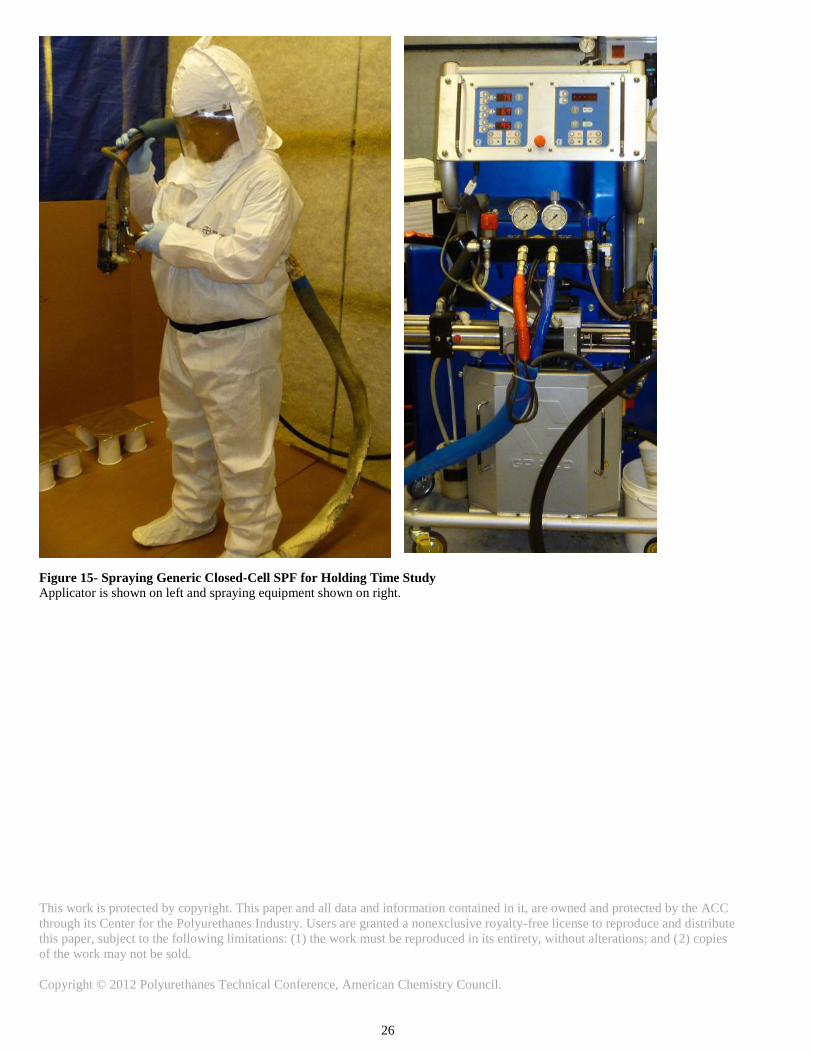
sealed Mylar bags. The spray applicator and equipment are shown in Figure 15. The sample substrate and closed-cell SPF samples
curing in the spray booth are shown in Figures 16 and 17, respectively.
After the SPF samples cured for 1 hour, the samples and substrate were individually placed into Mylar bags equipped with a
zipper seal. The air was manually forced out of each bag prior to closing the zipper seal. Each bag was sealed again by creating a
5-cm fold; the fold was repeated several times, and then packaging tape was applied. After the bag was sealed, the time was
recorded to begin the holding time for the closed-cell SPF samples. Since the laboratory is on the same campus as the spray booth,
shipping was not necessary; the Mylar bags containing the samples were transported to the laboratory within 30-minutes of sealing
the bags. The samples were stored in an office environment at room temperature (approximately 23 ºC) prior to analysis.
This work is protected by copyright. This paper and all data and information contained in it, are owned and protected by the ACC
through its Center for the Polyurethanes Industry. Users are granted a nonexclusive royalty-free license to reproduce and distribute
this paper, subject to the following limitations: (1) the work must be reproduced in its entirety, without alterations; and (2) copies
of the work may not be sold.
Copyright © 2012 Polyurethanes Technical Conference, American Chemistry Council.
26
Figure 15- Spraying Generic Closed-Cell SPF for Holding Time Study
Applicator is shown on left and spraying equipment shown on right.
This work is protected by copyright. This paper and all data and information contained in it, are owned and protected by the ACC
through its Center for the Polyurethanes Industry. Users are granted a nonexclusive royalty-free license to reproduce and distribute
this paper, subject to the following limitations: (1) the work must be reproduced in its entirety, without alterations; and (2) copies
of the work may not be sold.
Copyright © 2012 Polyurethanes Technical Conference, American Chemistry Council.
27
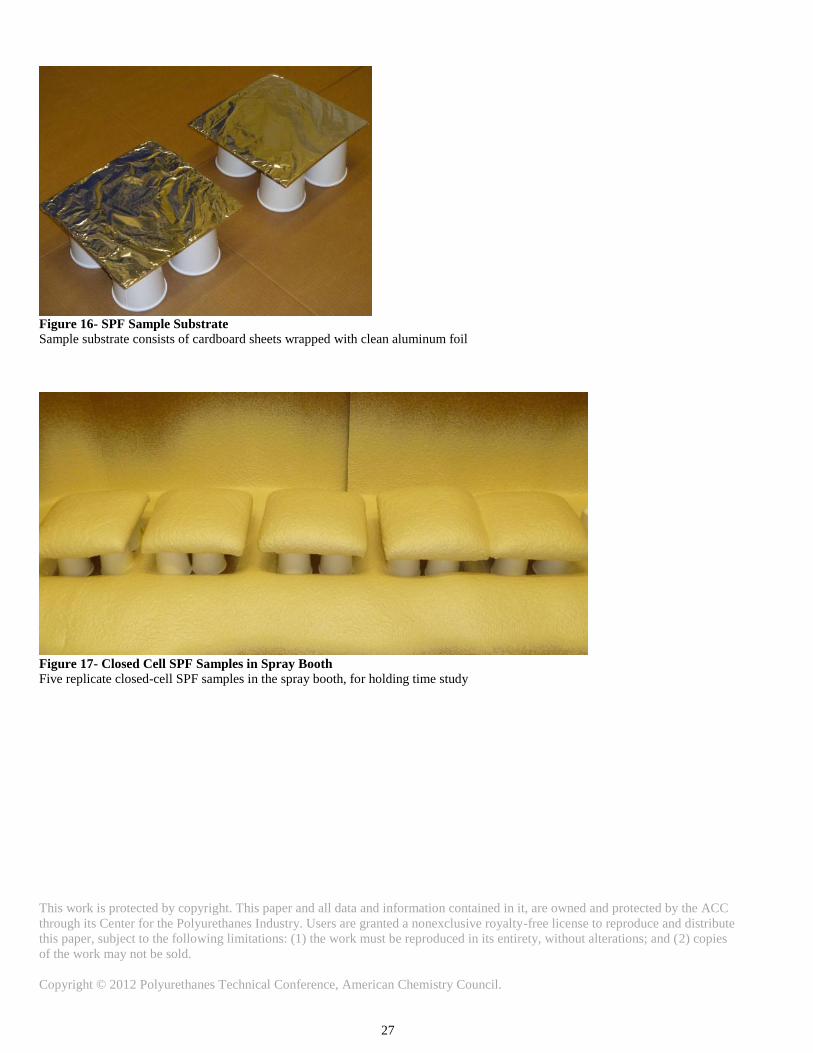
Figure 16- SPF Sample Substrate
Sample substrate consists of cardboard sheets wrapped with clean aluminum foil
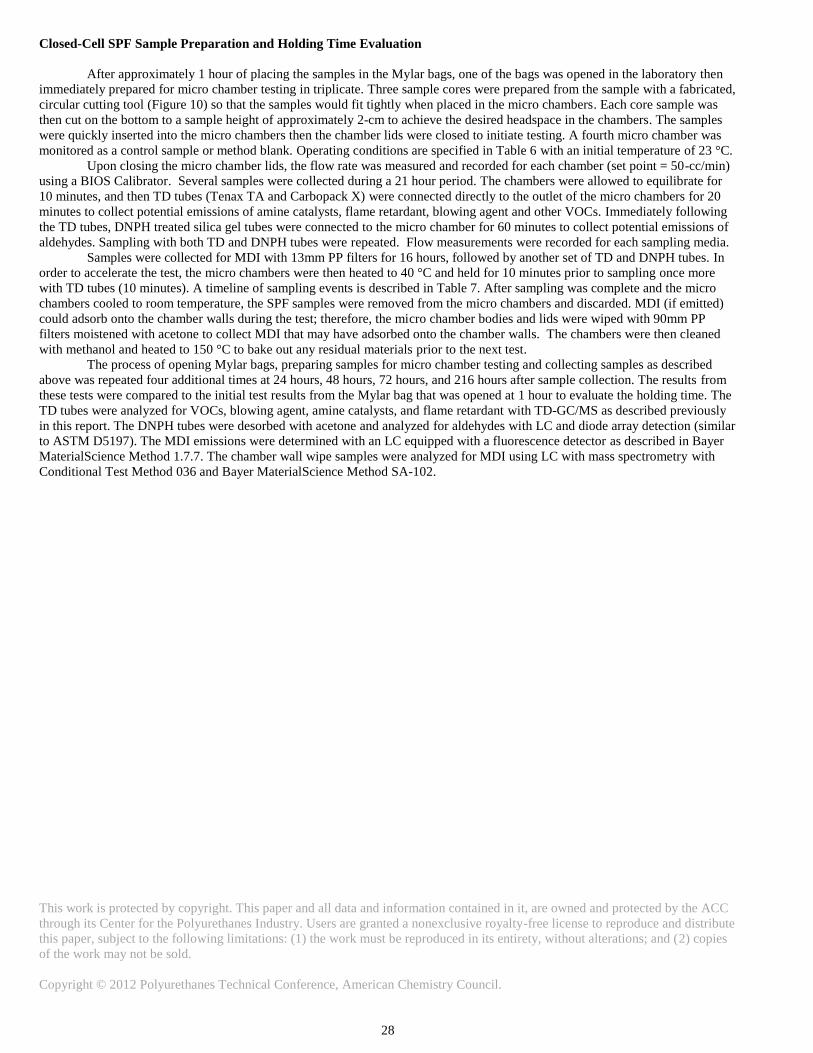
Figure 17- Closed Cell SPF Samples in Spray Booth
Five replicate closed-cell SPF samples in the spray booth, for holding time study
This work is protected by copyright. This paper and all data and information contained in it, are owned and protected by the ACC
through its Center for the Polyurethanes Industry. Users are granted a nonexclusive royalty-free license to reproduce and distribute
this paper, subject to the following limitations: (1) the work must be reproduced in its entirety, without alterations; and (2) copies
of the work may not be sold.
Copyright © 2012 Polyurethanes Technical Conference, American Chemistry Council.
28
Closed-Cell SPF Sample Preparation and Holding Time Evaluation
After approximately 1 hour of placing the samples in the Mylar bags, one of the bags was opened in the laboratory then
immediately prepared for micro chamber testing in triplicate. Three sample cores were prepared from the sample with a fabricated,
circular cutting tool (Figure 10) so that the samples would fit tightly when placed in the micro chambers. Each core sample was
then cut on the bottom to a sample height of approximately 2-cm to achieve the desired headspace in the chambers. The samples
were quickly inserted into the micro chambers then the chamber lids were closed to initiate testing. A fourth micro chamber was
monitored as a control sample or method blank. Operating conditions are specified in Table 6 with an initial temperature of 23 °C.
Upon closing the micro chamber lids, the flow rate was measured and recorded for each chamber (set point = 50-cc/min)
using a BIOS Calibrator. Several samples were collected during a 21 hour period. The chambers were allowed to equilibrate for
10 minutes, and then TD tubes (Tenax TA and Carbopack X) were connected directly to the outlet of the micro chambers for 20
minutes to collect potential emissions of amine catalysts, flame retardant, blowing agent and other VOCs. Immediately following
the TD tubes, DNPH treated silica gel tubes were connected to the micro chamber for 60 minutes to collect potential emissions of
aldehydes. Sampling with both TD and DNPH tubes were repeated. Flow measurements were recorded for each sampling media.
Samples were collected for MDI with 13mm PP filters for 16 hours, followed by another set of TD and DNPH tubes. In
order to accelerate the test, the micro chambers were then heated to 40 °C and held for 10 minutes prior to sampling once more
with TD tubes (10 minutes). A timeline of sampling events is described in Table 7. After sampling was complete and the micro
chambers cooled to room temperature, the SPF samples were removed from the micro chambers and discarded. MDI (if emitted)
could adsorb onto the chamber walls during the test; therefore, the micro chamber bodies and lids were wiped with 90mm PP
filters moistened with acetone to collect MDI that may have adsorbed onto the chamber walls. The chambers were then cleaned
with methanol and heated to 150 °C to bake out any residual materials prior to the next test.
The process of opening Mylar bags, preparing samples for micro chamber testing and collecting samples as described
above was repeated four additional times at 24 hours, 48 hours, 72 hours, and 216 hours after sample collection. The results from
these tests were compared to the initial test results from the Mylar bag that was opened at 1 hour to evaluate the holding time. The
TD tubes were analyzed for VOCs, blowing agent, amine catalysts, and flame retardant with TD-GC/MS as described previously
in this report. The DNPH tubes were desorbed with acetone and analyzed for aldehydes with LC and diode array detection (similar
to ASTM D5197). The MDI emissions were determined with an LC equipped with a fluorescence detector as described in Bayer
MaterialScience Method 1.7.7. The chamber wall wipe samples were analyzed for MDI using LC with mass spectrometry with
Conditional Test Method 036 and Bayer MaterialScience Method SA-102.
This work is protected by copyright. This paper and all data and information contained in it, are owned and protected by the ACC
through its Center for the Polyurethanes Industry. Users are granted a nonexclusive royalty-free license to reproduce and distribute
this paper, subject to the following limitations: (1) the work must be reproduced in its entirety, without alterations; and (2) copies
of the work may not be sold.
Copyright © 2012 Polyurethanes Technical Conference, American Chemistry Council.
29
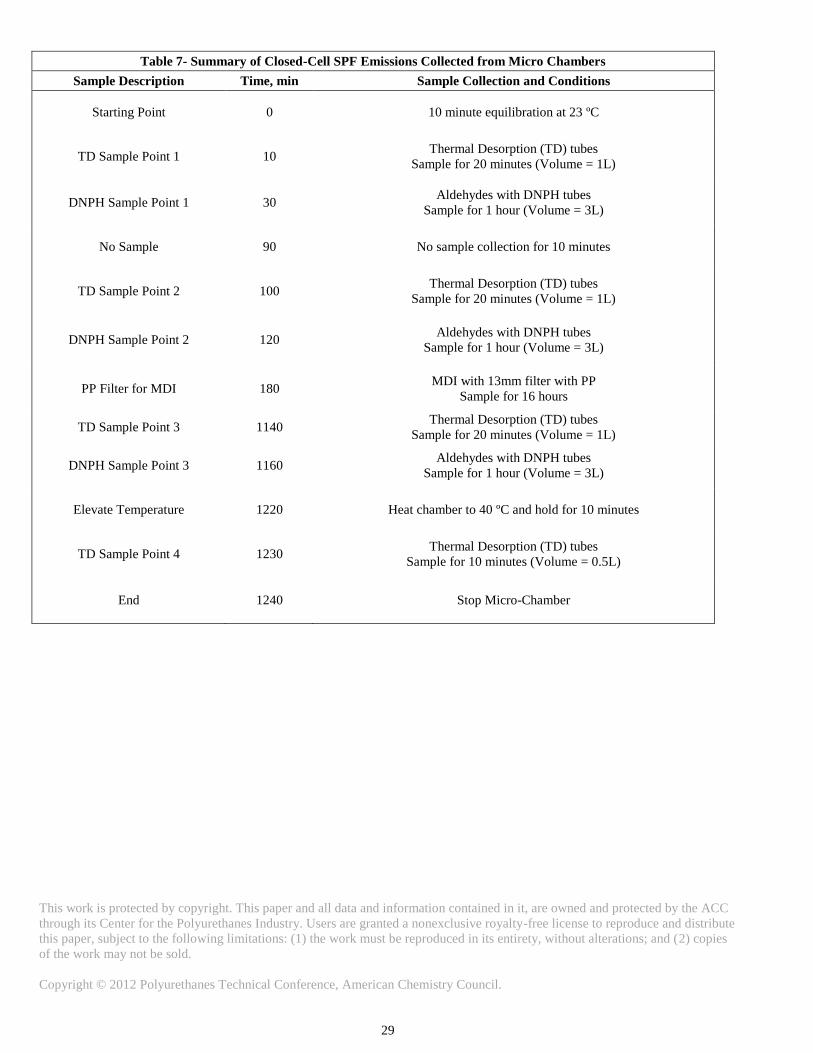
Table 7- Summary of Closed-Cell SPF Emissions Collected from Micro Chambers
Sample Description Time, min Sample Collection and Conditions
Starting Point 0 10 minute equilibration at 23 ºC
TD Sample Point 1 10 Thermal Desorption (TD) tubes
Sample for 20 minutes (Volume = 1L)
DNPH Sample Point 1 30 Aldehydes with DNPH tubes
Sample for 1 hour (Volume = 3L)
No Sample 90 No sample collection for 10 minutes
TD Sample Point 2 100 Thermal Desorption (TD) tubes
Sample for 20 minutes (Volume = 1L)
DNPH Sample Point 2 120 Aldehydes with DNPH tubes
Sample for 1 hour (Volume = 3L)
PP Filter for MDI 180 MDI with 13mm filter with PP
Sample for 16 hours
TD Sample Point 3 1140 Thermal Desorption (TD) tubes
Sample for 20 minutes (Volume = 1L)
DNPH Sample Point 3 1160 Aldehydes with DNPH tubes
Sample for 1 hour (Volume = 3L)
Elevate Temperature 1220 Heat chamber to 40 ºC and hold for 10 minutes
TD Sample Point 4 1230 Thermal Desorption (TD) tubes
Sample for 10 minutes (Volume = 0.5L)
End 1240 Stop Micro-Chamber
This work is protected by copyright. This paper and all data and information contained in it, are owned and protected by the ACC
through its Center for the Polyurethanes Industry. Users are granted a nonexclusive royalty-free license to reproduce and distribute
this paper, subject to the following limitations: (1) the work must be reproduced in its entirety, without alterations; and (2) copies
of the work may not be sold.
Copyright © 2012 Polyurethanes Technical Conference, American Chemistry Council.
30
Holding Time Results for Generic Closed-Cell SPF
The measured quantities of target compounds captured on the sampling media were converted to individual emission
factors as described in ASTM D5116 using the flows and chamber parameters described in Table 6. For replicate chamber tests, a
mean emission factor value and the relative standard deviation are reported to assess precision. For the purpose of determining
holding time, the first sample’s emission factors (Mylar bag opened at 1-hr) were compared against the later samples’ emission
factors to calculate percent change over the holding time. A negative change indicates that the emission factor decreased over
time, while a positive change indicates an increased emission factor over time. The holding time can be examined by determining
how long a sample can be stored in a Mylar bag before the emission factor significantly changes. There are no established criteria
for the maximum amount of change; however, less than 20 percent change was deemed acceptable for the purpose of this study.
There was no MDI detected in any of the test samples collected during the holding time study for the closed-cell SPF.
The calculated emission factors (EF) for the MDI isomers are as follows: both the 2,4’-MDI and 4,4’-MDI emission factors were
less than 0.002; the polymeric MDI emission factor was less than 0.060. Additionally, no MDI was observed on the chamber walls
during the holding time study for the generic closed-cell SPF. Based on these data, there were no apparent MDI emissions from
closed-cell SPF at the operating conditions of the micro chamber test. Because there were no emissions or change in emissions,
the holding time could not be determined based on MDI values.
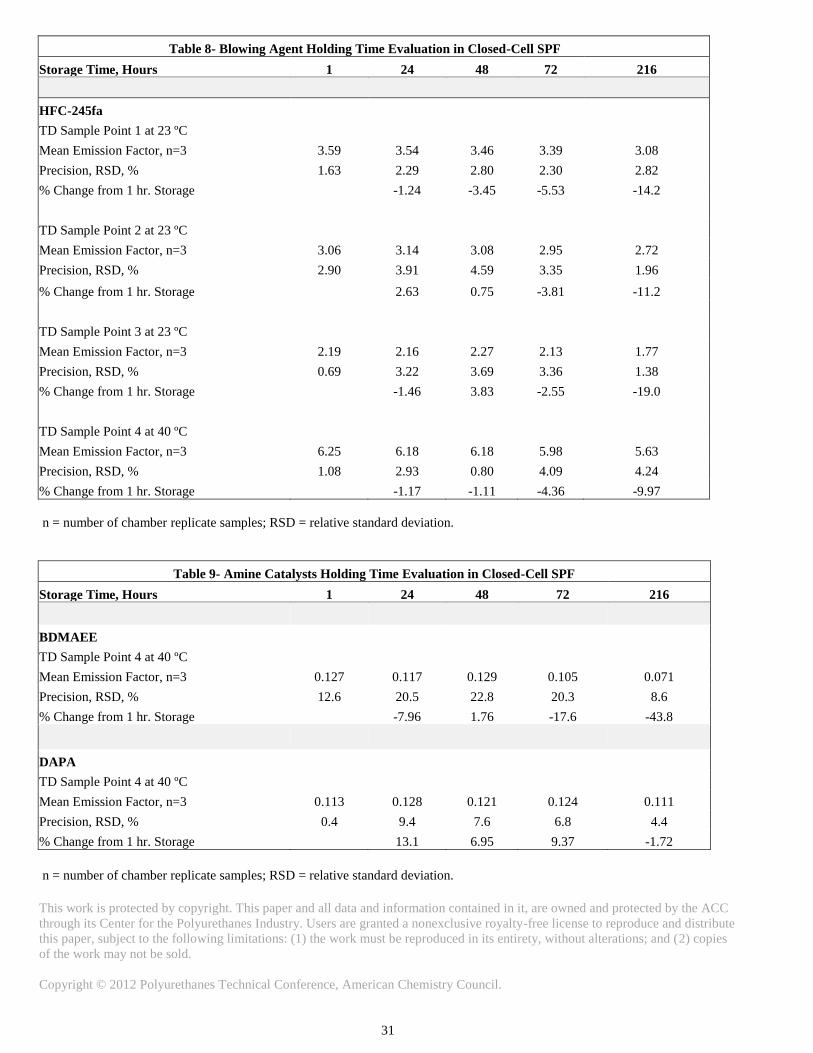
The emission factors for the blowing agent, HFC-245fa, used in the generic closed-cell SPF are shown in Table 8. The
emission factors for the equivalent sample collection time did not significantly change over the 216-hour holding time study.
Additionally, the emission factors all showed excellent precision (RSD values less than 5%). For example, the TD sample point 1
had initial emission factor of 3.59 and dropped to 3.08 after 216 hours storage, resulting in a -14% change. Similarly, TD time
point 2 had an initial emission factor 3.06, which dropped to 2.72 over 216 hour’s storage, resulting in a -11% change. Based on
the observed emission factors, samples can be stored for at least 216 hours when measuring HFC-245fa emissions. This compound
is a good indicator for monitoring VOCs during storage since HFC-245fa is the most volatile target compound detected with the
TD-GC/MS method.
Amine catalysts were not detected in any of the samples at 23 °C; however, BDMAEE and DAPA were detected after the
micro chambers were heated to 40 °C. The observed emission factors are shown in Table 9. There was a 44 % change in the
emission factor for BDMAEE at 216 hours storage time; however, the emission factor only dropped 18 % during 72 hours of
storage. The emission factors for DAPA did not significantly change over the entire 216 hour storage time. Based on these
observations, the closed-cell SPF can be stored up to 72 hours before the emission factor for BDMAEE significantly changes.
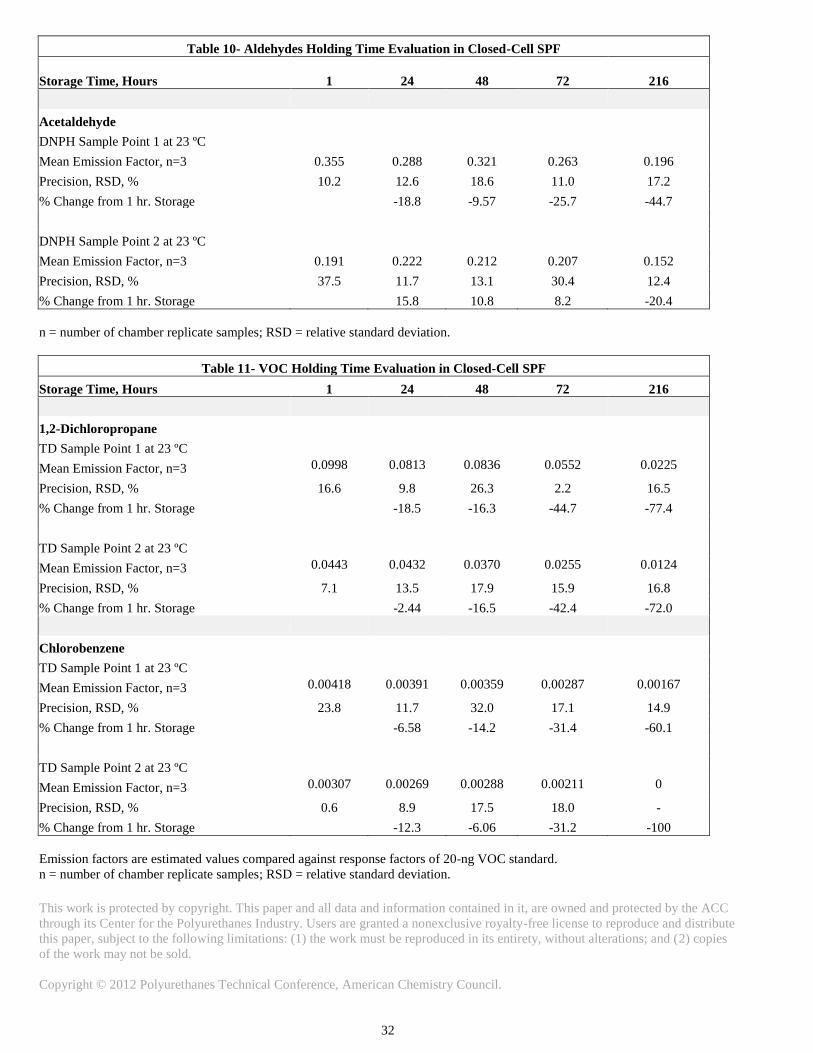
The only aldehyde compound that was detected at levels significantly greater than the method blank was acetaldehyde
during the first two DNPH sampling points. Based on these data, the emission factor change was -26 % after 72 hours storage;
while the sample stored for 48 hours only changed -10 %. Based on these data, the acetaldehyde emission factor appears to be
stable for at least 48 hours of storage. The acetaldehyde data are shown in Table 10.
Two other volatile organic compounds with much lower emission factors were also monitored to evaluate the effect of
their emissions with increased sample storage time. Since these compounds are not target compounds, they were identified with
the NIST Mass Spectral Library, and then compared against a single US EPA Method 8260 reference standard (20-ng each) to
estimate their emission factors. The compounds were identified as 1,2-dichloropropane and chlorobenzene, and their estimated
emission factors are shown in Table 11. Both compounds appeared to demonstrate that the closed-cell SPF sample can be stored
for up to 48 hours in Mylar bags before the emission factors significantly change.
This work is protected by copyright. This paper and all data and information contained in it, are owned and protected by the ACC
through its Center for the Polyurethanes Industry. Users are granted a nonexclusive royalty-free license to reproduce and distribute
this paper, subject to the following limitations: (1) the work must be reproduced in its entirety, without alterations; and (2) copies
of the work may not be sold.
Copyright © 2012 Polyurethanes Technical Conference, American Chemistry Council.
31
Table 8- Blowing Agent Holding Time Evaluation in Closed-Cell SPF
Storage Time, Hours 1 24 48 72 216
HFC-245fa
TD Sample Point 1 at 23 ºC
Mean Emission Factor, n=3 3.59 3.54 3.46 3.39 3.08
Precision, RSD, % 1.63 2.29 2.80 2.30 2.82
% Change from 1 hr. Storage
-1.24 -3.45 -5.53 -14.2
TD Sample Point 2 at 23 ºC
Mean Emission Factor, n=3 3.06 3.14 3.08 2.95 2.72
Precision, RSD, % 2.90 3.91 4.59 3.35 1.96
% Change from 1 hr. Storage
2.63 0.75 -3.81 -11.2
TD Sample Point 3 at 23 ºC
Mean Emission Factor, n=3 2.19 2.16 2.27 2.13 1.77
Precision, RSD, % 0.69 3.22 3.69 3.36 1.38
% Change from 1 hr. Storage
-1.46 3.83 -2.55 -19.0
TD Sample Point 4 at 40 ºC
Mean Emission Factor, n=3 6.25 6.18 6.18 5.98 5.63
Precision, RSD, % 1.08 2.93 0.80 4.09 4.24
% Change from 1 hr. Storage
-1.17 -1.11 -4.36 -9.97
n = number of chamber replicate samples; RSD = relative standard deviation.
Table 9- Amine Catalysts Holding Time Evaluation in Closed-Cell SPF
Storage Time, Hours 1 24 48 72 216
BDMAEE TD Sample Point 4 at 40 ºC
Mean Emission Factor, n=3 0.127 0.117 0.129 0.105 0.071
Precision, RSD, % 12.6 20.5 22.8 20.3 8.6
% Change from 1 hr. Storage
-7.96 1.76 -17.6 -43.8
DAPA TD Sample Point 4 at 40 ºC
Mean Emission Factor, n=3 0.113 0.128 0.121 0.124 0.111
Precision, RSD, % 0.4 9.4 7.6 6.8 4.4
% Change from 1 hr. Storage
13.1 6.95 9.37 -1.72
n = number of chamber replicate samples; RSD = relative standard deviation.
This work is protected by copyright. This paper and all data and information contained in it, are owned and protected by the ACC
through its Center for the Polyurethanes Industry. Users are granted a nonexclusive royalty-free license to reproduce and distribute
this paper, subject to the following limitations: (1) the work must be reproduced in its entirety, without alterations; and (2) copies
of the work may not be sold.
Copyright © 2012 Polyurethanes Technical Conference, American Chemistry Council.
32
Table 10- Aldehydes Holding Time Evaluation in Closed-Cell SPF
Storage Time, Hours 1 24 48 72 216
Acetaldehyde
DNPH Sample Point 1 at 23 ºC
Mean Emission Factor, n=3 0.355 0.288 0.321 0.263 0.196
Precision, RSD, % 10.2 12.6 18.6 11.0 17.2
% Change from 1 hr. Storage
-18.8 -9.57 -25.7 -44.7
DNPH Sample Point 2 at 23 ºC
Mean Emission Factor, n=3 0.191 0.222 0.212 0.207 0.152
Precision, RSD, % 37.5 11.7 13.1 30.4 12.4
% Change from 1 hr. Storage
15.8 10.8 8.2 -20.4
n = number of chamber replicate samples; RSD = relative standard deviation.
Table 11- VOC Holding Time Evaluation in Closed-Cell SPF
Storage Time, Hours 1 24 48 72 216
1,2-Dichloropropane
TD Sample Point 1 at 23 ºC
Mean Emission Factor, n=3 0.0998 0.0813 0.0836 0.0552 0.0225
Precision, RSD, % 16.6 9.8 26.3 2.2 16.5
% Change from 1 hr. Storage
-18.5 -16.3 -44.7 -77.4
TD Sample Point 2 at 23 ºC
Mean Emission Factor, n=3 0.0443 0.0432 0.0370 0.0255 0.0124
Precision, RSD, % 7.1 13.5 17.9 15.9 16.8
% Change from 1 hr. Storage
-2.44 -16.5 -42.4 -72.0
Chlorobenzene
TD Sample Point 1 at 23 ºC
Mean Emission Factor, n=3 0.00418 0.00391 0.00359 0.00287 0.00167
Precision, RSD, % 23.8 11.7 32.0 17.1 14.9
% Change from 1 hr. Storage
-6.58 -14.2 -31.4 -60.1
TD Sample Point 2 at 23 ºC
Mean Emission Factor, n=3 0.00307 0.00269 0.00288 0.00211 0
Precision, RSD, % 0.6 8.9 17.5 18.0 -
% Change from 1 hr. Storage
-12.3 -6.06 -31.2 -100
Emission factors are estimated values compared against response factors of 20-ng VOC standard.
n = number of chamber replicate samples; RSD = relative standard deviation.
This work is protected by copyright. This paper and all data and information contained in it, are owned and protected by the ACC
through its Center for the Polyurethanes Industry. Users are granted a nonexclusive royalty-free license to reproduce and distribute
this paper, subject to the following limitations: (1) the work must be reproduced in its entirety, without alterations; and (2) copies
of the work may not be sold.
Copyright © 2012 Polyurethanes Technical Conference, American Chemistry Council.
33
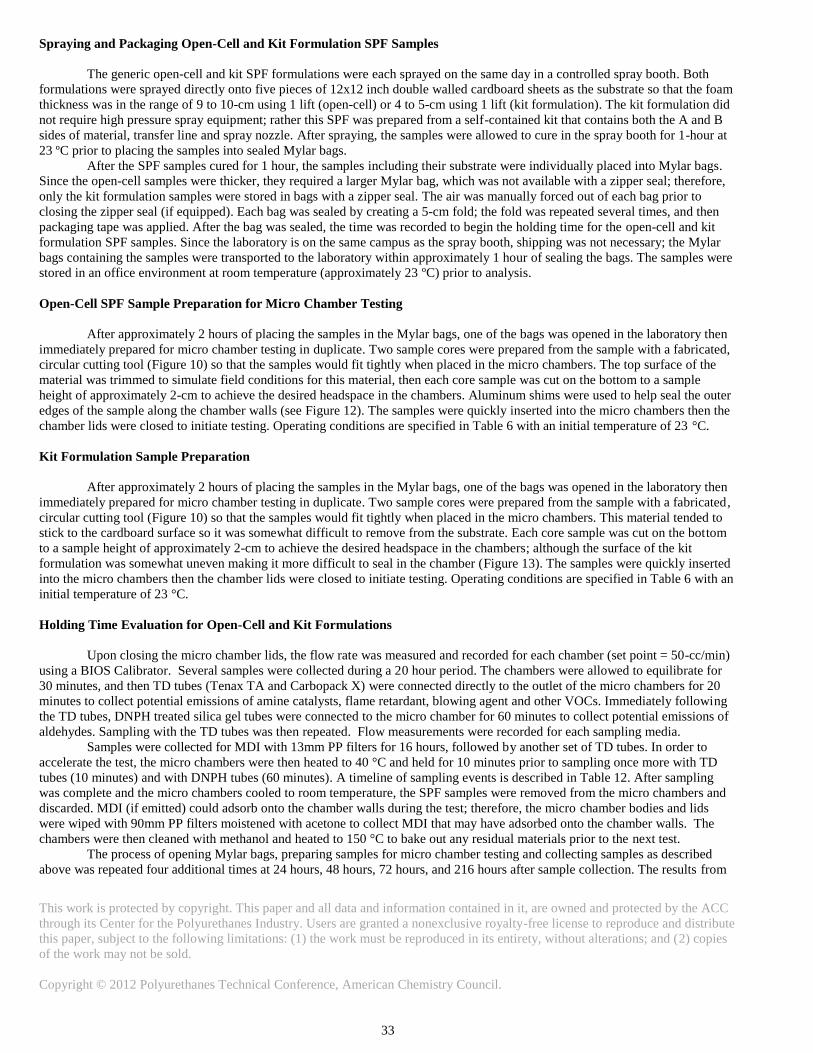
Spraying and Packaging Open-Cell and Kit Formulation SPF Samples
The generic open-cell and kit SPF formulations were each sprayed on the same day in a controlled spray booth. Both
formulations were sprayed directly onto five pieces of 12x12 inch double walled cardboard sheets as the substrate so that the foam
thickness was in the range of 9 to 10-cm using 1 lift (open-cell) or 4 to 5-cm using 1 lift (kit formulation). The kit formulation did
not require high pressure spray equipment; rather this SPF was prepared from a self-contained kit that contains both the A and B
sides of material, transfer line and spray nozzle. After spraying, the samples were allowed to cure in the spray booth for 1-hour at
23 ºC prior to placing the samples into sealed Mylar bags.
After the SPF samples cured for 1 hour, the samples including their substrate were individually placed into Mylar bags.
Since the open-cell samples were thicker, they required a larger Mylar bag, which was not available with a zipper seal; therefore,
only the kit formulation samples were stored in bags with a zipper seal. The air was manually forced out of each bag prior to
closing the zipper seal (if equipped). Each bag was sealed by creating a 5-cm fold; the fold was repeated several times, and then
packaging tape was applied. After the bag was sealed, the time was recorded to begin the holding time for the open-cell and kit
formulation SPF samples. Since the laboratory is on the same campus as the spray booth, shipping was not necessary; the Mylar
bags containing the samples were transported to the laboratory within approximately 1 hour of sealing the bags. The samples were
stored in an office environment at room temperature (approximately 23 ºC) prior to analysis.
Open-Cell SPF Sample Preparation for Micro Chamber Testing
After approximately 2 hours of placing the samples in the Mylar bags, one of the bags was opened in the laboratory then
immediately prepared for micro chamber testing in duplicate. Two sample cores were prepared from the sample with a fabricated,
circular cutting tool (Figure 10) so that the samples would fit tightly when placed in the micro chambers. The top surface of the
material was trimmed to simulate field conditions for this material, then each core sample was cut on the bottom to a sample
height of approximately 2-cm to achieve the desired headspace in the chambers. Aluminum shims were used to help seal the outer
edges of the sample along the chamber walls (see Figure 12). The samples were quickly inserted into the micro chambers then the
chamber lids were closed to initiate testing. Operating conditions are specified in Table 6 with an initial temperature of 23 °C.
Kit Formulation Sample Preparation
After approximately 2 hours of placing the samples in the Mylar bags, one of the bags was opened in the laboratory then
immediately prepared for micro chamber testing in duplicate. Two sample cores were prepared from the sample with a fabricated,
circular cutting tool (Figure 10) so that the samples would fit tightly when placed in the micro chambers. This material tended to
stick to the cardboard surface so it was somewhat difficult to remove from the substrate. Each core sample was cut on the bottom
to a sample height of approximately 2-cm to achieve the desired headspace in the chambers; although the surface of the kit
formulation was somewhat uneven making it more difficult to seal in the chamber (Figure 13). The samples were quickly inserted
into the micro chambers then the chamber lids were closed to initiate testing. Operating conditions are specified in Table 6 with an
initial temperature of 23 °C.
Holding Time Evaluation for Open-Cell and Kit Formulations
Upon closing the micro chamber lids, the flow rate was measured and recorded for each chamber (set point = 50-cc/min)
using a BIOS Calibrator. Several samples were collected during a 20 hour period. The chambers were allowed to equilibrate for
30 minutes, and then TD tubes (Tenax TA and Carbopack X) were connected directly to the outlet of the micro chambers for 20
minutes to collect potential emissions of amine catalysts, flame retardant, blowing agent and other VOCs. Immediately following
the TD tubes, DNPH treated silica gel tubes were connected to the micro chamber for 60 minutes to collect potential emissions of
aldehydes. Sampling with the TD tubes was then repeated. Flow measurements were recorded for each sampling media.
Samples were collected for MDI with 13mm PP filters for 16 hours, followed by another set of TD tubes. In order to
accelerate the test, the micro chambers were then heated to 40 °C and held for 10 minutes prior to sampling once more with TD
tubes (10 minutes) and with DNPH tubes (60 minutes). A timeline of sampling events is described in Table 12. After sampling
was complete and the micro chambers cooled to room temperature, the SPF samples were removed from the micro chambers and
discarded. MDI (if emitted) could adsorb onto the chamber walls during the test; therefore, the micro chamber bodies and lids
were wiped with 90mm PP filters moistened with acetone to collect MDI that may have adsorbed onto the chamber walls. The
chambers were then cleaned with methanol and heated to 150 °C to bake out any residual materials prior to the next test.
The process of opening Mylar bags, preparing samples for micro chamber testing and collecting samples as described
above was repeated four additional times at 24 hours, 48 hours, 72 hours, and 216 hours after sample collection. The results from
This work is protected by copyright. This paper and all data and information contained in it, are owned and protected by the ACC
through its Center for the Polyurethanes Industry. Users are granted a nonexclusive royalty-free license to reproduce and distribute
this paper, subject to the following limitations: (1) the work must be reproduced in its entirety, without alterations; and (2) copies
of the work may not be sold.
Copyright © 2012 Polyurethanes Technical Conference, American Chemistry Council.
34
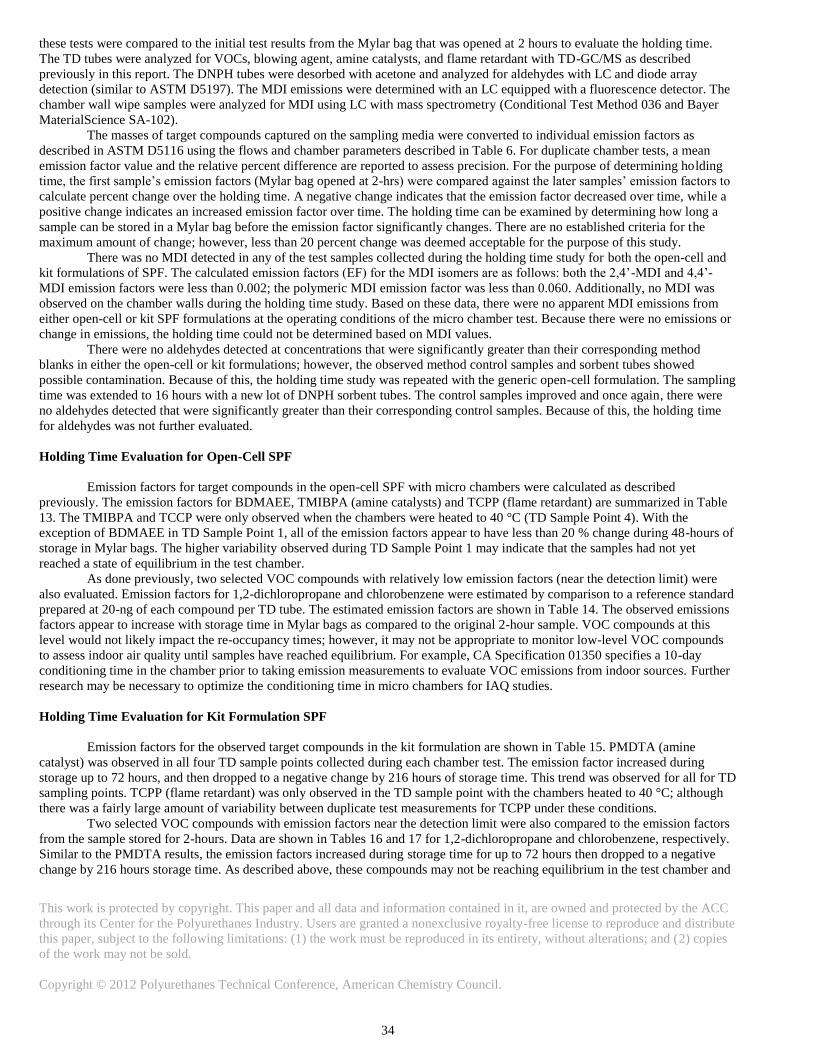
these tests were compared to the initial test results from the Mylar bag that was opened at 2 hours to evaluate the holding time.
The TD tubes were analyzed for VOCs, blowing agent, amine catalysts, and flame retardant with TD-GC/MS as described
previously in this report. The DNPH tubes were desorbed with acetone and analyzed for aldehydes with LC and diode array
detection (similar to ASTM D5197). The MDI emissions were determined with an LC equipped with a fluorescence detector. The
chamber wall wipe samples were analyzed for MDI using LC with mass spectrometry (Conditional Test Method 036 and Bayer
MaterialScience SA-102).
The masses of target compounds captured on the sampling media were converted to individual emission factors as
described in ASTM D5116 using the flows and chamber parameters described in Table 6. For duplicate chamber tests, a mean
emission factor value and the relative percent difference are reported to assess precision. For the purpose of determining holding
time, the first sample’s emission factors (Mylar bag opened at 2-hrs) were compared against the later samples’ emission factors to
calculate percent change over the holding time. A negative change indicates that the emission factor decreased over time, while a
positive change indicates an increased emission factor over time. The holding time can be examined by determining how long a
sample can be stored in a Mylar bag before the emission factor significantly changes. There are no established criteria for the
maximum amount of change; however, less than 20 percent change was deemed acceptable for the purpose of this study.
There was no MDI detected in any of the test samples collected during the holding time study for both the open-cell and
kit formulations of SPF. The calculated emission factors (EF) for the MDI isomers are as follows: both the 2,4’-MDI and 4,4’-
MDI emission factors were less than 0.002; the polymeric MDI emission factor was less than 0.060. Additionally, no MDI was
observed on the chamber walls during the holding time study. Based on these data, there were no apparent MDI emissions from
either open-cell or kit SPF formulations at the operating conditions of the micro chamber test. Because there were no emissions or
change in emissions, the holding time could not be determined based on MDI values.
There were no aldehydes detected at concentrations that were significantly greater than their corresponding method
blanks in either the open-cell or kit formulations; however, the observed method control samples and sorbent tubes showed
possible contamination. Because of this, the holding time study was repeated with the generic open-cell formulation. The sampling
time was extended to 16 hours with a new lot of DNPH sorbent tubes. The control samples improved and once again, there were
no aldehydes detected that were significantly greater than their corresponding control samples. Because of this, the holding time
for aldehydes was not further evaluated.
Holding Time Evaluation for Open-Cell SPF
Emission factors for target compounds in the open-cell SPF with micro chambers were calculated as described
previously. The emission factors for BDMAEE, TMIBPA (amine catalysts) and TCPP (flame retardant) are summarized in Table
13. The TMIBPA and TCCP were only observed when the chambers were heated to 40 °C (TD Sample Point 4). With the
exception of BDMAEE in TD Sample Point 1, all of the emission factors appear to have less than 20 % change during 48-hours of
storage in Mylar bags. The higher variability observed during TD Sample Point 1 may indicate that the samples had not yet
reached a state of equilibrium in the test chamber.
As done previously, two selected VOC compounds with relatively low emission factors (near the detection limit) were
also evaluated. Emission factors for 1,2-dichloropropane and chlorobenzene were estimated by comparison to a reference standard
prepared at 20-ng of each compound per TD tube. The estimated emission factors are shown in Table 14. The observed emissions
factors appear to increase with storage time in Mylar bags as compared to the original 2-hour sample. VOC compounds at this
level would not likely impact the re-occupancy times; however, it may not be appropriate to monitor low-level VOC compounds
to assess indoor air quality until samples have reached equilibrium. For example, CA Specification 01350 specifies a 10-day
conditioning time in the chamber prior to taking emission measurements to evaluate VOC emissions from indoor sources. Further
research may be necessary to optimize the conditioning time in micro chambers for IAQ studies.
Holding Time Evaluation for Kit Formulation SPF
Emission factors for the observed target compounds in the kit formulation are shown in Table 15. PMDTA (amine
catalyst) was observed in all four TD sample points collected during each chamber test. The emission factor increased during
storage up to 72 hours, and then dropped to a negative change by 216 hours of storage time. This trend was observed for all for TD
sampling points. TCPP (flame retardant) was only observed in the TD sample point with the chambers heated to 40 °C; although
there was a fairly large amount of variability between duplicate test measurements for TCPP under these conditions.
Two selected VOC compounds with emission factors near the detection limit were also compared to the emission factors
from the sample stored for 2-hours. Data are shown in Tables 16 and 17 for 1,2-dichloropropane and chlorobenzene, respectively.
Similar to the PMDTA results, the emission factors increased during storage time for up to 72 hours then dropped to a negative
change by 216 hours storage time. As described above, these compounds may not be reaching equilibrium in the test chamber and
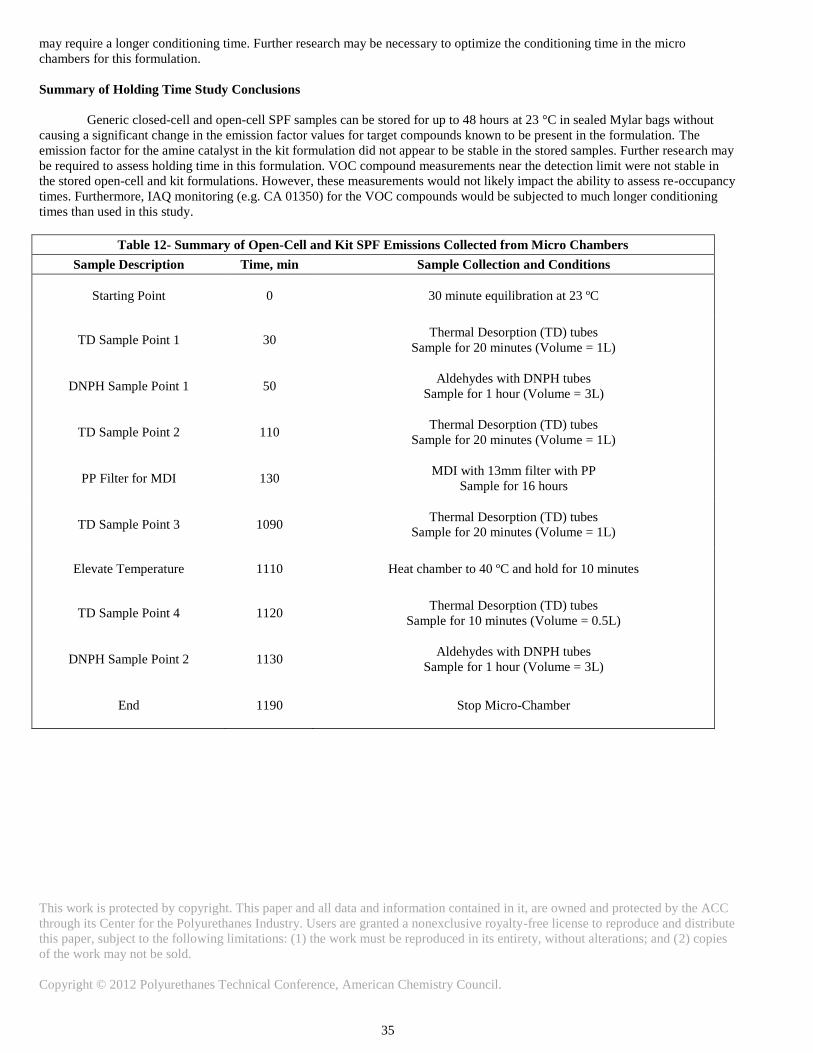
This work is protected by copyright. This paper and all data and information contained in it, are owned and protected by the ACC
through its Center for the Polyurethanes Industry. Users are granted a nonexclusive royalty-free license to reproduce and distribute
this paper, subject to the following limitations: (1) the work must be reproduced in its entirety, without alterations; and (2) copies
of the work may not be sold.
Copyright © 2012 Polyurethanes Technical Conference, American Chemistry Council.
35
may require a longer conditioning time. Further research may be necessary to optimize the conditioning time in the micro
chambers for this formulation.
Summary of Holding Time Study Conclusions
Generic closed-cell and open-cell SPF samples can be stored for up to 48 hours at 23 °C in sealed Mylar bags without
causing a significant change in the emission factor values for target compounds known to be present in the formulation. The
emission factor for the amine catalyst in the kit formulation did not appear to be stable in the stored samples. Further research may
be required to assess holding time in this formulation. VOC compound measurements near the detection limit were not stable in
the stored open-cell and kit formulations. However, these measurements would not likely impact the ability to assess re-occupancy
times. Furthermore, IAQ monitoring (e.g. CA 01350) for the VOC compounds would be subjected to much longer conditioning
times than used in this study.
Table 12- Summary of Open-Cell and Kit SPF Emissions Collected from Micro Chambers
Sample Description Time, min Sample Collection and Conditions
Starting Point 0 30 minute equilibration at 23 ºC
TD Sample Point 1 30 Thermal Desorption (TD) tubes
Sample for 20 minutes (Volume = 1L)
DNPH Sample Point 1 50 Aldehydes with DNPH tubes
Sample for 1 hour (Volume = 3L)
TD Sample Point 2 110 Thermal Desorption (TD) tubes
Sample for 20 minutes (Volume = 1L)
PP Filter for MDI 130 MDI with 13mm filter with PP
Sample for 16 hours
TD Sample Point 3 1090 Thermal Desorption (TD) tubes
Sample for 20 minutes (Volume = 1L)
Elevate Temperature 1110 Heat chamber to 40 ºC and hold for 10 minutes
TD Sample Point 4 1120 Thermal Desorption (TD) tubes
Sample for 10 minutes (Volume = 0.5L)
DNPH Sample Point 2 1130 Aldehydes with DNPH tubes
Sample for 1 hour (Volume = 3L)
End 1190 Stop Micro-Chamber
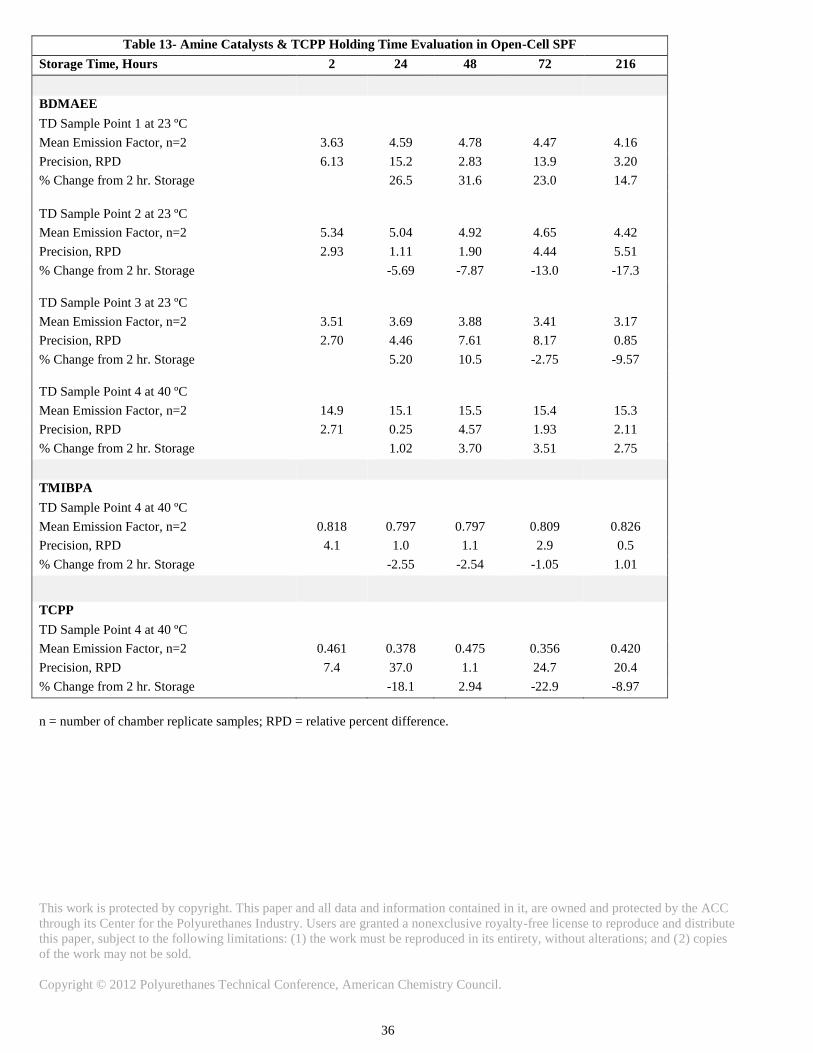
This work is protected by copyright. This paper and all data and information contained in it, are owned and protected by the ACC
through its Center for the Polyurethanes Industry. Users are granted a nonexclusive royalty-free license to reproduce and distribute
this paper, subject to the following limitations: (1) the work must be reproduced in its entirety, without alterations; and (2) copies
of the work may not be sold.
Copyright © 2012 Polyurethanes Technical Conference, American Chemistry Council.
36
Table 13- Amine Catalysts & TCPP Holding Time Evaluation in Open-Cell SPF
Storage Time, Hours 2 24 48 72 216
BDMAEE
TD Sample Point 1 at 23 ºC
Mean Emission Factor, n=2 3.63 4.59 4.78 4.47 4.16
Precision, RPD 6.13 15.2 2.83 13.9 3.20
% Change from 2 hr. Storage 26.5 31.6 23.0 14.7
TD Sample Point 2 at 23 ºC
Mean Emission Factor, n=2 5.34 5.04 4.92 4.65 4.42
Precision, RPD 2.93 1.11 1.90 4.44 5.51
% Change from 2 hr. Storage -5.69 -7.87 -13.0 -17.3
TD Sample Point 3 at 23 ºC
Mean Emission Factor, n=2 3.51 3.69 3.88 3.41 3.17
Precision, RPD 2.70 4.46 7.61 8.17 0.85
% Change from 2 hr. Storage 5.20 10.5 -2.75 -9.57
TD Sample Point 4 at 40 ºC
Mean Emission Factor, n=2 14.9 15.1 15.5 15.4 15.3
Precision, RPD 2.71 0.25 4.57 1.93 2.11
% Change from 2 hr. Storage 1.02 3.70 3.51 2.75
TMIBPA
TD Sample Point 4 at 40 ºC
Mean Emission Factor, n=2 0.818 0.797 0.797 0.809 0.826
Precision, RPD 4.1 1.0 1.1 2.9 0.5
% Change from 2 hr. Storage -2.55 -2.54 -1.05 1.01
TCPP
TD Sample Point 4 at 40 ºC
Mean Emission Factor, n=2 0.461 0.378 0.475 0.356 0.420
Precision, RPD 7.4 37.0 1.1 24.7 20.4
% Change from 2 hr. Storage -18.1 2.94 -22.9 -8.97
n = number of chamber replicate samples; RPD = relative percent difference.
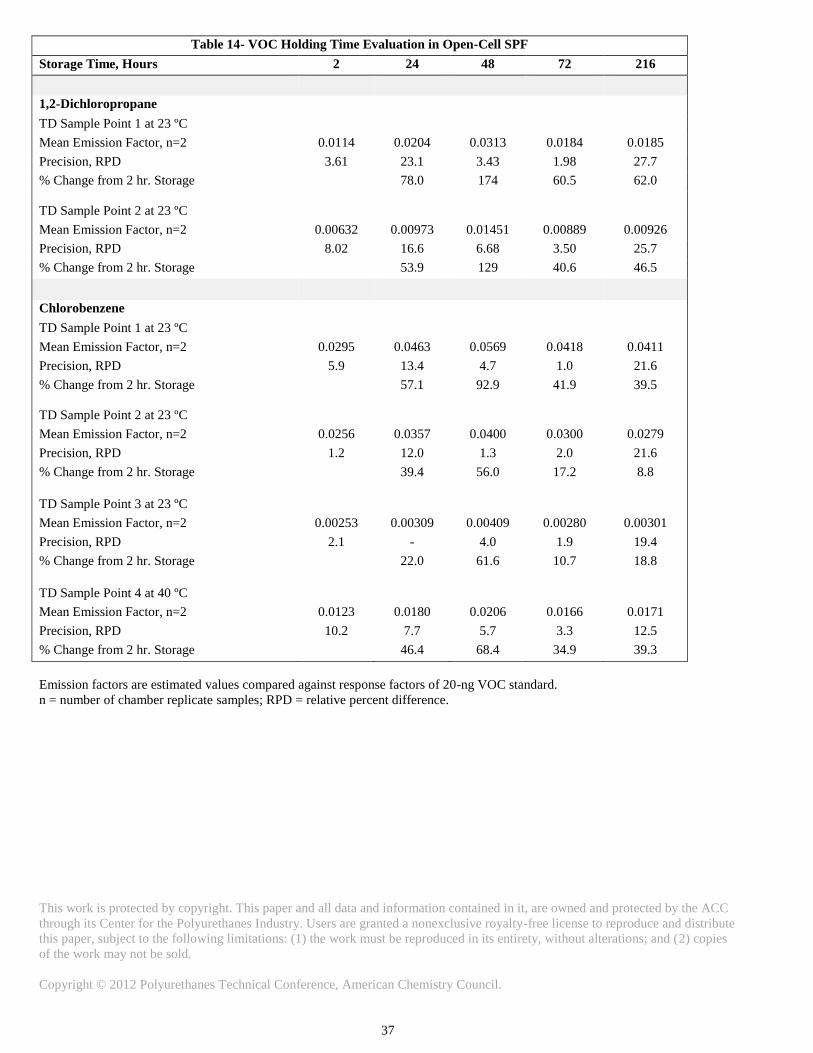
This work is protected by copyright. This paper and all data and information contained in it, are owned and protected by the ACC
through its Center for the Polyurethanes Industry. Users are granted a nonexclusive royalty-free license to reproduce and distribute
this paper, subject to the following limitations: (1) the work must be reproduced in its entirety, without alterations; and (2) copies
of the work may not be sold.
Copyright © 2012 Polyurethanes Technical Conference, American Chemistry Council.
37
Table 14- VOC Holding Time Evaluation in Open-Cell SPF
Storage Time, Hours 2 24 48 72 216
1,2-Dichloropropane
TD Sample Point 1 at 23 ºC
Mean Emission Factor, n=2 0.0114 0.0204 0.0313 0.0184 0.0185
Precision, RPD 3.61 23.1 3.43 1.98 27.7
% Change from 2 hr. Storage 78.0 174 60.5 62.0
TD Sample Point 2 at 23 ºC
Mean Emission Factor, n=2 0.00632 0.00973 0.01451 0.00889 0.00926
Precision, RPD 8.02 16.6 6.68 3.50 25.7
% Change from 2 hr. Storage 53.9 129 40.6 46.5
Chlorobenzene
TD Sample Point 1 at 23 ºC
Mean Emission Factor, n=2 0.0295 0.0463 0.0569 0.0418 0.0411
Precision, RPD 5.9 13.4 4.7 1.0 21.6
% Change from 2 hr. Storage 57.1 92.9 41.9 39.5
TD Sample Point 2 at 23 ºC
Mean Emission Factor, n=2 0.0256 0.0357 0.0400 0.0300 0.0279
Precision, RPD 1.2 12.0 1.3 2.0 21.6
% Change from 2 hr. Storage 39.4 56.0 17.2 8.8
TD Sample Point 3 at 23 ºC
Mean Emission Factor, n=2 0.00253 0.00309 0.00409 0.00280 0.00301
Precision, RPD 2.1 - 4.0 1.9 19.4
% Change from 2 hr. Storage 22.0 61.6 10.7 18.8
TD Sample Point 4 at 40 ºC
Mean Emission Factor, n=2 0.0123 0.0180 0.0206 0.0166 0.0171
Precision, RPD 10.2 7.7 5.7 3.3 12.5
% Change from 2 hr. Storage 46.4 68.4 34.9 39.3
Emission factors are estimated values compared against response factors of 20-ng VOC standard.
n = number of chamber replicate samples; RPD = relative percent difference.
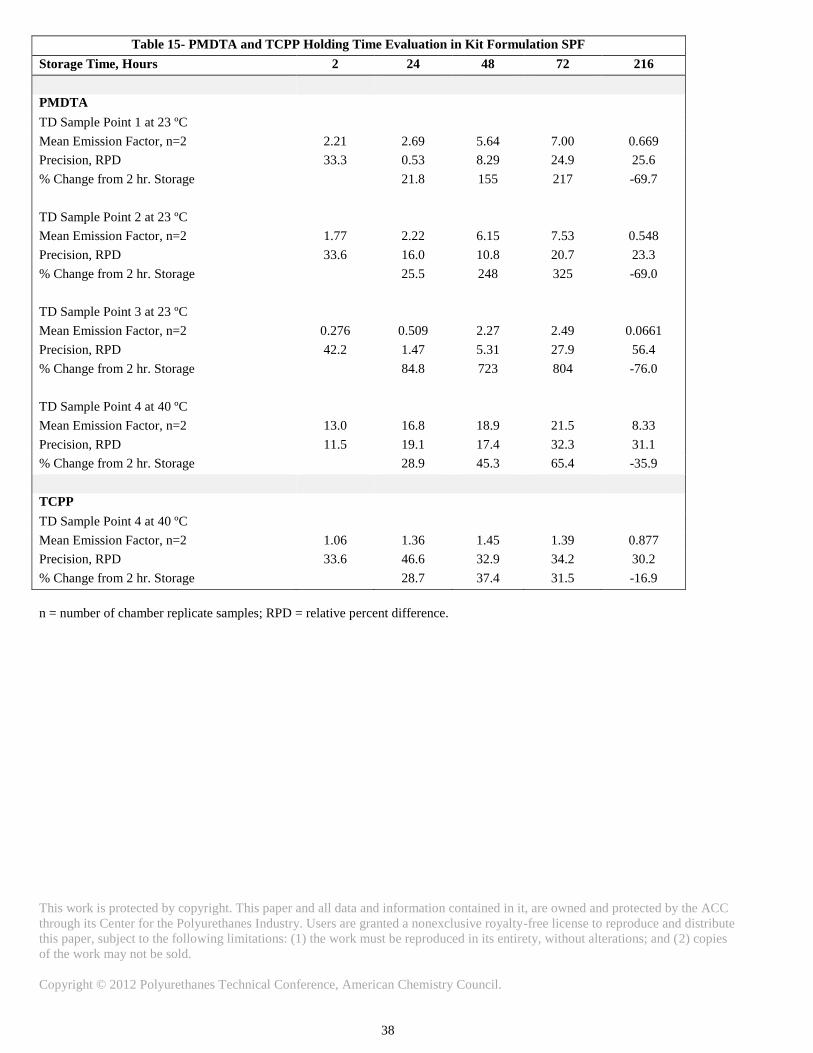
This work is protected by copyright. This paper and all data and information contained in it, are owned and protected by the ACC
through its Center for the Polyurethanes Industry. Users are granted a nonexclusive royalty-free license to reproduce and distribute
this paper, subject to the following limitations: (1) the work must be reproduced in its entirety, without alterations; and (2) copies
of the work may not be sold.
Copyright © 2012 Polyurethanes Technical Conference, American Chemistry Council.
38
Table 15- PMDTA and TCPP Holding Time Evaluation in Kit Formulation SPF
Storage Time, Hours 2 24 48 72 216
PMDTA
TD Sample Point 1 at 23 ºC
Mean Emission Factor, n=2 2.21 2.69 5.64 7.00 0.669
Precision, RPD 33.3 0.53 8.29 24.9 25.6
% Change from 2 hr. Storage 21.8 155 217 -69.7
TD Sample Point 2 at 23 ºC
Mean Emission Factor, n=2 1.77 2.22 6.15 7.53 0.548
Precision, RPD 33.6 16.0 10.8 20.7 23.3
% Change from 2 hr. Storage 25.5 248 325 -69.0
TD Sample Point 3 at 23 ºC
Mean Emission Factor, n=2 0.276 0.509 2.27 2.49 0.0661
Precision, RPD 42.2 1.47 5.31 27.9 56.4
% Change from 2 hr. Storage 84.8 723 804 -76.0
TD Sample Point 4 at 40 ºC
Mean Emission Factor, n=2 13.0 16.8 18.9 21.5 8.33
Precision, RPD 11.5 19.1 17.4 32.3 31.1
% Change from 2 hr. Storage 28.9 45.3 65.4 -35.9
TCPP
TD Sample Point 4 at 40 ºC
Mean Emission Factor, n=2 1.06 1.36 1.45 1.39 0.877
Precision, RPD 33.6 46.6 32.9 34.2 30.2
% Change from 2 hr. Storage 28.7 37.4 31.5 -16.9
n = number of chamber replicate samples; RPD = relative percent difference.
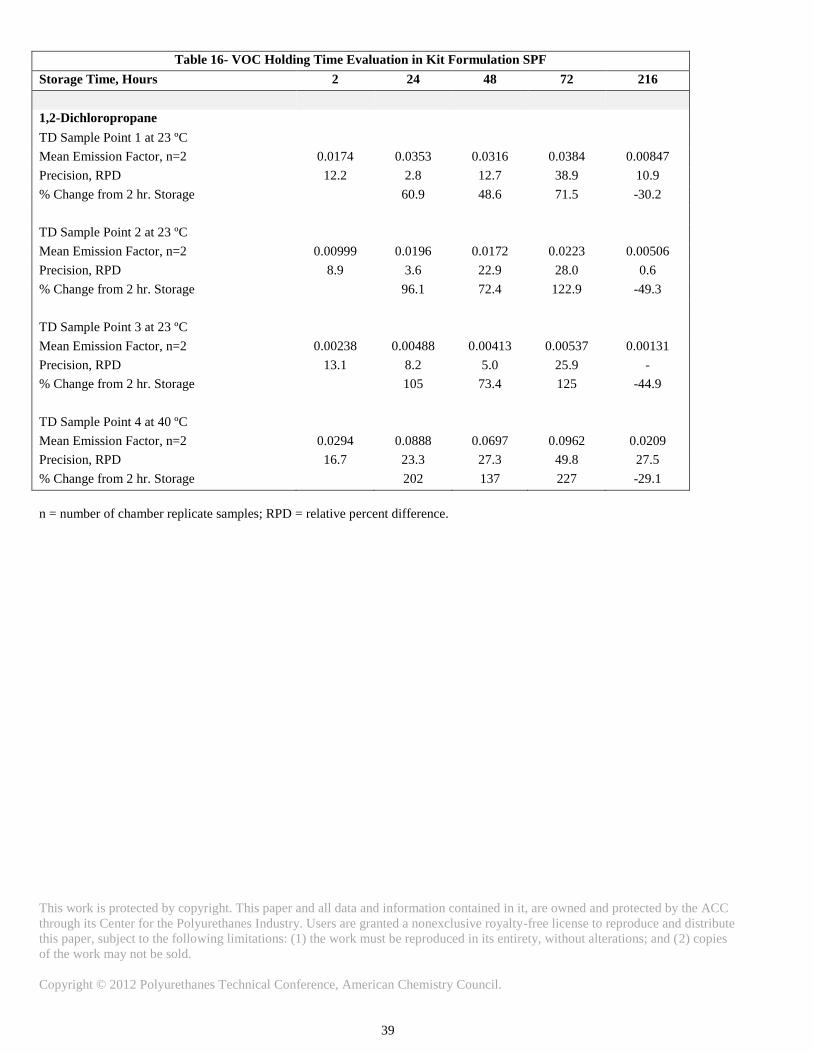
This work is protected by copyright. This paper and all data and information contained in it, are owned and protected by the ACC
through its Center for the Polyurethanes Industry. Users are granted a nonexclusive royalty-free license to reproduce and distribute
this paper, subject to the following limitations: (1) the work must be reproduced in its entirety, without alterations; and (2) copies
of the work may not be sold.
Copyright © 2012 Polyurethanes Technical Conference, American Chemistry Council.
39
Table 16- VOC Holding Time Evaluation in Kit Formulation SPF
Storage Time, Hours 2 24 48 72 216
1,2-Dichloropropane
TD Sample Point 1 at 23 ºC
Mean Emission Factor, n=2 0.0174 0.0353 0.0316 0.0384 0.00847
Precision, RPD 12.2 2.8 12.7 38.9 10.9
% Change from 2 hr. Storage 60.9 48.6 71.5 -30.2
TD Sample Point 2 at 23 ºC
Mean Emission Factor, n=2 0.00999 0.0196 0.0172 0.0223 0.00506
Precision, RPD 8.9 3.6 22.9 28.0 0.6
% Change from 2 hr. Storage 96.1 72.4 122.9 -49.3
TD Sample Point 3 at 23 ºC
Mean Emission Factor, n=2 0.00238 0.00488 0.00413 0.00537 0.00131
Precision, RPD 13.1 8.2 5.0 25.9 -
% Change from 2 hr. Storage 105 73.4 125 -44.9
TD Sample Point 4 at 40 ºC
Mean Emission Factor, n=2 0.0294 0.0888 0.0697 0.0962 0.0209
Precision, RPD 16.7 23.3 27.3 49.8 27.5
% Change from 2 hr. Storage 202 137 227 -29.1
n = number of chamber replicate samples; RPD = relative percent difference.
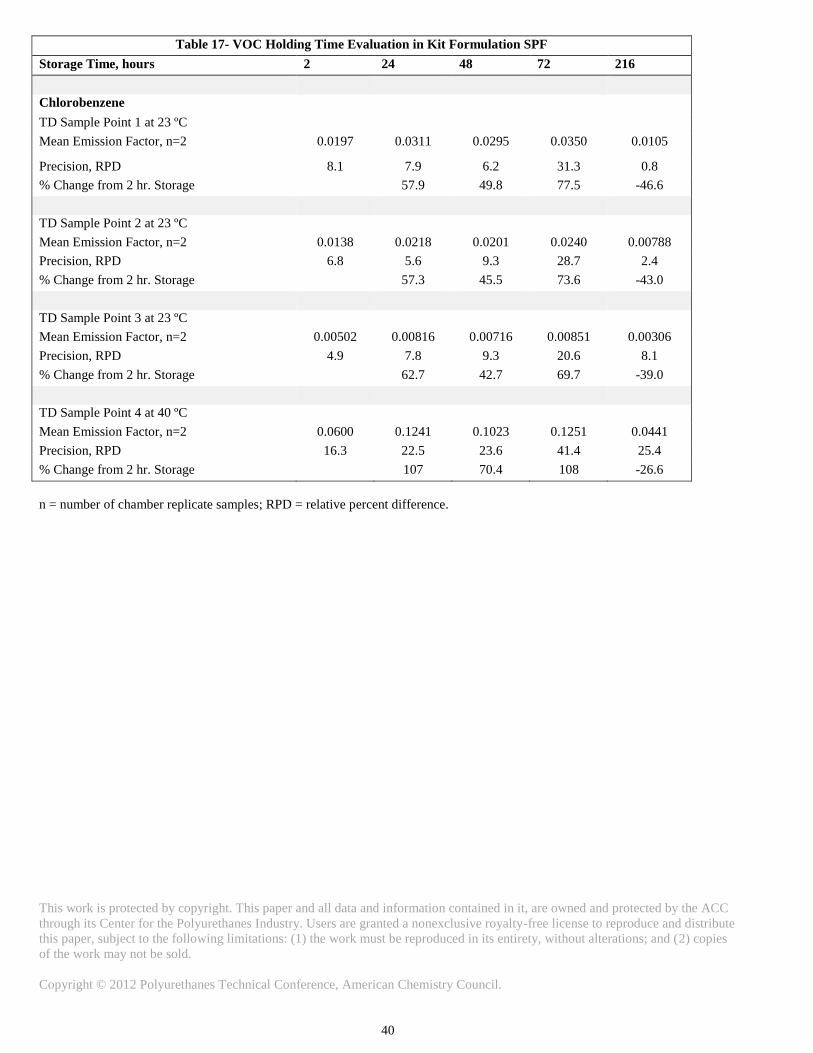
This work is protected by copyright. This paper and all data and information contained in it, are owned and protected by the ACC
through its Center for the Polyurethanes Industry. Users are granted a nonexclusive royalty-free license to reproduce and distribute
this paper, subject to the following limitations: (1) the work must be reproduced in its entirety, without alterations; and (2) copies
of the work may not be sold.
Copyright © 2012 Polyurethanes Technical Conference, American Chemistry Council.
40
Table 17- VOC Holding Time Evaluation in Kit Formulation SPF
Storage Time, hours 2 24 48 72 216
Chlorobenzene
TD Sample Point 1 at 23 ºC
Mean Emission Factor, n=2 0.0197 0.0311 0.0295 0.0350 0.0105
Precision, RPD 8.1 7.9 6.2 31.3 0.8
% Change from 2 hr. Storage 57.9 49.8 77.5 -46.6
TD Sample Point 2 at 23 ºC
Mean Emission Factor, n=2 0.0138 0.0218 0.0201 0.0240 0.00788
Precision, RPD 6.8 5.6 9.3 28.7 2.4
% Change from 2 hr. Storage 57.3 45.5 73.6 -43.0
TD Sample Point 3 at 23 ºC
Mean Emission Factor, n=2 0.00502 0.00816 0.00716 0.00851 0.00306
Precision, RPD 4.9 7.8 9.3 20.6 8.1
% Change from 2 hr. Storage 62.7 42.7 69.7 -39.0
TD Sample Point 4 at 40 ºC
Mean Emission Factor, n=2 0.0600 0.1241 0.1023 0.1251 0.0441
Precision, RPD 16.3 22.5 23.6 41.4 25.4
% Change from 2 hr. Storage 107 70.4 108 -26.6
n = number of chamber replicate samples; RPD = relative percent difference.
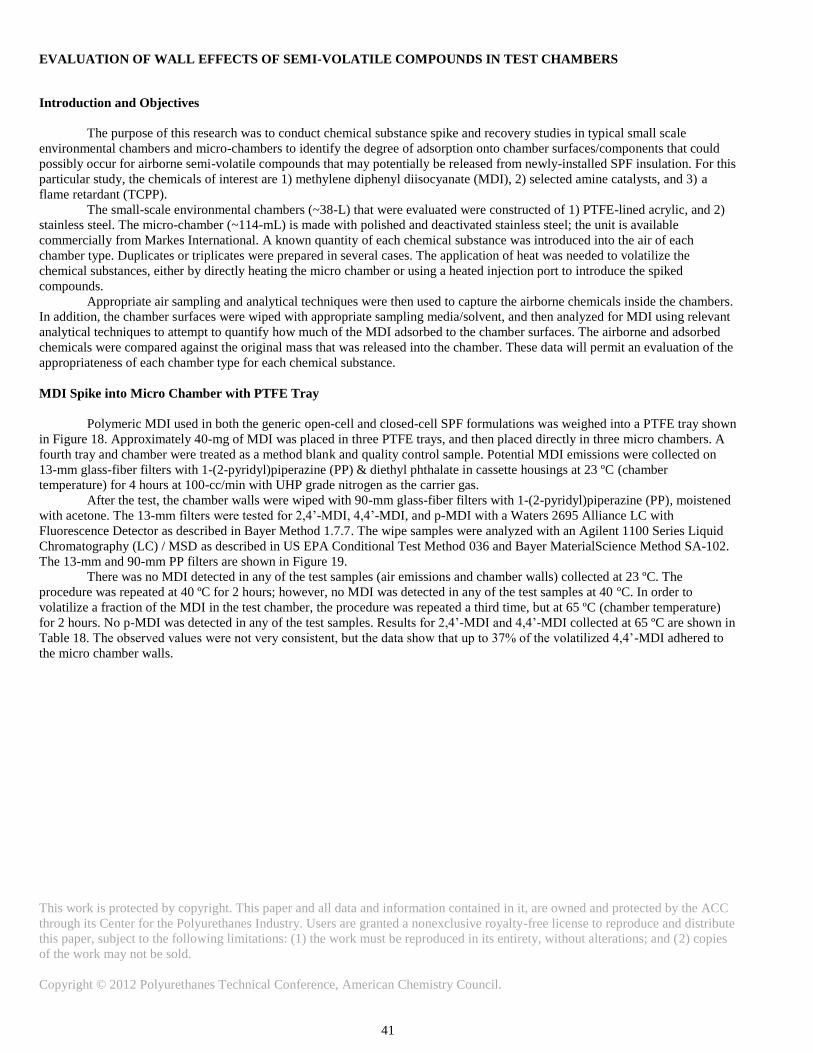
This work is protected by copyright. This paper and all data and information contained in it, are owned and protected by the ACC
through its Center for the Polyurethanes Industry. Users are granted a nonexclusive royalty-free license to reproduce and distribute
this paper, subject to the following limitations: (1) the work must be reproduced in its entirety, without alterations; and (2) copies
of the work may not be sold.
Copyright © 2012 Polyurethanes Technical Conference, American Chemistry Council.
41
EVALUATION OF WALL EFFECTS OF SEMI-VOLATILE COMPOUNDS IN TEST CHAMBERS
Introduction and Objectives
The purpose of this research was to conduct chemical substance spike and recovery studies in typical small scale
environmental chambers and micro-chambers to identify the degree of adsorption onto chamber surfaces/components that could
possibly occur for airborne semi-volatile compounds that may potentially be released from newly-installed SPF insulation. For this
particular study, the chemicals of interest are 1) methylene diphenyl diisocyanate (MDI), 2) selected amine catalysts, and 3) a
flame retardant (TCPP).
The small-scale environmental chambers (~38-L) that were evaluated were constructed of 1) PTFE-lined acrylic, and 2)
stainless steel. The micro-chamber (~114-mL) is made with polished and deactivated stainless steel; the unit is available
commercially from Markes International. A known quantity of each chemical substance was introduced into the air of each
chamber type. Duplicates or triplicates were prepared in several cases. The application of heat was needed to volatilize the
chemical substances, either by directly heating the micro chamber or using a heated injection port to introduce the spiked
compounds.
Appropriate air sampling and analytical techniques were then used to capture the airborne chemicals inside the chambers.
In addition, the chamber surfaces were wiped with appropriate sampling media/solvent, and then analyzed for MDI using relevant
analytical techniques to attempt to quantify how much of the MDI adsorbed to the chamber surfaces. The airborne and adsorbed
chemicals were compared against the original mass that was released into the chamber. These data will permit an evaluation of the
appropriateness of each chamber type for each chemical substance.
MDI Spike into Micro Chamber with PTFE Tray
Polymeric MDI used in both the generic open-cell and closed-cell SPF formulations was weighed into a PTFE tray shown
in Figure 18. Approximately 40-mg of MDI was placed in three PTFE trays, and then placed directly in three micro chambers. A
fourth tray and chamber were treated as a method blank and quality control sample. Potential MDI emissions were collected on
13-mm glass-fiber filters with 1-(2-pyridyl)piperazine (PP) & diethyl phthalate in cassette housings at 23 ºC (chamber
temperature) for 4 hours at 100-cc/min with UHP grade nitrogen as the carrier gas.
After the test, the chamber walls were wiped with 90-mm glass-fiber filters with 1-(2-pyridyl)piperazine (PP), moistened
with acetone. The 13-mm filters were tested for 2,4’-MDI, 4,4’-MDI, and p-MDI with a Waters 2695 Alliance LC with
Fluorescence Detector as described in Bayer Method 1.7.7. The wipe samples were analyzed with an Agilent 1100 Series Liquid
Chromatography (LC) / MSD as described in US EPA Conditional Test Method 036 and Bayer MaterialScience Method SA-102.
The 13-mm and 90-mm PP filters are shown in Figure 19.
There was no MDI detected in any of the test samples (air emissions and chamber walls) collected at 23 ºC. The
procedure was repeated at 40 ºC for 2 hours; however, no MDI was detected in any of the test samples at 40 ºC. In order to
volatilize a fraction of the MDI in the test chamber, the procedure was repeated a third time, but at 65 ºC (chamber temperature)
for 2 hours. No p-MDI was detected in any of the test samples. Results for 2,4’-MDI and 4,4’-MDI collected at 65 ºC are shown in
Table 18. The observed values were not very consistent, but the data show that up to 37% of the volatilized 4,4’-MDI adhered to
the micro chamber walls.
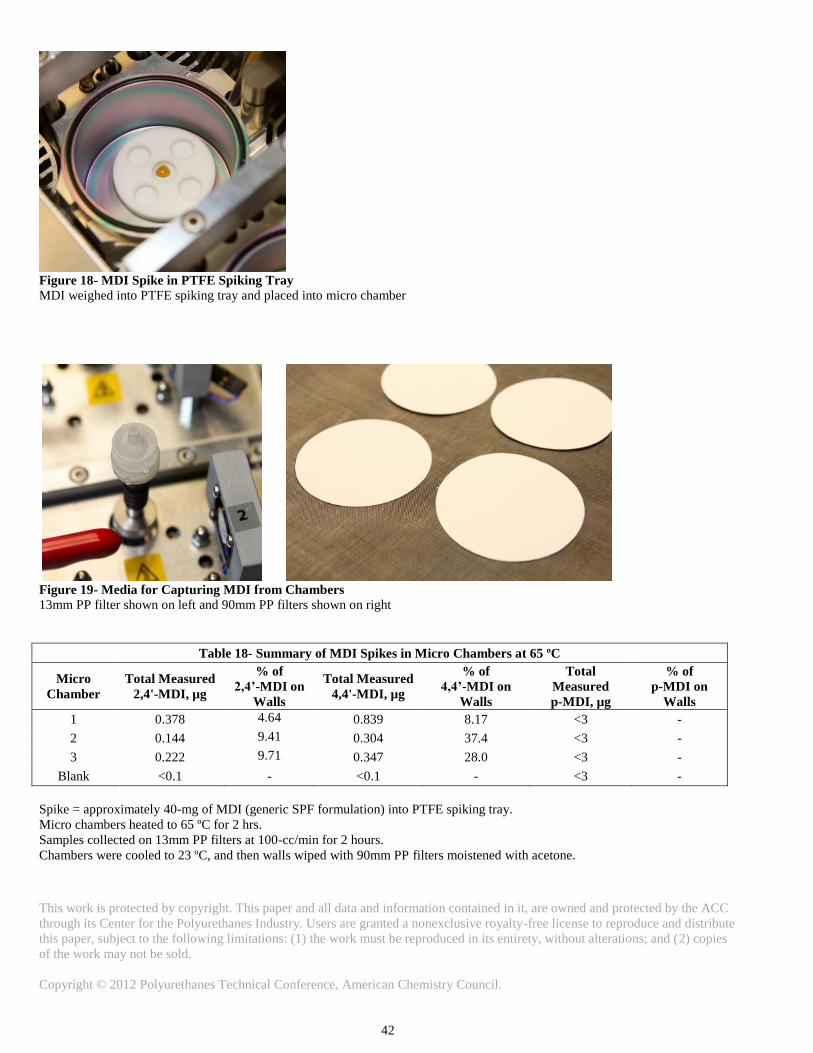
This work is protected by copyright. This paper and all data and information contained in it, are owned and protected by the ACC
through its Center for the Polyurethanes Industry. Users are granted a nonexclusive royalty-free license to reproduce and distribute
this paper, subject to the following limitations: (1) the work must be reproduced in its entirety, without alterations; and (2) copies
of the work may not be sold.
Copyright © 2012 Polyurethanes Technical Conference, American Chemistry Council.
42
Figure 18- MDI Spike in PTFE Spiking Tray
MDI weighed into PTFE spiking tray and placed into micro chamber
Figure 19- Media for Capturing MDI from Chambers
13mm PP filter shown on left and 90mm PP filters shown on right
Table 18- Summary of MDI Spikes in Micro Chambers at 65 ºC
Micro
Chamber
Total Measured
2,4'-MDI, µg
% of
2,4’-MDI on
Walls
Total Measured
4,4'-MDI, µg
% of
4,4’-MDI on
Walls
Total
Measured
p-MDI, µg
% of
p-MDI on
Walls
1 0.378 4.64 0.839 8.17 <3 -
2 0.144 9.41 0.304 37.4 <3 -
3 0.222 9.71 0.347 28.0 <3 -
Blank <0.1 - <0.1 - <3 -
Spike = approximately 40-mg of MDI (generic SPF formulation) into PTFE spiking tray.
Micro chambers heated to 65 ºC for 2 hrs.
Samples collected on 13mm PP filters at 100-cc/min for 2 hours.
Chambers were cooled to 23 ºC, and then walls wiped with 90mm PP filters moistened with acetone.
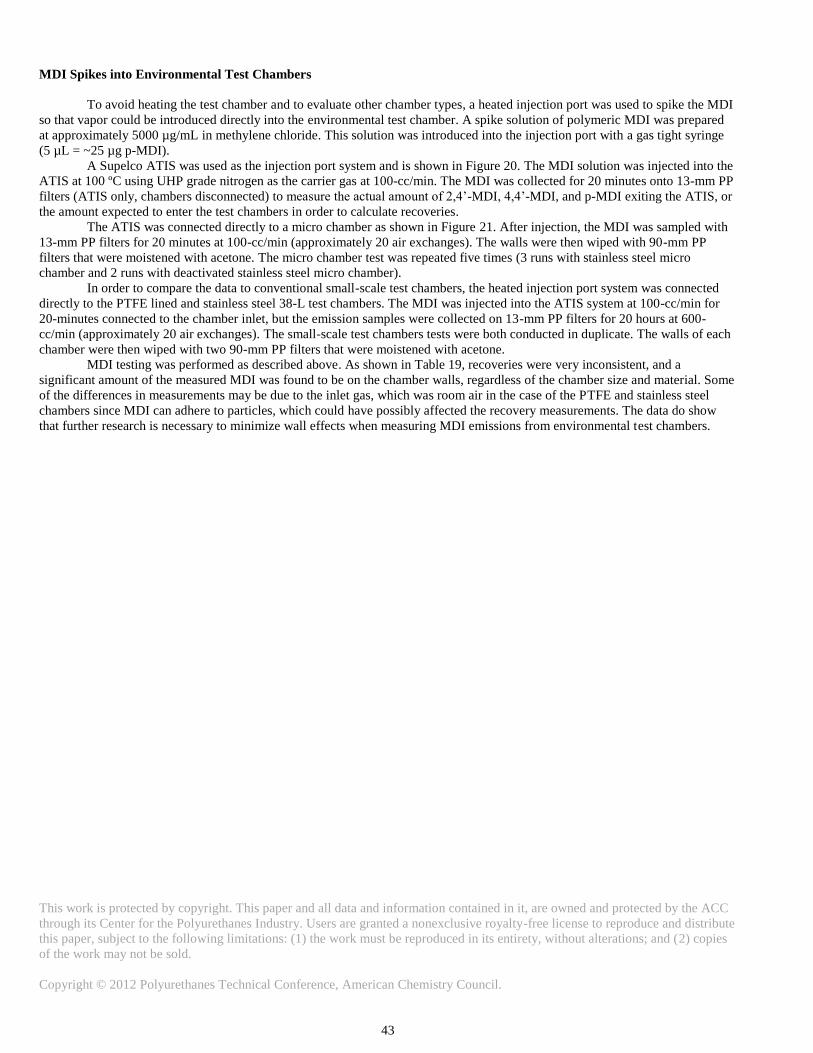
This work is protected by copyright. This paper and all data and information contained in it, are owned and protected by the ACC
through its Center for the Polyurethanes Industry. Users are granted a nonexclusive royalty-free license to reproduce and distribute
this paper, subject to the following limitations: (1) the work must be reproduced in its entirety, without alterations; and (2) copies
of the work may not be sold.
Copyright © 2012 Polyurethanes Technical Conference, American Chemistry Council.
43
MDI Spikes into Environmental Test Chambers
To avoid heating the test chamber and to evaluate other chamber types, a heated injection port was used to spike the MDI
so that vapor could be introduced directly into the environmental test chamber. A spike solution of polymeric MDI was prepared
at approximately 5000 µg/mL in methylene chloride. This solution was introduced into the injection port with a gas tight syringe
(5 µL = ~25 µg p-MDI).
A Supelco ATIS was used as the injection port system and is shown in Figure 20. The MDI solution was injected into the
ATIS at 100 ºC using UHP grade nitrogen as the carrier gas at 100-cc/min. The MDI was collected for 20 minutes onto 13-mm PP
filters (ATIS only, chambers disconnected) to measure the actual amount of 2,4’-MDI, 4,4’-MDI, and p-MDI exiting the ATIS, or
the amount expected to enter the test chambers in order to calculate recoveries.
The ATIS was connected directly to a micro chamber as shown in Figure 21. After injection, the MDI was sampled with
13-mm PP filters for 20 minutes at 100-cc/min (approximately 20 air exchanges). The walls were then wiped with 90-mm PP
filters that were moistened with acetone. The micro chamber test was repeated five times (3 runs with stainless steel micro
chamber and 2 runs with deactivated stainless steel micro chamber).
In order to compare the data to conventional small-scale test chambers, the heated injection port system was connected
directly to the PTFE lined and stainless steel 38-L test chambers. The MDI was injected into the ATIS system at 100-cc/min for
20-minutes connected to the chamber inlet, but the emission samples were collected on 13-mm PP filters for 20 hours at 600-
cc/min (approximately 20 air exchanges). The small-scale test chambers tests were both conducted in duplicate. The walls of each
chamber were then wiped with two 90-mm PP filters that were moistened with acetone.
MDI testing was performed as described above. As shown in Table 19, recoveries were very inconsistent, and a
significant amount of the measured MDI was found to be on the chamber walls, regardless of the chamber size and material. Some
of the differences in measurements may be due to the inlet gas, which was room air in the case of the PTFE and stainless steel
chambers since MDI can adhere to particles, which could have possibly affected the recovery measurements. The data do show
that further research is necessary to minimize wall effects when measuring MDI emissions from environmental test chambers.
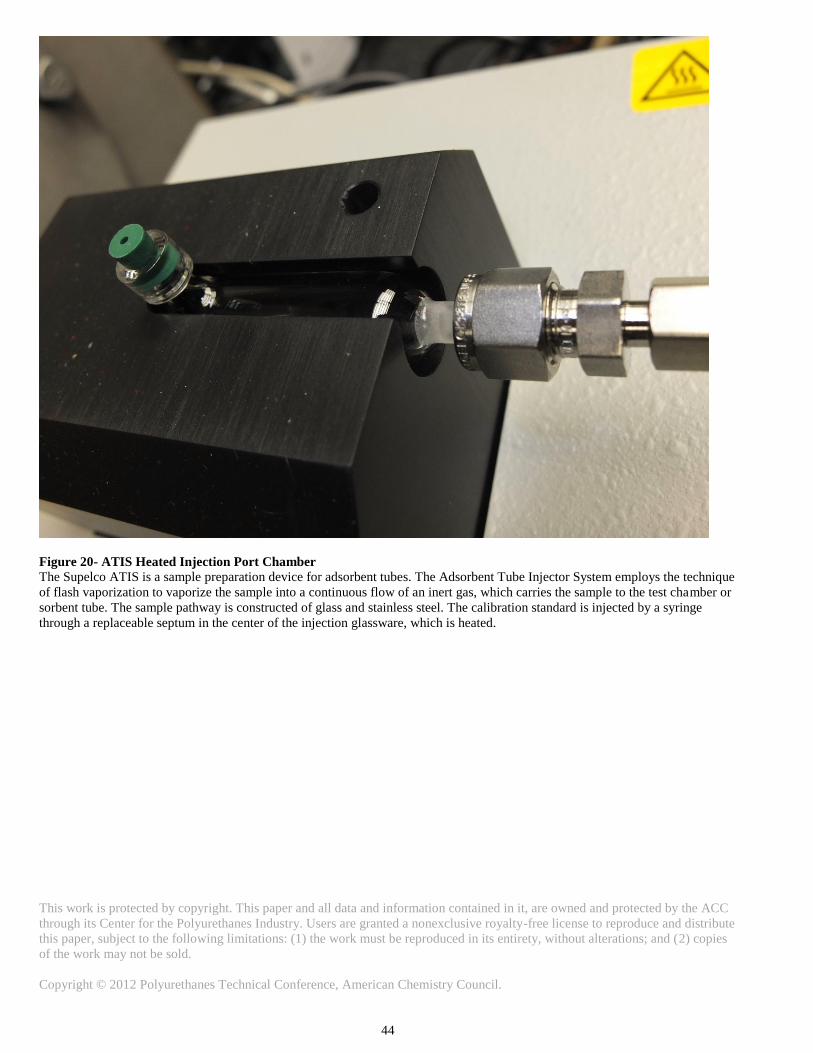
This work is protected by copyright. This paper and all data and information contained in it, are owned and protected by the ACC
through its Center for the Polyurethanes Industry. Users are granted a nonexclusive royalty-free license to reproduce and distribute
this paper, subject to the following limitations: (1) the work must be reproduced in its entirety, without alterations; and (2) copies
of the work may not be sold.
Copyright © 2012 Polyurethanes Technical Conference, American Chemistry Council.
44
Figure 20- ATIS Heated Injection Port Chamber
The Supelco ATIS is a sample preparation device for adsorbent tubes. The Adsorbent Tube Injector System employs the technique
of flash vaporization to vaporize the sample into a continuous flow of an inert gas, which carries the sample to the test chamber or
sorbent tube. The sample pathway is constructed of glass and stainless steel. The calibration standard is injected by a syringe
through a replaceable septum in the center of the injection glassware, which is heated.
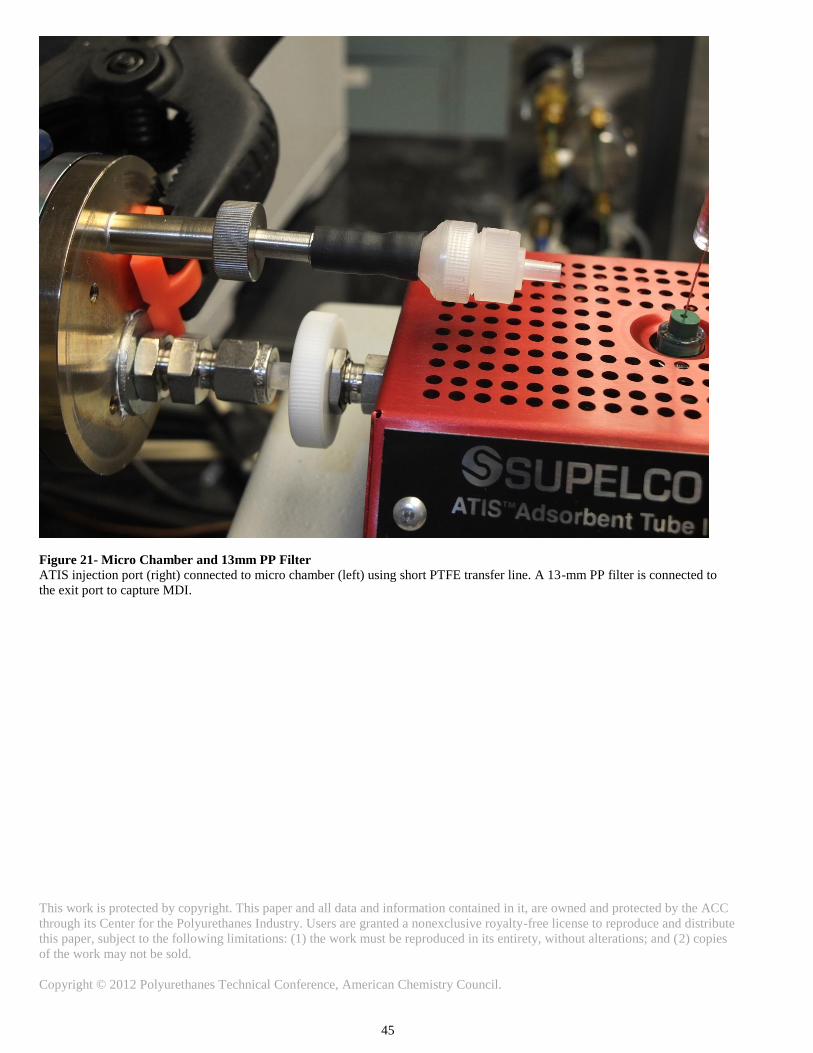
This work is protected by copyright. This paper and all data and information contained in it, are owned and protected by the ACC
through its Center for the Polyurethanes Industry. Users are granted a nonexclusive royalty-free license to reproduce and distribute
this paper, subject to the following limitations: (1) the work must be reproduced in its entirety, without alterations; and (2) copies
of the work may not be sold.
Copyright © 2012 Polyurethanes Technical Conference, American Chemistry Council.
45
Figure 21- Micro Chamber and 13mm PP Filter
ATIS injection port (right) connected to micro chamber (left) using short PTFE transfer line. A 13-mm PP filter is connected to
the exit port to capture MDI.
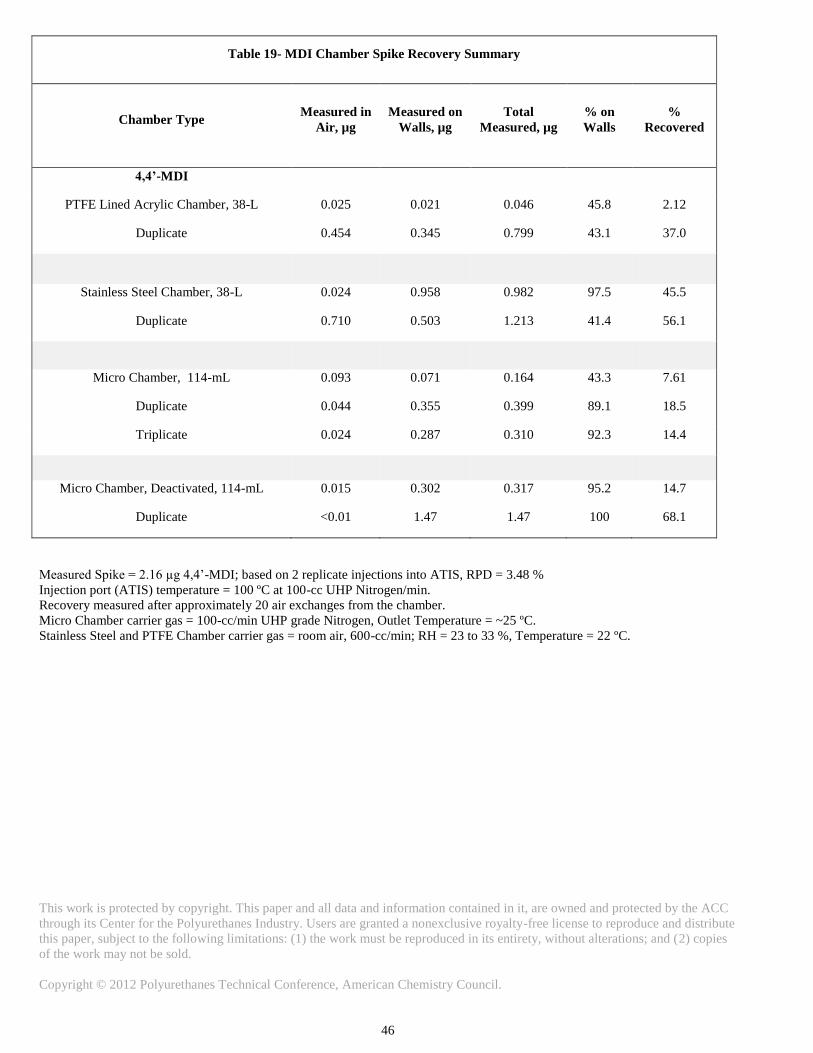
This work is protected by copyright. This paper and all data and information contained in it, are owned and protected by the ACC
through its Center for the Polyurethanes Industry. Users are granted a nonexclusive royalty-free license to reproduce and distribute
this paper, subject to the following limitations: (1) the work must be reproduced in its entirety, without alterations; and (2) copies
of the work may not be sold.
Copyright © 2012 Polyurethanes Technical Conference, American Chemistry Council.
46
Table 19- MDI Chamber Spike Recovery Summary
Chamber Type Measured in
Air, µg
Measured on
Walls, µg
Total
Measured, µg
% on
Walls
%
Recovered
4,4’-MDI
PTFE Lined Acrylic Chamber, 38-L 0.025 0.021 0.046 45.8 2.12
Duplicate 0.454 0.345 0.799 43.1 37.0
Stainless Steel Chamber, 38-L 0.024 0.958 0.982 97.5 45.5
Duplicate 0.710 0.503 1.213 41.4 56.1
Micro Chamber, 114-mL 0.093 0.071 0.164 43.3 7.61
Duplicate 0.044 0.355 0.399 89.1 18.5
Triplicate 0.024 0.287 0.310 92.3 14.4
Micro Chamber, Deactivated, 114-mL 0.015 0.302 0.317 95.2 14.7
Duplicate <0.01 1.47 1.47 100 68.1
Measured Spike = 2.16 µg 4,4’-MDI; based on 2 replicate injections into ATIS, RPD = 3.48 %
Injection port (ATIS) temperature = 100 ºC at 100-cc UHP Nitrogen/min.
Recovery measured after approximately 20 air exchanges from the chamber.
Micro Chamber carrier gas = 100-cc/min UHP grade Nitrogen, Outlet Temperature = ~25 ºC.
Stainless Steel and PTFE Chamber carrier gas = room air, 600-cc/min; RH = 23 to 33 %, Temperature = 22 ºC.
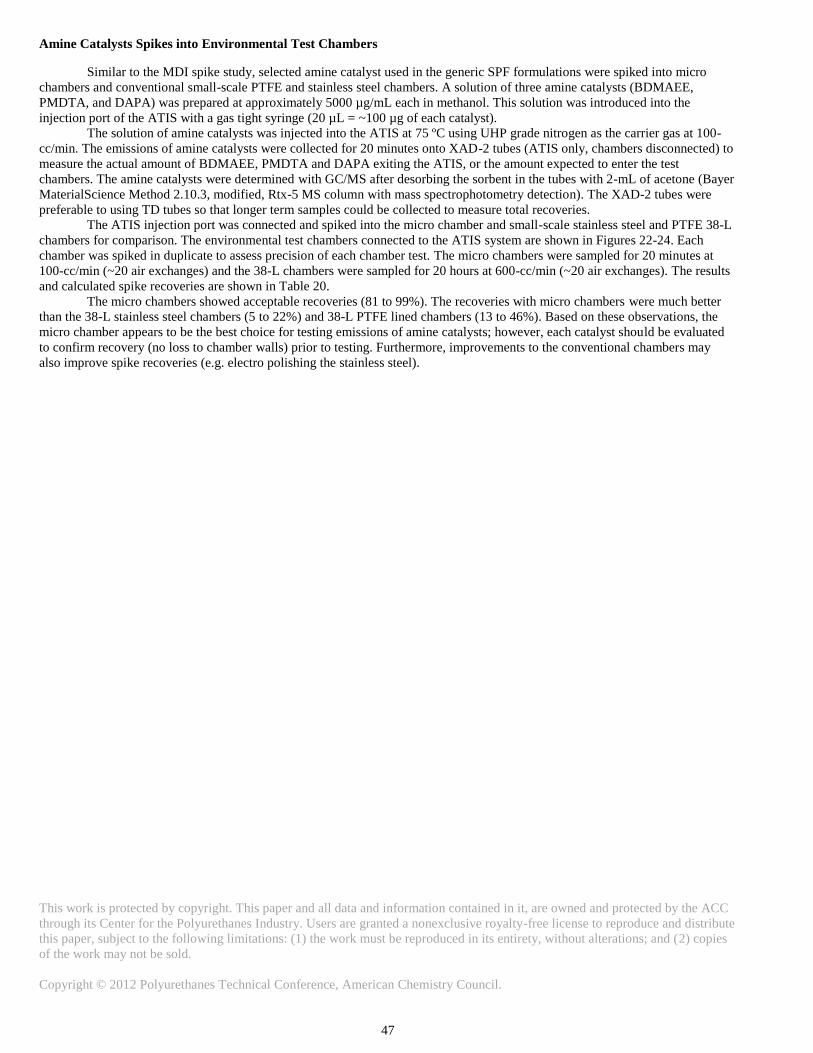
This work is protected by copyright. This paper and all data and information contained in it, are owned and protected by the ACC
through its Center for the Polyurethanes Industry. Users are granted a nonexclusive royalty-free license to reproduce and distribute
this paper, subject to the following limitations: (1) the work must be reproduced in its entirety, without alterations; and (2) copies
of the work may not be sold.
Copyright © 2012 Polyurethanes Technical Conference, American Chemistry Council.
47
Amine Catalysts Spikes into Environmental Test Chambers
Similar to the MDI spike study, selected amine catalyst used in the generic SPF formulations were spiked into micro
chambers and conventional small-scale PTFE and stainless steel chambers. A solution of three amine catalysts (BDMAEE,
PMDTA, and DAPA) was prepared at approximately 5000 µg/mL each in methanol. This solution was introduced into the
injection port of the ATIS with a gas tight syringe (20 µL = ~100 µg of each catalyst).
The solution of amine catalysts was injected into the ATIS at 75 ºC using UHP grade nitrogen as the carrier gas at 100-
cc/min. The emissions of amine catalysts were collected for 20 minutes onto XAD-2 tubes (ATIS only, chambers disconnected) to
measure the actual amount of BDMAEE, PMDTA and DAPA exiting the ATIS, or the amount expected to enter the test
chambers. The amine catalysts were determined with GC/MS after desorbing the sorbent in the tubes with 2-mL of acetone (Bayer
MaterialScience Method 2.10.3, modified, Rtx-5 MS column with mass spectrophotometry detection). The XAD-2 tubes were
preferable to using TD tubes so that longer term samples could be collected to measure total recoveries.
The ATIS injection port was connected and spiked into the micro chamber and small-scale stainless steel and PTFE 38-L
chambers for comparison. The environmental test chambers connected to the ATIS system are shown in Figures 22-24. Each
chamber was spiked in duplicate to assess precision of each chamber test. The micro chambers were sampled for 20 minutes at
100-cc/min (~20 air exchanges) and the 38-L chambers were sampled for 20 hours at 600-cc/min (~20 air exchanges). The results
and calculated spike recoveries are shown in Table 20.
The micro chambers showed acceptable recoveries (81 to 99%). The recoveries with micro chambers were much better
than the 38-L stainless steel chambers (5 to 22%) and 38-L PTFE lined chambers (13 to 46%). Based on these observations, the
micro chamber appears to be the best choice for testing emissions of amine catalysts; however, each catalyst should be evaluated
to confirm recovery (no loss to chamber walls) prior to testing. Furthermore, improvements to the conventional chambers may
also improve spike recoveries (e.g. electro polishing the stainless steel).
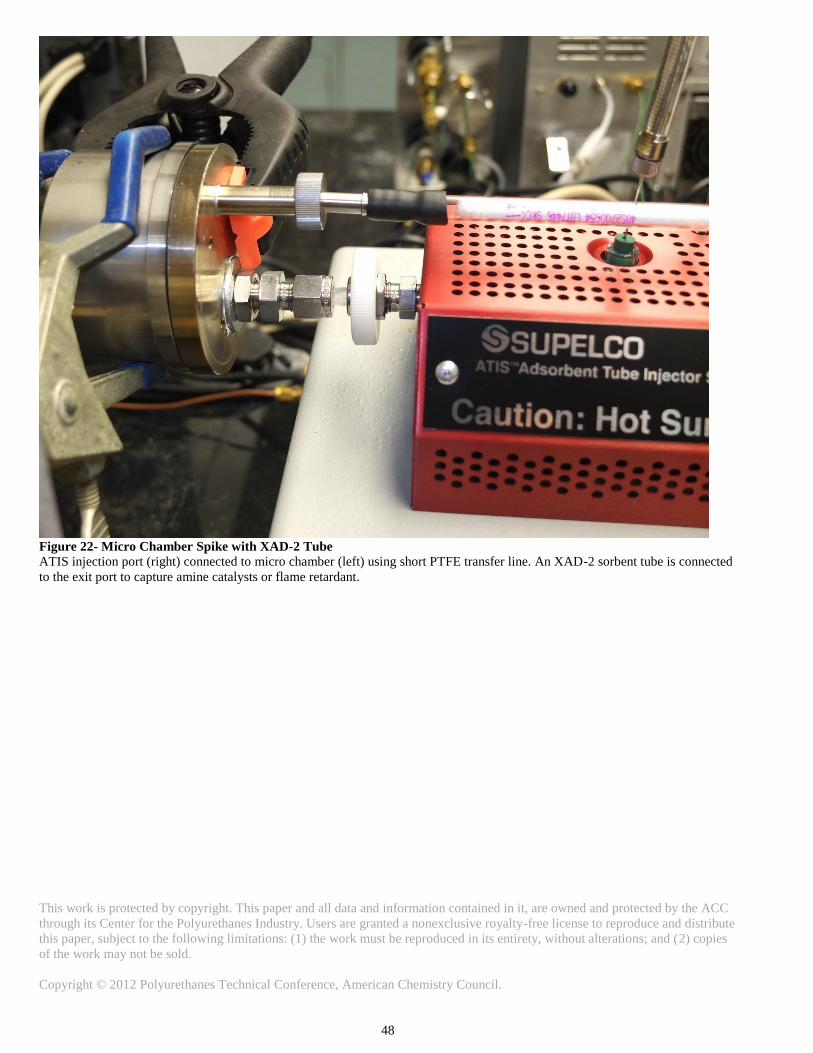
This work is protected by copyright. This paper and all data and information contained in it, are owned and protected by the ACC
through its Center for the Polyurethanes Industry. Users are granted a nonexclusive royalty-free license to reproduce and distribute
this paper, subject to the following limitations: (1) the work must be reproduced in its entirety, without alterations; and (2) copies
of the work may not be sold.
Copyright © 2012 Polyurethanes Technical Conference, American Chemistry Council.
48
Figure 22- Micro Chamber Spike with XAD-2 Tube
ATIS injection port (right) connected to micro chamber (left) using short PTFE transfer line. An XAD-2 sorbent tube is connected
to the exit port to capture amine catalysts or flame retardant.

This work is protected by copyright. This paper and all data and information contained in it, are owned and protected by the ACC
through its Center for the Polyurethanes Industry. Users are granted a nonexclusive royalty-free license to reproduce and distribute
this paper, subject to the following limitations: (1) the work must be reproduced in its entirety, without alterations; and (2) copies
of the work may not be sold.
Copyright © 2012 Polyurethanes Technical Conference, American Chemistry Council.
49
Figure 23- Stainless Steel Chamber Spike
ATIS injection port (right) connected to small-scale stainless steel chamber (left) using short PTFE transfer line. A small personal
sampling pump is used to pull chamber effluent through an XAD-2 sorbent tube to capture amine catalysts or flame retardant.
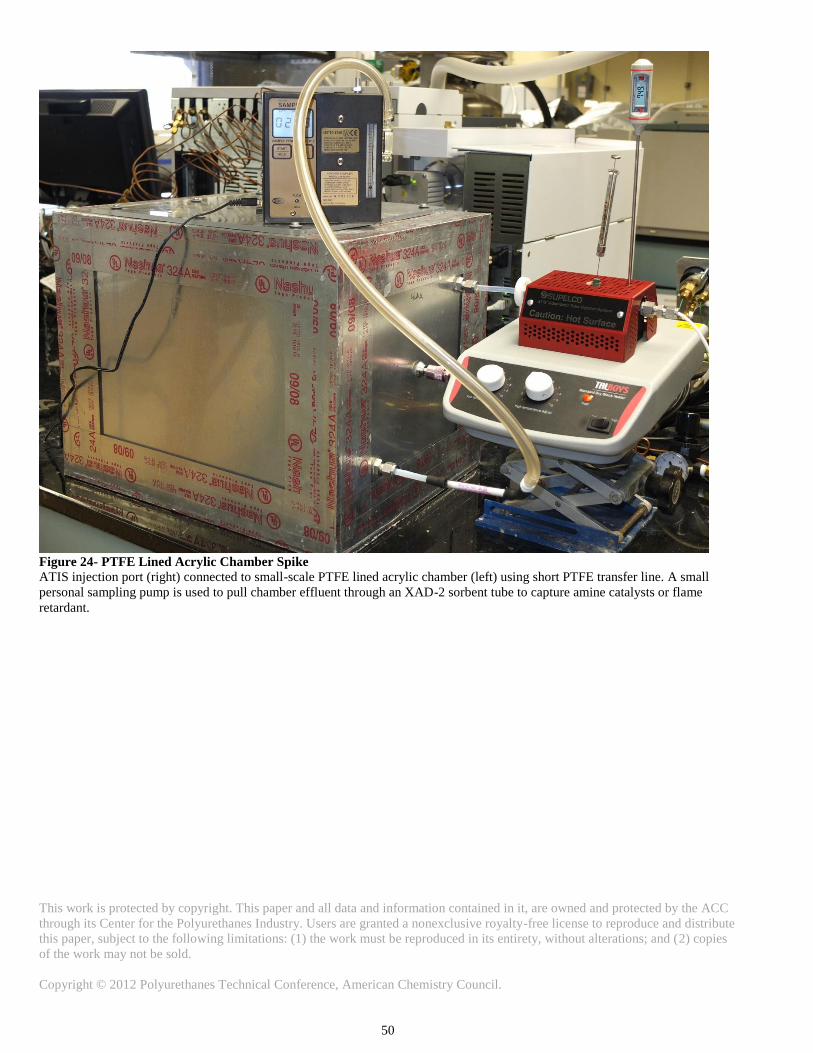
This work is protected by copyright. This paper and all data and information contained in it, are owned and protected by the ACC
through its Center for the Polyurethanes Industry. Users are granted a nonexclusive royalty-free license to reproduce and distribute
this paper, subject to the following limitations: (1) the work must be reproduced in its entirety, without alterations; and (2) copies
of the work may not be sold.
Copyright © 2012 Polyurethanes Technical Conference, American Chemistry Council.
50
Figure 24- PTFE Lined Acrylic Chamber Spike
ATIS injection port (right) connected to small-scale PTFE lined acrylic chamber (left) using short PTFE transfer line. A small
personal sampling pump is used to pull chamber effluent through an XAD-2 sorbent tube to capture amine catalysts or flame
retardant.
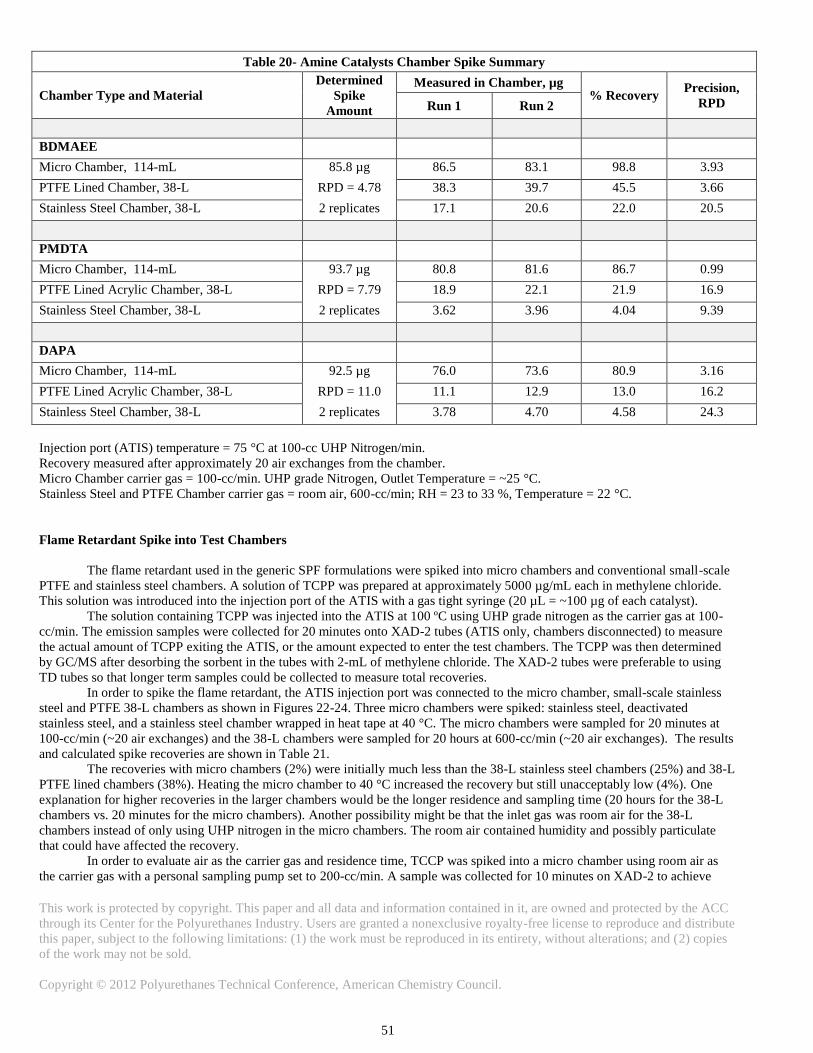
This work is protected by copyright. This paper and all data and information contained in it, are owned and protected by the ACC
through its Center for the Polyurethanes Industry. Users are granted a nonexclusive royalty-free license to reproduce and distribute
this paper, subject to the following limitations: (1) the work must be reproduced in its entirety, without alterations; and (2) copies
of the work may not be sold.
Copyright © 2012 Polyurethanes Technical Conference, American Chemistry Council.
51
Table 20- Amine Catalysts Chamber Spike Summary
Chamber Type and Material
Determined
Spike
Amount
Measured in Chamber, µg % Recovery
Precision,
RPD Run 1 Run 2
BDMAEE
Micro Chamber, 114-mL 85.8 µg 86.5 83.1 98.8 3.93
PTFE Lined Chamber, 38-L RPD = 4.78 38.3 39.7 45.5 3.66
Stainless Steel Chamber, 38-L 2 replicates 17.1 20.6 22.0 20.5
PMDTA
Micro Chamber, 114-mL 93.7 µg 80.8 81.6 86.7 0.99
PTFE Lined Acrylic Chamber, 38-L RPD = 7.79 18.9 22.1 21.9 16.9
Stainless Steel Chamber, 38-L 2 replicates 3.62 3.96 4.04 9.39
DAPA
Micro Chamber, 114-mL 92.5 µg 76.0 73.6 80.9 3.16
PTFE Lined Acrylic Chamber, 38-L RPD = 11.0 11.1 12.9 13.0 16.2
Stainless Steel Chamber, 38-L 2 replicates 3.78 4.70 4.58 24.3
Injection port (ATIS) temperature = 75 °C at 100-cc UHP Nitrogen/min.
Recovery measured after approximately 20 air exchanges from the chamber.
Micro Chamber carrier gas = 100-cc/min. UHP grade Nitrogen, Outlet Temperature = ~25 °C.
Stainless Steel and PTFE Chamber carrier gas = room air, 600-cc/min; RH = 23 to 33 %, Temperature = 22 °C.
Flame Retardant Spike into Test Chambers
The flame retardant used in the generic SPF formulations were spiked into micro chambers and conventional small-scale
PTFE and stainless steel chambers. A solution of TCPP was prepared at approximately 5000 µg/mL each in methylene chloride.
This solution was introduced into the injection port of the ATIS with a gas tight syringe (20 µL = ~100 µg of each catalyst).
The solution containing TCPP was injected into the ATIS at 100 ºC using UHP grade nitrogen as the carrier gas at 100-
cc/min. The emission samples were collected for 20 minutes onto XAD-2 tubes (ATIS only, chambers disconnected) to measure
the actual amount of TCPP exiting the ATIS, or the amount expected to enter the test chambers. The TCPP was then determined
by GC/MS after desorbing the sorbent in the tubes with 2-mL of methylene chloride. The XAD-2 tubes were preferable to using
TD tubes so that longer term samples could be collected to measure total recoveries.
In order to spike the flame retardant, the ATIS injection port was connected to the micro chamber, small-scale stainless
steel and PTFE 38-L chambers as shown in Figures 22-24. Three micro chambers were spiked: stainless steel, deactivated
stainless steel, and a stainless steel chamber wrapped in heat tape at 40 °C. The micro chambers were sampled for 20 minutes at
100-cc/min (~20 air exchanges) and the 38-L chambers were sampled for 20 hours at 600-cc/min (~20 air exchanges). The results
and calculated spike recoveries are shown in Table 21.
The recoveries with micro chambers (2%) were initially much less than the 38-L stainless steel chambers (25%) and 38-L
PTFE lined chambers (38%). Heating the micro chamber to 40 °C increased the recovery but still unacceptably low (4%). One
explanation for higher recoveries in the larger chambers would be the longer residence and sampling time (20 hours for the 38-L
chambers vs. 20 minutes for the micro chambers). Another possibility might be that the inlet gas was room air for the 38-L
chambers instead of only using UHP nitrogen in the micro chambers. The room air contained humidity and possibly particulate
that could have affected the recovery.
In order to evaluate air as the carrier gas and residence time, TCCP was spiked into a micro chamber using room air as
the carrier gas with a personal sampling pump set to 200-cc/min. A sample was collected for 10 minutes on XAD-2 to achieve
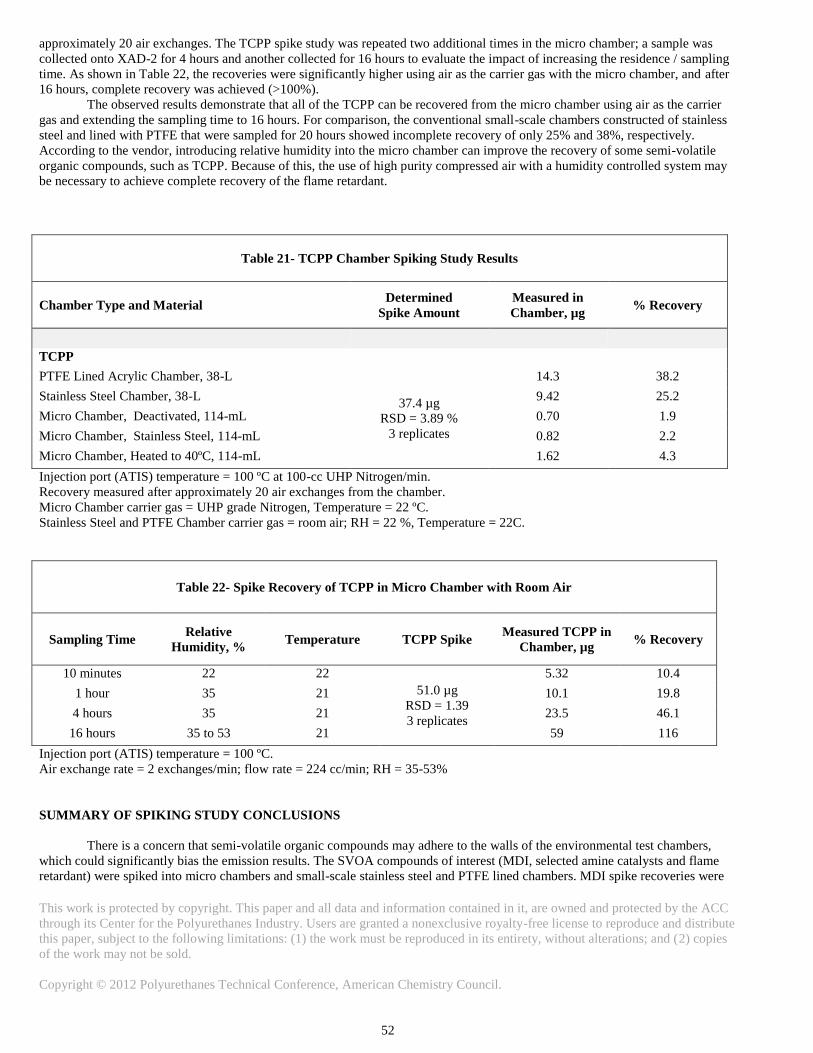
This work is protected by copyright. This paper and all data and information contained in it, are owned and protected by the ACC
through its Center for the Polyurethanes Industry. Users are granted a nonexclusive royalty-free license to reproduce and distribute
this paper, subject to the following limitations: (1) the work must be reproduced in its entirety, without alterations; and (2) copies
of the work may not be sold.
Copyright © 2012 Polyurethanes Technical Conference, American Chemistry Council.
52
approximately 20 air exchanges. The TCPP spike study was repeated two additional times in the micro chamber; a sample was
collected onto XAD-2 for 4 hours and another collected for 16 hours to evaluate the impact of increasing the residence / sampling
time. As shown in Table 22, the recoveries were significantly higher using air as the carrier gas with the micro chamber, and after
16 hours, complete recovery was achieved (>100%).
The observed results demonstrate that all of the TCPP can be recovered from the micro chamber using air as the carrier
gas and extending the sampling time to 16 hours. For comparison, the conventional small-scale chambers constructed of stainless
steel and lined with PTFE that were sampled for 20 hours showed incomplete recovery of only 25% and 38%, respectively.
According to the vendor, introducing relative humidity into the micro chamber can improve the recovery of some semi-volatile
organic compounds, such as TCPP. Because of this, the use of high purity compressed air with a humidity controlled system may
be necessary to achieve complete recovery of the flame retardant.
Table 21- TCPP Chamber Spiking Study Results
Chamber Type and Material Determined
Spike Amount
Measured in
Chamber, µg % Recovery
TCPP
PTFE Lined Acrylic Chamber, 38-L
37.4 µg
RSD = 3.89 %
3 replicates
14.3 38.2
Stainless Steel Chamber, 38-L 9.42 25.2
Micro Chamber, Deactivated, 114-mL 0.70 1.9
Micro Chamber, Stainless Steel, 114-mL 0.82 2.2
Micro Chamber, Heated to 40ºC, 114-mL 1.62 4.3
Injection port (ATIS) temperature = 100 ºC at 100-cc UHP Nitrogen/min.
Recovery measured after approximately 20 air exchanges from the chamber.
Micro Chamber carrier gas = UHP grade Nitrogen, Temperature = 22 ºC.
Stainless Steel and PTFE Chamber carrier gas = room air; RH = 22 %, Temperature = 22C.
Table 22- Spike Recovery of TCPP in Micro Chamber with Room Air
Sampling Time Relative
Humidity, % Temperature TCPP Spike
Measured TCPP in
Chamber, µg % Recovery
10 minutes 22 22
51.0 µg
RSD = 1.39
3 replicates
5.32 10.4
1 hour 35 21 10.1 19.8
4 hours 35 21 23.5 46.1
16 hours 35 to 53 21 59 116
Injection port (ATIS) temperature = 100 ºC.
Air exchange rate = 2 exchanges/min; flow rate = 224 cc/min; RH = 35-53%
SUMMARY OF SPIKING STUDY CONCLUSIONS
There is a concern that semi-volatile organic compounds may adhere to the walls of the environmental test chambers,
which could significantly bias the emission results. The SVOA compounds of interest (MDI, selected amine catalysts and flame
retardant) were spiked into micro chambers and small-scale stainless steel and PTFE lined chambers. MDI spike recoveries were

This work is protected by copyright. This paper and all data and information contained in it, are owned and protected by the ACC
through its Center for the Polyurethanes Industry. Users are granted a nonexclusive royalty-free license to reproduce and distribute
this paper, subject to the following limitations: (1) the work must be reproduced in its entirety, without alterations; and (2) copies
of the work may not be sold.
Copyright © 2012 Polyurethanes Technical Conference, American Chemistry Council.
53
not consistent and a significant percentage of the spiked MDI adhered to the chamber walls, regardless of the material and size of
the test chamber. Amine catalyst recoveries were significantly higher in the micro chamber; recoveries were poor with
conventional small scale chambers. The flame retardant was fully recovered in the micro chamber using air as the carrier gas
(containing humidity) with extended sampling time.
Summary of Recommendations for Future Work
This study showed proof of concept for using TD-GC/MS to analyze emissions from SPF samples. Further validation
will be required to standardize this procedure at ASTM and to assess the precision and bias of the method.
Spike recovery for amine catalysts and flame retardant were greatly improved using the micro chamber; however, further
optimization of the parameters will be required. For example, controlling relative humidity should be investigated. There should
also be an attempt to correlate the emissions observed with conventional small-scale chambers and micro-scale chambers. Small
scale chamber surfaces should also be evaluated to determine if spike recoveries can be improved (e.g. electro-polished surfaces).
MDI seems to “stick” to the surface of the chamber walls; therefore, a modified environmental test chamber may be
required to recover MDI emissions. There is currently research being planned by Markes International and the International
Isocyanate institute (III) to modify the micro chamber design to optimize MDI recovery. CPI may want to partner with them to
support this effort.
Environmental storage and shipping conditions may need to be investigated for SPF samples (e.g. temperature, relative
humidity, atmospheric pressure etc.). Further research will be necessary to evaluate the holding time of the low pressure kit
formulation since the observed emissions were not constant throughout the study. Conditioning samples for measuring low
concentrations of VOC compounds should be investigated for IAQ measurements.
This work is protected by copyright. This paper and all data and information contained in it, are owned and protected by the ACC
through its Center for the Polyurethanes Industry. Users are granted a nonexclusive royalty-free license to reproduce and distribute
this paper, subject to the following limitations: (1) the work must be reproduced in its entirety, without alterations; and (2) copies
of the work may not be sold.
Copyright © 2012 Polyurethanes Technical Conference, American Chemistry Council.
54
REFERENCED METHODS AND DOCUMENTS
ASTM, US EPA and Other Standards
ASTM D5116 - 10 Standard Guide for Small-Scale Environmental Chamber Determinations of Organic Emissions from Indoor
Materials/Products, 2010 ASTM International
ASTM D5197 - 09e1 Standard Test Method for Determination of Formaldehyde and Other Carbonyl Compounds in Air (Active
Sampler Methodology)
Method 8260B Volatile Organic Compounds by Gas Chromatography/Mass Spectrometry (GC/MS), SW-846, US EPA 1996
Organization for Economic Co-operation and Development (OECD) SIDS Tris(1-Chloro-2-propyl)phosphate, UNEP Publications
ASTM D7706 - 11 Standard Practice for Rapid Screening of VOC Emissions from Products Using Micro-Scale Chambers, 2011,
ASTM International
California Specification 01350, Standard Method for the Testing and Evaluation of Volatile Organic Chemical Emissions from
Indoor Sources Using Environmental Chambers, Version 1.1, February 2010
Conditional Test Method 036, Method for Measurement of Isocyanate Compounds in Stack Emissions, Technology Transfer
Network Emission Measurement Center, US EPA
Methylene bis(phenylisocyanate) (MDI), Method 47, Organic Methods Evaluation Branch, OSHA Analytical Laboratory, Salt
Lake City, Utah, March 1983
Bayer MaterialScience Methods1
Method SA-102 Analysis of Isocyanates (Liquid Chromatography, Diode Array/MSD/FLD)
Method 2.10.3 - Determination of Aliphatic Amine Catalysts in Air by Sampling with a XAD-2 Sorbent Tube and Analysis by
Capillary Gas Chromatography
Method No: 1.7.7 Determination of Airborne Methylene bis(phenylisocyanate) by Sampling on a
1-(2-pyridyl)piperazine/Diethylphthalate-Coated Glass-Fiber Filter and Analysis by High Performance Liquid Chromatography
1 Bayer MaterialScience methods are internal documents, which are proprietary. Similar methods are referenced when applicable.