research report on the biscuits and cookies industry in india
TRANSCRIPT
Biscuits and Cookies Industry in India 2015 - 2019
Picture Courtesy: www.info.wowlogistics.com
2
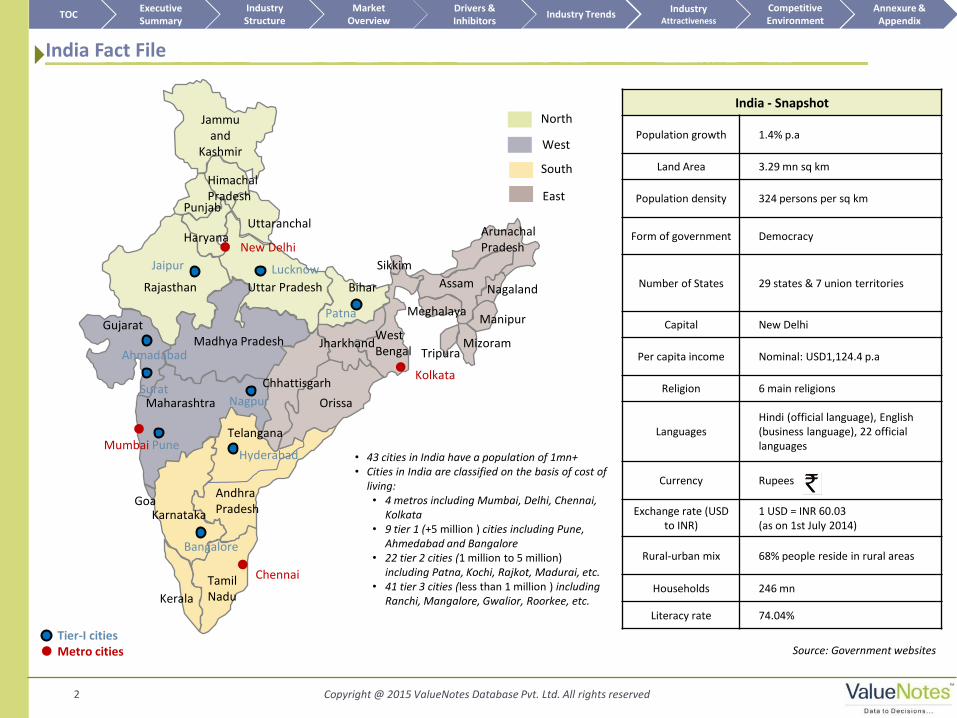
• 43 cities in India have a population of 1mn+ • Cities in India are classified on the basis of cost of
living: • 4 metros including Mumbai, Delhi, Chennai,
Kolkata • 9 tier 1 (+5 million ) cities including Pune,
Ahmedabad and Bangalore • 22 tier 2 cities (1 million to 5 million)
including Patna, Kochi, Rajkot, Madurai, etc. • 41 tier 3 cities (less than 1 million ) including
Ranchi, Mangalore, Gwalior, Roorkee, etc.
India - Snapshot
Population growth 1.4% p.a
Land Area 3.29 mn sq km
Population density 324 persons per sq km
Form of government Democracy
Number of States 29 states & 7 union territories
Capital New Delhi
Per capita income Nominal: USD1,124.4 p.a
Religion 6 main religions
Languages Hindi (official language), English (business language), 22 official languages
Currency Rupees
Exchange rate (USD to INR)
1 USD = INR 60.03 (as on 1st July 2014)
Rural-urban mix 68% people reside in rural areas
Households 246 mn
Literacy rate 74.04%
West
North
South
East
Source: Government websites Metro cities Tier-I cities
TOC Market
Overview Annexure &
Appendix Industry Trends
Competitive Environment
Industry Structure
Executive Summary
Drivers & Inhibitors
Industry Attractiveness
India Fact File
Copyright @ 2015 ValueNotes Database Pvt. Ltd. All rights reserved
Andhra Pradesh
Arunachal Pradesh
Assam Bihar
Chhattisgarh
Goa
Gujarat
Haryana
Himachal Pradesh
Jammu and
Kashmir
Jharkhand
Karnataka
Kerala
Madhya Pradesh
Maharashtra
Manipur Meghalaya
Mizoram
Nagaland
Orissa
Punjab
Rajasthan
Sikkim
Tamil Nadu
Tripura
Uttar Pradesh
Uttaranchal
West Bengal
Mumbai Pune Hyderabad
Bangalore
Jaipur
New Delhi
Kolkata
Chennai
Ahmadabad
Lucknow
Nagpur
Patna
Surat
Telangana
3 Copyright @ 2015 ValueNotes Database Pvt. Ltd. All rights reserved
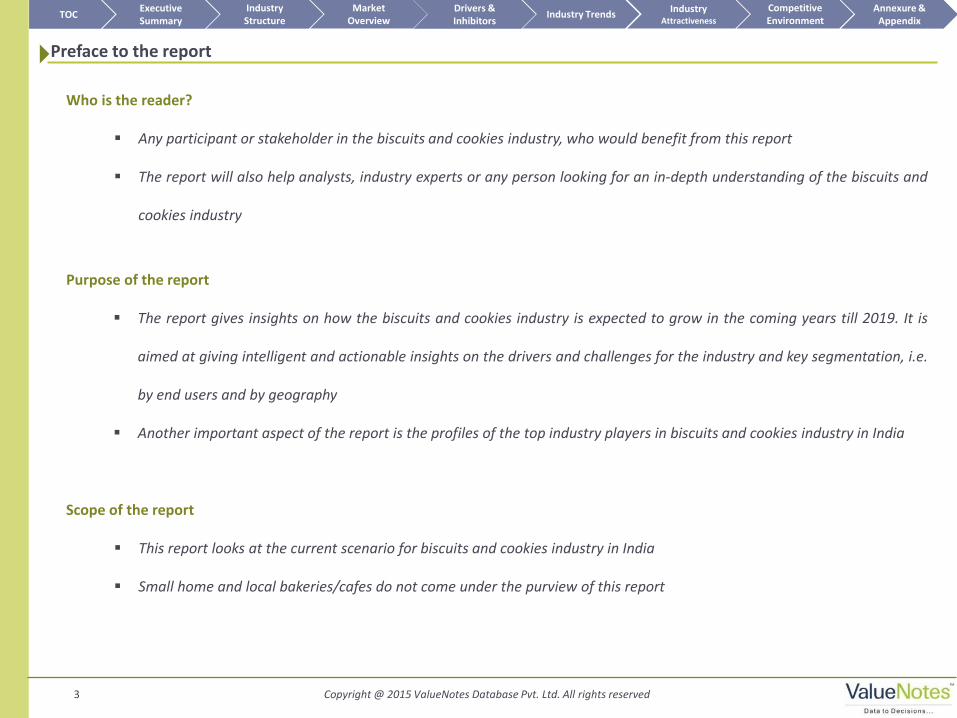
Who is the reader?
Any participant or stakeholder in the biscuits and cookies industry, who would benefit from this report
The report will also help analysts, industry experts or any person looking for an in-depth understanding of the biscuits and
cookies industry
Purpose of the report
The report gives insights on how the biscuits and cookies industry is expected to grow in the coming years till 2019. It is
aimed at giving intelligent and actionable insights on the drivers and challenges for the industry and key segmentation, i.e.
by end users and by geography
Another important aspect of the report is the profiles of the top industry players in biscuits and cookies industry in India
Scope of the report
This report looks at the current scenario for biscuits and cookies industry in India
Small home and local bakeries/cafes do not come under the purview of this report
Preface to the report
TOC Market
Overview Annexure &
Appendix Industry Trends
Competitive Environment
Industry Structure
Executive Summary
Drivers & Inhibitors
Industry Attractiveness
Copyright @ 2015 ValueNotes Database Pvt. Ltd. All rights reserved
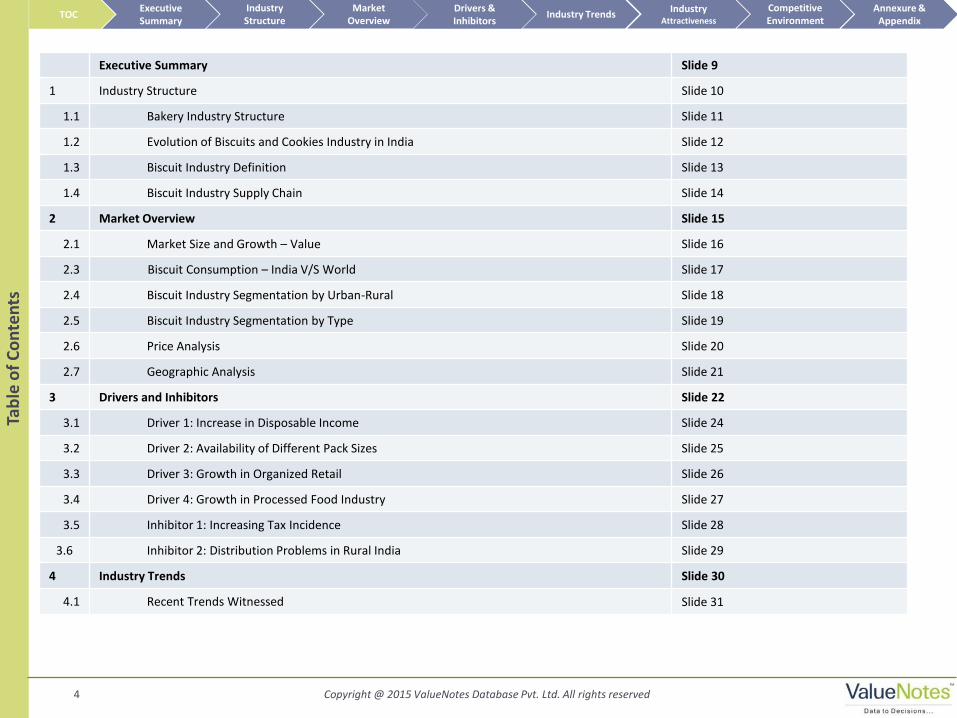
Executive Summary Slide 9
1 Industry Structure Slide 10
1.1 Bakery Industry Structure Slide 11
1.2 Evolution of Biscuits and Cookies Industry in India Slide 12
1.3 Biscuit Industry Definition Slide 13
1.4 Biscuit Industry Supply Chain Slide 14
2 Market Overview Slide 15
2.1 Market Size and Growth – Value Slide 16
2.3 Biscuit Consumption – India V/S World Slide 17
2.4 Biscuit Industry Segmentation by Urban-Rural Slide 18
2.5 Biscuit Industry Segmentation by Type Slide 19
2.6 Price Analysis Slide 20
2.7 Geographic Analysis Slide 21
3 Drivers and Inhibitors Slide 22
3.1 Driver 1: Increase in Disposable Income Slide 24
3.2 Driver 2: Availability of Different Pack Sizes Slide 25
3.3 Driver 3: Growth in Organized Retail Slide 26
3.4 Driver 4: Growth in Processed Food Industry Slide 27
3.5 Inhibitor 1: Increasing Tax Incidence Slide 28
3.6 Inhibitor 2: Distribution Problems in Rural India Slide 29
4 Industry Trends Slide 30
4.1 Recent Trends Witnessed Slide 31
4
Tab
le o
f C
on
ten
ts
TOC Market
Overview Annexure &
Appendix Industry Trends
Competitive Environment
Industry Structure
Executive Summary
Drivers & Inhibitors
Industry Attractiveness
Copyright @ 2015 ValueNotes Database Pvt. Ltd. All rights reserved
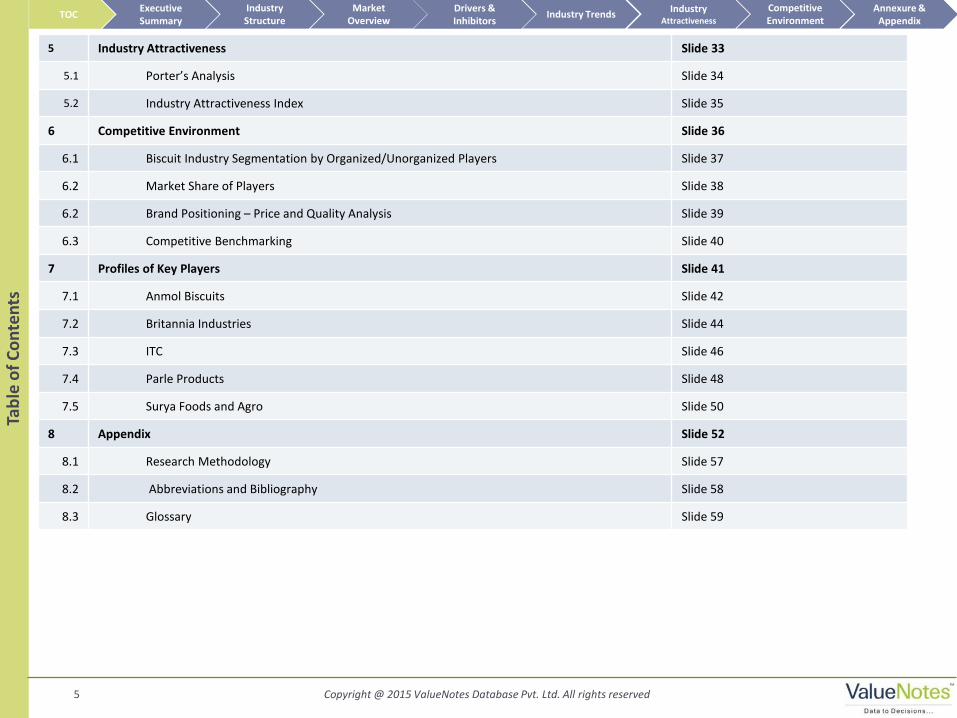
5 Industry Attractiveness Slide 33
5.1 Porter’s Analysis Slide 34
5.2 Industry Attractiveness Index Slide 35
6 Competitive Environment Slide 36
6.1 Biscuit Industry Segmentation by Organized/Unorganized Players Slide 37
6.2 Market Share of Players Slide 38
6.2 Brand Positioning – Price and Quality Analysis Slide 39
6.3 Competitive Benchmarking Slide 40
7 Profiles of Key Players Slide 41
7.1 Anmol Biscuits Slide 42
7.2 Britannia Industries Slide 44
7.3 ITC Slide 46
7.4 Parle Products Slide 48
7.5 Surya Foods and Agro Slide 50
8 Appendix Slide 52
8.1 Research Methodology Slide 57
8.2 Abbreviations and Bibliography Slide 58
8.3 Glossary Slide 59
5
Tab
le o
f C
on
ten
ts
TOC Market
Overview Annexure &
Appendix Industry Trends
Competitive Environment
Industry Structure
Executive Summary
Drivers & Inhibitors
Industry Attractiveness
Copyright @ 2015 ValueNotes Database Pvt. Ltd. All rights reserved 6
Tab
le o
f C
on
ten
ts |
Lis
t o
f C
har
ts &
Tab
les
TOC Market
Overview Annexure &
Appendix Industry Trends
Competitive Environment
Industry Structure
Executive Summary
Drivers & Inhibitors
Industry Attractiveness
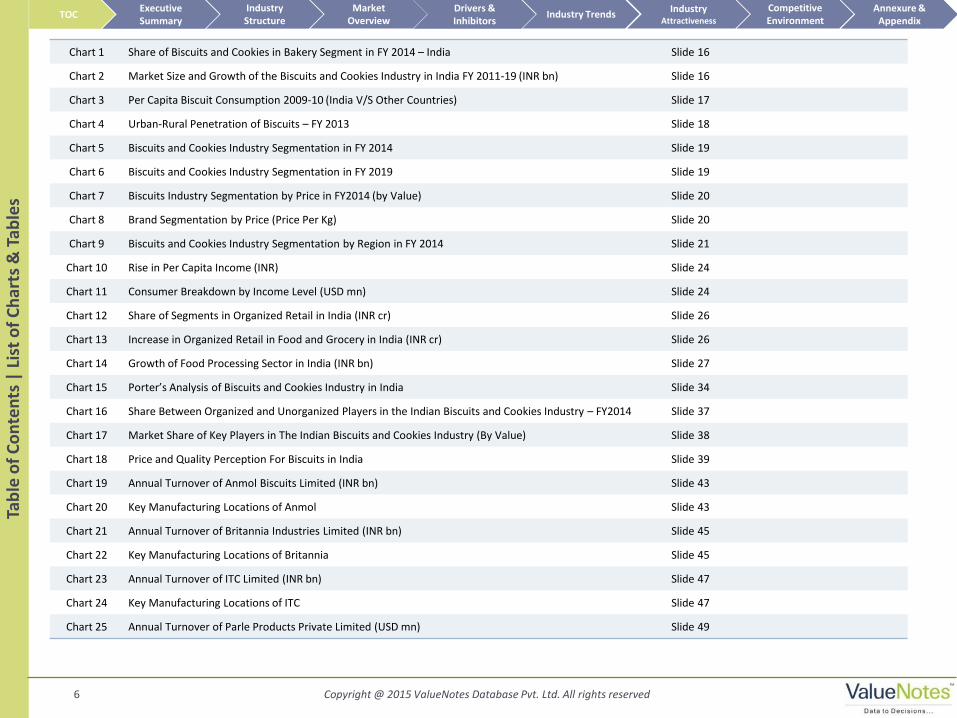
Chart 1 Share of Biscuits and Cookies in Bakery Segment in FY 2014 – India Slide 16
Chart 2 Market Size and Growth of the Biscuits and Cookies Industry in India FY 2011-19 (INR bn) Slide 16
Chart 3 Per Capita Biscuit Consumption 2009-10 (India V/S Other Countries) Slide 17
Chart 4 Urban-Rural Penetration of Biscuits – FY 2013 Slide 18
Chart 5 Biscuits and Cookies Industry Segmentation in FY 2014 Slide 19
Chart 6 Biscuits and Cookies Industry Segmentation in FY 2019 Slide 19
Chart 7 Biscuits Industry Segmentation by Price in FY2014 (by Value) Slide 20
Chart 8 Brand Segmentation by Price (Price Per Kg) Slide 20
Chart 9 Biscuits and Cookies Industry Segmentation by Region in FY 2014 Slide 21
Chart 10 Rise in Per Capita Income (INR) Slide 24
Chart 11 Consumer Breakdown by Income Level (USD mn) Slide 24
Chart 12 Share of Segments in Organized Retail in India (INR cr) Slide 26
Chart 13 Increase in Organized Retail in Food and Grocery in India (INR cr) Slide 26
Chart 14 Growth of Food Processing Sector in India (INR bn) Slide 27
Chart 15 Porter’s Analysis of Biscuits and Cookies Industry in India Slide 34
Chart 16 Share Between Organized and Unorganized Players in the Indian Biscuits and Cookies Industry – FY2014 Slide 37
Chart 17 Market Share of Key Players in The Indian Biscuits and Cookies Industry (By Value) Slide 38
Chart 18 Price and Quality Perception For Biscuits in India Slide 39
Chart 19 Annual Turnover of Anmol Biscuits Limited (INR bn) Slide 43
Chart 20 Key Manufacturing Locations of Anmol Slide 43
Chart 21 Annual Turnover of Britannia Industries Limited (INR bn) Slide 45
Chart 22 Key Manufacturing Locations of Britannia Slide 45
Chart 23 Annual Turnover of ITC Limited (INR bn) Slide 47
Chart 24 Key Manufacturing Locations of ITC Slide 47
Chart 25 Annual Turnover of Parle Products Private Limited (USD mn) Slide 49
Copyright @ 2015 ValueNotes Database Pvt. Ltd. All rights reserved 7
Tab
le o
f C
on
ten
ts |
Lis
t o
f C
har
ts &
Tab
les
TOC Market
Overview Annexure &
Appendix Industry Trends
Competitive Environment
Industry Structure
Executive Summary
Drivers & Inhibitors
Industry Attractiveness
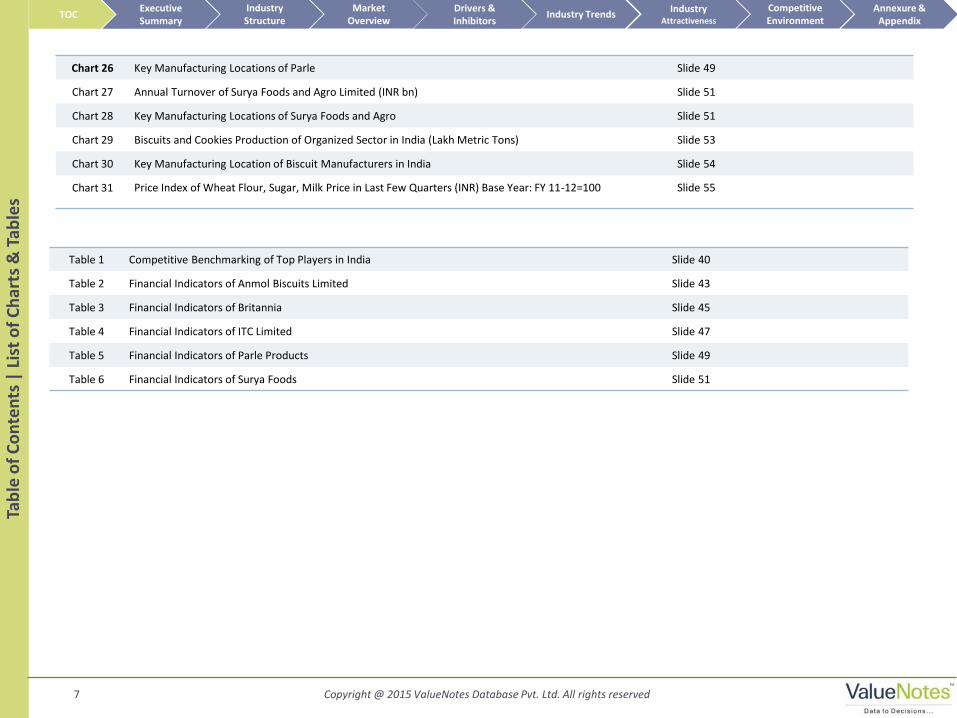
Table 1 Competitive Benchmarking of Top Players in India Slide 40
Table 2 Financial Indicators of Anmol Biscuits Limited Slide 43
Table 3 Financial Indicators of Britannia Slide 45
Table 4 Financial Indicators of ITC Limited Slide 47
Table 5 Financial Indicators of Parle Products Slide 49
Table 6 Financial Indicators of Surya Foods Slide 51
Chart 26 Key Manufacturing Locations of Parle Slide 49
Chart 27 Annual Turnover of Surya Foods and Agro Limited (INR bn) Slide 51
Chart 28 Key Manufacturing Locations of Surya Foods and Agro Slide 51
Chart 29 Biscuits and Cookies Production of Organized Sector in India (Lakh Metric Tons) Slide 53
Chart 30 Key Manufacturing Location of Biscuit Manufacturers in India Slide 54
Chart 31 Price Index of Wheat Flour, Sugar, Milk Price in Last Few Quarters (INR) Base Year: FY 11-12=100 Slide 55
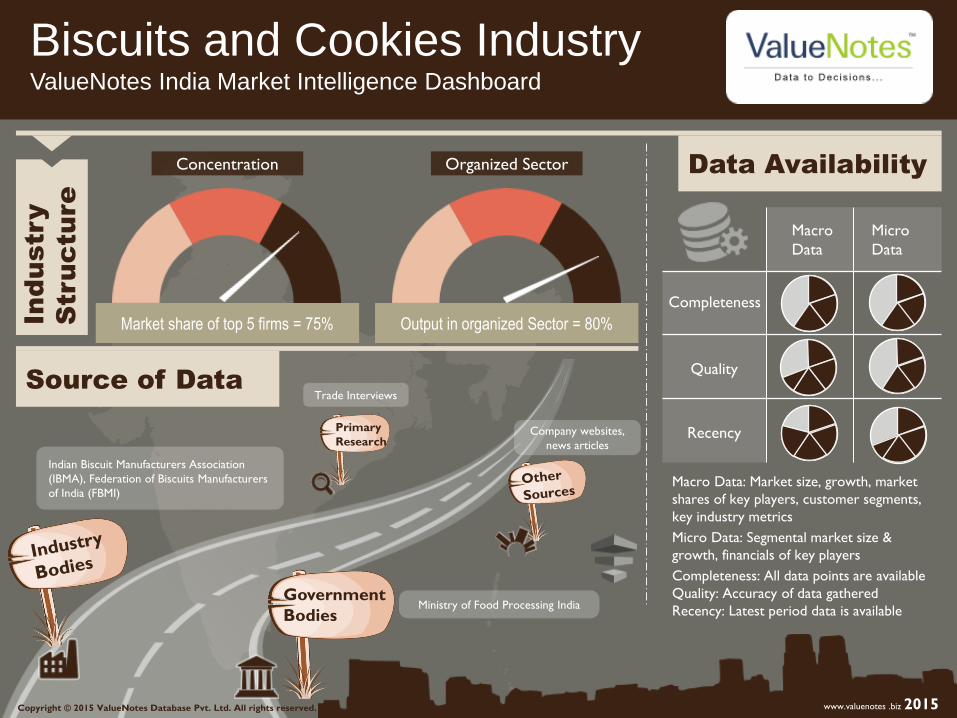
Biscuits and Cookies Industry ValueNotes India Market Intelligence Dashboard
Market share of top 5 firms = 75% Output in organized Sector = 80%
Organized Sector Concentration
Macro Data: Market size, growth, market
shares of key players, customer segments,
key industry metrics
Micro Data: Segmental market size &
growth, financials of key players
Completeness: All data points are available
Quality: Accuracy of data gathered
Recency: Latest period data is available
Source of Data
Data Availability
In
du
stry
Stru
cture
Ministry of Food Processing India
Company websites,
news articles
Indian Biscuit Manufacturers Association
(IBMA), Federation of Biscuits Manufacturers
of India (FBMI)
Copyright © 2015 ValueNotes Database Pvt. Ltd. All rights reserved. www.valuenotes .biz 2015
Government
Bodies
Primary
Research
Trade Interviews
Completeness
Quality
Recency
Macro
Data
Micro
Data
Market Size and Growth
Industry Segmentation
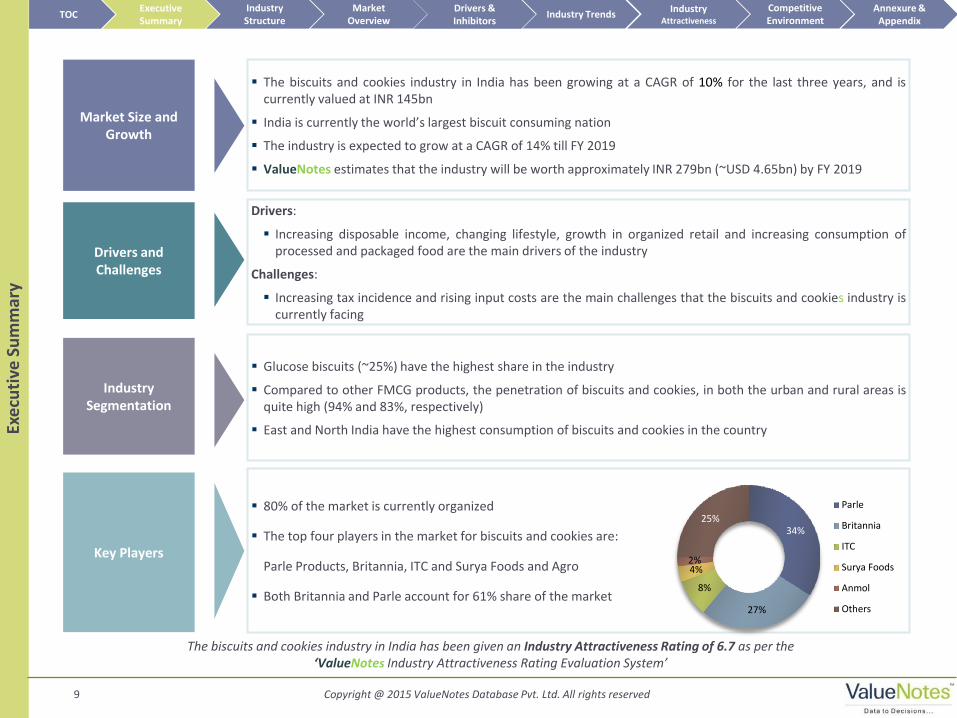
The biscuits and cookies industry in India has been growing at a CAGR of 10% for the last three years, and is currently valued at INR 145bn
India is currently the world’s largest biscuit consuming nation
The industry is expected to grow at a CAGR of 14% till FY 2019
ValueNotes estimates that the industry will be worth approximately INR 279bn (~USD 4.65bn) by FY 2019
Glucose biscuits (~25%) have the highest share in the industry
Compared to other FMCG products, the penetration of biscuits and cookies, in both the urban and rural areas is quite high (94% and 83%, respectively)
East and North India have the highest consumption of biscuits and cookies in the country
Key Players
80% of the market is currently organized
The top four players in the market for biscuits and cookies are:
Parle Products, Britannia, ITC and Surya Foods and Agro
Both Britannia and Parle account for 61% share of the market
9 Copyright @ 2015 ValueNotes Database Pvt. Ltd. All rights reserved
Exe
cuti
ve S
um
mar
y
The biscuits and cookies industry in India has been given an Industry Attractiveness Rating of 6.7 as per the ‘ValueNotes Industry Attractiveness Rating Evaluation System’
Drivers and Challenges
Drivers:
Increasing disposable income, changing lifestyle, growth in organized retail and increasing consumption of processed and packaged food are the main drivers of the industry
Challenges:
Increasing tax incidence and rising input costs are the main challenges that the biscuits and cookies industry is currently facing
TOC Market
Overview Annexure &
Appendix Industry Trends
Competitive Environment
Industry Structure
Executive Summary
Drivers & Inhibitors
Industry Attractiveness
34%
27%
8%
4% 2%
25%
Parle
Britannia
ITC
Surya Foods
Anmol
Others
Industry Structure
Picture Courtesy: Daifuku
Insert appropriate picture
11 Copyright @ 2015 ValueNotes Database Pvt. Ltd. All rights reserved
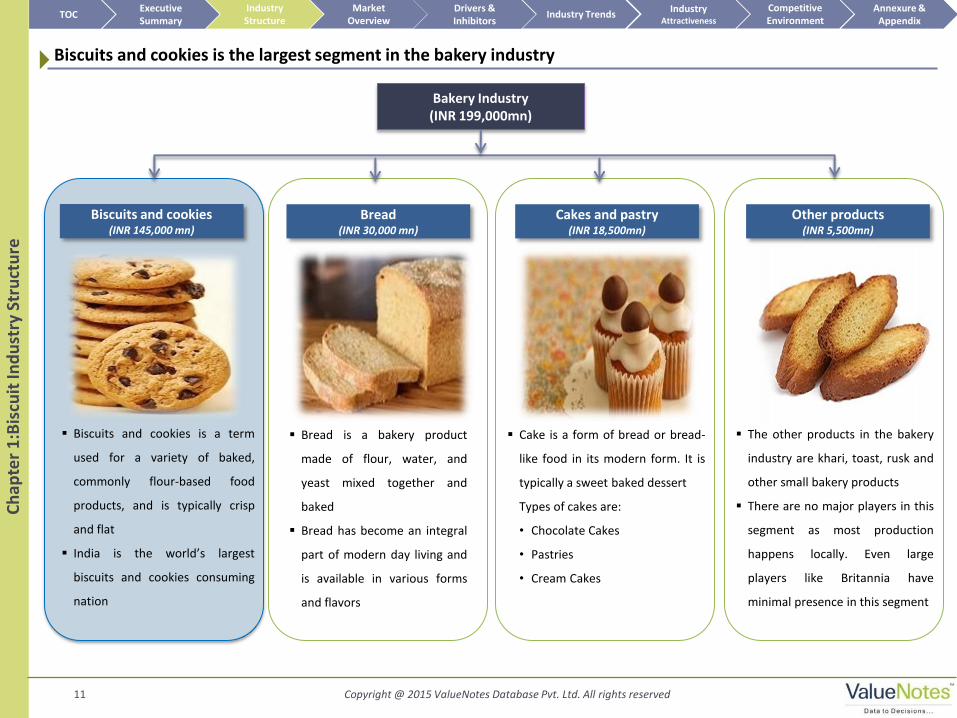
Biscuits and cookies is the largest segment in the bakery industry
Ch
apte
r 1
:Bis
cuit
Ind
ust
ry S
tru
ctu
re
Bread is a bakery product
made of flour, water, and
yeast mixed together and
baked
Bread has become an integral
part of modern day living and
is available in various forms
and flavors
Cake is a form of bread or bread-
like food in its modern form. It is
typically a sweet baked dessert
Types of cakes are:
• Chocolate Cakes
• Pastries
• Cream Cakes
Bakery Industry (INR 199,000mn)
Biscuits and cookies (INR 145,000 mn)
Bread (INR 30,000 mn)
Cakes and pastry (INR 18,500mn)
Other products (INR 5,500mn)
The other products in the bakery
industry are khari, toast, rusk and
other small bakery products
There are no major players in this
segment as most production
happens locally. Even large
players like Britannia have
minimal presence in this segment
Biscuits and cookies is a term
used for a variety of baked,
commonly flour-based food
products, and is typically crisp
and flat
India is the world’s largest
biscuits and cookies consuming
nation
TOC Market
Overview Annexure &
Appendix Industry Trends
Competitive Environment
Industry Structure
Executive Summary
Drivers & Inhibitors
Industry Attractiveness
Copyright @ 2015 ValueNotes Database Pvt. Ltd. All rights reserved 12
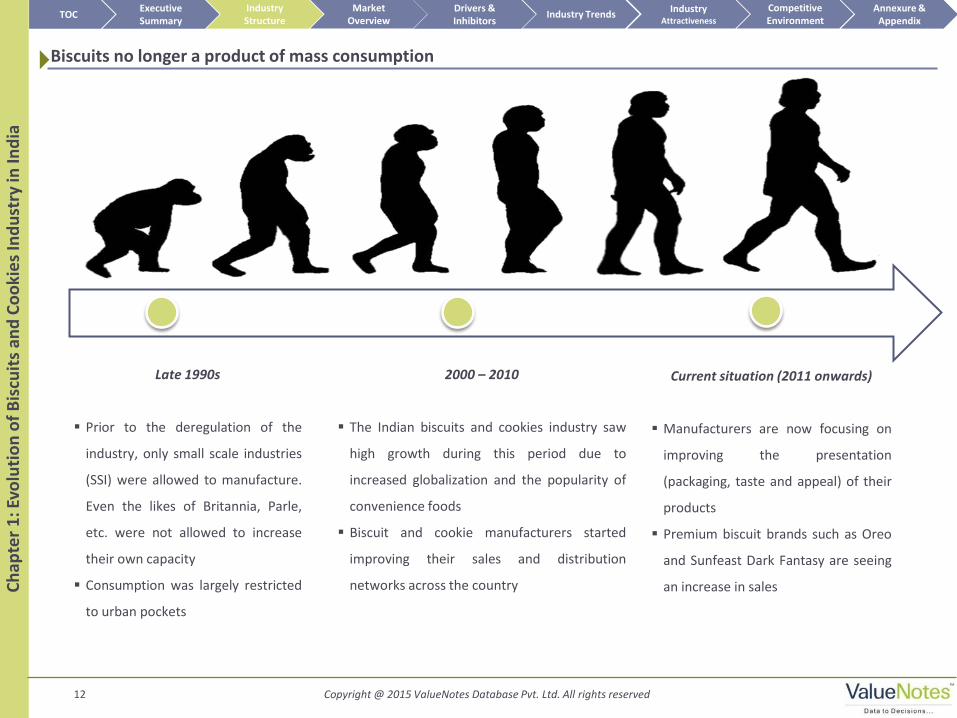
Biscuits no longer a product of mass consumption
Late 1990s
Prior to the deregulation of the
industry, only small scale industries
(SSI) were allowed to manufacture.
Even the likes of Britannia, Parle,
etc. were not allowed to increase
their own capacity
Consumption was largely restricted
to urban pockets
2000 – 2010
The Indian biscuits and cookies industry saw
high growth during this period due to
increased globalization and the popularity of
convenience foods
Biscuit and cookie manufacturers started
improving their sales and distribution
networks across the country
Current situation (2011 onwards)
Manufacturers are now focusing on
improving the presentation
(packaging, taste and appeal) of their
products
Premium biscuit brands such as Oreo
and Sunfeast Dark Fantasy are seeing
an increase in sales Ch
apte
r 1
: Evo
luti
on
of
Bis
cuit
s an
d C
oo
kie
s In
du
stry
in In
dia
TOC
Market Overview
Annexure & Appendix
Industry Trends Competitive Environment
Industry Structure
Executive Summary
Drivers & Inhibitors
Industry Attractiveness
Copyright @ 2015 ValueNotes Database Pvt. Ltd. All rights reserved 13
Biscuits is a term used for a variety of baked, commonly flour-based food products
The types of biscuits based on ingredients are:
• Glucose: Small and rectangular flat-baked sweet biscuit
• Crackers: Thin crisp wafer or biscuit, usually made of unsweetened dough
• Milk: Biscuits with milk as the key ingredient
• Marie: Sweet round biscuit with its name embossed on its top surface; the edges embossed with an intricate design. Marie biscuits are
less sweet when compared to glucose biscuits
• Cream: Biscuits with a creamy filling
• Cookies: Small cake made from stiff, sweet dough rolled and sliced or dropped by spoonfuls on a large, flat pan (cookie sheet) and baked
This report covers:
• The organized sector of biscuits industry in India – which includes
private and public manufacturers registered with the India Biscuit
Manufacturers Association (IBMA) and Federation of Biscuit
Manufacturer of India (FBMI)
This report does not cover:
• Small home and local bakeries owned by individuals
Definition of biscuits and cookies
Ch
apte
r 1
: Def
init
ion
of
Bis
cuit
s an
d C
oo
kie
s TOC
Market Overview
Annexure & Appendix
Industry Trends Competitive Environment
Industry Structure
Executive Summary
Drivers & Inhibitors
Industry Attractiveness
14 Copyright @ 2015 ValueNotes Database Pvt. Ltd. All rights reserved
Ch
apte
r 1
: In
du
stry
Su
pp
ly C
hai
n
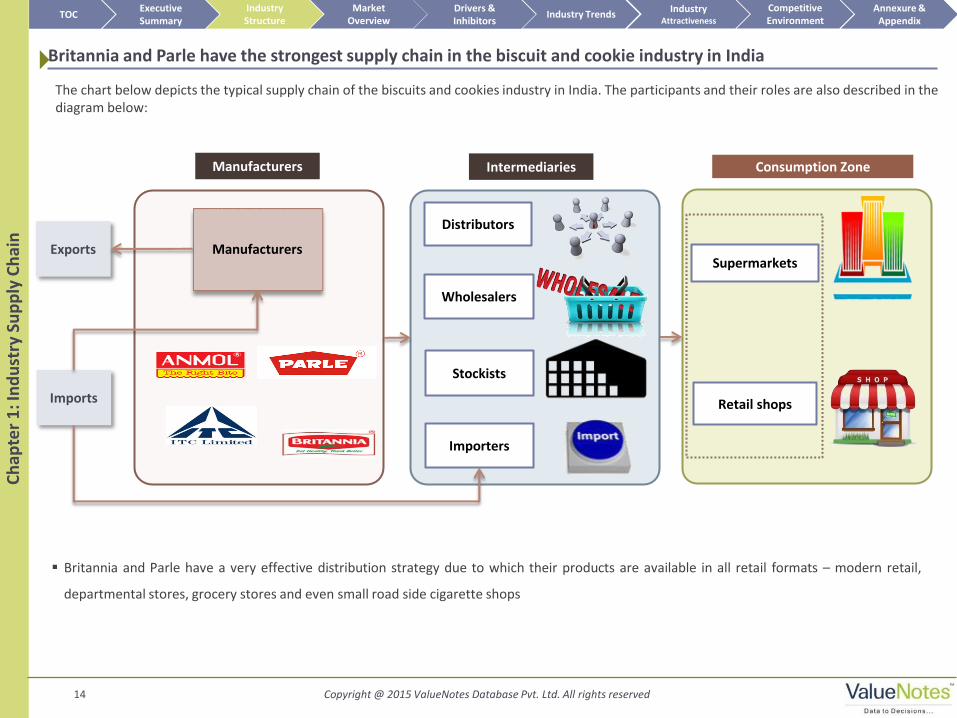
Britannia and Parle have the strongest supply chain in the biscuit and cookie industry in India
The chart below depicts the typical supply chain of the biscuits and cookies industry in India. The participants and their roles are also described in the diagram below:
Britannia and Parle have a very effective distribution strategy due to which their products are available in all retail formats – modern retail,
departmental stores, grocery stores and even small road side cigarette shops
Consumption Zone
Manufacturers
Manufacturers
Supermarkets
Retail shops
Intermediaries
Stockists
Distributors
Wholesalers
Exports
Importers
Imports
TOC Market
Overview Annexure &
Appendix Industry Trends
Competitive Environment
Industry Structure
Executive Summary
Drivers & Inhibitors
Industry Attractiveness

Market Overview
xx xx
xx xx
xx
xx
xx
xx
xx
xx
xx
xx
xx
xx
xx
xx
xx
xx
xx
FY 2011 FY 2012 FY 2013 FY 2014 FY 2015 (E)FY 2016 (E)FY 2017 (E)FY 2018 (E)FY 2019 (E)
Likely Pessimistic Optimistic
CAGR xx%
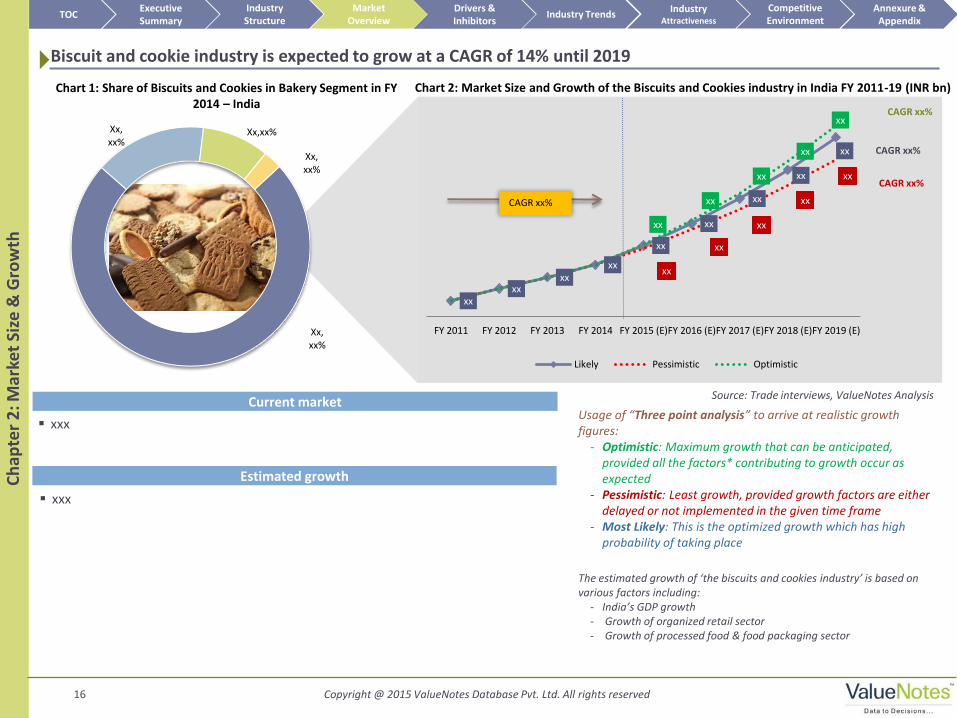
xxx Usage of “Three point analysis” to arrive at realistic growth figures:
- Optimistic: Maximum growth that can be anticipated, provided all the factors* contributing to growth occur as expected
- Pessimistic: Least growth, provided growth factors are either delayed or not implemented in the given time frame
- Most Likely: This is the optimized growth which has high probability of taking place
16 Copyright @ 2015 ValueNotes Database Pvt. Ltd. All rights reserved
Chart 2: Market Size and Growth of the Biscuits and Cookies industry in India FY 2011-19 (INR bn)
The estimated growth of ‘the biscuits and cookies industry’ is based on various factors including:
- India’s GDP growth - Growth of organized retail sector - Growth of processed food & food packaging sector
Source: Trade interviews, ValueNotes Analysis Current market
Estimated growth Ch
apte
r 2
: Mar
ket
Size
& G
row
th
Chart 1: Share of Biscuits and Cookies in Bakery Segment in FY 2014 – India
Biscuit and cookie industry is expected to grow at a CAGR of 14% until 2019
xxx
Industry Attractiveness
CAGR xx%
CAGR xx%
CAGR xx%
TOC Market
Overview Annexure &
Appendix Industry Trends
Competitive Environment
Industry Structure
Executive Summary
Drivers & Inhibitors
Industry Attractiveness
Xx, xx%
Xx, xx%
Xx,xx%
Xx, xx%

xx
xx xx
xx xx xx
xx xx
xx xx
Ireland Netherland UK Italy Belgium Switzerland USA Japan India China
Per Capita Consumption (Kgs)
17 Copyright @ 2015 ValueNotes Database Pvt. Ltd. All rights reserved
Per capita consumption of biscuits is one of the lowest in India
Ch
apte
r 2
: Bis
cuit
Co
nsu
mp
tio
n –
Ind
ia v
/s W
orl
d
Chart 3: Per Capita Biscuit Consumption 2009-10 (India V/S Other Countries)
xx
TOC Market
Overview Annexure &
Appendix Industry Trends
Competitive Environment
Industry Structure
Executive Summary
Drivers & Inhibitors
Industry Attractiveness
Source: FnB News, Indian Mirror
Glucose xx%
Cream xx%
Crackers xx%
Marie xx%
Milk xx%
Others xx%
Copyright @ 2015 ValueNotes Database Pvt. Ltd. All rights reserved 18
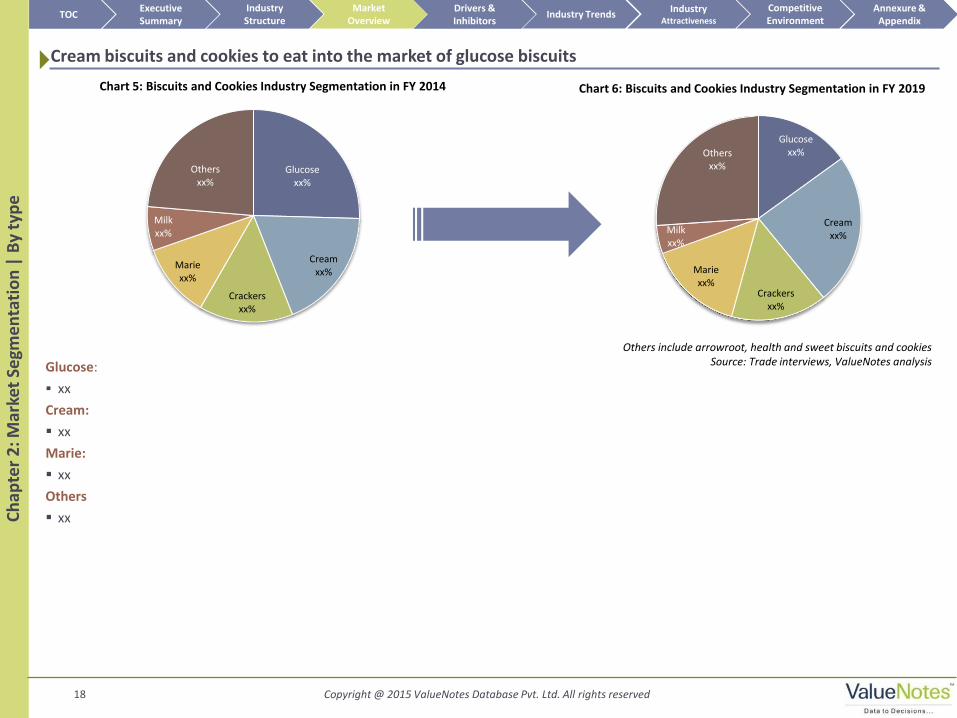
Chart 5: Biscuits and Cookies Industry Segmentation in FY 2014 Chart 6: Biscuits and Cookies Industry Segmentation in FY 2019
Cream biscuits and cookies to eat into the market of glucose biscuits
Ch
apte
r 2
: Mar
ket
Segm
en
tati
on
| B
y ty
pe
Glucose:
xx
Cream:
xx
Marie:
xx
Others
xx
TOC Market
Overview Annexure &
Appendix Industry Trends
Competitive Environment
Industry Structure
Executive Summary
Drivers & Inhibitors
Industry Attractiveness
Others include arrowroot, health and sweet biscuits and cookies Source: Trade interviews, ValueNotes analysis
Glucose xx%
Cream xx%
Crackers xx%
Marie xx%
Milk xx%
Others xx%
12.6
14.3
16.1 16.9
17.5 18.5
19.1 20.5 21
2005 2006 2007 2008 2009 2010 2011 2012 2013
19 Copyright @ 2015 ValueNotes Database Pvt. Ltd. All rights reserved
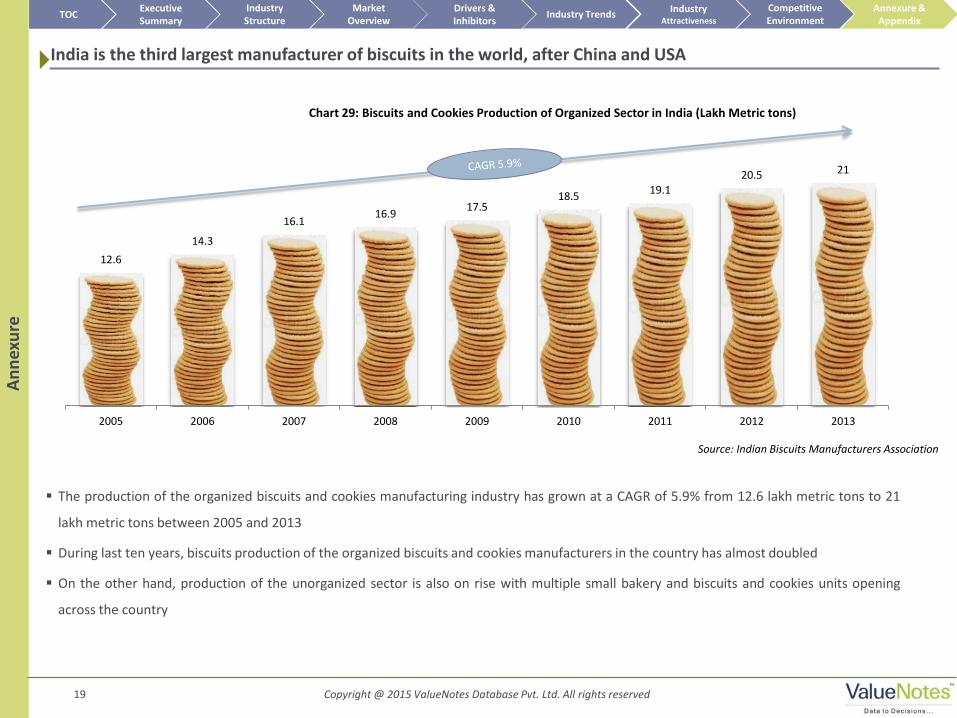
India is the third largest manufacturer of biscuits in the world, after China and USA
The production of the organized biscuits and cookies manufacturing industry has grown at a CAGR of 5.9% from 12.6 lakh metric tons to 21
lakh metric tons between 2005 and 2013
During last ten years, biscuits production of the organized biscuits and cookies manufacturers in the country has almost doubled
On the other hand, production of the unorganized sector is also on rise with multiple small bakery and biscuits and cookies units opening
across the country
Chart 29: Biscuits and Cookies Production of Organized Sector in India (Lakh Metric tons)
Source: Indian Biscuits Manufacturers Association
An
nex
ure
TOC
Market Overview
Annexure & Appendix
Industry Trends Competitive Environment
Industry Structure
Executive Summary
Drivers & Inhibitors
Industry Attractiveness
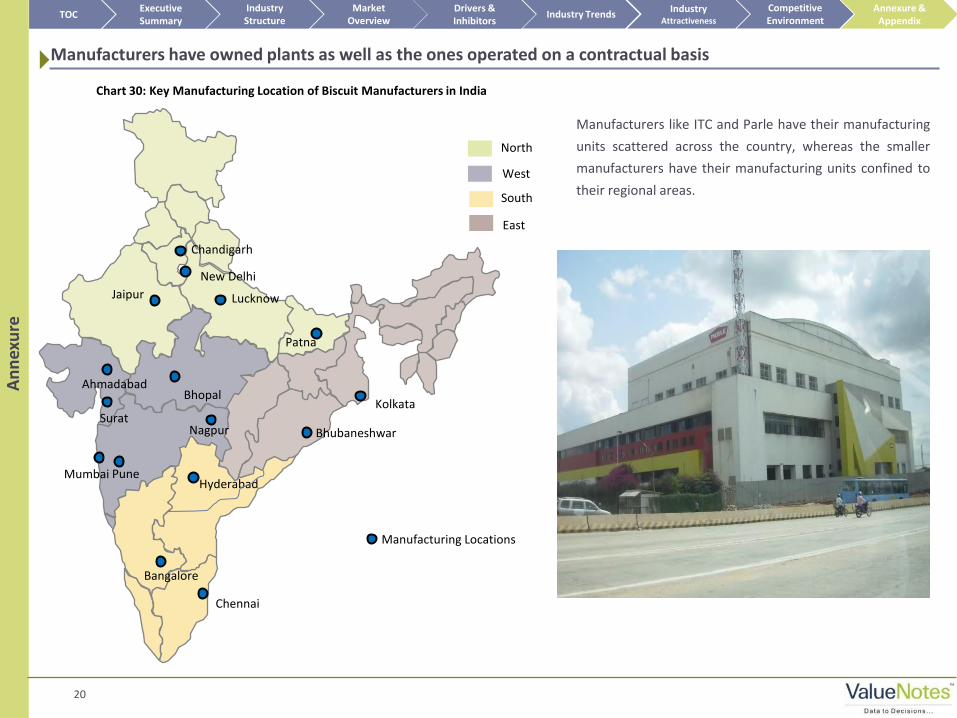
Manufacturers have owned plants as well as the ones operated on a contractual basis
Chart 30: Key Manufacturing Location of Biscuit Manufacturers in India
An
nex
ure
TOC
Market Overview
Annexure & Appendix
Industry Trends Competitive Environment
Industry Structure
Executive Summary
Drivers & Inhibitors
Industry Attractiveness
20
Manufacturing Locations
Manufacturers like ITC and Parle have their manufacturing
units scattered across the country, whereas the smaller
manufacturers have their manufacturing units confined to
their regional areas. West
North
South
East
Mumbai Pune Hyderabad
Bangalore
Jaipur
New Delhi
Kolkata
Chennai
Ahmadabad
Lucknow
Nagpur
Patna
Surat
Bhopal
Chandigarh
Bhubaneshwar

Copyright @ 2015 ValueNotes Database Pvt. Ltd. All rights reserved 21
An
nex
ure
Up till mid 2014, prices of wheat, vegetable oil, ghee and sugar were increasing on an average by ~20-22% each year. Increasing input cost had
resulted in increasing operating costs of manufacturers. This had left the biscuit manufacturers with very thin margins
However, the scenario seems to be changing in the last 1-2 quarter. The key input prices - wheat and sugar were flat, while palm oil declined y-o-
y during the quarter. This has resulted to increased profitability of the biscuit manufacturers
Chart 31: Price Index of Wheat Flour, Sugar, and Butter in Last Few Quarters (INR) Base Year: FY 11-12=100
Source: Company annual report, ValueNotes research
TOC Market
Overview Annexure &
Appendix Industry Trends
Competitive Environment
Industry Structure
Executive Summary
Drivers & Inhibitors
Industry Attractiveness
Raw material prices for comprises more than 50% of retail price of biscuits and cookies
100
121
133 128
135 135
116 114 111
104
93
108 118
116
110
FY 11-12 FY 12-13 FY 13-14 Q1 14-15 Q2 14-15 Q3 14-15
Flour Sugar Butter
Appendix
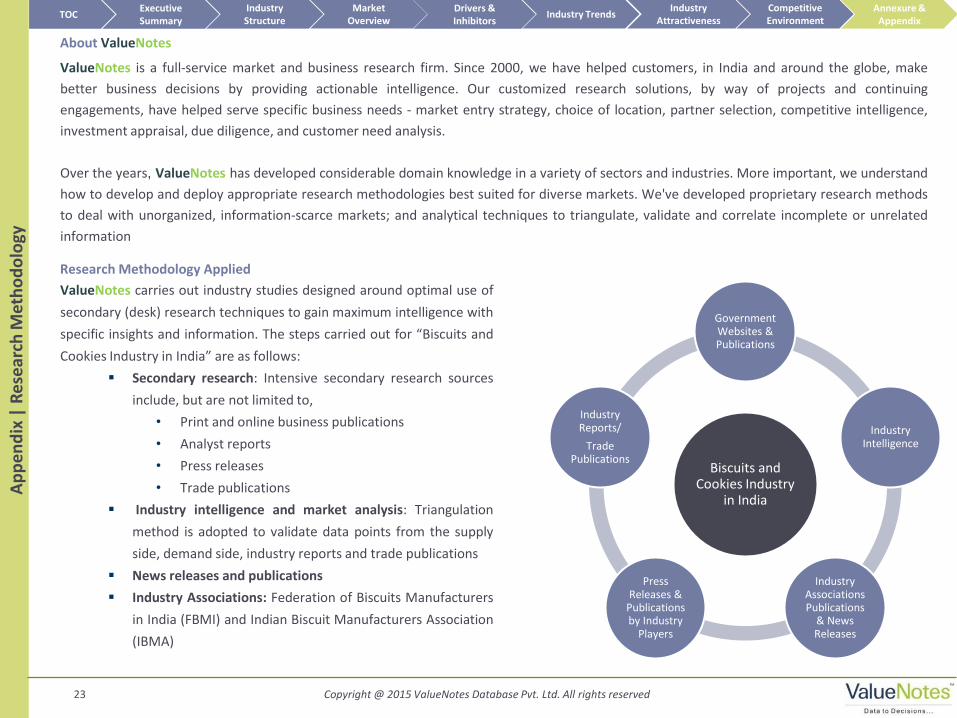
ValueNotes is a full-service market and business research firm. Since 2000, we have helped customers, in India and around the globe, make
better business decisions by providing actionable intelligence. Our customized research solutions, by way of projects and continuing
engagements, have helped serve specific business needs - market entry strategy, choice of location, partner selection, competitive intelligence,
investment appraisal, due diligence, and customer need analysis.
Over the years, ValueNotes has developed considerable domain knowledge in a variety of sectors and industries. More important, we understand
how to develop and deploy appropriate research methodologies best suited for diverse markets. We've developed proprietary research methods
to deal with unorganized, information-scarce markets; and analytical techniques to triangulate, validate and correlate incomplete or unrelated
information
23 Copyright @ 2015 ValueNotes Database Pvt. Ltd. All rights reserved
Biscuits and Cookies Industry
in India
Government Websites & Publications
Industry Intelligence
Industry Associations Publications
& News Releases
Press Releases &
Publications by Industry
Players
Industry Reports/
Trade Publications
ValueNotes carries out industry studies designed around optimal use of
secondary (desk) research techniques to gain maximum intelligence with
specific insights and information. The steps carried out for “Biscuits and
Cookies Industry in India” are as follows:
Secondary research: Intensive secondary research sources
include, but are not limited to,
• Print and online business publications
• Analyst reports
• Press releases
• Trade publications
Industry intelligence and market analysis: Triangulation
method is adopted to validate data points from the supply
side, demand side, industry reports and trade publications
News releases and publications
Industry Associations: Federation of Biscuits Manufacturers
in India (FBMI) and Indian Biscuit Manufacturers Association
(IBMA)
About ValueNotes
Research Methodology Applied
Ap
pe
nd
ix |
Re
sear
ch M
eth
od
olo
gy
TOC Market
Overview Annexure &
Appendix Industry Trends
Competitive Environment
Industry Structure
Executive Summary
Drivers & Inhibitors
Industry Attractiveness
24 Copyright @ 2015 ValueNotes Database Pvt. Ltd. All rights reserved
Ap
pe
nd
ix |
Ab
bre
viat
ion
s &
Bib
liogr
aph
y
Abbreviations
USD US Dollar
INR Indian Rupee
PCI Per Capita Income
CDM Cadbury Dairy Milk
CAGR Compound Annual Growth Rate
GDP Gross Domestic Product
mn million
bn billion
cr Crore
UAE United Arab Emirates
UK United Kingdom
kg Kilogram
FY Fiscal Year
SKU Stock Keeping Unit
Sq km Square Kilometer
BOPP Biaxially Oriented Polypropylene
SSI Small Scale Industries
ITC Indian Tobacco Company
p.a. Per Annum
FMCG Fast Moving Consumer Goods
VAT Value Added Tax
CENVAT Central Value Added Tax
US United States
FBMI Federation of Biscuits Manufacturers Association
Indian Biscuit Manufacturers Association (IBMA)
Federation of Biscuits Manufacturers of India (FBMI)
FnB News
New Articles
Company annual reports and company websites
McKinsey Group Institute India Consumer Demand Model
Moneycontrol.com
Bibliography
ValueNotes conducted secondary research to obtain information on biscuits and
cookies industry in India and referred to following sources:
TOC Market
Overview Annexure &
Appendix Industry Trends
Competitive Environment
Industry Structure
Executive Summary
Drivers & Inhibitors
Industry Attractiveness

Author Profile
www.indianotes.com Indian Markets
www.sourcingnotes.com Outsourcing Intelligence
www.valuenotes.biz Research & Consulting
ValueNotes Database Pvt Ltd 1 Bhuvaneshwar Society, Abhimanshree Road Pashan, Pune 411 008, Maharashtra, India
Other Industry Reports by ValueNotes:
1. Chocolate industry in India
2. Bread industry in India
3. Heat and eat industry in India
Disclaimer: This short industry report is published for general information only. Although high standards have been used in the preparation, ValueNotes is not responsible for any loss or damage arising from use of this report. The information contained herein is from publicly available data or other sources believed to be reliable. While we would endeavor to update the information herein on reasonable basis, ValueNotes is under no obligation to update or keep the information current. This report is the sole property of ValueNotes and must not be copied, either in whole or in part, or distributed or redistributed to any other person in any form.
in case of any queries, mail us at [email protected]
[email protected] | +91 20 6623 1743
About the author:
As a senior analyst at ValueNotes, Tejaswee Shrestha has worked on opportunity assessment studies in manufacturing & engineering sector where she has been involved in the formulating recommendation and entry strategies. Her main focus of studies at ValueNotes has been customer engagement studies in various industries such as lighting and engineering industries. Her projects also include due diligence and industry tracking. She also is a regular writer for ValueNotes where she contributes actively to blogs and articles.