research report update - baystreet.ca · market capitalization $266 ... occurs between these...
TRANSCRIPT

790 New York Avenue, Huntington, N.Y. 11743
(800) 383-8464 Fax (631) 757-1333
Research Report – Update Investors should consider this report as only a single factor in making their investment decision.
Borqs Technologies, Inc. Speculative Buy
John Nobile
BRQS $8.50 — (NASDAQ) April 26, 2018
2016A 2017A 2018E 2019E
Revenues (millions) $120.6 $154.3 $200.0 $252.0
Earnings (loss) per share $0.00 $(1.52) $0.26 $0.45
52-Week range $9.80 – $7.85 Fiscal year ends: December
Common shares out as of 3/27/18 31.3 million Revenue per share (TTM) $12.01
Approximate float 5.5 million Price/Sales (TTM) 0.7X
Market capitalization $266 million Price/Sales (FY2019)E 1.1X
Tangible book value/share $(2.32) Price/Earnings (TTM) NMF
Price/tangible book value NMF Price/Earnings (FY2019)E 18.9X
Borqs Technologies, Inc., headquartered in Beijing, China, is a provider of software and products focused on the Internet of Things
(IoT) market. The company is also a mobile virtual network operator (MVNO) in China.
Key investment considerations:
We are reiterating our Speculative Buy rating on Borqs Technologies, Inc. and raising our twelve-month price
target to $12.00 per share from $8.25 based on strong sales growth through 2019.
Borqs has averaged revenue growth of nearly 50% over the past three years. We believe continued customer
acceptance of the company’s products in the fast growing IoT market should enable strong growth through our
forecast horizon. GrowthEnabler projects 28.5% CAGR to $457 billion in 2020 from $157 billion in 2016.
Borqs was able to continue growing its MVNO sales despite the effect of tightened security measures for SIM card
activations in China in 2017. We project continued growth in MVNO revenues through 2019.
For 2018, we project revenue growth of 29.6% to $200 million and EPS of $0.26, up from our prior revenue
forecast of $182.2 million and a loss of $(0.02) per share. Our increased projections reflect continued market
acceptance of BRQS’ hardware and software products and growth in MVNO sales.
For 2019, we project revenue growth of 26% to $252 million and EPS of $0.45. Growth should be driven by
continued market acceptance of BRQS’ hardware and software products and growth in MVNO sales.
On April 2, 2018, Borqs reported 2017 revenue increased 28% to $154.3 million. The net loss widened to $19.5
million or $(1.52) per share from breakeven. We projected revenue of $149 million and a loss of $21.9 million or
$(1.60) per share.
*Please view our disclosures on pages 15 - 17.

Borqs Technologies, Inc.
Taglich Brothers, Inc.
2
Recommendation and Valuation
Reiterating Speculative Buy rating and raising our twelve-month price target to $12.00 per share from
$8.25 based on our strong sales growth forecast through 2019.
Our rating reflects our projected 28% compound annual growth rate (CAGR) of the company’s revenue to $252
million in 2019 from $154.4 million in 2017. Borqs is successfully penetrating the IoT market as customer
acceptance of the company’s products (such as mobile phones, tablets, and wearables) continues. Borqs was able
to continue growing its MVNO sales despite the effect of tightened security measures for SIM card activations in
China in 2017. We project continued growth in MVNO revenues through 2019.
Shares of BRQS currently trade at a multiple of 0.7X trailing twelve month (TTM) sales. The industry (software)
trades at an average TTM multiple of 2.7X sales. Investors should accord BRQS’s a multiple approaching that of
the industry based on our forecasted growth to 2019. Applying a multiple of 1.5X to our FY19 sales per share
projection of $8.05, we derive a year-ahead value of approximately $12.00 per share. Our twelve-month price
target implies a year-ahead return of over 40%.
We believe shares of BRQS are suitable for risk tolerant investors looking to make an investment in the fast
growing IoT market. Investors are cautioned that with a substantial portion of Borqs’ operations conducted in
China, the company is subject to economic, political and legal developments in China which could adversely
affect the company’s business.
Organizational History
Borqs Technologies, Inc. (formerly known as Pacific Special Acquisition Corp.) was incorporated in the British
Virgin Islands on July 1, 2015 for the purpose of acquiring, merging with, or engaging in a business combination
with one or more businesses or entities.
On August 18, 2017, the company acquired a 100% equity interest in Borqs International Holding Corp.
Concurrent with the completion of the acquisition, the company changed its name from Pacific Special
Acquisition Corp. to Borqs Technologies, Inc.
Business
Borqs Technologies, headquartered in Beijing, China, is a provider of software and products focused on the
Internet of Things (IoT) market. Internet of Things refers to the network of objects (such as security systems,
thermostats, cars, electronic appliances, and lights in household and commercial environments) that feature
internet connectivity and the communication that occurs between these objects and other Internet-enabled devices
and systems.
The company is also a mobile virtual network operator (MVNO) in China. An MVNO is a wireless
communications services provider that does not own the wireless network infrastructure over which it provides
services to its customers. An MVNO enters into a business agreement with a mobile network operator to obtain
bulk access to network services at wholesale rates, then sets retail prices independently.
The company’s operations include two business units, connected solutions and MVNO. The connected solutions
unit develops wireless smart connected devices (hardware) and cloud solutions (software). The MVNO unit
operates a mobile virtual network in China that provides a full range of 2G/3G/4G mobile communication
services for consumers.

Borqs Technologies, Inc.
Taglich Brothers, Inc.
3
Source: Borqs Presentation
Connected Solutions – Borqs’ connected
solutions unit designs chipsets and related
software for mobile connected devices.
The company outsources manufacturing
of connected devices to third-party
factories, buying key components for
devices and consigning them to the
factories to manufacture and assemble.
Borqs sells the final products to its
customers (select direct customers can be
seen in table at right), which are
responsible for marketing and retail
distribution.
The company developed the Android
software platform and hardware platform
for Intel and Qualcomm phones and
tablets. In February 2016, Qualcomm
announced its planned business expansion
for its next generation Qualcomm®
Snapdragon™ Wear platform with the
addition of new ecosystem partners
(including Borqs). The platform is targeted for next generation connected and tethered wearables, such as
smartwatches, watches for children and elderly individuals, smart bands, smart eyewear, and smart headsets.
The company’s connected solutions platform is built on Google’s Android software. Android is an open source
operating system for mobile devices such as smartphones and tablet computers, and was first released to the
public by Google in late 2008. Borqs, which was among the first to obtain the Android source code, built a
technology platform used in the first deployment of Android-based mobile devices to support a network for China
Mobile.
Borqs provides customers with customized, integrated, commercial grade Android platform software and service
solutions through its BorqsWare software platform consisting of client and server software. The client software
platform offers commercial grade Android software that works with selective mobile chipsets, functionality
enhancements of open source Android software, and mobile operator required services. Customers may require
the company to provide further software customization to meet their specific market needs. Borqs’ client
software has been used in Android phones, tablets, watches and various Internet-of-Things (IoT) devices.
Borqs’ server platform consists of back-end server software that allows customers to develop their own mobile
end-to-end services for their devices. Customers may require the company to provide further customization of its
server software to meet their specific needs.
As of December 2017, the company has collaborated with six mobile chipset manufacturers and 29 mobile device
OEMs to commercially launch Android based connected devices in 11 countries. Connected devices embedded
with the BorqsWare software platform are in more than 12 million units worldwide.
Borqs’ connected solutions unit generated approximately 79% of the company’s revenue in 2017.
In January 2018, Borqs announced it signed an agreement to acquire 13.8% of both Shenzhen Crave
Communication Co., Ltd (Crave) and its affiliated business entity in Hong Kong, Colmei Technology
International Ltd (Colmei). Crave is a manufacturer of mobile terminal devices and Colmei is a sales entity
located in Hong Kong. In 2017, Borqs contracted Crave/Colmei for multiple projects in the manufacturing of
Borqs’ products. Terms call for payment of 3 million of BRQS shares and $10 million in cash to be paid over 3
years for total consideration of $13 million.

Borqs Technologies, Inc.
Taglich Brothers, Inc.
4
Borqs investments in Colmei and Crave should help provide it with access to acceptable financing terms,
competitive component pricing, and prioritized production capacity.
In January 2018, Borqs entered into a letter of intent to acquire 60% of Shanghai KADI Machinery Technology
Co., Ltd (KADI), a developer of embedded software and hardware for electric control modules in electric
vehicles. The consideration proposed to be paid by Borqs includes $11.7 million in cash and shares worth $3.3
million. Borqs is likely to raise equity capital to complete this acquisition.
KADI was awarded a $48.5 million supply contract for its core electric control modules from a key automotive
contractor in China, Shenzhen Espirit Technology Co., Ltd. The products are to be delivered between 2018
through 2020.
MVNO – This unit provides a full range of 2G/3G/4G voice and data services for general consumer usage and IoT
devices, as well as traditional telecom services such as voice conferencing. The MVNO unit also acts as a sales
and promotion channel for the products developed by the connected solutions unit. Borqs’ MVNO unit had
nearly 5.4 million subscribers in China as of December 31, 2017.
Borqs’ MVNO unit generated approximately 21% of the company’s revenue in 2017.
End-to-End Business Model
Borqs’ connected solutions unit aids customers in the design, development and commercialization of their
connected devices. The company’s MVNO unit helps customers deploy their devices in China with 2G/3G/4G
cellular connectivity and a flexible voice/data plan. Borqs’ business model helps to satisfy specific customer
requirements through five key offerings that include ideation and design, software IP development, product
realization, deployment, and cloud services and support. Following is a brief description of these offerings.
Source: Borqs' Annual Report
Ideation & Design — Based on customer requirements, Borqs helps design the product ID and user interface.
The company offers design engineering for 2D/3D rendering and can provide a physical mockup with different
color, material and finishes, so the customer can hold and feel the product before it is manufactured.
Software IP Development — IoT devices are often highly customized and require special software to display the
data (i.e. watch display and user interface), reduce power consumption (i.e. a small battery in a wearable device),
perform specific functions (i.e. push-to-talk), and to connect to the network. Borqs has developed a large number
of software libraries that can be reused for various connected devices.
Borqs Technologies, Inc.
Taglich Brothers, Inc.
5
Product Realization — Borqs’ research and development team helps customers design hardware. The company
also provides services to help customers handle manufacturing logistics.
Deployment — A number of connected devices require cellular connectivity to connect to the network to access
backend cloud services. If a customer intends to deploy their connected devices in China, the customer can
acquire SIM cards with flexible voice/data plans from Borqs’ MVNO for cellular connectivity.
Cloud Services and Support — Borqs’ MVNO can help customers manage their subscribers database, handle the
payment and re-charging, as well as provide data analytics of the subscribers usage traffic models.
IoT Market
IoT is broadly classified into nine segments, five for businesses and four for individuals. Business use consists of
industrial IoT, retail, smart utilities and energy, healthcare, and smart cities. Individual use consists of connected
homes, wearables, cars, and personal health. In a report on the IoT market, the research firm GrowthEnabler
broke the IoT market into two distinct groups – businesses and individuals.
Businesses consider investing in IoT to reduce business continuity risk through predictive analytics that optimize
operational performance, reduce costs, and consequently increase profits and customer impact. Other benefits
include higher workforce productivity and new product development opportunities. End-customers (individuals)
increasingly use IoT to save time, money and heighten personal convenience by using smart home automation,
and rely on health tracking devices to enhance well-being and lifestyle. Adoption is set to grow as machine
sensors in smartphones, wearable devices, and other smart devices become more prevalent and affordable.
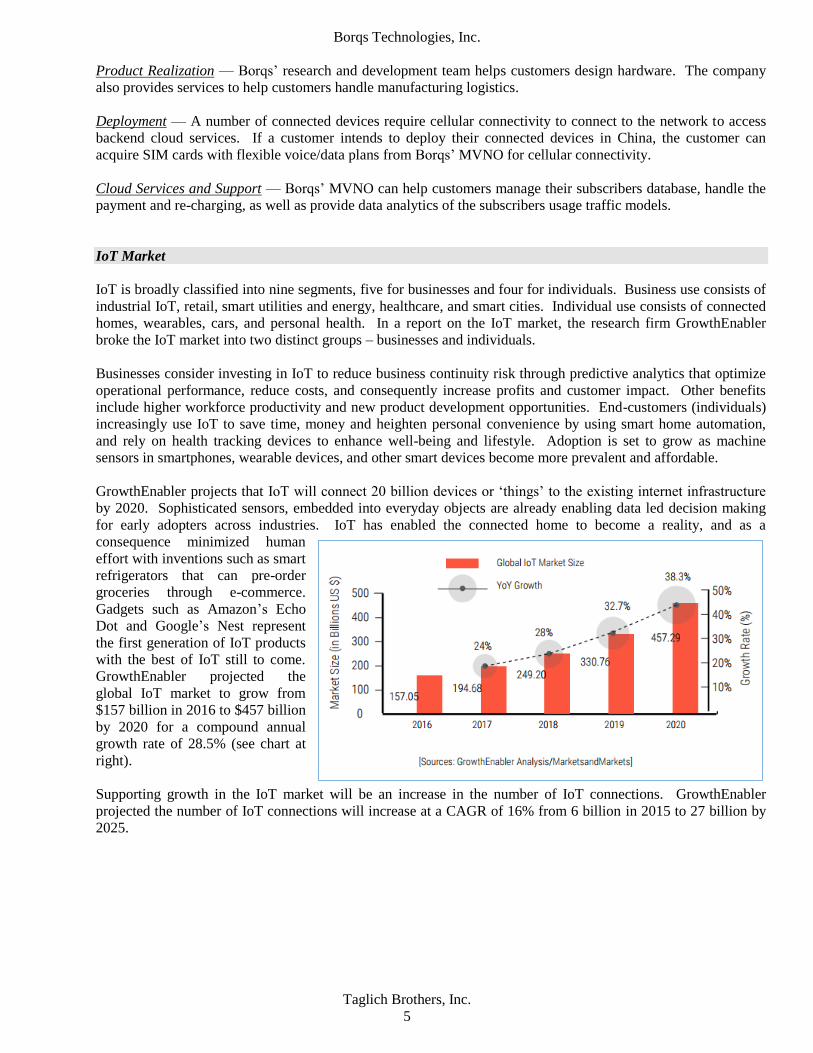
GrowthEnabler projects that IoT will connect 20 billion devices or ‘things’ to the existing internet infrastructure
by 2020. Sophisticated sensors, embedded into everyday objects are already enabling data led decision making
for early adopters across industries. IoT has enabled the connected home to become a reality, and as a
consequence minimized human
effort with inventions such as smart
refrigerators that can pre-order
groceries through e-commerce.
Gadgets such as Amazon’s Echo
Dot and Google’s Nest represent
the first generation of IoT products
with the best of IoT still to come.
GrowthEnabler projected the
global IoT market to grow from
$157 billion in 2016 to $457 billion
by 2020 for a compound annual
growth rate of 28.5% (see chart at
right).
Supporting growth in the IoT market will be an increase in the number of IoT connections. GrowthEnabler
projected the number of IoT connections will increase at a CAGR of 16% from 6 billion in 2015 to 27 billion by
2025.
Borqs Technologies, Inc.
Taglich Brothers, Inc.
6
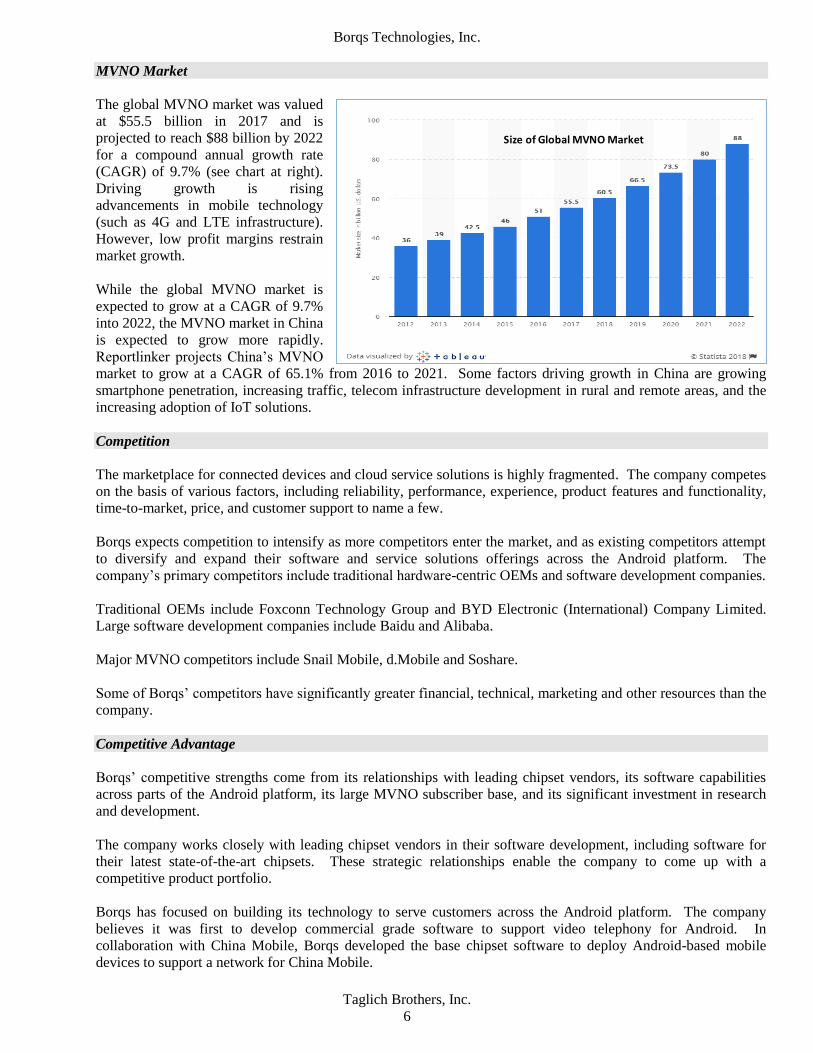
Size of Global MVNO Market
MVNO Market
The global MVNO market was valued
at $55.5 billion in 2017 and is
projected to reach $88 billion by 2022
for a compound annual growth rate
(CAGR) of 9.7% (see chart at right).
Driving growth is rising
advancements in mobile technology
(such as 4G and LTE infrastructure).
However, low profit margins restrain
market growth.
While the global MVNO market is
expected to grow at a CAGR of 9.7%
into 2022, the MVNO market in China
is expected to grow more rapidly.
Reportlinker projects China’s MVNO
market to grow at a CAGR of 65.1% from 2016 to 2021. Some factors driving growth in China are growing
smartphone penetration, increasing traffic, telecom infrastructure development in rural and remote areas, and the
increasing adoption of IoT solutions.
Competition
The marketplace for connected devices and cloud service solutions is highly fragmented. The company competes
on the basis of various factors, including reliability, performance, experience, product features and functionality,
time-to-market, price, and customer support to name a few.
Borqs expects competition to intensify as more competitors enter the market, and as existing competitors attempt
to diversify and expand their software and service solutions offerings across the Android platform. The
company’s primary competitors include traditional hardware-centric OEMs and software development companies.
Traditional OEMs include Foxconn Technology Group and BYD Electronic (International) Company Limited.
Large software development companies include Baidu and Alibaba.
Major MVNO competitors include Snail Mobile, d.Mobile and Soshare.
Some of Borqs’ competitors have significantly greater financial, technical, marketing and other resources than the
company.
Competitive Advantage
Borqs’ competitive strengths come from its relationships with leading chipset vendors, its software capabilities
across parts of the Android platform, its large MVNO subscriber base, and its significant investment in research
and development.
The company works closely with leading chipset vendors in their software development, including software for
their latest state-of-the-art chipsets. These strategic relationships enable the company to come up with a
competitive product portfolio.
Borqs has focused on building its technology to serve customers across the Android platform. The company
believes it was first to develop commercial grade software to support video telephony for Android. In
collaboration with China Mobile, Borqs developed the base chipset software to deploy Android-based mobile
devices to support a network for China Mobile.

Borqs Technologies, Inc.
Taglich Brothers, Inc.
7
Strategy
The company’s strategic goal is to lead and expand the market for smart connected devices, and to increase its
MVNO market share in China. Borqs plans to achieve its goal by adhering to the following key strategies:
Maintain and grow market share and technology leadership – Borqs intends to leverage its core technology to
maintain its position as an independent provider of commercial grade Android platform software for mobile
chipset manufacturers, mobile device OEMs, and mobile operators. The company also intends to grow market
share by expanding its software and service platform solutions. Borqs intends to hire additional experienced
engineers in China and India and further invest in research and development efforts to strengthen its core
technology expertise and capabilities.
Deepen relationships with existing customers – While Borqs believes that its relationships with existing
customers are strong, it intends to further strengthen those relationships in order to create more business
opportunities. Through collaborations with customers from the early stages of a product launch, the company
intends to gain insight into its customers’ long-term goals.
Expand its MVNO market share in China – Based on publically available data from China, the company is
believed to be one of the top MVNO businesses in China, as measured in terms of registered subscribers. Borqs
intends to expand its market share organically or by acquiring smaller MVNOs, as well as bundling its connected
products with its SIM cards (with voice/data plans) and focus the bundling on IoT devices.
Selectively pursue acquisitions, strategic alliances, joint ventures and partnerships – Borqs will continue to
pursue acquisition opportunities, strategic alliances, joint ventures and partnerships to complement its core
technology, further its geographic expansion, and grow its business.
2017 Financial Results
Revenue increased 28% to $154.3 million. The net loss widened to $19.5 million or $(1.52) per share from
breakeven. Included in the net loss for 2017 was the subtraction of $210,000 or $0.02 per share attributable to
noncontrolling interests and a loss of $7 million or $(0.54) per share related to the accretion to redemption value
of convertible preferred shares. Included in the net loss for 2016 was the addition of $632,000 or $0.15 per share
attributable to noncontrolling interests, a loss of $976,000 or $(0.23) per share related to the accretion to
redemption value of convertible preferred shares, and a loss of $2.3 million or $(0.53) per share related to the
allocation to holders of convertible preferred shares. Excluding these items, the net loss was $12.4 million or
$(0.96) per share in 2017 versus net income of $2.6 million or $0.61 per share in 2016.
Connected Solutions revenue (includes hardware and software revenue) increased 43% to $122.2 million while
MVNO revenue (includes MVNO and other revenue) decreased 8.7% to $32.1 million.
Hardware revenue increased 57.4% to $111 million while software revenue decreased 24.8% to $11.2 million.
The increase in hardware revenue reflects an increase in orders of tablets, ruggedized handsets, high speed data
smartphones, and home entertainment remote controls. The decrease in software revenue primarily reflects an
overall decline in software engineering project sales.
MVNO revenue (excludes traditional telephony activities) increased 2.7% to $30.1 million while other revenue
decreased 66.4% to $2 million.
Gross profit increased 8% to $27.2 million. Gross margins decreased to 17.6% from 21.8%. Connected Solutions
gross margins decreased to 15.3% from 24% while MVNO gross margins increased to 26.3% from 13.2%. The
decrease in Connected Solutions gross margins were due to a higher volume of lower margin hardware sales. The
increase in MVNO gross margins was due to improved economies of scale and the removal of a stringent
minimum charge from China Unicom, Borqs’ incumbent operator.

Borqs Technologies, Inc.
Taglich Brothers, Inc.
8
Operating expenses increased to $35.3 million from $21.7 million. General and administrative expenses
increased to $20.8 million from $10 million. Selling and marketing expenses increased to $8 million from $5.9
million. R&D expenses increased to $6.4 million from $5.7 million.
The company paid $2.3 million or 52% in income tax versus $2.7 million or 51% in 2016. Borqs’ tax rates have
been higher than statutory rates because losses experienced by certain subsidiaries could not be used to offset
gains in other subsidiaries within the same jurisdiction.
Liquidity – As of December 31, 2017, Borqs had $16.5 million cash of which $3.5 million is restricted, a current
ratio of 1.3, a debt to equity ratio of 0.4, and 32% of assets were financed by equity.
Cash used in operations in 2017 was $14.9 million consisting of $9.6 million cash earnings and a $24.5 million
increase in working capital. The increase in working capital was primarily due to an increase in receivables offset
in part by an increase in prepaid expenses.
The bulk of cash used in investing consisted primarily of $7.7 million purchases of intangible assets related to
capitalized software development costs. Cash provided by financing of $31.9 million consisted primarily of $18
million cash received from merger and $9 million proceeds from the issuance of convertible preferred shares.
While the company had no long-term bank debt as of December 31, 2017, it had $18.1 million of current bank
debt with interest rates ranging from 6.73% to 7.97%.
Economic Outlook
In April 2018, the IMF kept its global economic growth estimate at 3.9% for both 2018 and 2019, unchanged
from January 2018. The growth estimates reflect strong momentum, favorable market sentiment, accommodative
financial conditions, and the domestic and international repercussions of expansionary fiscal policy in the US.
The IMF raised its economic growth estimate for the US to 2.9% in 2018 and 2.7% in 2019, up from its earlier
(January 2018) growth forecast of 2.7% for 2018 and 2.5% for 2019. The upward revision reflects stronger than
expected US economic activity in 2017, firmer external demand, and the expected economic impact from 2018
tax policy changes, in particular the reduction in corporate tax rates and the temporary allowance for full
expensing of investments.
The third estimate of US GDP growth (released on March 28, 2018) showed the US economy grew at an annual
rate of 2.9% in 4Q17, down from 3.2% growth in 3Q17. The 4Q17 US GDP growth estimate primarily reflects
increases in consumer spending, business investment, exports, housing investment, and government spending.
These contributions were partly offset by declines in private inventory investment.
The IMF kept its economic growth estimate for China at 6.6% in 2018 and 6.4% in 2019, unchanged from
January 2018. The IMF projects China’s economy to continue rebalancing away from investment toward private
consumption.
Projections
Our estimates will not include contribution from the pending 60% acquisition of KADI until it is completed.
2018 – We project revenue growth of 29.6% to $200 million and net income of $8.2 million or $0.26 per share.
We previously projected revenue of $182.2 million and a net loss of $543,000 or $(0.02) per share. The increase
in our projections is due to continued market acceptance of BRQS’ hardware and software products in the
growing IoT market and growth in MVNO sales.
We project a $24.6 million increase in gross profit to $51.8 million from $27.2 million and gross margins
increasing to 25.9% from 17.6% due primarily to increased manufacturing overhead coverage.

Borqs Technologies, Inc.
Taglich Brothers, Inc.
9
Sales and marketing expenses should increase $2 million to $10 million from $8 million. We project a $1.2
million increase in general and administrative expenses to $22 million due primarily to increased compensation
costs. R&D expenses are projected to increase $1.2 million to $8 million from $6.4 million due primarily to
increased hardware and software development projects.
Interest expense should decrease to $1.4 million from $1.9 million due to lower average debt levels. We project
the company paying $3 million in taxes for a 26.7% tax rate.
We project cash earnings of $30.6 million and a $12.2 million increase in working capital for $18.4 million cash
provided by operations. The increase in working capital should come primarily from an increase in receivables
and inventories offset in part by an increase in payables and accrued expenses. We project $800,000 of capital
expenditures. Cash used in financing activities of $16.1 million reflect debt repayments. We project a $1.5
million increase in cash to $14.5 million at December 31, 2018.
2019 – We project revenue growth of 26% to $252 million and net income of $14 million or $0.45 per share.
Growth should be driven by continued market acceptance of BRQS’ hardware and software products in the
growing IoT market and growth in MVNO sales.
We project a $16.5 million increase in gross profit to $68.3 million from $51.8 million and gross margins
increasing to 27.1% from 25.9% due primarily to increased manufacturing overhead coverage.
Sales and marketing expenses should increase $2.6 million to $12.6 million. We project a $5.7 million increase in
general and administrative expenses to $27.7 million due primarily to increased compensation costs. R&D
expenses are projected to increase $2.1 million to $10.1 million due primarily to increased hardware and software
development projects.
We anticipate interest expense decreasing to $300,000 from $1.4 million due to lower average debt levels. We
project the company paying $4.5 million in taxes for a 24.5% tax rate.
We project cash earnings of $34.8 million and a $10.2 million increase in working capital for $24.6 million cash
provided by operations. The increase in working capital should come primarily from an increase in receivables
and inventories offset in part by an increase in payables and accrued expenses. We project $800,000 of capital
expenditures. We project a $23.8 million increase in cash to $38.3 million at December 31, 2019.
Risks
In our view, these are the principal risks underlying the stock.
High concentration of business in China – A substantial portion of Borqs’ operations are conducted in China, and
a significant portion of revenues are derived from customers where the contracting entity is located in China.
Accordingly, the company’s business, financial condition, results of operations, prospects and certain transactions
are subject to economic, political and legal developments in China.
China’s social and political conditions may not be as stable as those of the US and other developed countries.
Any sudden changes to China’s political system or the occurrence of widespread social unrest could have a
material adverse effect on Borqs’ business and results of operations.
Uncertainty regarding MVNO license in China – The company’s license to operate its mobile communications
services as a mobile virtual network operator in China is based on a government issued extension of a trial license
that was originally set to expire on December 31, 2015. If Borqs cannot obtain a renewed license, or the current
extension is terminated, the company would need to cease its MVNO operation.

Borqs Technologies, Inc.
Taglich Brothers, Inc.
10
Limited number of major customers – Borqs has derived a significant portion of its revenue from a small number
of major customers and key projects. For 2016 and 2017, the company’s top five customers accounted for 51.5%
and 69.3%, respectively, of revenue. Any loss of business from these customers or key projects could reduce
Borqs’ revenue and significantly harm its business.
Competition – The mobile operating system industry is intensely competitive and characterized by rapid
technological changes, which often result in shifts in market share among the industry’s participants as one
operating system may become more widely used than others. There can be no assurance that the Android
platform will continue to compete effectively with alternative mobile operating system platforms, such as Apple’s
iOS platform or Windows mobile operating system from Microsoft.
Material weakness of internal controls over financial reporting – In the course of preparing its consolidated
financial statements, Borqs has identified material weaknesses, significant deficiencies and other deficiencies in
its internal control over financial reporting. The company is currently in the process of implementing remedial
steps to improve its internal control over financial reporting. If Borqs fails to timely achieve and maintain the
adequacy of its internal controls, investors could lost confidence in the reliability of its financial statements.
Exchange rate risk - Approximately half of Borqs’ revenues and costs are denominated in the Renminbi (RMB).
Any significant revaluation of RMB may materially and adversely affect the company’s cash flows, revenues,
earnings and financial position. For example, an appreciation of RMB against the US dollar would make new
RMB denominated investments or expenditures more costly to the company. Conversely, a significant
depreciation of the RMB against the US dollar may significantly reduce the US dollar equivalent of the
company’s earnings.
Liquidity risk - Shares of Borqs Technologies have risks common to those of the microcap segment of the market.
Often these risks cause microcap stocks to trade at discounts to their peers. The most common of these risks is
liquidity risk, which is typically caused by small trading floats and very low trading volume and can lead to large
spreads and high volatility in stock price. There are 5.5 million shares in the float and the average daily volume is
approximately 3,000 shares.
Miscellaneous risk - The company's financial results and equity values are subject to other risks and uncertainties
including competition, operations, financial markets, regulatory risk, and/or other events. These risks may cause
actual results to differ from expected results.
Borqs Technologies, Inc.
Taglich Brothers, Inc.
11
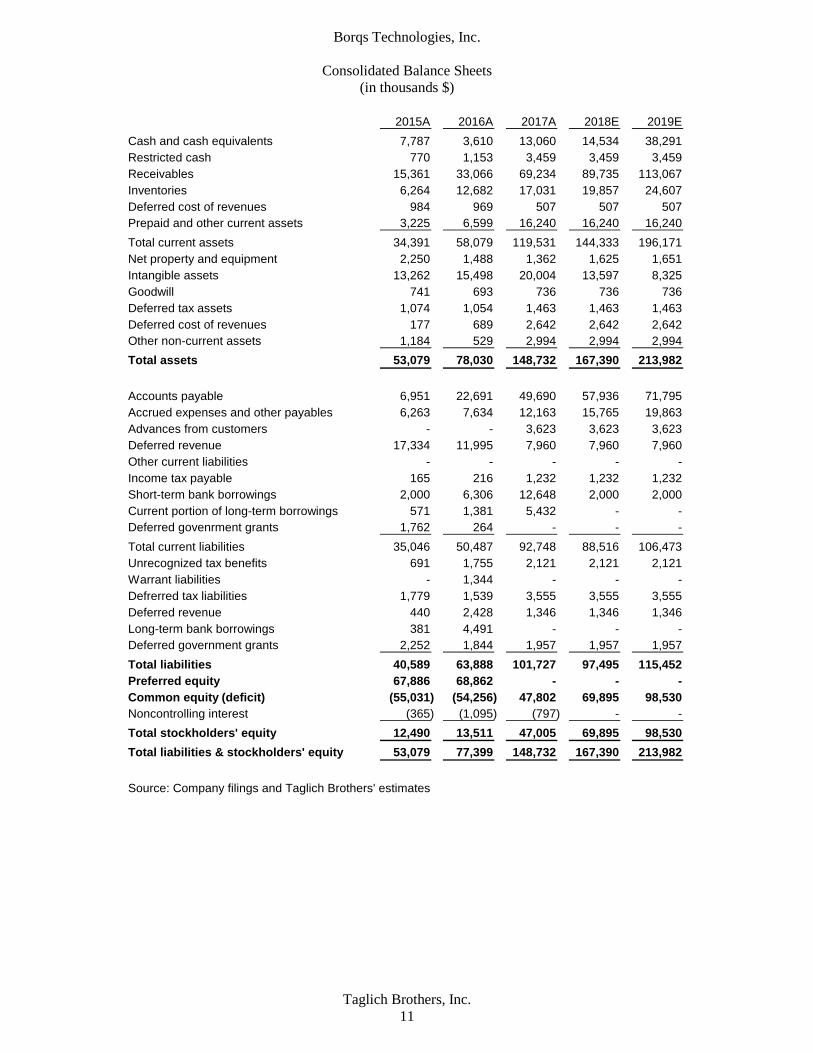
Consolidated Balance Sheets
(in thousands $)
2015A 2016A 2017A 2018E 2019E
Cash and cash equivalents 7,787 3,610 13,060 14,534 38,291
Restricted cash 770 1,153 3,459 3,459 3,459
Receivables 15,361 33,066 69,234 89,735 113,067
Inventories 6,264 12,682 17,031 19,857 24,607
Deferred cost of revenues 984 969 507 507 507
Prepaid and other current assets 3,225 6,599 16,240 16,240 16,240
Total current assets 34,391 58,079 119,531 144,333 196,171
Net property and equipment 2,250 1,488 1,362 1,625 1,651
Intangible assets 13,262 15,498 20,004 13,597 8,325
Goodwill 741 693 736 736 736
Deferred tax assets 1,074 1,054 1,463 1,463 1,463
Deferred cost of revenues 177 689 2,642 2,642 2,642
Other non-current assets 1,184 529 2,994 2,994 2,994
Total assets 53,079 78,030 148,732 167,390 213,982
Accounts payable 6,951 22,691 49,690 57,936 71,795
Accrued expenses and other payables 6,263 7,634 12,163 15,765 19,863
Advances from customers - - 3,623 3,623 3,623
Deferred revenue 17,334 11,995 7,960 7,960 7,960
Other current liabilities - - - - -
Income tax payable 165 216 1,232 1,232 1,232
Short-term bank borrowings 2,000 6,306 12,648 2,000 2,000
Current portion of long-term borrowings 571 1,381 5,432 - -
Deferred govenrment grants 1,762 264 - - -
Total current liabilities 35,046 50,487 92,748 88,516 106,473
Unrecognized tax benefits 691 1,755 2,121 2,121 2,121
Warrant liabilities - 1,344 - - -
Defrerred tax liabilities 1,779 1,539 3,555 3,555 3,555
Deferred revenue 440 2,428 1,346 1,346 1,346
Long-term bank borrowings 381 4,491 - - -
Deferred government grants 2,252 1,844 1,957 1,957 1,957
Total liabilities 40,589 63,888 101,727 97,495 115,452
Preferred equity 67,886 68,862 - - -
Common equity (deficit) (55,031) (54,256) 47,802 69,895 98,530
Noncontrolling interest (365) (1,095) (797) - -
Total stockholders' equity 12,490 13,511 47,005 69,895 98,530
Total liabilities & stockholders' equity 53,079 77,399 148,732 167,390 213,982
Source: Company filings and Taglich Brothers' estimates

Borqs Technologies, Inc.
Taglich Brothers, Inc.
12
Income Statements for the Fiscal Years Ended
(in thousands $)
2015A 2016A 2017A 2018E 2019E
Software 22,468 14,912 11,212 14,000 18,000
Hardware 32,647 70,536 111,021 142,000 182,000
MVNO 16,007 29,309 30,118 42,000 50,000
Other 3,950 5,829 1,956 2,000 2,000
Net revenues 75,072 120,586 154,307 200,000 252,000
Software (12,660) (6,347) (7,247) (8,120) (10,440)
Hardware (26,101) (57,452) (96,247) (110,760) (141,960)
MVNO (16,225) (28,784) (22,836) (28,560) (30,500)
Other (2,980) (1,709) (811) (800) (800)
(Cost) of revenues (57,966) (94,292) (127,141) (148,240) (183,700)
Gross profit 17,106 26,294 27,166 51,760 68,300
Operating income/(expense)
Sales and marketing (7,359) (5,874) (7,952) (10,000) (12,600)
General and administrative (4,883) (10,042) (20,753) (22,000) (27,720)
Research and development (7,245) (6,886) (6,443) (8,000) (10,080)
Change in fair value of warrant liabilites - (12) (200) - -
Other operating income 3,094 1,760 272 360 360
Operating income (loss) 713 5,240 (7,910) 12,120 18,260
Interest income 61 65 14 16 16
Interest expense (156) (797) (1,877) (1,440) (300)
Other income 208 114 633 640 640
Other expense (35) (59) (121) (120) (120)
Foreign exchange (loss) gain 855 692 (779) - -
Income before taxes 1,646 5,255 (10,040) 11,216 18,496
Income tax (851) (2,659) (2,319) (2,993) (4,528)
Net income (loss) 795 2,596 (12,359) 8,223 13,968
Noncontrolling interests (1,316) (632) 210 - -
Net income / (loss) 2,111 3,228 (12,569) 8,223 13,968
Accretion / allocation of conv. pref. stock (2,417) (3,228) (6,956) - -
Net income (loss) to common stock (306) - (19,525) 8,223 13,968
EPS (0.04) - (1.52) 0.26 0.45
Shares Outstanding 7,176 7,177 12,843 31,300 31,300
Margin Analysis
Gross margin 22.8% 21.8% 17.6% 25.9% 27.1%
Sales and marketing 9.8% 4.9% 5.2% 5.0% 5.0%
General and administrative 6.5% 8.3% 13.4% 11.0% 11.0%
Research and development 9.7% 5.7% 4.2% 4.0% 4.0%
Operating margin 0.9% 4.3% (5.1)% 6.1% 7.2%
Net margin (0.4)% 0.0% (12.7)% 4.1% 5.5%
Tax rate 51.7% 50.6% (23.1)% 26.7% 24.5%
Year / Year Growth
Total Revenues 58.1% 60.6% 28.0% 29.6% 26.0%
Source: Company filings and Taglich Brothers' estimates

Borqs Technologies, Inc.
Taglich Brothers, Inc.
13
3/18E 6/18E 9/18E 12/18E 2018E 3/19E 6/19E 9/19E 12/19E 2019E
Software 3,200 3,400 3,600 3,800 14,000 4,000 4,250 4,750 5,000 18,000
Hardware 32,500 34,500 36,500 38,500 142,000 41,000 44,000 47,000 50,000 182,000
MVNO 9,750 10,250 10,750 11,250 42,000 11,750 12,250 12,750 13,250 50,000
Other 500 500 500 500 2,000 500 500 500 500 2,000
Net revenues 45,950 48,650 51,350 54,050 200,000 57,250 61,000 65,000 68,750 252,000
Software (1,856) (1,972) (2,088) (2,204) (8,120) (2,320) (2,465) (2,755) (2,900) (10,440)
Hardware (25,350) (26,910) (28,470) (30,030) (110,760) (31,980) (34,320) (36,660) (39,000) (141,960)
MVNO (6,630) (6,970) (7,310) (7,650) (28,560) (7,168) (7,473) (7,778) (8,083) (30,500)
Other (200) (200) (200) (200) (800) (200) (200) (200) (200) (800)
(Cost) of revenues (34,036) (36,052) (38,068) (40,084) (148,240) (41,668) (44,458) (47,393) (50,183) (183,700)
Gross profit 11,914 12,598 13,282 13,966 51,760 15,583 16,543 17,608 18,568 68,300
Operating income/(expense)
Sales and marketing (2,298) (2,433) (2,568) (2,703) (10,000) (2,863) (3,050) (3,250) (3,438) (12,600)
General and administrative (5,055) (5,352) (5,649) (5,946) (22,000) (6,298) (6,710) (7,150) (7,563) (27,720)
Research and development (1,838) (1,946) (2,054) (2,162) (8,000) (2,290) (2,440) (2,600) (2,750) (10,080)
Change in fair value of warrant liabilites - - - - - - - - - -
Other operating income 90 90 90 90 360 90 90 90 90 360
Operating income (loss) 2,814 2,958 3,102 3,246 12,120 4,223 4,433 4,698 4,908 18,260
Interest income 4 4 4 4 16 4 4 4 4 16
Interest expense (540) (420) (300) (180) (1,440) (75) (75) (75) (75) (300)
Other income 160 160 160 160 640 160 160 160 160 640
Other expense (30) (30) (30) (30) (120) (30) (30) (30) (30) (120)
Foreign exchange (loss) gain - - - - - - - - - -
Income before taxes 2,408 2,672 2,936 3,200 11,216 4,282 4,492 4,757 4,967 18,496
Income tax (674) (723) (773) (823) (2,993) (1,026) (1,092) (1,172) (1,238) (4,528)
Net income (loss) 1,734 1,949 2,163 2,377 8,223 3,256 3,400 3,585 3,729 13,968
Noncontrolling interests - - - - - - - - - -
Net income / (loss) 1,734 1,949 2,163 2,377 8,223 3,256 3,400 3,585 3,729 13,968
Accretion of convertible preferred stock - - - - - - - - - -
Net income (loss) to common stock 1,734 1,949 2,163 2,377 8,223 3,256 3,400 3,585 3,729 13,968
EPS 0.06 0.06 0.07 0.08 0.26 0.10 0.11 0.11 0.12 0.45
Shares Outstanding 31,300 31,300 31,300 31,300 31,300 31,300 31,300 31,300 31,300 31,300
Margin Analysis
Gross margin 25.9% 25.9% 25.9% 25.8% 25.9% 27.2% 27.1% 27.1% 27.0% 27.1%
Sales and marketing 5.0% 5.0% 5.0% 5.0% 5.0% 5.0% 5.0% 5.0% 5.0% 5.0%
General and administrative 11.0% 11.0% 11.0% 11.0% 11.0% 11.0% 11.0% 11.0% 11.0% 11.0%
Research and development 4.0% 4.0% 4.0% 4.0% 4.0% 4.0% 4.0% 4.0% 4.0% 4.0%
Operating margin 6.1% 6.1% 6.0% 6.0% 6.1% 7.4% 7.3% 7.2% 7.1% 7.2%
Net margin 3.8% 4.0% 4.2% 4.4% 4.1% 5.7% 5.6% 5.5% 5.4% 5.5%
Tax rate 28.0% 27.1% 26.3% 25.7% 26.7% 24.0% 24.3% 24.6% 24.9% 24.5%
Year / Year Growth
Total Revenues 29.6% 26.0%
Source: Company filings and Taglich Brothers' estimates
Quarterly Income Statements 2018E - 2019E
(in thousands $)

Borqs Technologies, Inc.
Taglich Brothers, Inc.
14
Statement of Cash Flows for the Periods Ended
(in thousands $)
2015A 2016A 2017A 2018E 2019E
Net income (loss) 795 2,596 (12,359) 8,223 13,968
Foreign exchange (gain) loss (855) (692) 779 - -
Loss (gain) on disposal of property and equipment (350) 1 - - -
Depreciation 1,371 1,011 744 761 774
Amortization 1,109 2,146 3,935 6,407 5,272
Deferred income taxes (benefits) (1,044) (220) 937 - -
Interest expense - 352 661 504 105
Share-based compensation - - 14,667 14,667 14,667
Changes in fair value of warrant liabilities - 12 200 - -
Cash earnings 1,026 5,206 9,564 30,562 34,786
Changes in assets and liabilities
Restricted cash 211 (383) (2,306) - -
Receivables (2,331) (17,705) (36,168) (20,501) (23,331)
Inventories (4,074) (6,418) (4,349) (2,826) (4,750)
Deferred cost of revenues 2,469 (497) (1,491) - -
Prepaid expenses and other current assets 579 (3,175) (12,140) (728) (105)
Accounts payable (742) 15,740 26,999 8,246 13,859
Accrued expenses and other 2,100 1,371 5,215 3,602 4,099
Unrecognized tax benefits 645 1,064 366 - -
Advances from customers - - 3,623 - -
Deferred revenue 4,888 (3,351) (5,117) - -
Income tax payable 165 682 1,016 - -
Deferred government grants (3,302) (1,906) (151) - -
Other assets - - - - -
(Increase) decrease in working capital 608 (14,578) (24,503) (12,208) (10,229)
Net cash provided by (used in) operations 1,634 (9,372) (14,939) 18,354 24,557
Purchases of property and equipment (798) (494) (842) (800) (800)
Purchases of intangible assets (5,175) (5,230) (7,650) - -
Proceeds from disposal of property and equipment 14 1 1 - -
Loan to a third party (1,482) - - - -
Repayments of third party loan 75 457 371 - -
Net cash used in investing (7,366) (5,266) (8,120) (800) (800)
Proceeds from issuance of stock - - 62 - -
Cash received from merger - - 18,034 - -
Proceeds from issuance of convertible preferred stock - - 9,000 - -
Proceeds from exercise of warrants - - 8 - -
Issuance costs for convertible preferred stock - - (312) - -
Proceeds from short-term bank borrowings - 6,776 10,456 - -
Repayments of short-term bank borrowings (817) (2,000) (4,756) (10,648) -
Proceeds from long-term bank borrowings 999 6,000 2,000 - -
Repayments of long-term bank borrowings (47) (571) (2,631) (5,432) -
Net cash provided by (used in) financing 135 10,205 31,861 (16,080) -
Effect of foreign exchange rate changes (34) 256 648 - -
Net change in cash (5,631) (4,177) 9,450 1,474 23,757
Cash - beginning of period 13,418 7,787 3,610 13,060 14,534
Cash - end of period 7,787 3,610 13,060 14,534 38,291
Source: Company filings and Taglich Brothers' estimates

Borqs Technologies, Inc.
Taglich Brothers, Inc.
15
Price Chart
Taglich Brothers’ Current Ratings Distribution
Investment Banking Services for Companies Covered in the Past 12 Months
Rating # %
Buy 3 12Hold
Sell
Not Rated

Borqs Technologies, Inc.
Taglich Brothers, Inc.
16
Important Disclosures
As of the date of this report, we, our affiliates, any officer, director or stockholder, or any member of
their families do not have a position in the stock of the company mentioned in this report. Taglich
Brothers, Inc. does not currently have an Investment Banking relationship with the company mentioned
in this report and was not a manager or co-manager of any offering for the company within the last three
years.
All research issued by Taglich Brothers, Inc. is based on public information. The company paid a
monetary fee of $4,500 (USD) in November 2017 for the creation and dissemination of research reports
for the first three months. After the first three months from initial publication, the company will pay a
monthly monetary fee of $1,500 (USD) to Taglich Brothers, Inc., for a minimum of six months for the
creation and dissemination of research reports.
General Disclosures
The information and statistical data contained herein have been obtained from sources, which we believe
to be reliable but in no way are warranted by us as to accuracy or completeness. We do not undertake to
advise you as to changes in figures or our views. This is not a solicitation of any order to buy or sell.
Taglich Brothers, Inc. is fully disclosed with its clearing firm, Pershing, LLC, is not a market maker and
does not sell to or buy from customers on a principal basis. The above statement is the opinion of
Taglich Brothers, Inc. and is not a guarantee that the target price for the stock will be met or that
predicted business results for the company will occur. There may be instances when fundamental,
technical and quantitative opinions contained in this report are not in concert. We, our affiliates, any
officer, director or stockholder or any member of their families may from time to time purchase or sell
any of the above-mentioned or related securities. Analysts and members of the Research Department are
prohibited from buying or selling securities issued by the companies that Taglich Brothers, Inc. has a
research relationship with, except if ownership of such securities was prior to the start of such
relationship, then an Analyst or member of the Research Department may sell such securities after
obtaining expressed written permission from Compliance.
Analyst Certification
I, John Nobile, the research analyst of this report, hereby certify that the views expressed in this report
accurately reflect my personal views about the subject securities and issuers; and that no part of my
compensation was, is, or will be, directly, or indirectly, related to the specific recommendations or views
contained in this report.
Public companies mentioned in this report:
Amazon (NASDAQ: AMZN)
China Mobile (NYSE: CHL)
Google (NASDAQ: GOOG)
Intel (NASDAQ: INTC)
Qualcomm (NASDAQ: QCOM)
Wipro (NYSE: WIT)

Borqs Technologies, Inc.
Taglich Brothers, Inc.
17
Meaning of Ratings
Buy – The growth prospects, degree of investment risk, and valuation make the stock attractive relative to the
general market or comparable stocks.
Speculative Buy – Long term prospects of the company are promising but investment risk is significantly higher
than it is in our BUY-rated stocks. Risk-reward considerations justify purchase mainly by high risk-tolerant
accounts. In the short run, the stock may be subject to high volatility and could continue to trade at a discount to
its market.
Neutral – Based on our outlook the stock is adequately valued. If investment risks are within acceptable
parameters, this equity could remain a holding if already owned.
Sell – Based on our outlook the stock is significantly overvalued. A weak company or sector outlook and a high
degree of investment risk make it likely that the stock will underperform relative to the general market.
Dropping Coverage – Research coverage discontinued due to the acquisition of the company, termination of
research services, non-payment for such services, diminished investor interest, or departure of the analyst.
Some notable Risks within the Microcap Market
Stocks in the Microcap segment of the market have many risks that are not as prevalent in Large-cap, Blue
Chips or even Small-cap stocks. Often it is these risks that cause Microcap stocks to trade at discounts to
their peers. The most common of these risks is liquidity risk, which is typically caused by small trading
floats and very low trading volume which can lead to large spreads and high volatility in stock price. In
addition, Microcaps tend to have significant company specific risks that contribute to lower valuations.
Investors need to be aware of the higher probability of financial default and higher degree of financial
distress inherent in the microcap segment of the market.
From time to time our analysts may choose to withhold or suspend a rating on a company. We continue to publish
informational reports on such companies; however, they have no ratings or price targets. In general, we will not
rate any company that has too much business or financial uncertainty for our analysts to form an investment
conclusion, or that is currently in the process of being acquired.